

What is the 'second candle trap'?
This is a situation where the price breaks through a level (for example, resistance). The first candle gives an upward impulse - traders start preparing longs. The second candle consolidates above the level - seemingly the 'perfect signal' to enter. The crowd enters the trade, placing stops below the level. The market sharply reverses and takes out all the stops.
The essence… the second candle creates the illusion of reliable closure, but in fact, this is a trap for the crowd.
Why this is visible on the MYX chart
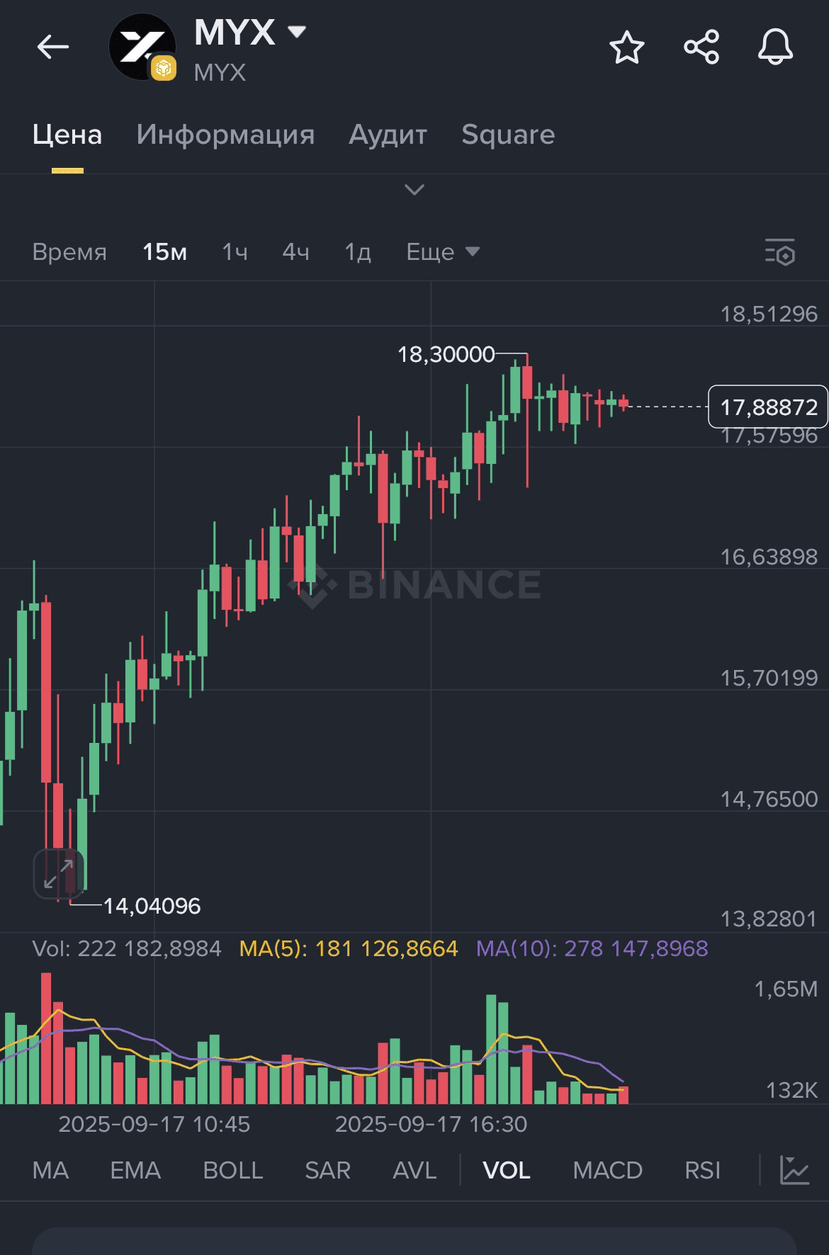
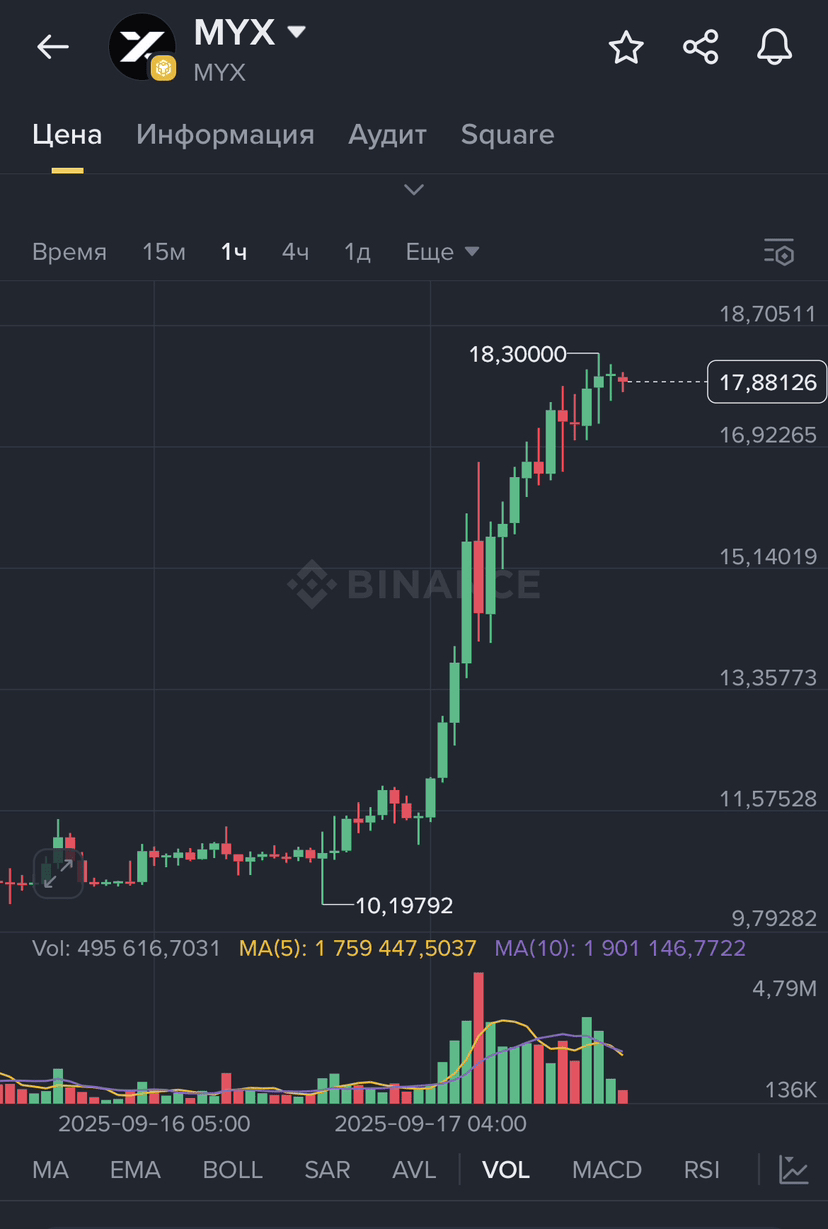
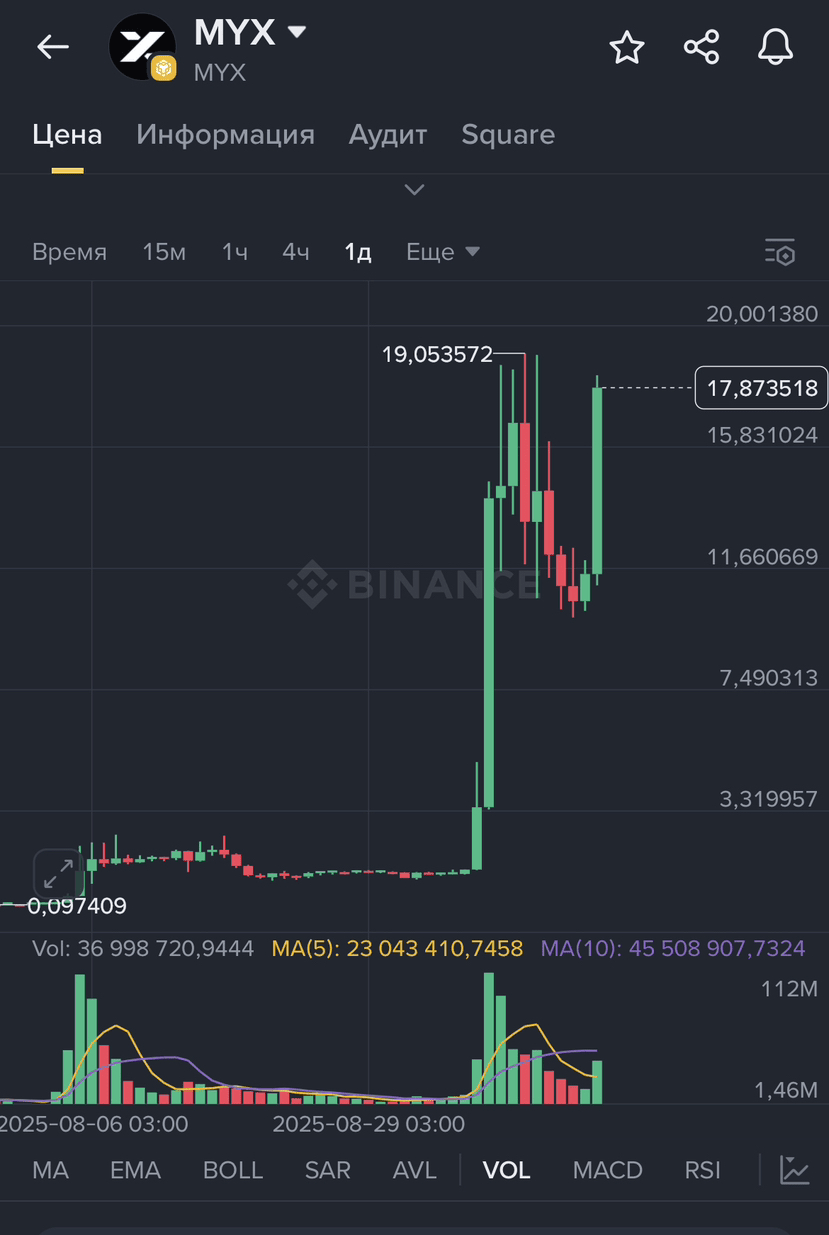
On 1h/15m, the breakout of the zone 18.30 is visible.
The first candle — impulse with volume.
The second candle has settled above - it seems that the trend will continue.
But then the market sharply goes into correction to ~17.8.
That is, the second candle became the entry point for the crowd, and the market maker turned the price down.
Why this particular timeframe (1h / 15m)
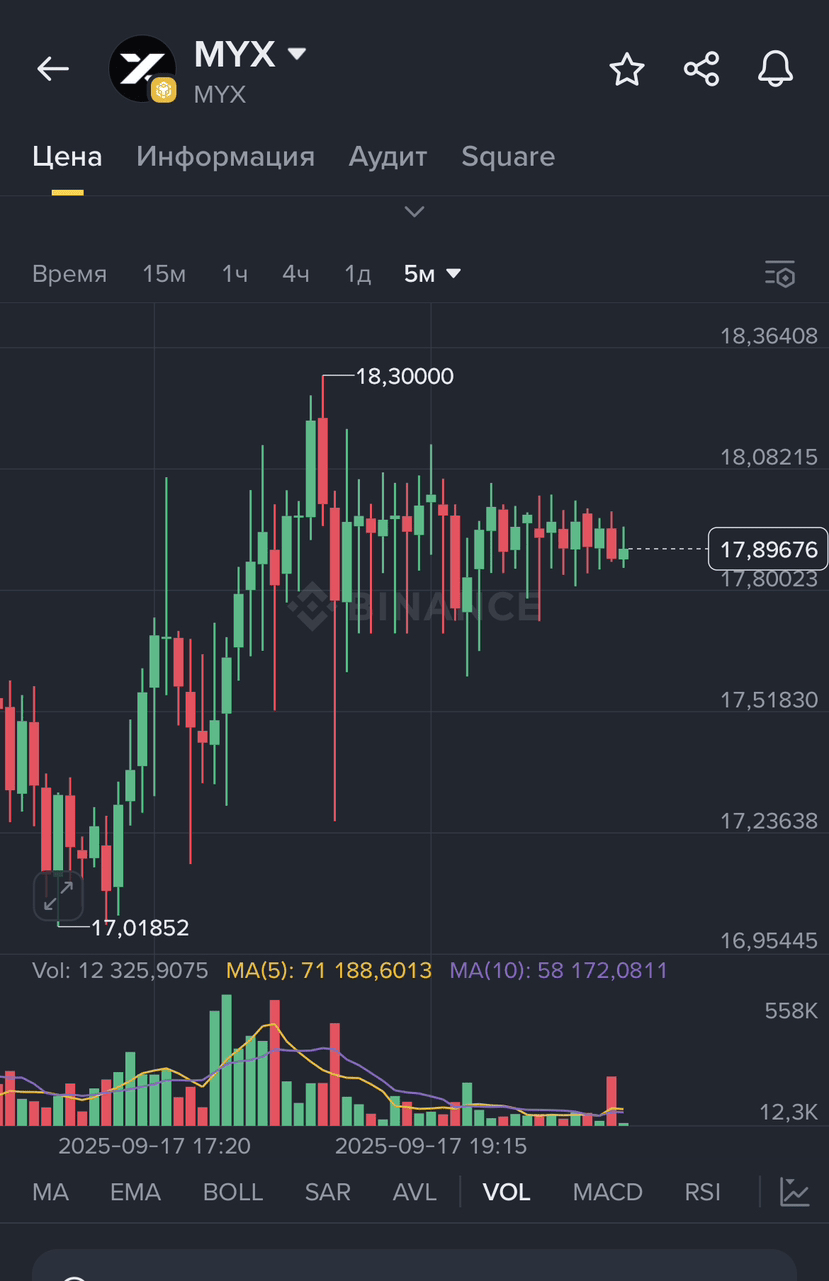
5m gives too much noise, traps occur often there, but they are 'small'.
1h / 15m — optimal: you can see the volume, the level reaction, and the psychology of the crowd.
On 1d such traps also occur, but less frequently and with larger stops.
Why specifically volume (VOL) as an indicator
When breaking, volume increased sharply → this is the crowd's entry.
After the close, volume decreases → there is no interest in continuing the movement.
This is a classic sign of manipulation: first they raise on volume, then they throw the price.
Example of a trade
Condition: deposit $500.
Spot:
Entry on the second candle ~18.2.
Stop below the level ~17.5.
Risk: $0.7 per coin.
If we take $500, we get ~27 coins.
Potential loss = $0.7 × 27 ≈ $18.9 (3.7% of the account).
Futures (x10):
Entry at the same price (18.2).
Stop 17.5 (difference $0.7).
Leverage x10 = position $5000, volume ~275 coins.
Loss = $0.7 × 275 ≈ $192.5 (almost -40% of the account for one trade).
As a result, the risk on the spot is controlled, while on futures, the trap of the second candle can simply destroy the deposit.
Psychology
The trader sees 'ideal closure'.
Enters a trade (often with leverage).
Places the stop immediately below the level → this is 'fuel' for the market maker.
The price sharply returns, stops are triggered, the trader incurs a loss.
A large player gathers liquidity and moves the price in their direction.
The trap of the second candle is not a technical mistake of the trader, but a psychological trap: the market creates the picture of 'reliable breakout' to gather liquidity.
The main rule… do not enter immediately on the second candle's close, wait for a retest of the level, check the volume (it should confirm the movement, not fade).
P.S. In the analysis of 'the trap of the second candle', I focused specifically on 15m and 1h, because they most clearly show the mechanics of the breakout and closure.
But other timeframes are also included for a reason — each has its own role: 5m - shows more noise and small movements. We see that on such a timeframe, traps arise often, but they do not provide a reliable signal. This helps explain why beginners often get caught.
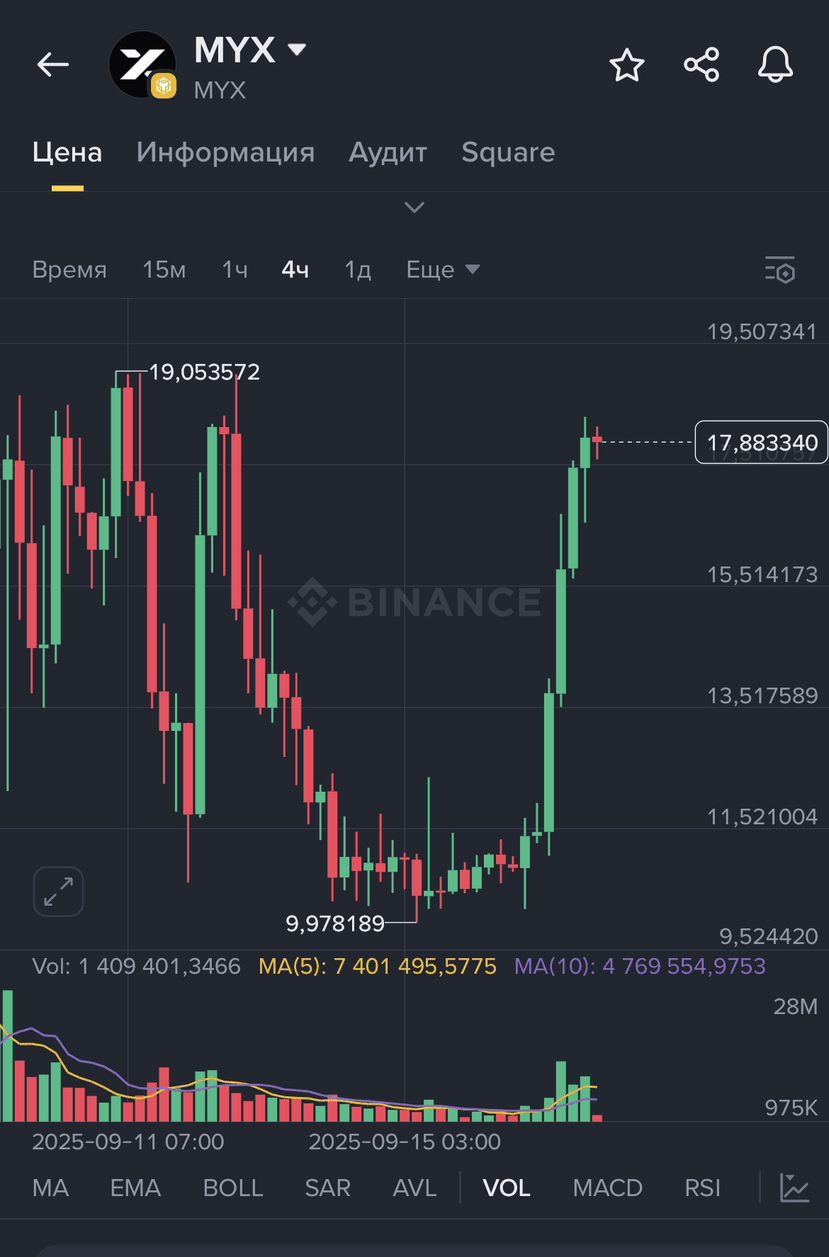
4h - demonstrates the overall background and confirms that the movement on lower timeframes is not random, but embedded in a broader trend. Here it is visible that the 'trap of the second candle' is embedded in the overall market structure.
1d - shows the global context. On the daily, it is visible that after a strong impulse, the market may 'hunt for liquidity' on smaller timeframes. This helps connect local manipulation with the overall picture. Thus, different timeframes in the article serve more of an educational function... smaller (5m) show traps in 'noises', medium (15m–1h) reveal the very mechanics, larger (4h–1d) provide strategic context.


#Write2Earn #Binance #ALPHA🔥 #BinanceSquareFamily #BinanceSquareTalks