

612 Ceros
30k Posts

612 Ceros
 Square Verified+
Report
Block User
📊 Crypto strategist | Market signals daily | Trade smart, not emotional. Find me on X: @612Ceros
Open Trade

BNB Holder
High-Frequency Trader
5.1 Years
57 Following
180.2K+ Followers
229.7K+ Liked
Posts
Portfolio
All
Quotes
Live
·
--
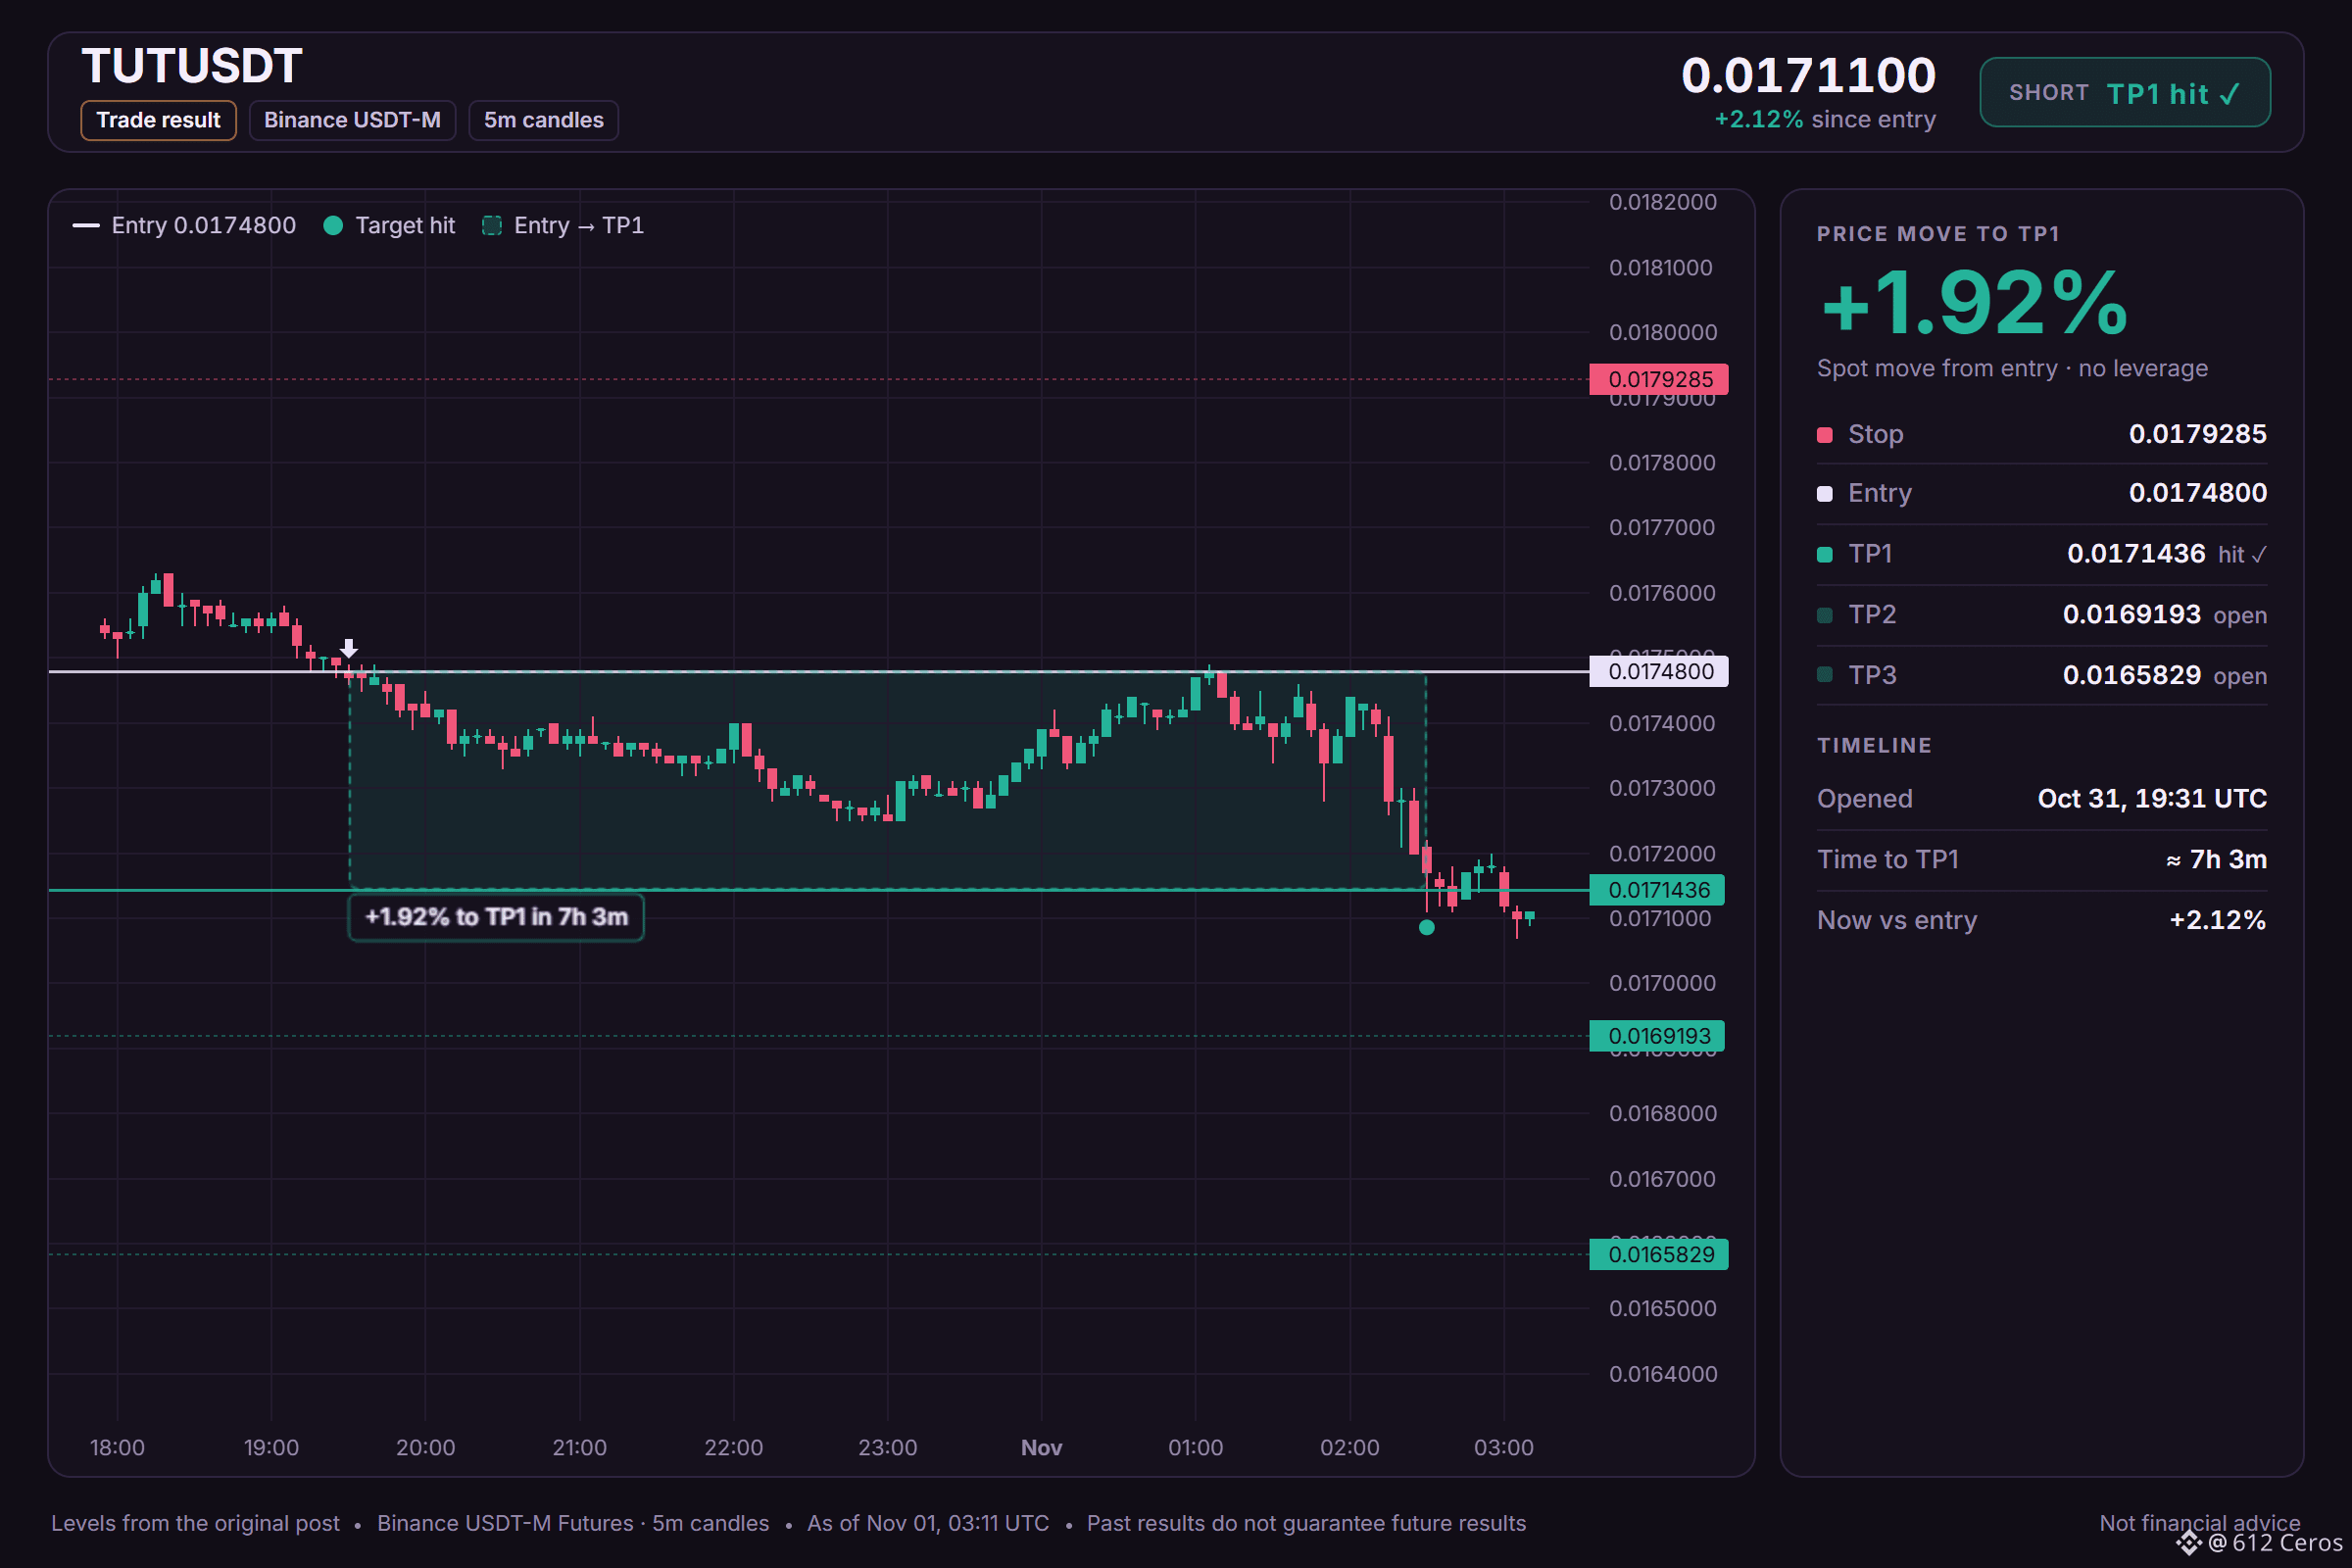
Short setup on TUTUSDT hit TP1. Spot price moved +1.92% from entry in about 7h 3m. Trade complete 🎯📈. Always manage your risk and size positions accordingly.
Short setup on TUTUSDT hit TP1. Spot price moved +1.92% from entry in about 7h 3m. Trade complete 🎯📈. Always manage your risk and size positions accordingly.
612 Ceros
·
--
BearishIs the 4h stack about to push TUT lower again?
🔴 SHORT $TUT /USDT: expecting price to go DOWN
Bias: SHORT · Strong
Entry: 0.0174629 – 0.0174971
TP1: 0.0171436 (-1.9%)
TP2: 0.0169193 (-3.2%)
TP3: 0.0165829 (-5.1%)
SL: 0.0179285 (+2.6%)
Plan: enter only inside the zone, close 50% at TP1, 25% at TP2, 25% at TP3, and move the stop to entry after TP1.
Why SHORT? TUT checklist: 6/12 agree, 0 against.
• 4h trend down (below EMA50 & EMA200)
• 1h trend down (below EMA50 & EMA200)
• Sellers have the momentum (4h RSI 42.5)
Watch: The idea is wrong if price reaches the stop at 0.0179285
Net read: The 4h bearish stack and the 1h bearish stack show the trend is down, but the daily trend is range-bound so the bigger picture is not clear.
Do you see the daily range holding or breaking?
Chart with every level below.
📲 Want more of my latest signals? Join me here:
https://app.binance.com/uni-qr/D26WbL9t
⚠️ Personal market analysis only. NFA — manage risk and DYOR.
Educational content, not investment advice or a recommendation to buy, sell, deposit, or withdraw any asset. No paid promotion or referral/affiliate links.
217
·
--
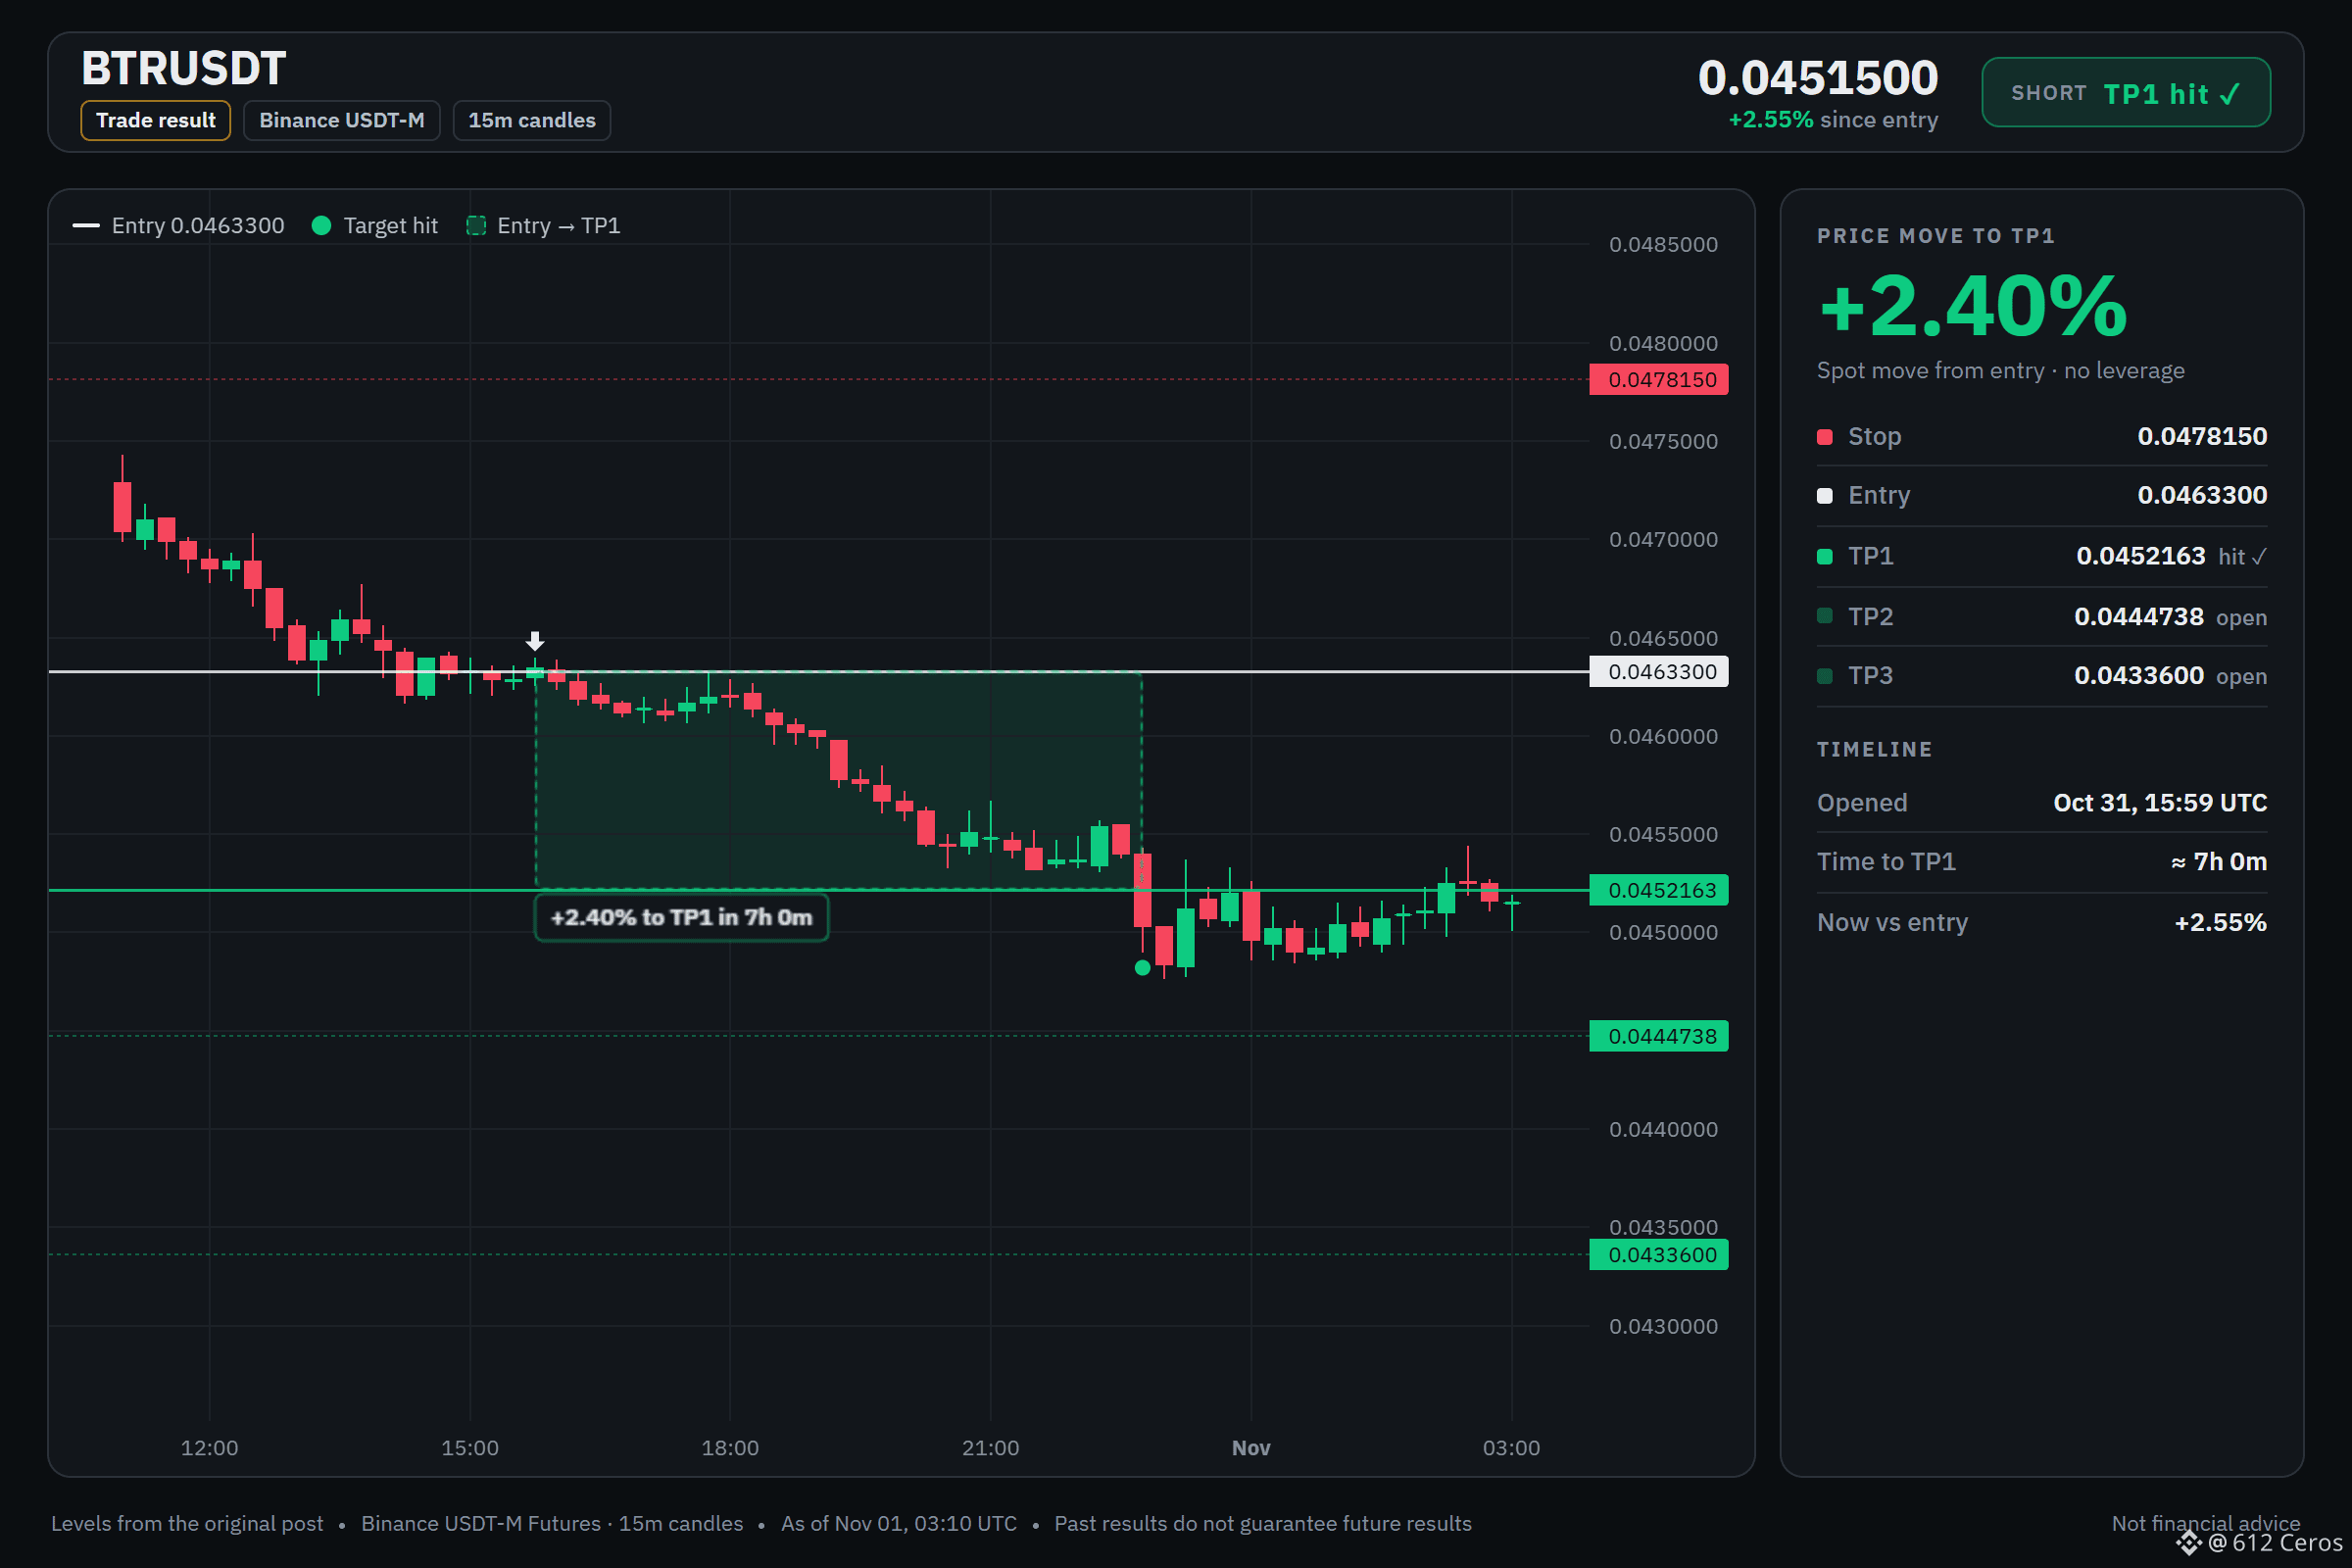
Short setup on BTRUSDT hit TP1 📉📈 Spot move +2.40% in about 7 hours. Trade managed. Always manage your risk and size positions responsibly.
Short setup on BTRUSDT hit TP1 📉📈 Spot move +2.40% in about 7 hours. Trade managed. Always manage your risk and size positions responsibly.
612 Ceros
·
--
BearishBTR short setup: the levels I'm watching
🔴 SHORT $BTR /USDT: expecting price to go DOWN
Bias: SHORT · Strong
Entry: 0.0462713 – 0.0463887
TP1: 0.0452163 (-2.4%)
TP2: 0.0444738 (-4.0%)
TP3: 0.0433600 (-6.4%)
SL: 0.0478150 (+3.2%)
Plan: enter only inside the zone, close 50% at TP1, 25% at TP2, 25% at TP3, and move the stop to entry after TP1.
Why SHORT? 6/12 signals agree, 1 against.
• Daily trend down (below EMA50 & EMA200)
• 1h trend down (below EMA50 & EMA200)
• Sellers are driving the move (15m ADX 20.0)
Risk: Range bottom, buyers often step in (RSI z −2.27)
The reasoning:
The daily trend reads bearish, and 6/12 signals aligned favour the short side. The plan is to work the 0.0462713 – 0.0463887 zone, scale out at 0.0452163 and 0.0444738, and stay patient for 0.0433600. A move through 0.0478150 means the idea is wrong and the stop does its job.
Does BTR tag 0.0452163 first, or the stop?
Chart with every level below.
📲 Want more of my latest signals? Join me here:
https://app.binance.com/uni-qr/D26WbL9t
⚠️ Personal market analysis only. NFA — manage risk and DYOR.
Educational content, not investment advice or a recommendation to buy, sell, deposit, or withdraw any asset. No paid promotion or referral/affiliate links.
190
·
--
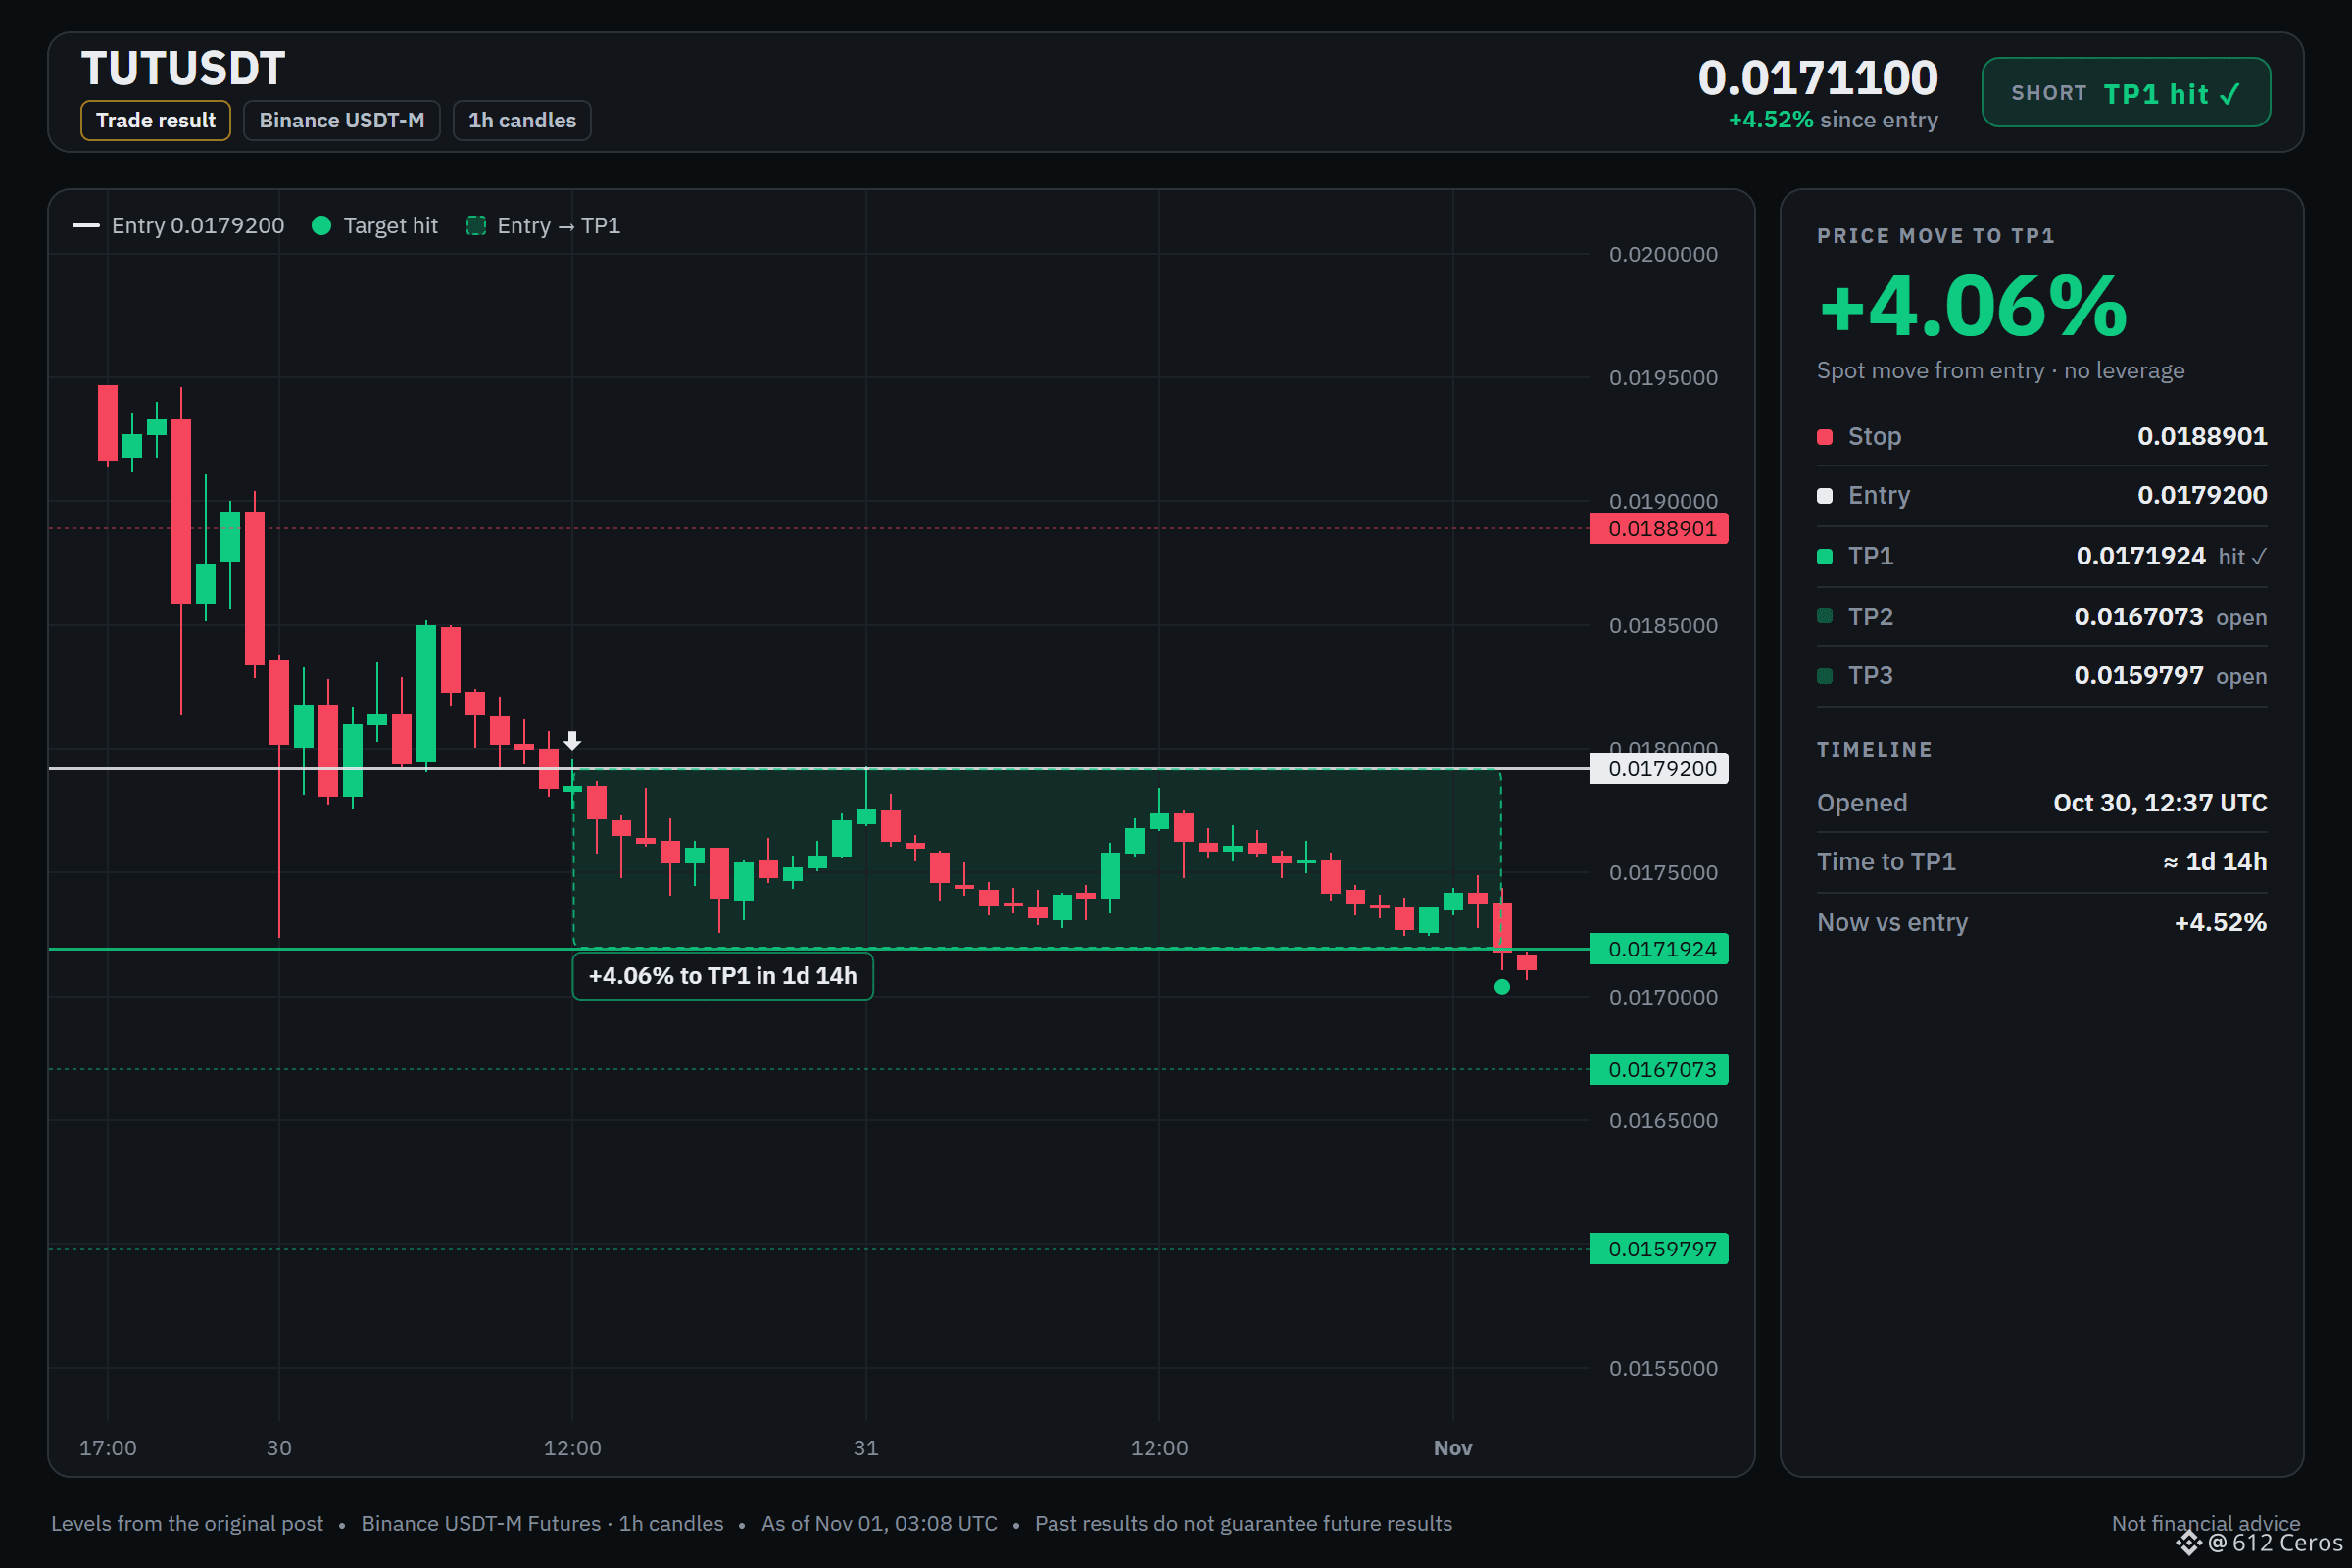
TUTUSDT short hit TP1 🎯 Spot move of +4.06% over ~1d 14h. Always remember to manage your risk.
TUTUSDT short hit TP1 🎯 Spot move of +4.06% over ~1d 14h. Always remember to manage your risk.
612 Ceros
·
--
Bearish🔴 SHORT $TUT /USDT: expecting price to go DOWN
Bias: SHORT · Leaning
Entry: 0.0178868 – 0.0179532
TP1: 0.0171924 (-4.1%)
TP2: 0.0167073 (-6.8%)
TP3: 0.0159797 (-10.8%)
SL: 0.0188901 (+5.4%)
Plan: enter only inside the zone, close 50% at TP1, 25% at TP2, 25% at TP3, and move the stop to entry after TP1.
Note: moderate conviction only, keep size light.
TUT is grinding lower with a bearish 4h stack
Why SHORT? 5/12 signals agree, 0 against.
• 4h trend down (below EMA50 & EMA200)
• BTC is falling, this coin follows (corr 0.62)
• Sellers have the momentum (4h RSI 42.0)
The 4h trend shows price below both EMAs and RSI at 42 confirms sellers are in control, while BTC is also falling and TUT underperforms by 3.23%.
What level would make you take the opposite side?
Chart with every level below.
📲 Want more of my latest signals? Join me here:
https://app.binance.com/uni-qr/D26WbL9t
⚠️ Personal market analysis only. NFA — manage risk and DYOR.
Educational content, not investment advice or a recommendation to buy, sell, deposit, or withdraw any asset. No paid promotion or referral/affiliate links.
494
·
--
Bearish
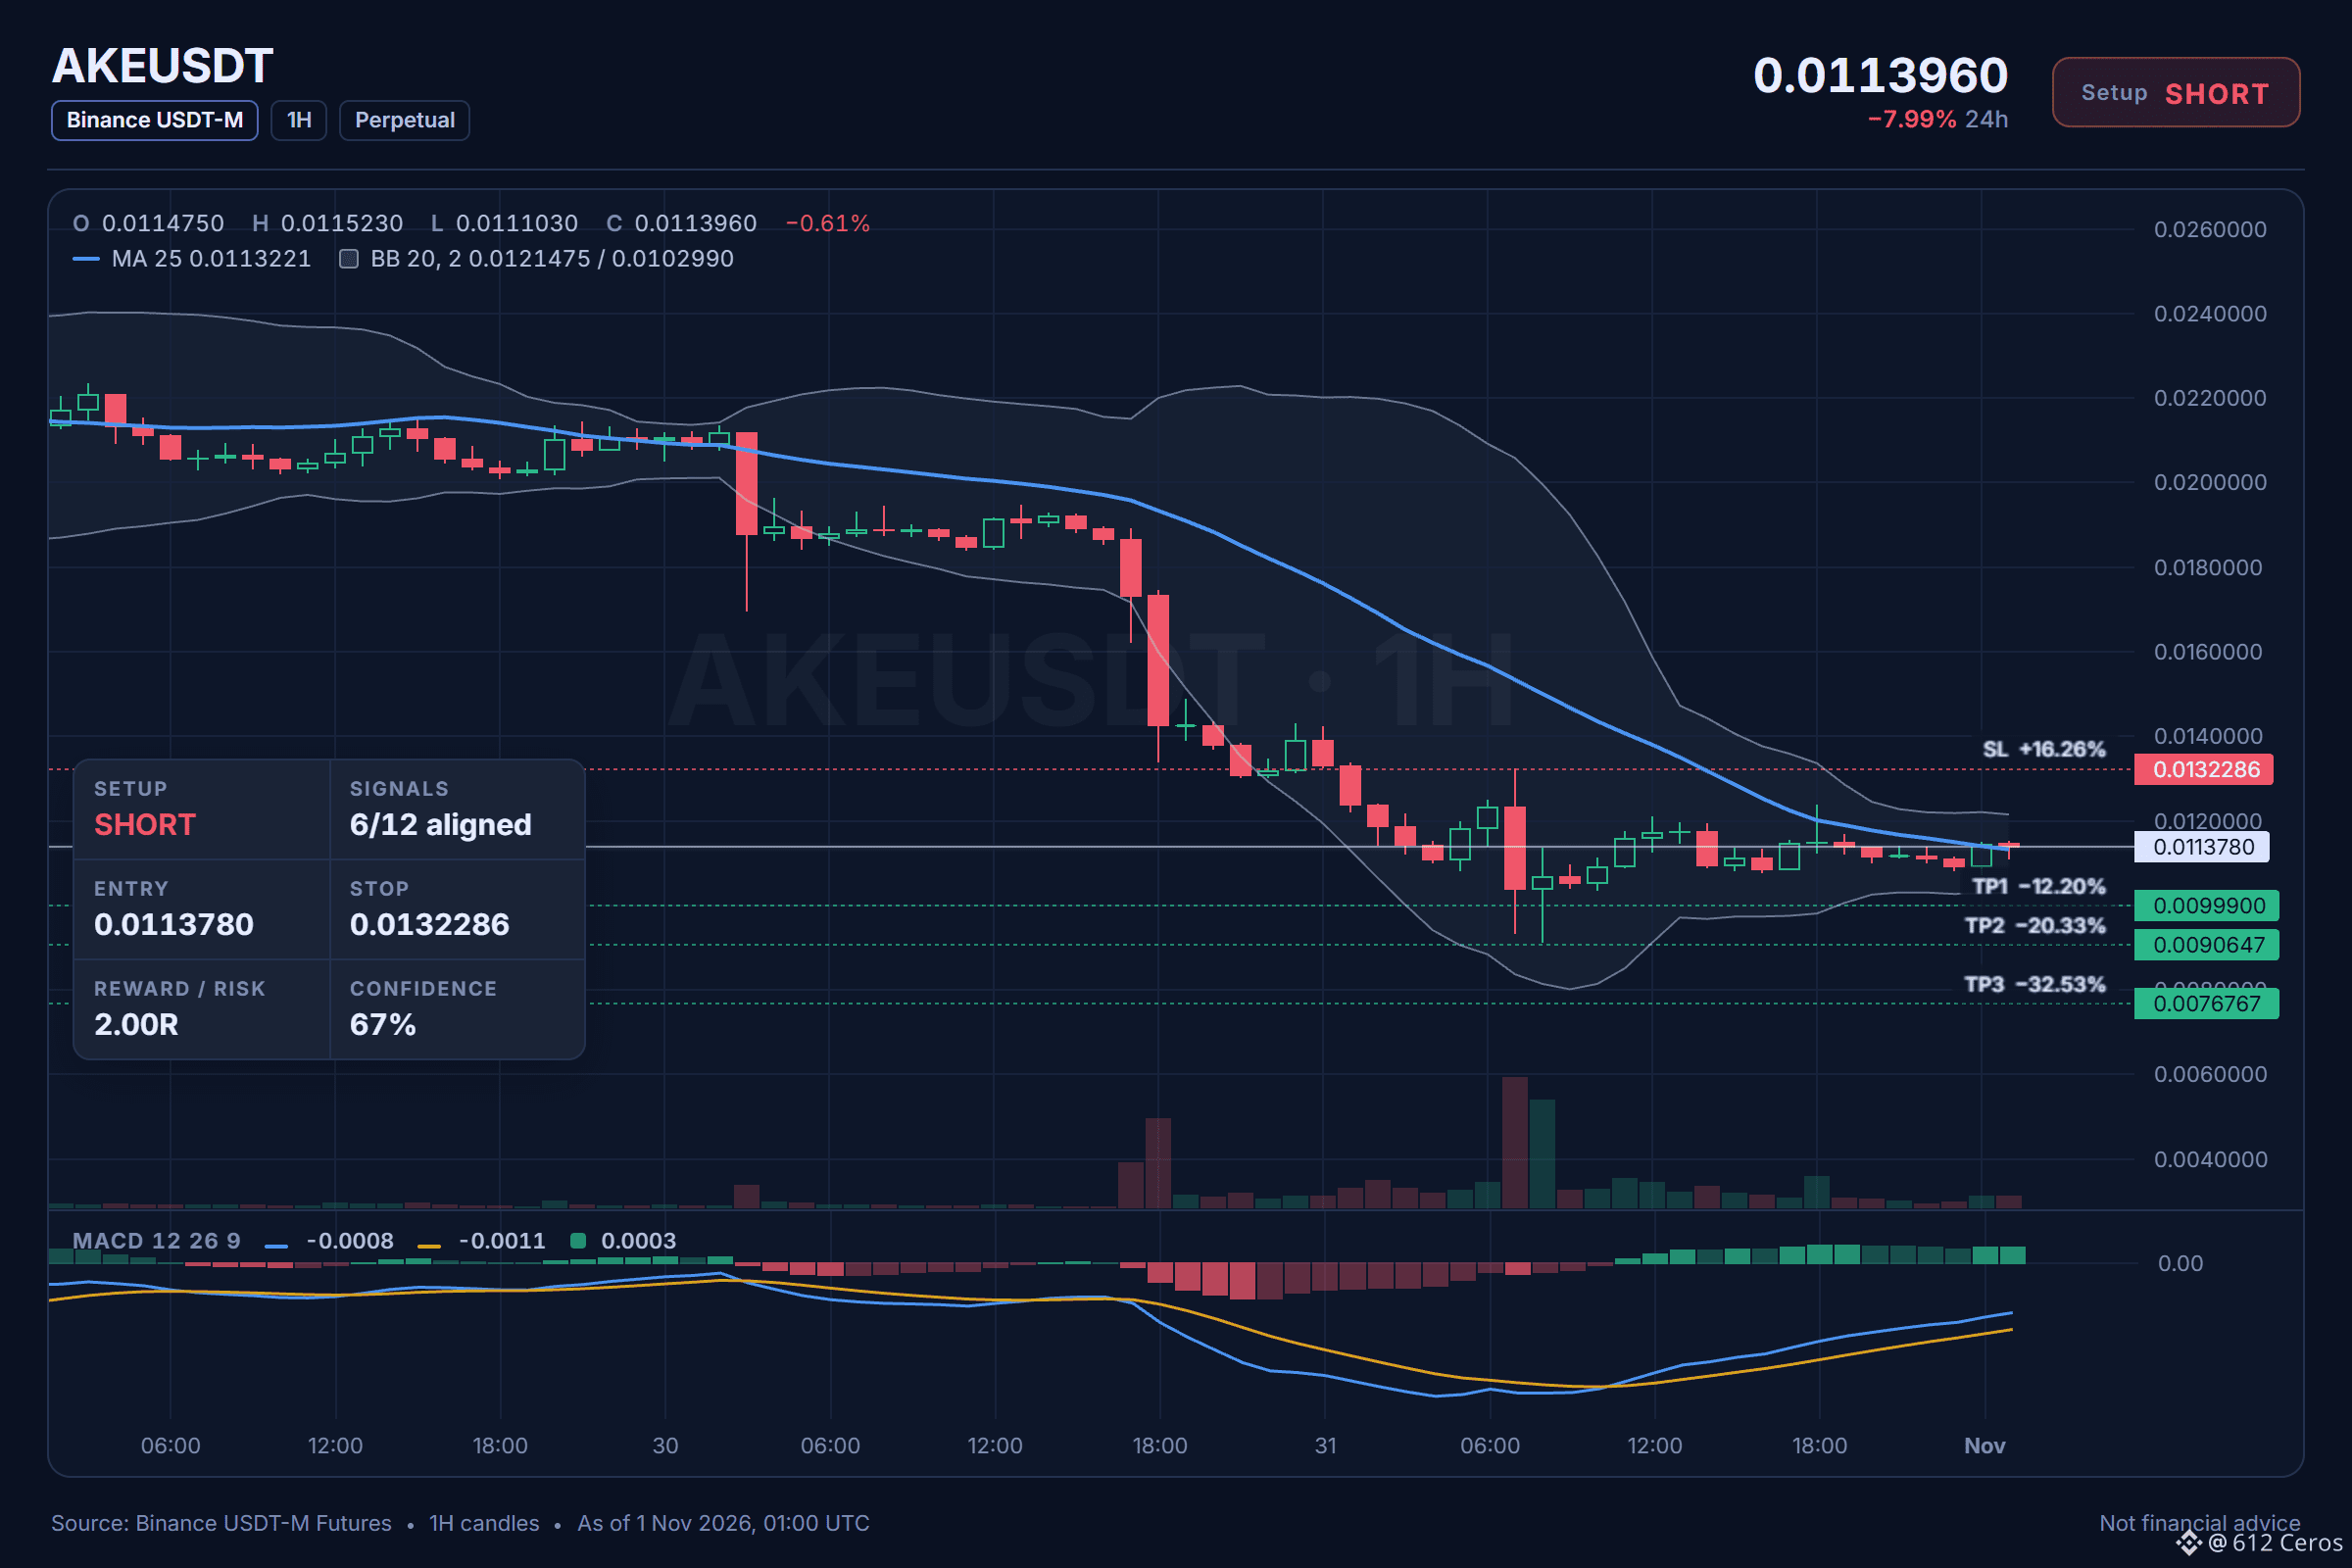
Is AKE ready to slide again?
🔴 SHORT $AKE /USDT: expecting price to go DOWN
Bias: SHORT · Strong
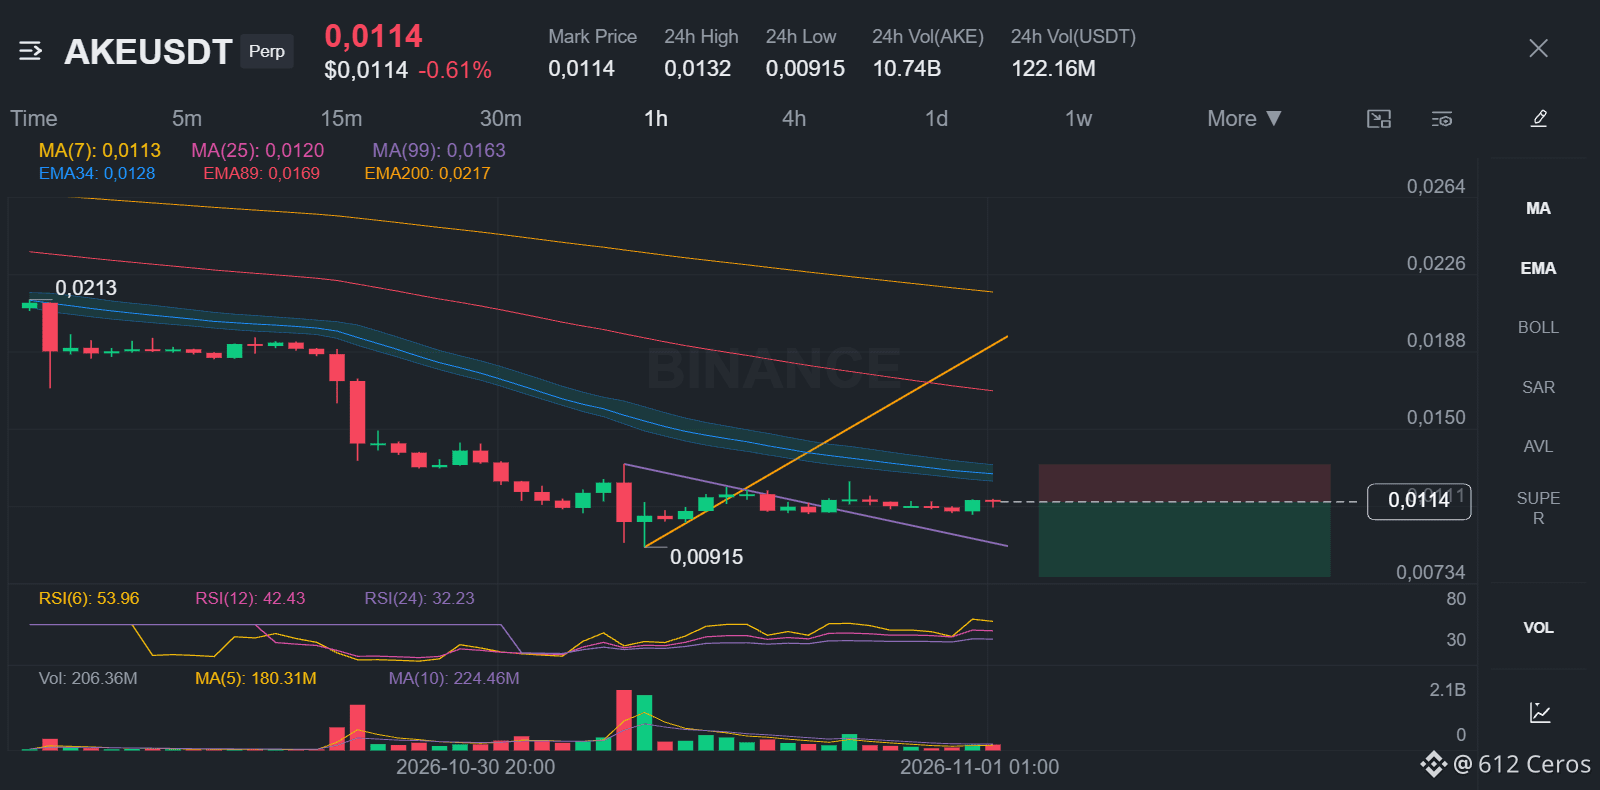
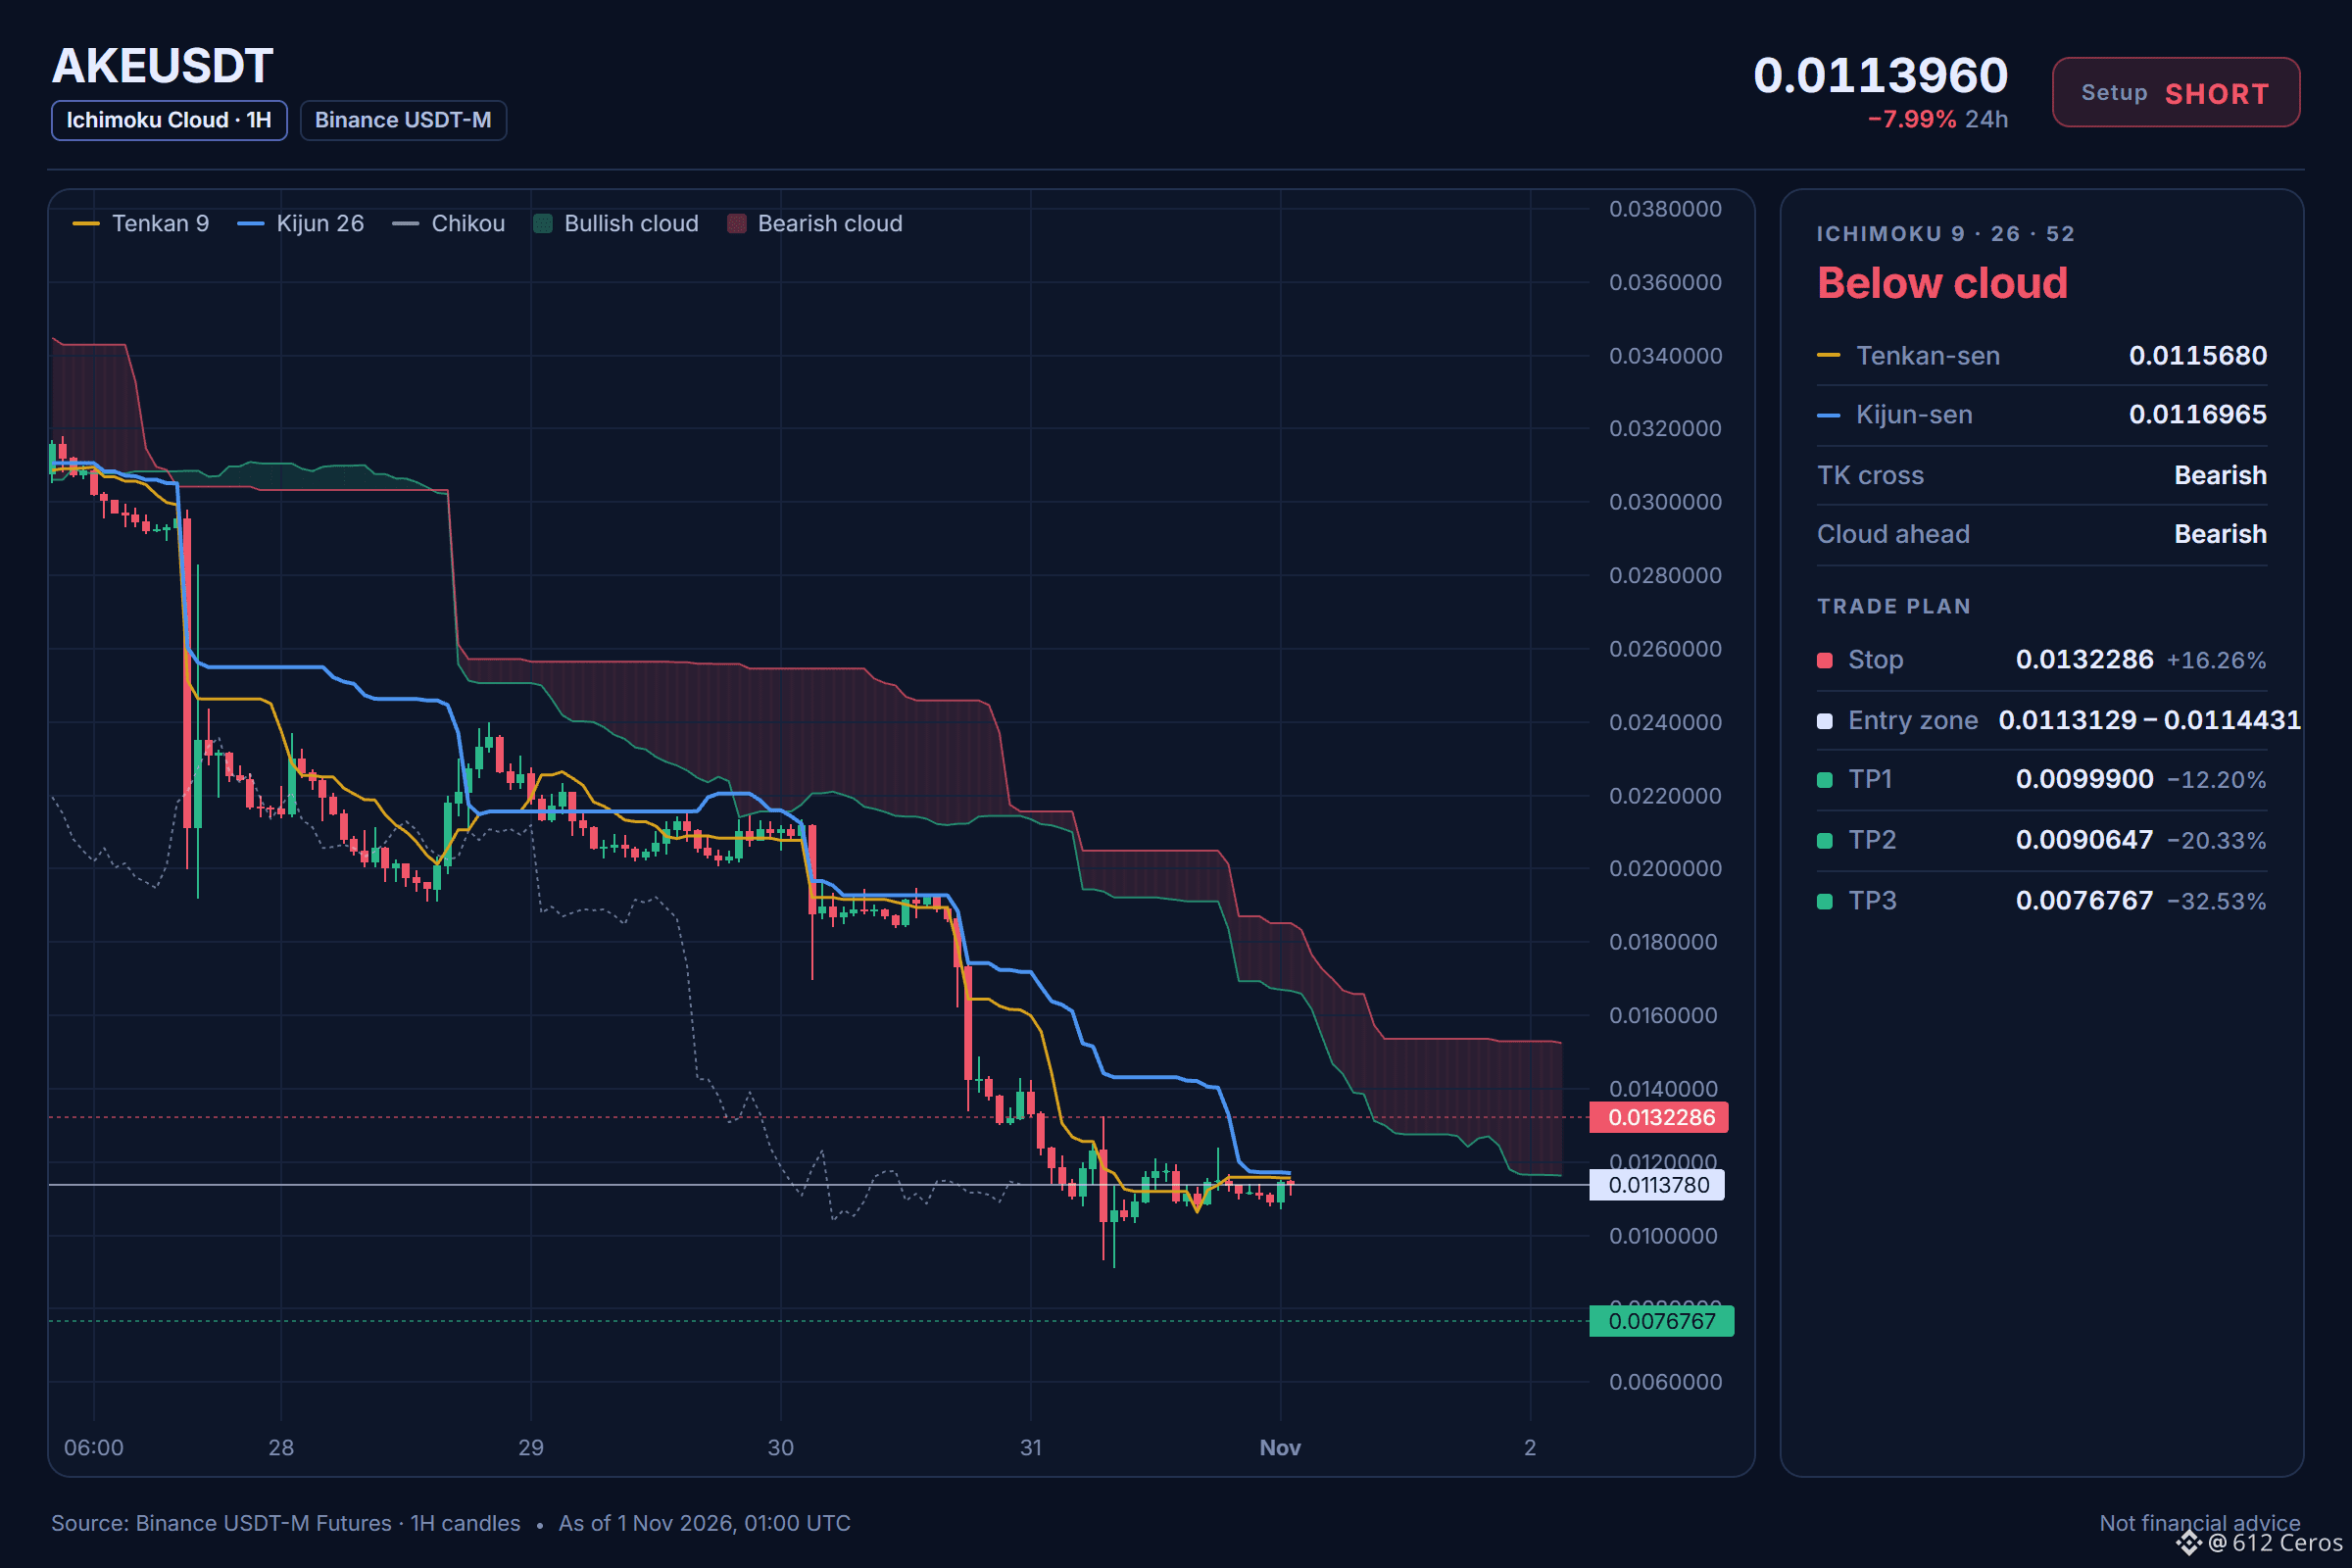
Entry: 0.0113129 – 0.0114431
TP1: 0.0099900 (-12.2%)
TP2: 0.0090647 (-20.3%)
TP3: 0.0076767 (-32.5%)
SL: 0.0132286 (+16.3%)
Plan: enter only inside the zone, close 50% at TP1, 25% at TP2, 25% at TP3, and move the stop to entry after TP1.
Why SHORT? 6/12 signals agree, 1 against.
• 4h trend down (below EMA50 & EMA200)
• 1h trend down (below EMA50 & EMA200)
• Sellers have the momentum (4h RSI 25.6)
Risk: Far below its average, bounce likely (−3.5 ATR from 1h EMA50)
Q: Why short AKE here?
A: The 4h trend is down because price is below EMA50 and EMA200.
Q: When is this wrong?
A: The 1h price is 3.5 ATR below EMA50, which means a bounce is likely.
Where would you place your level?
Full setup on the chart below.
{future}(AKEUSDT)
📲 Want more of my latest signals? Join me here:
[https://app.binance.com/uni-qr/D26WbL9t](https://app.binance.com/uni-qr/D26WbL9t)
⚠️ Personal market analysis only. NFA — manage risk and DYOR.
Educational content, not investment advice or a recommendation to buy, sell, deposit, or withdraw any asset. No paid promotion or referral/affiliate links.
Is AKE ready to slide again?
🔴 SHORT $AKE /USDT: expecting price to go DOWN
Bias: SHORT · Strong
Entry: 0.0113129 – 0.0114431
TP1: 0.0099900 (-12.2%)
TP2: 0.0090647 (-20.3%)
TP3: 0.0076767 (-32.5%)
SL: 0.0132286 (+16.3%)
Plan: enter only inside the zone, close 50% at TP1, 25% at TP2, 25% at TP3, and move the stop to entry after TP1.
Why SHORT? 6/12 signals agree, 1 against.
• 4h trend down (below EMA50 & EMA200)
• 1h trend down (below EMA50 & EMA200)
• Sellers have the momentum (4h RSI 25.6)
Risk: Far below its average, bounce likely (−3.5 ATR from 1h EMA50)
Q: Why short AKE here?
A: The 4h trend is down because price is below EMA50 and EMA200.
Q: When is this wrong?
A: The 1h price is 3.5 ATR below EMA50, which means a bounce is likely.
Where would you place your level?
Full setup on the chart below.
📲 Want more of my latest signals? Join me here:
https://app.binance.com/uni-qr/D26WbL9t
⚠️ Personal market analysis only. NFA — manage risk and DYOR.
Educational content, not investment advice or a recommendation to buy, sell, deposit, or withdraw any asset. No paid promotion or referral/affiliate links.
521
·
--
Bearish
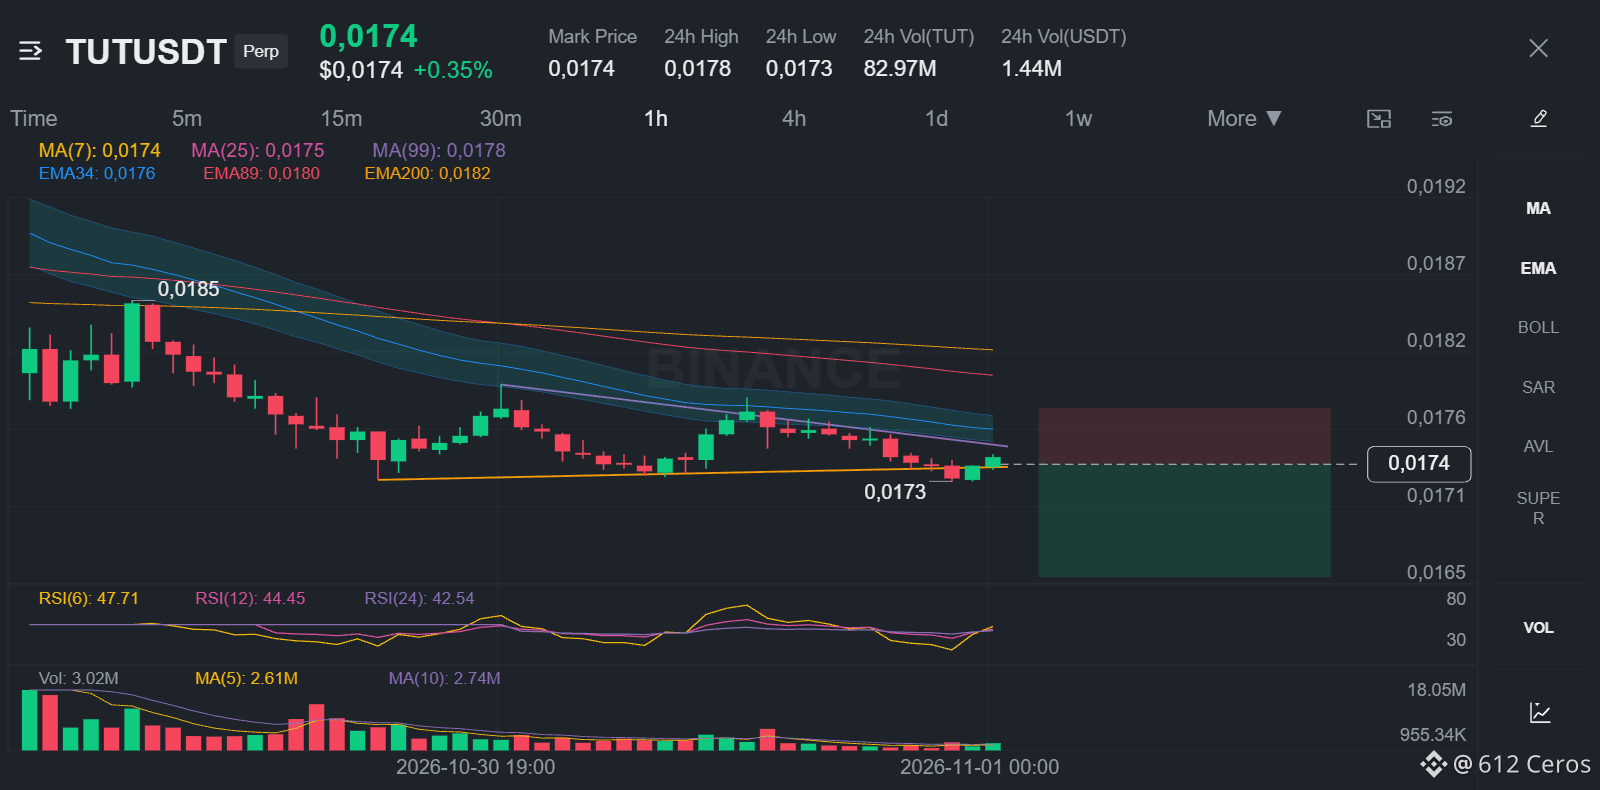
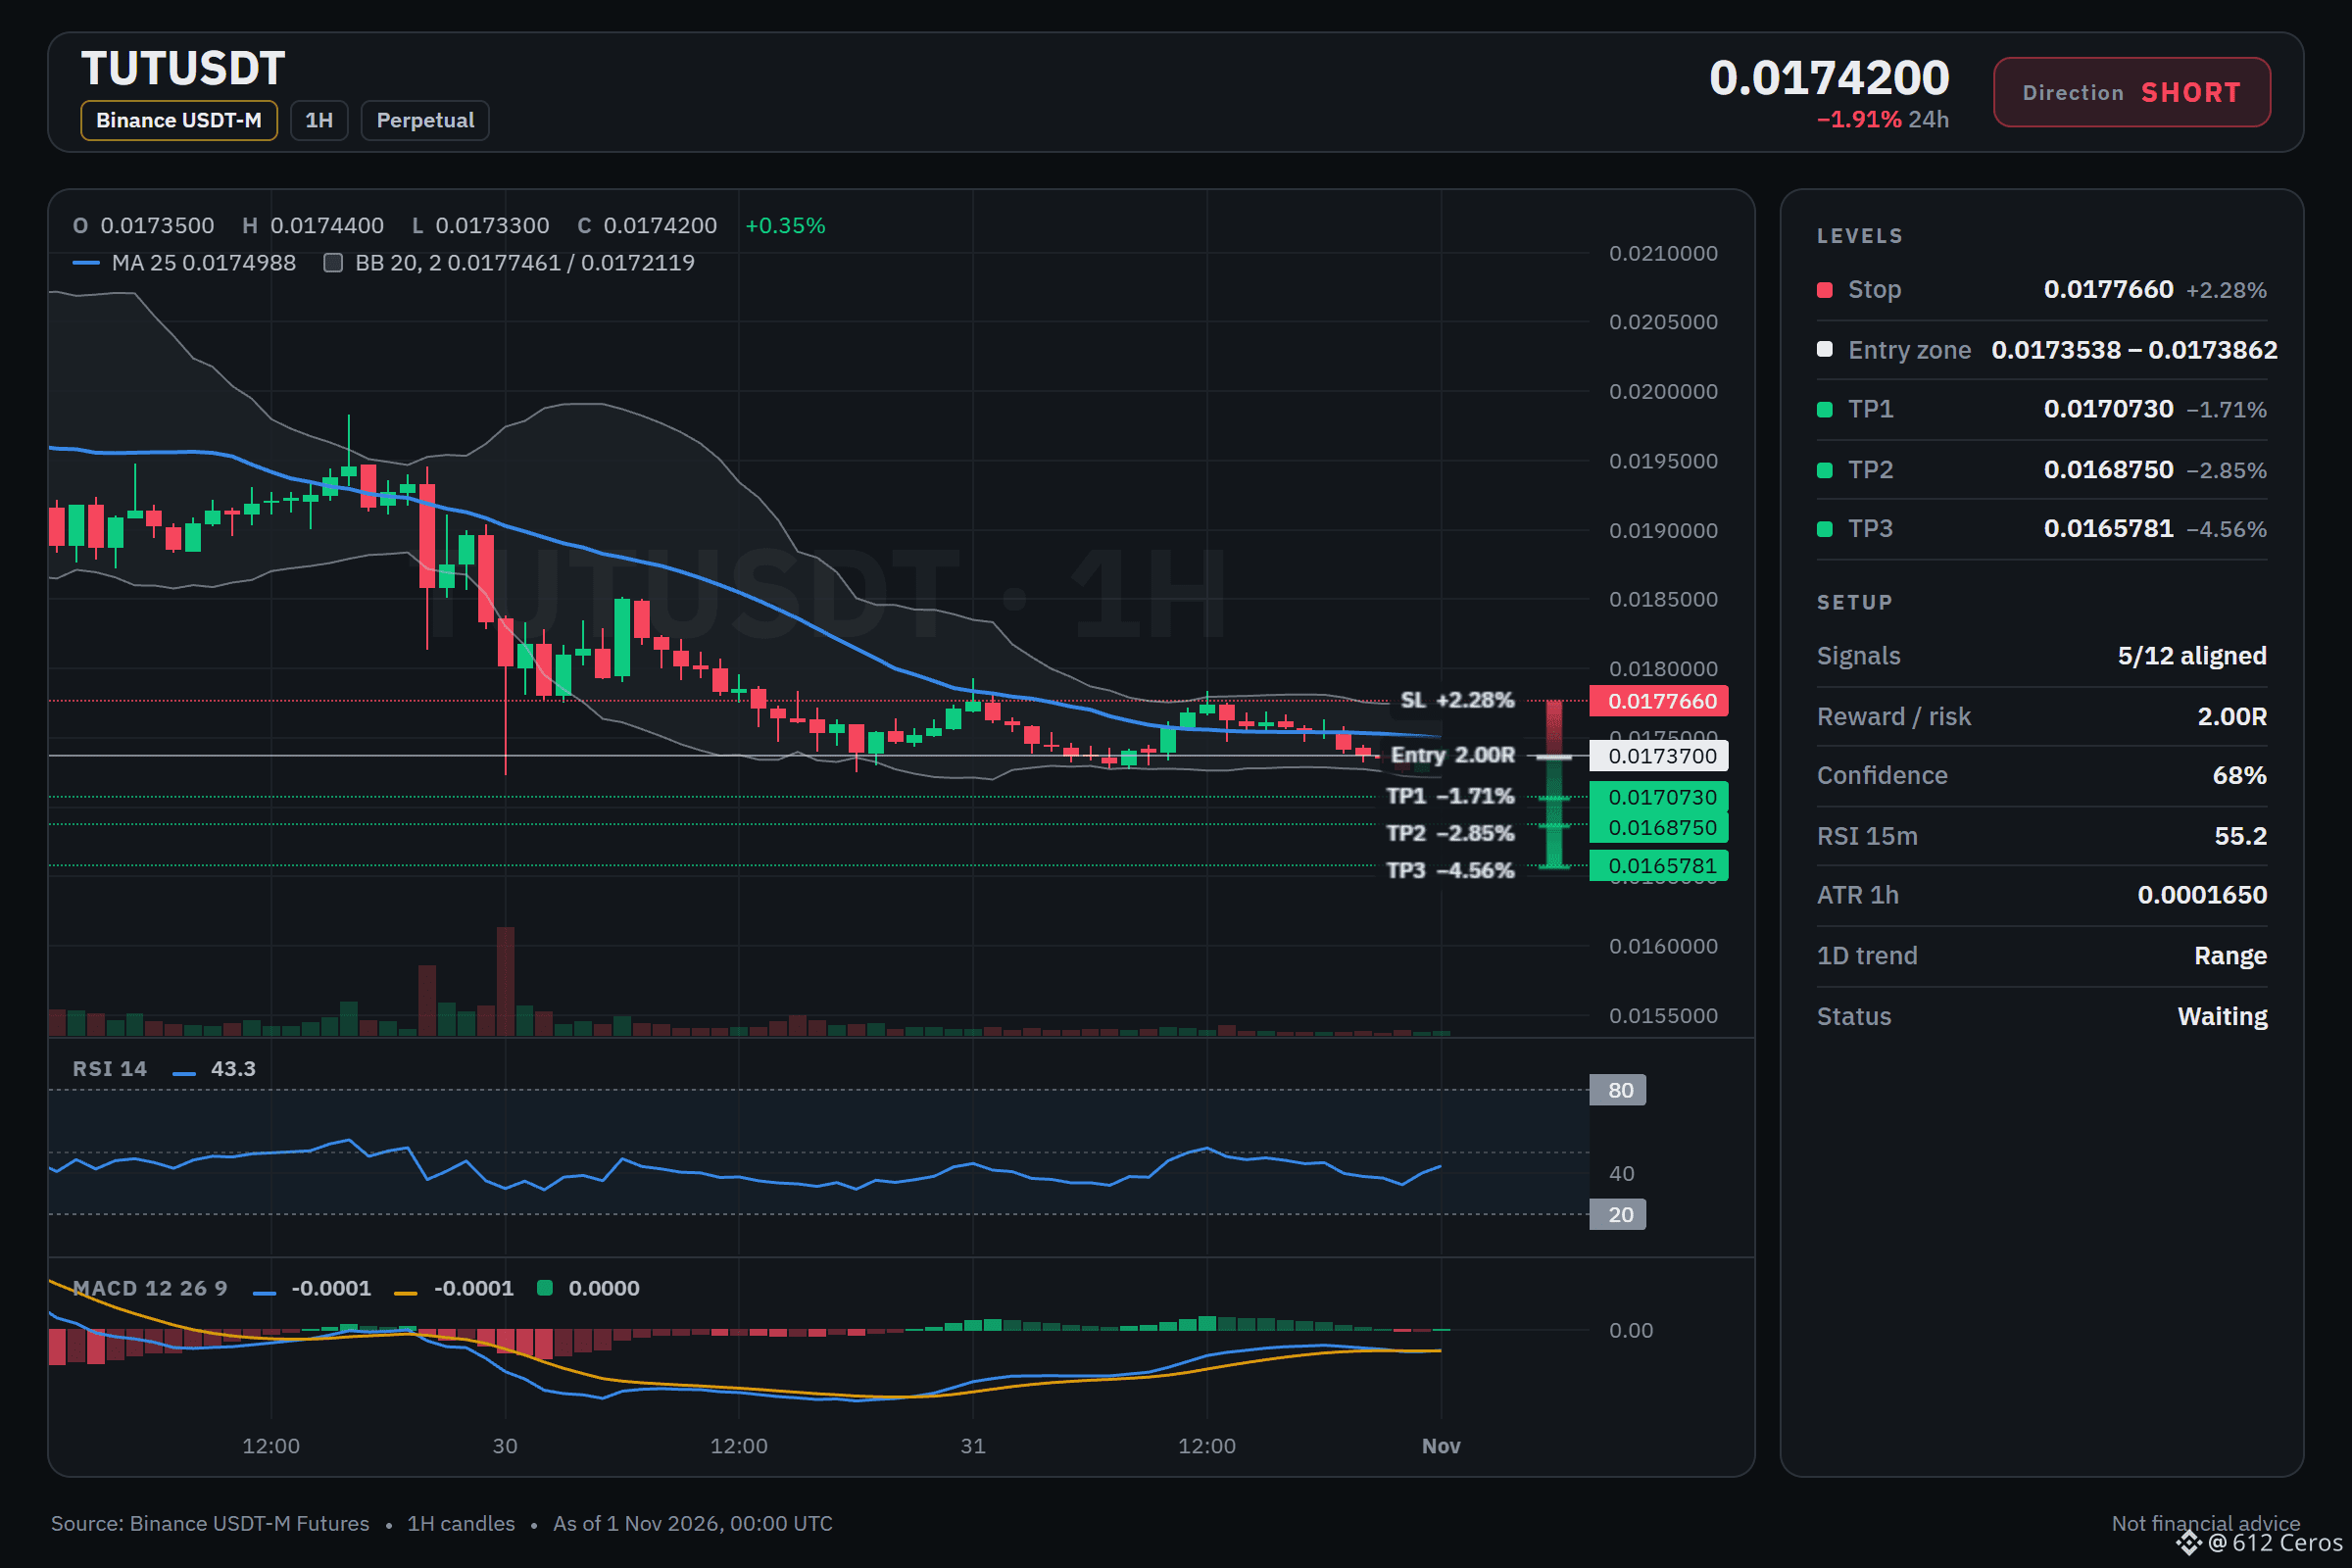
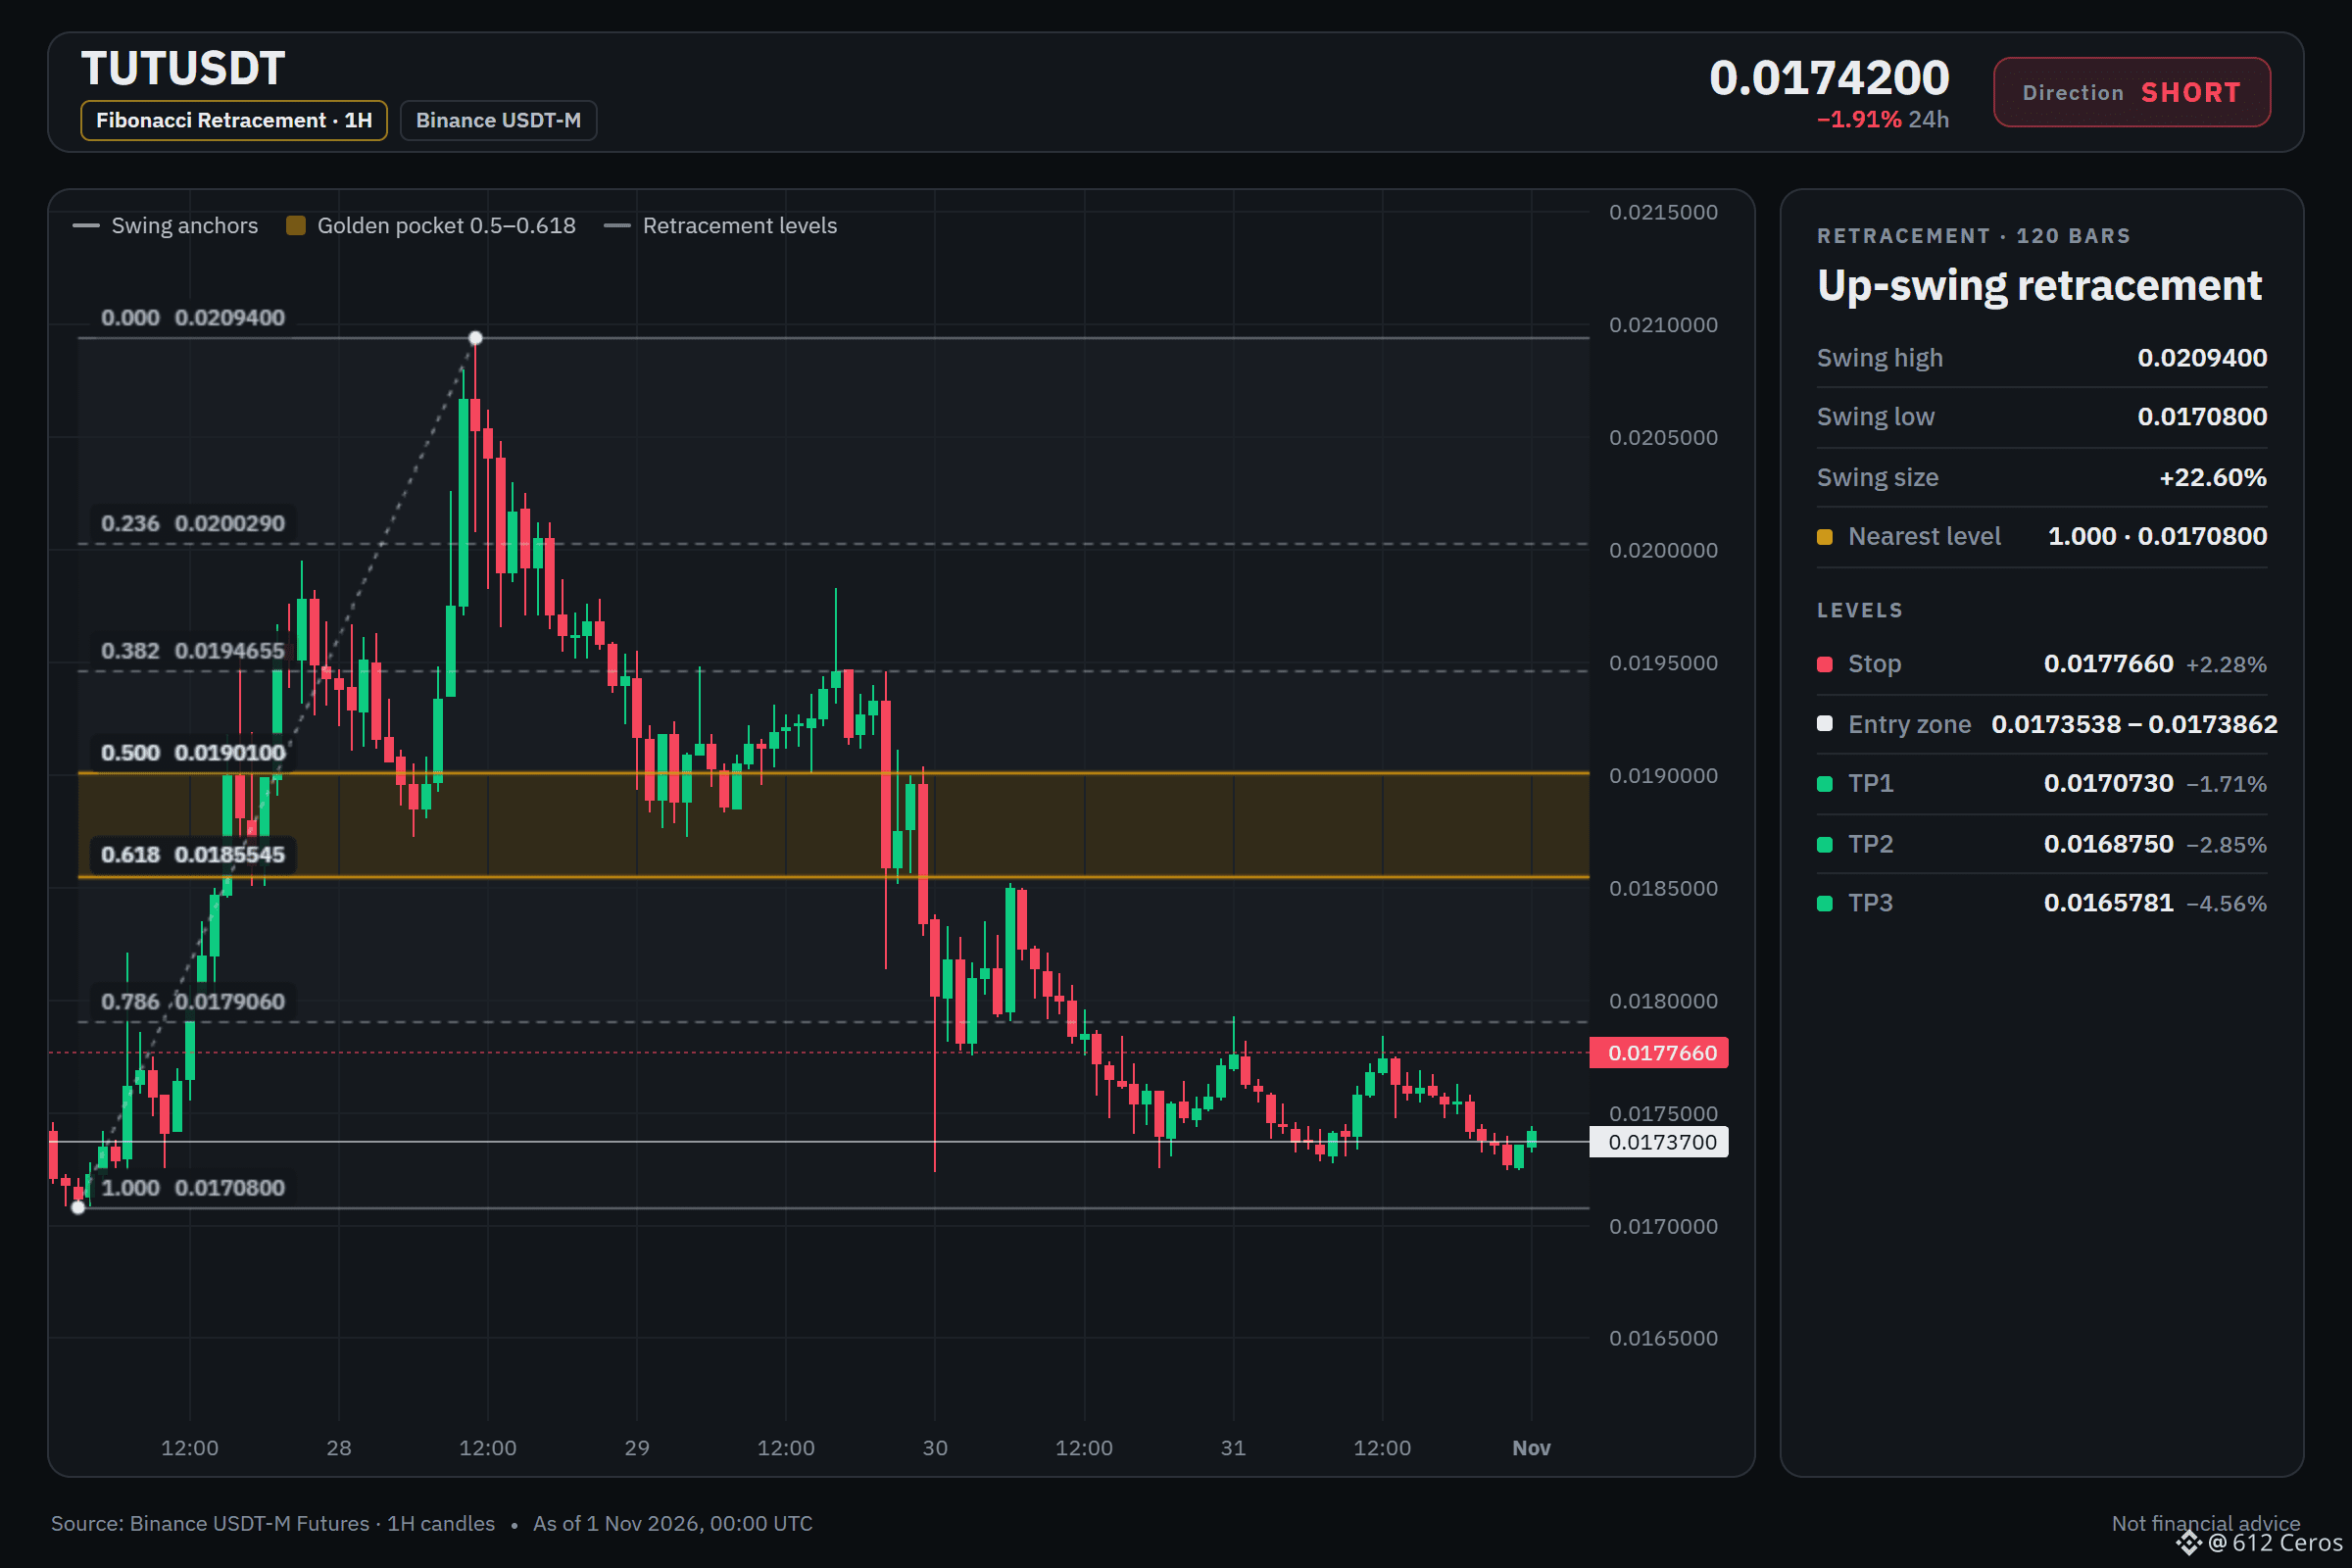
TUT keeps sliding while the stack stays bearish.
🔴 SHORT $TUT /USDT: expecting price to go DOWN
Bias: SHORT · Leaning
Entry: 0.0173538 – 0.0173862
TP1: 0.0170730 (-1.7%)
TP2: 0.0168750 (-2.8%)
TP3: 0.0165781 (-4.6%)
SL: 0.0177660 (+2.3%)
Plan: enter only inside the zone, close 50% at TP1, 25% at TP2, 25% at TP3, and move the stop to entry after TP1.
Note: moderate conviction only, keep size light.
Why SHORT? 5/12 signals agree, 0 against.
• 4h trend down (below EMA50 & EMA200)
• 1h trend down (below EMA50 & EMA200)
• Sellers have the momentum (4h RSI 39.8)
Why I like it:
The 1h price is 0.0173700, which is above the entry range. The 4h trend shows price below both EMA50 and EMA200, and the 4h RSI is 39.8. The setup is leaning short, but the daily trend is a range and conviction is moderate.
Where do you place your invalidation level?
Chart with every level below.
{future}(TUTUSDT)
📲 Want more of my latest signals? Join me here:
[https://app.binance.com/uni-qr/D26WbL9t](https://app.binance.com/uni-qr/D26WbL9t)
⚠️ Personal market analysis only. NFA — manage risk and DYOR.
Educational content, not investment advice or a recommendation to buy, sell, deposit, or withdraw any asset. No paid promotion or referral/affiliate links.
TUT keeps sliding while the stack stays bearish.
🔴 SHORT $TUT /USDT: expecting price to go DOWN
Bias: SHORT · Leaning
Entry: 0.0173538 – 0.0173862
TP1: 0.0170730 (-1.7%)
TP2: 0.0168750 (-2.8%)
TP3: 0.0165781 (-4.6%)
SL: 0.0177660 (+2.3%)
Plan: enter only inside the zone, close 50% at TP1, 25% at TP2, 25% at TP3, and move the stop to entry after TP1.
Note: moderate conviction only, keep size light.
Why SHORT? 5/12 signals agree, 0 against.
• 4h trend down (below EMA50 & EMA200)
• 1h trend down (below EMA50 & EMA200)
• Sellers have the momentum (4h RSI 39.8)
Why I like it:
The 1h price is 0.0173700, which is above the entry range. The 4h trend shows price below both EMA50 and EMA200, and the 4h RSI is 39.8. The setup is leaning short, but the daily trend is a range and conviction is moderate.
Where do you place your invalidation level?
Chart with every level below.
📲 Want more of my latest signals? Join me here:
https://app.binance.com/uni-qr/D26WbL9t
⚠️ Personal market analysis only. NFA — manage risk and DYOR.
Educational content, not investment advice or a recommendation to buy, sell, deposit, or withdraw any asset. No paid promotion or referral/affiliate links.
1
350
·
--
Bearish
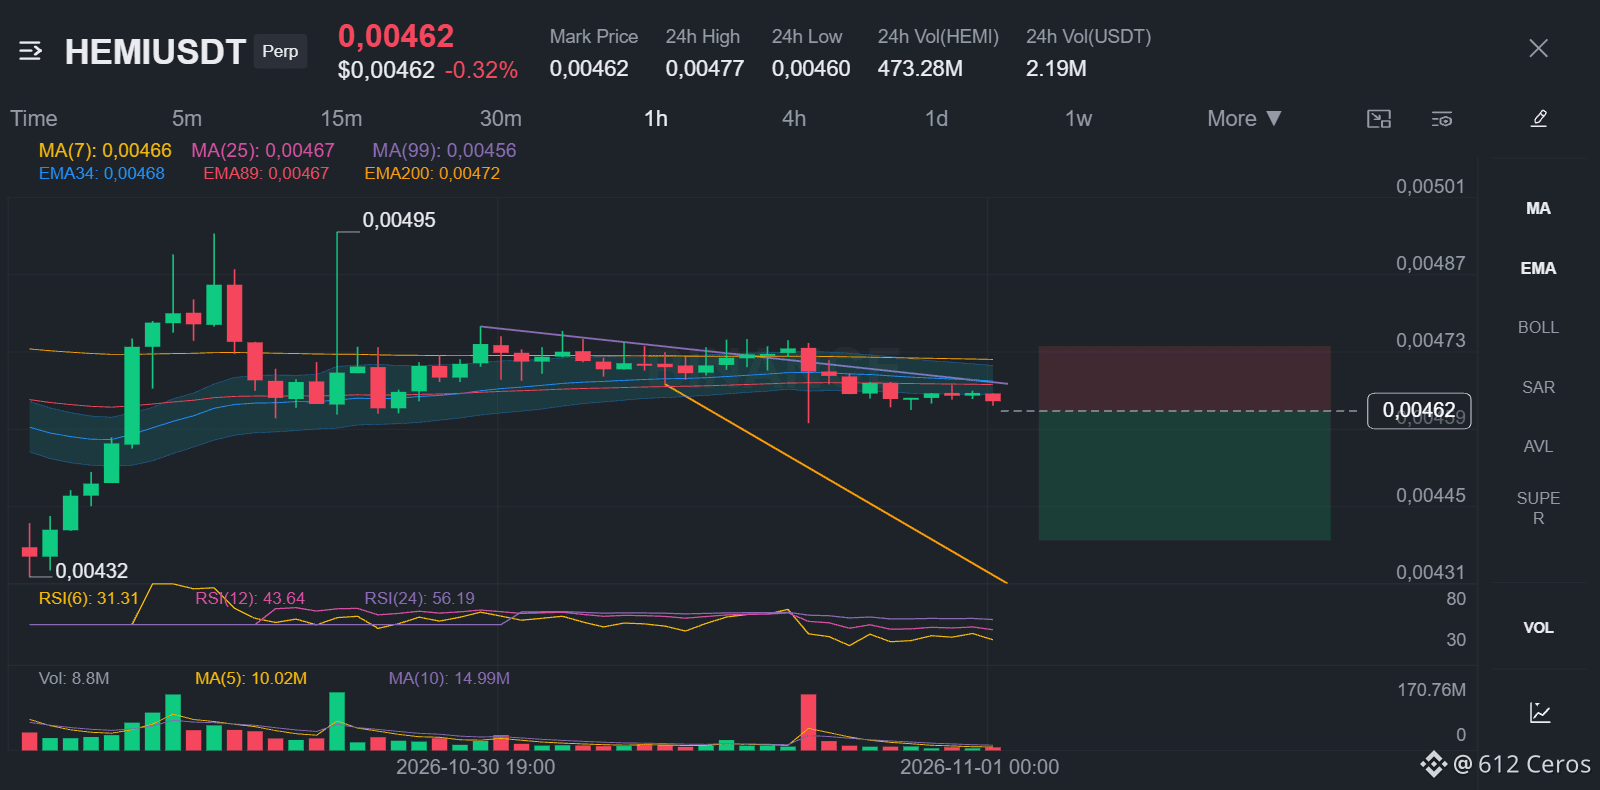
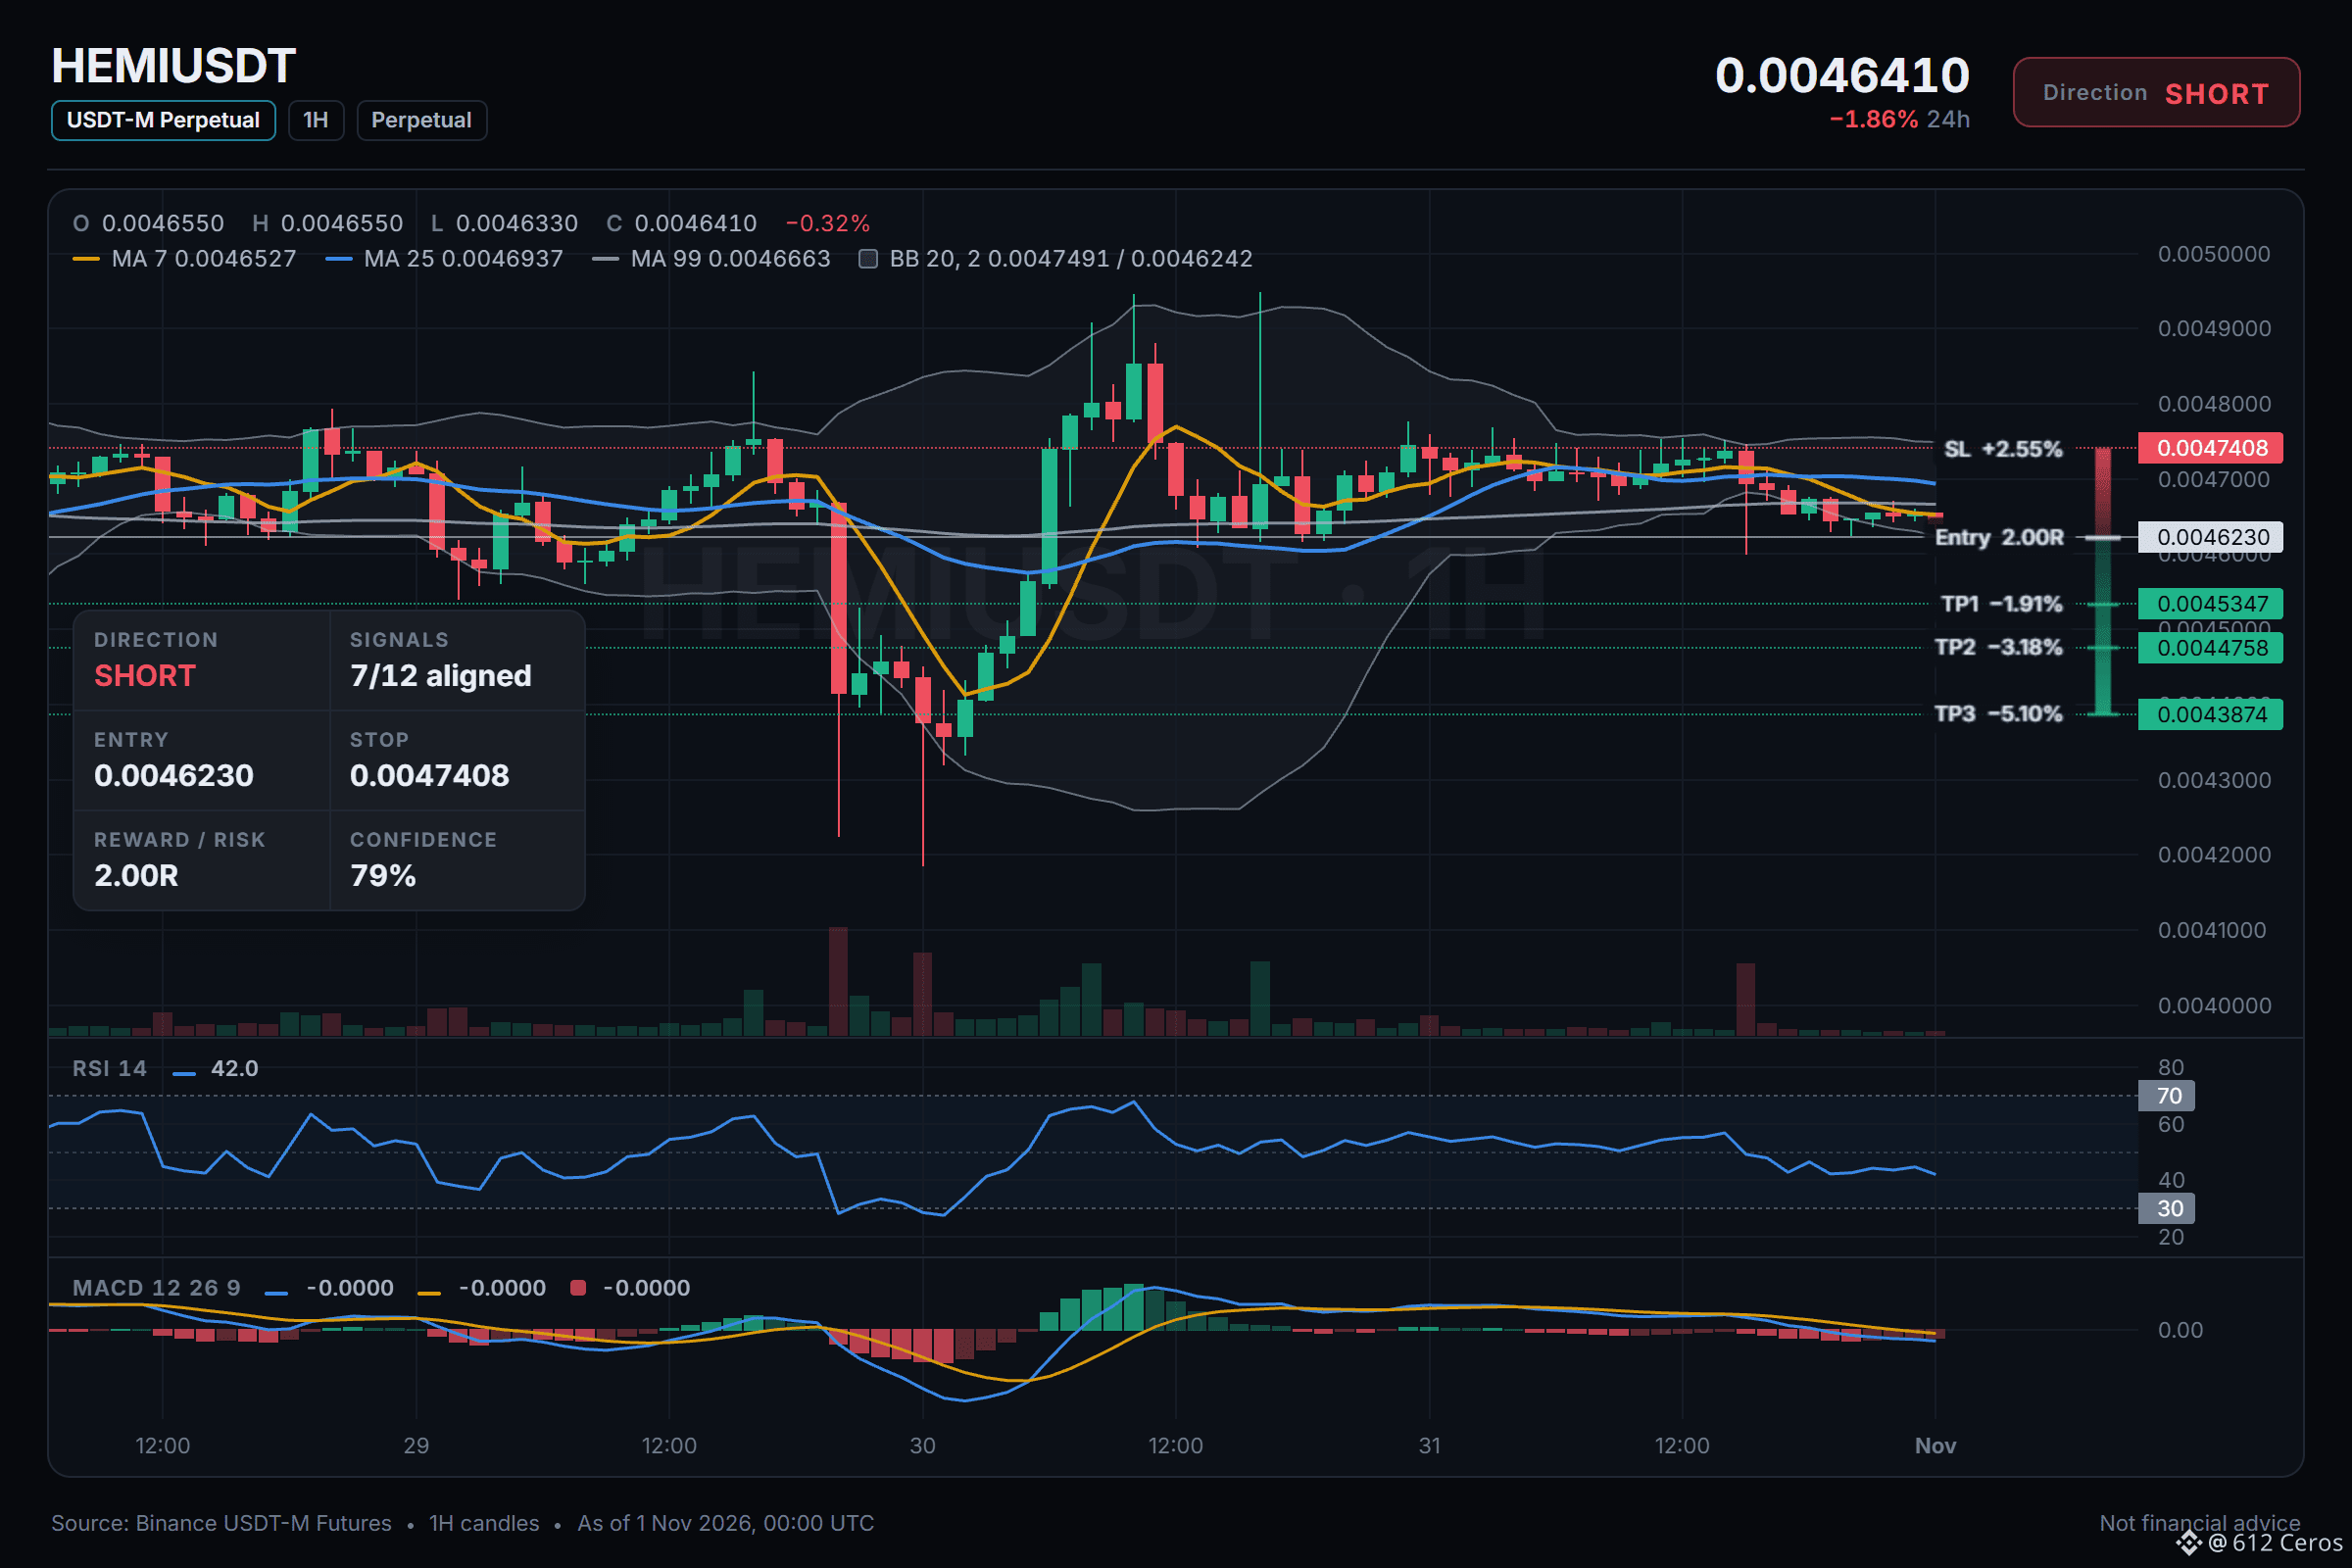
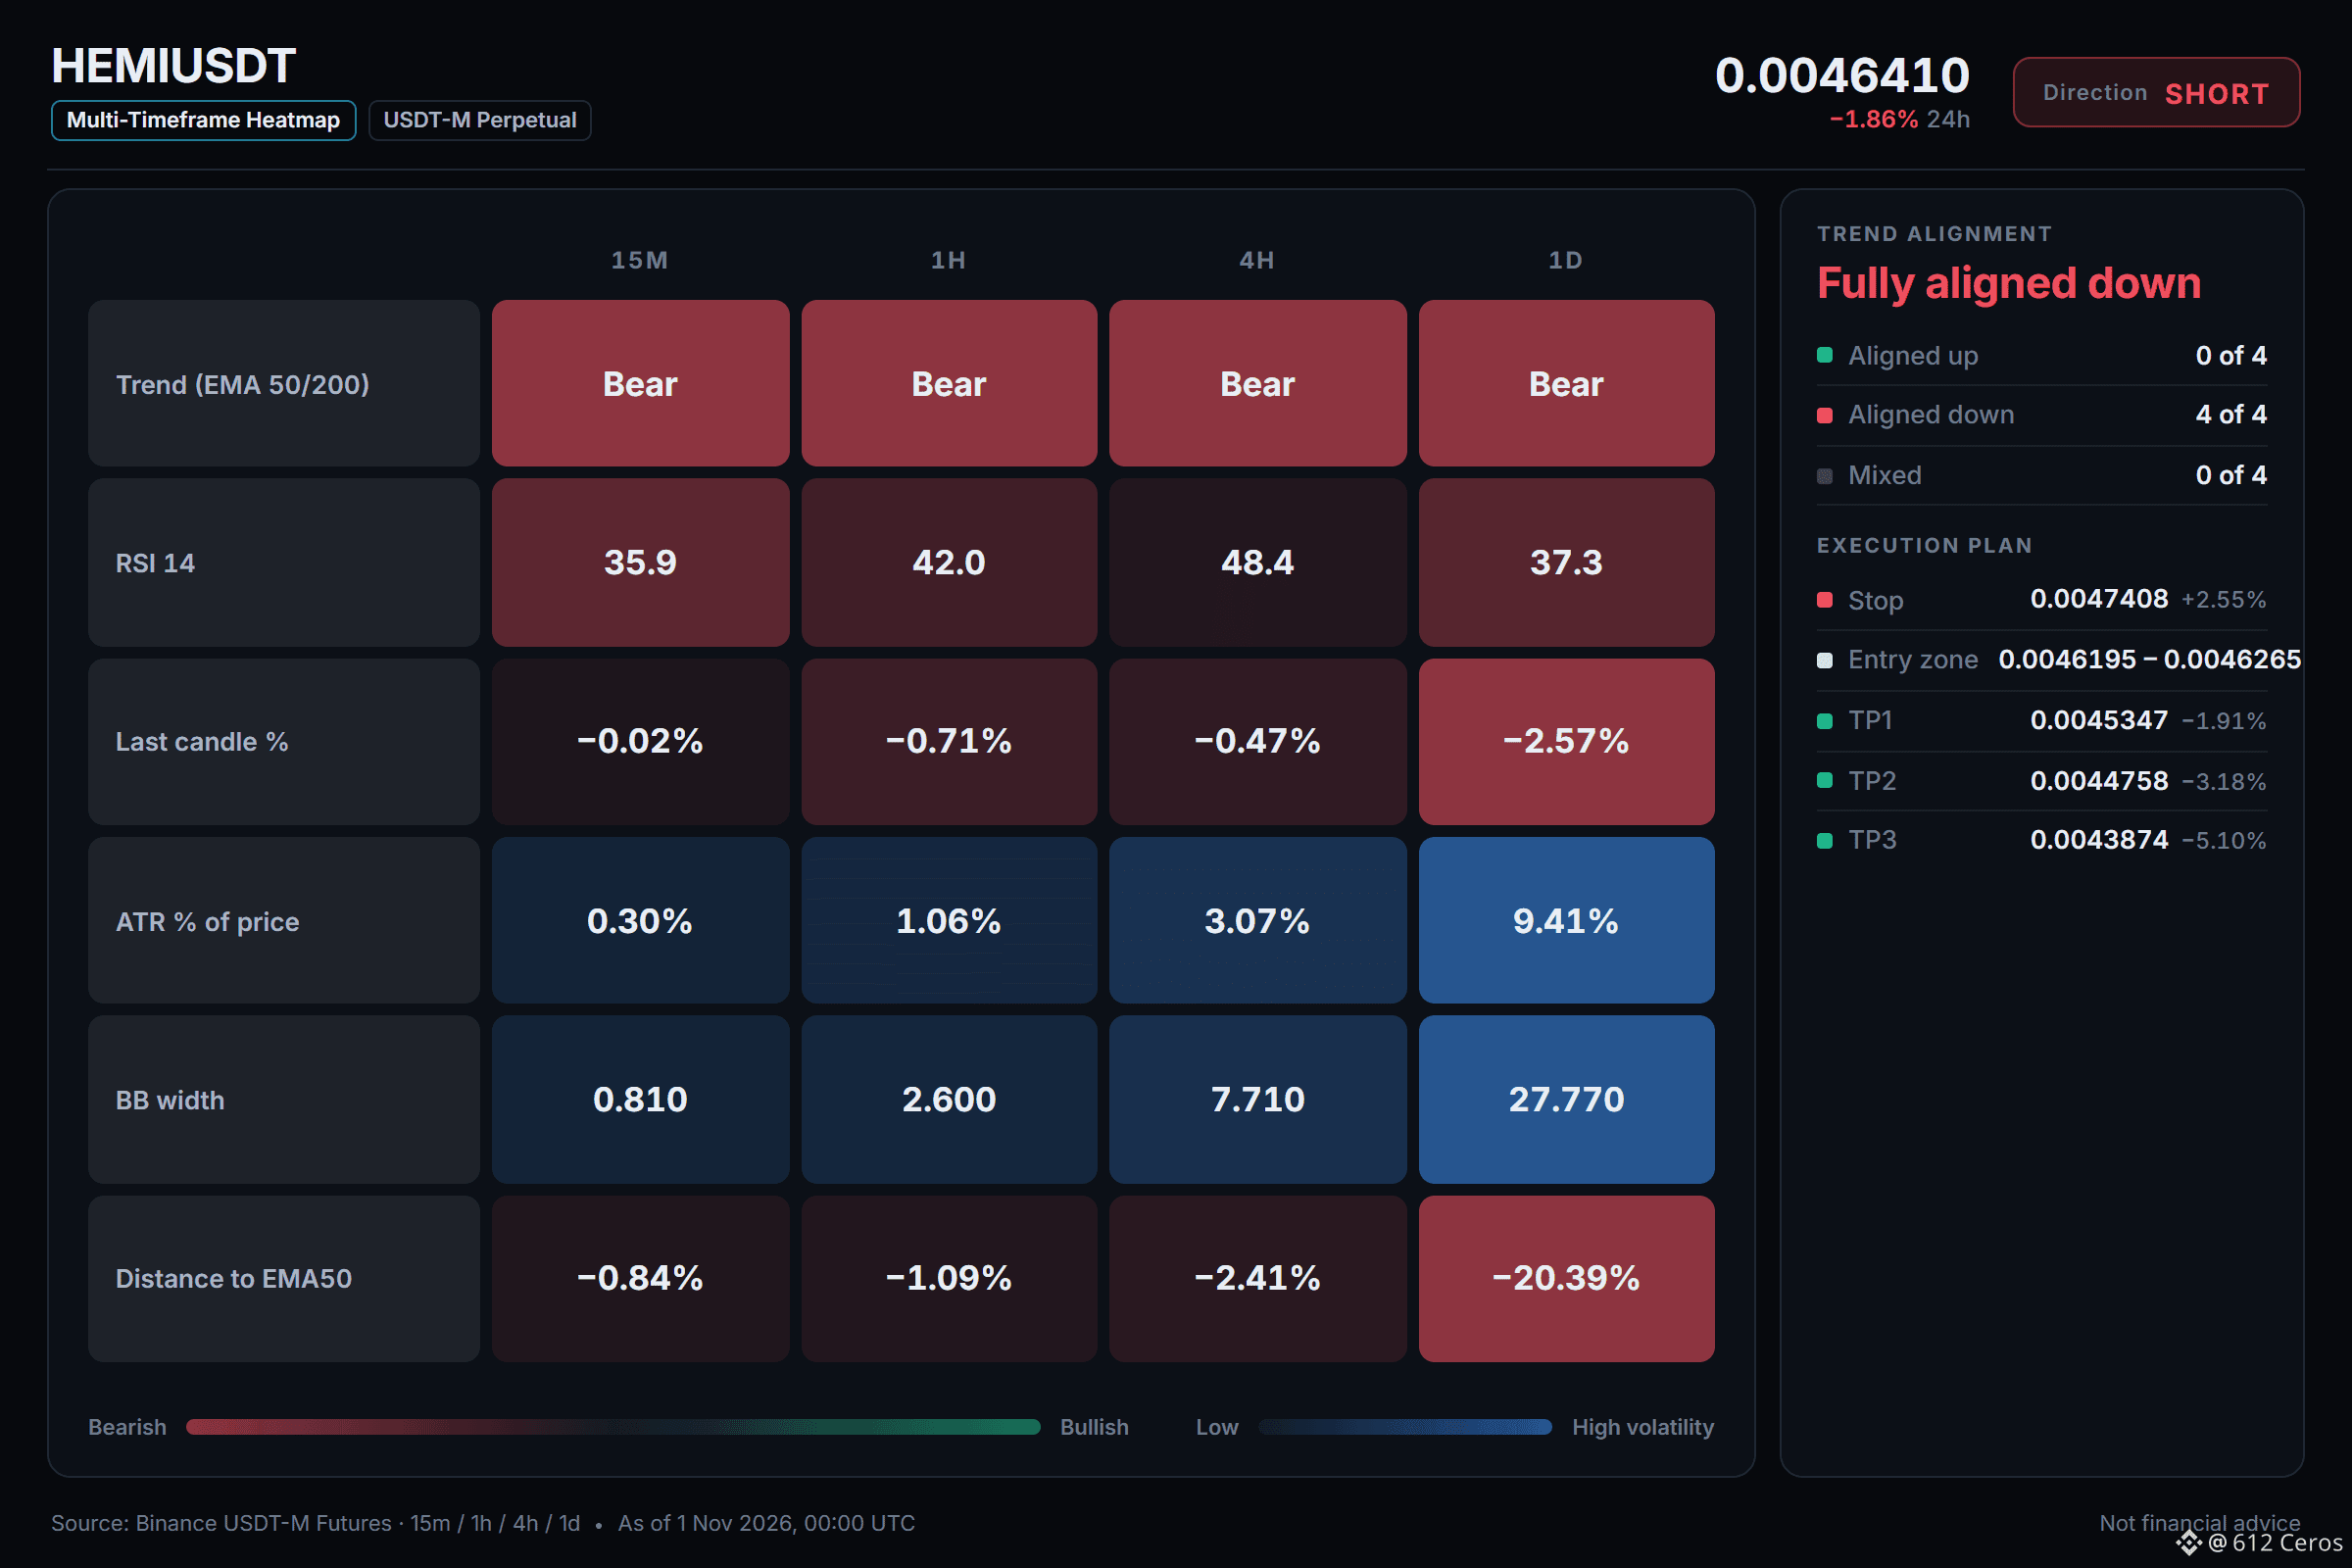
HEMI is sliding in a clear bearish trend.
🔴 SHORT $HEMI /USDT: expecting price to go DOWN
Bias: SHORT · Strong
Entry: 0.0046195 – 0.0046265
TP1: 0.0045347 (-1.9%)
TP2: 0.0044758 (-3.2%)
TP3: 0.0043874 (-5.1%)
SL: 0.0047408 (+2.5%)
Plan: enter only inside the zone, close 50% at TP1, 25% at TP2, 25% at TP3, and move the stop to entry after TP1.
Why SHORT? 7/12 signals agree, 0 against.
• Daily trend down (below EMA50 & EMA200)
• 4h trend down (below EMA50 & EMA200)
• 1h trend down (below EMA50 & EMA200)
If it plays out:
If the idea works the 1h price keeps falling and the daily trend stays down, which is what the bearish stack shows.
If it fails:
If price pushes back above the invalidation level the setup is wrong and you should exit the short immediately.
What level would you use to defend this short?
Levels mapped on the chart below.
{future}(HEMIUSDT)
📲 Want more of my latest signals? Join me here:
[https://app.binance.com/uni-qr/D26WbL9t](https://app.binance.com/uni-qr/D26WbL9t)
⚠️ Personal market analysis only. NFA — manage risk and DYOR.
Educational content, not investment advice or a recommendation to buy, sell, deposit, or withdraw any asset. No paid promotion or referral/affiliate links.
HEMI is sliding in a clear bearish trend.
🔴 SHORT $HEMI /USDT: expecting price to go DOWN
Bias: SHORT · Strong
Entry: 0.0046195 – 0.0046265
TP1: 0.0045347 (-1.9%)
TP2: 0.0044758 (-3.2%)
TP3: 0.0043874 (-5.1%)
SL: 0.0047408 (+2.5%)
Plan: enter only inside the zone, close 50% at TP1, 25% at TP2, 25% at TP3, and move the stop to entry after TP1.
Why SHORT? 7/12 signals agree, 0 against.
• Daily trend down (below EMA50 & EMA200)
• 4h trend down (below EMA50 & EMA200)
• 1h trend down (below EMA50 & EMA200)
If it plays out:
If the idea works the 1h price keeps falling and the daily trend stays down, which is what the bearish stack shows.
If it fails:
If price pushes back above the invalidation level the setup is wrong and you should exit the short immediately.
What level would you use to defend this short?
Levels mapped on the chart below.
📲 Want more of my latest signals? Join me here:
https://app.binance.com/uni-qr/D26WbL9t
⚠️ Personal market analysis only. NFA — manage risk and DYOR.
Educational content, not investment advice or a recommendation to buy, sell, deposit, or withdraw any asset. No paid promotion or referral/affiliate links.
268
·
--
Bearish
BTC does not always follow its own trend.
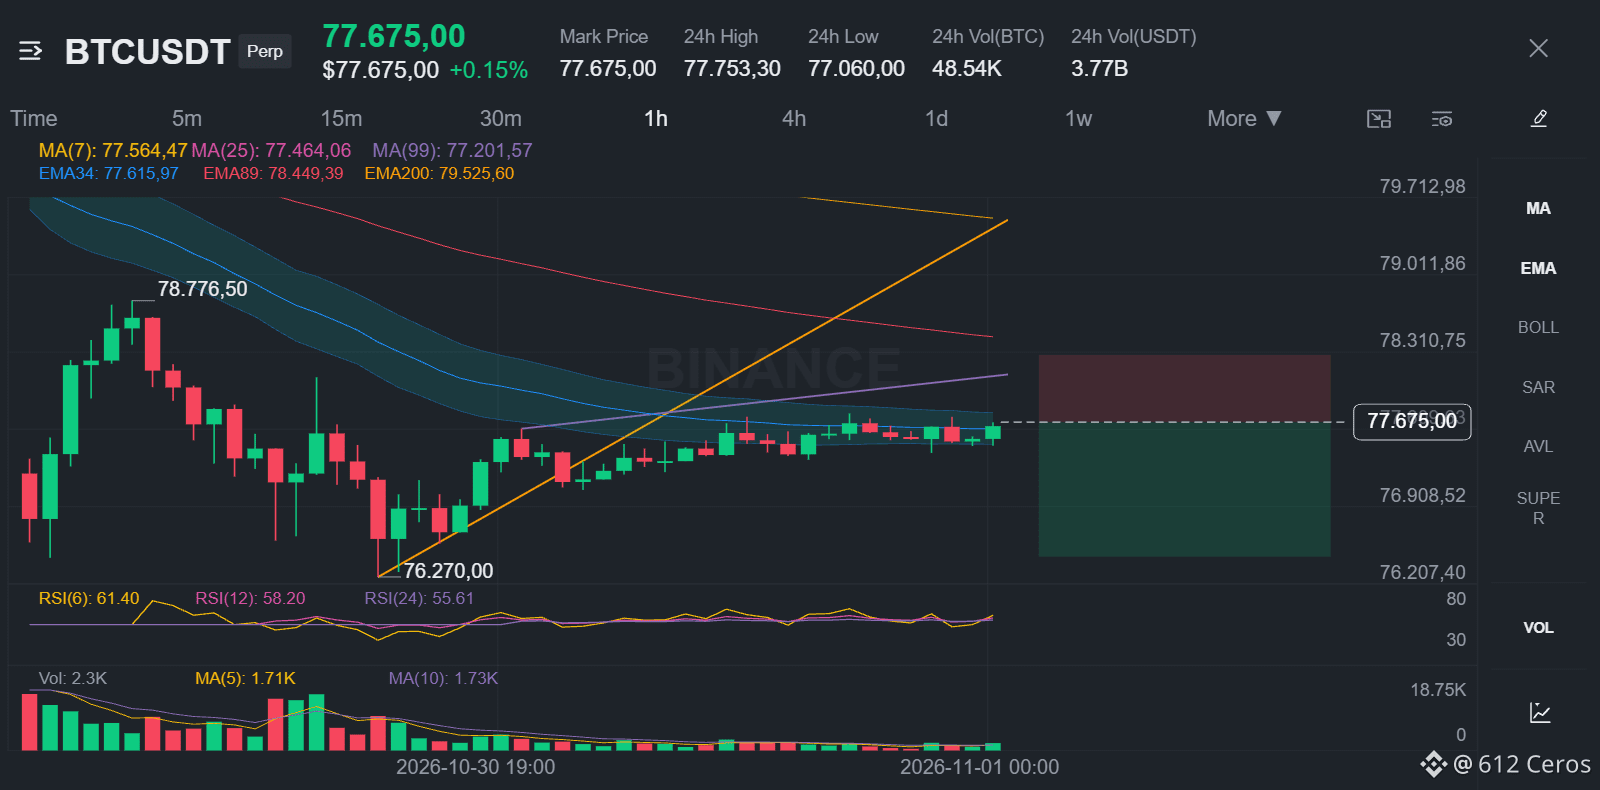
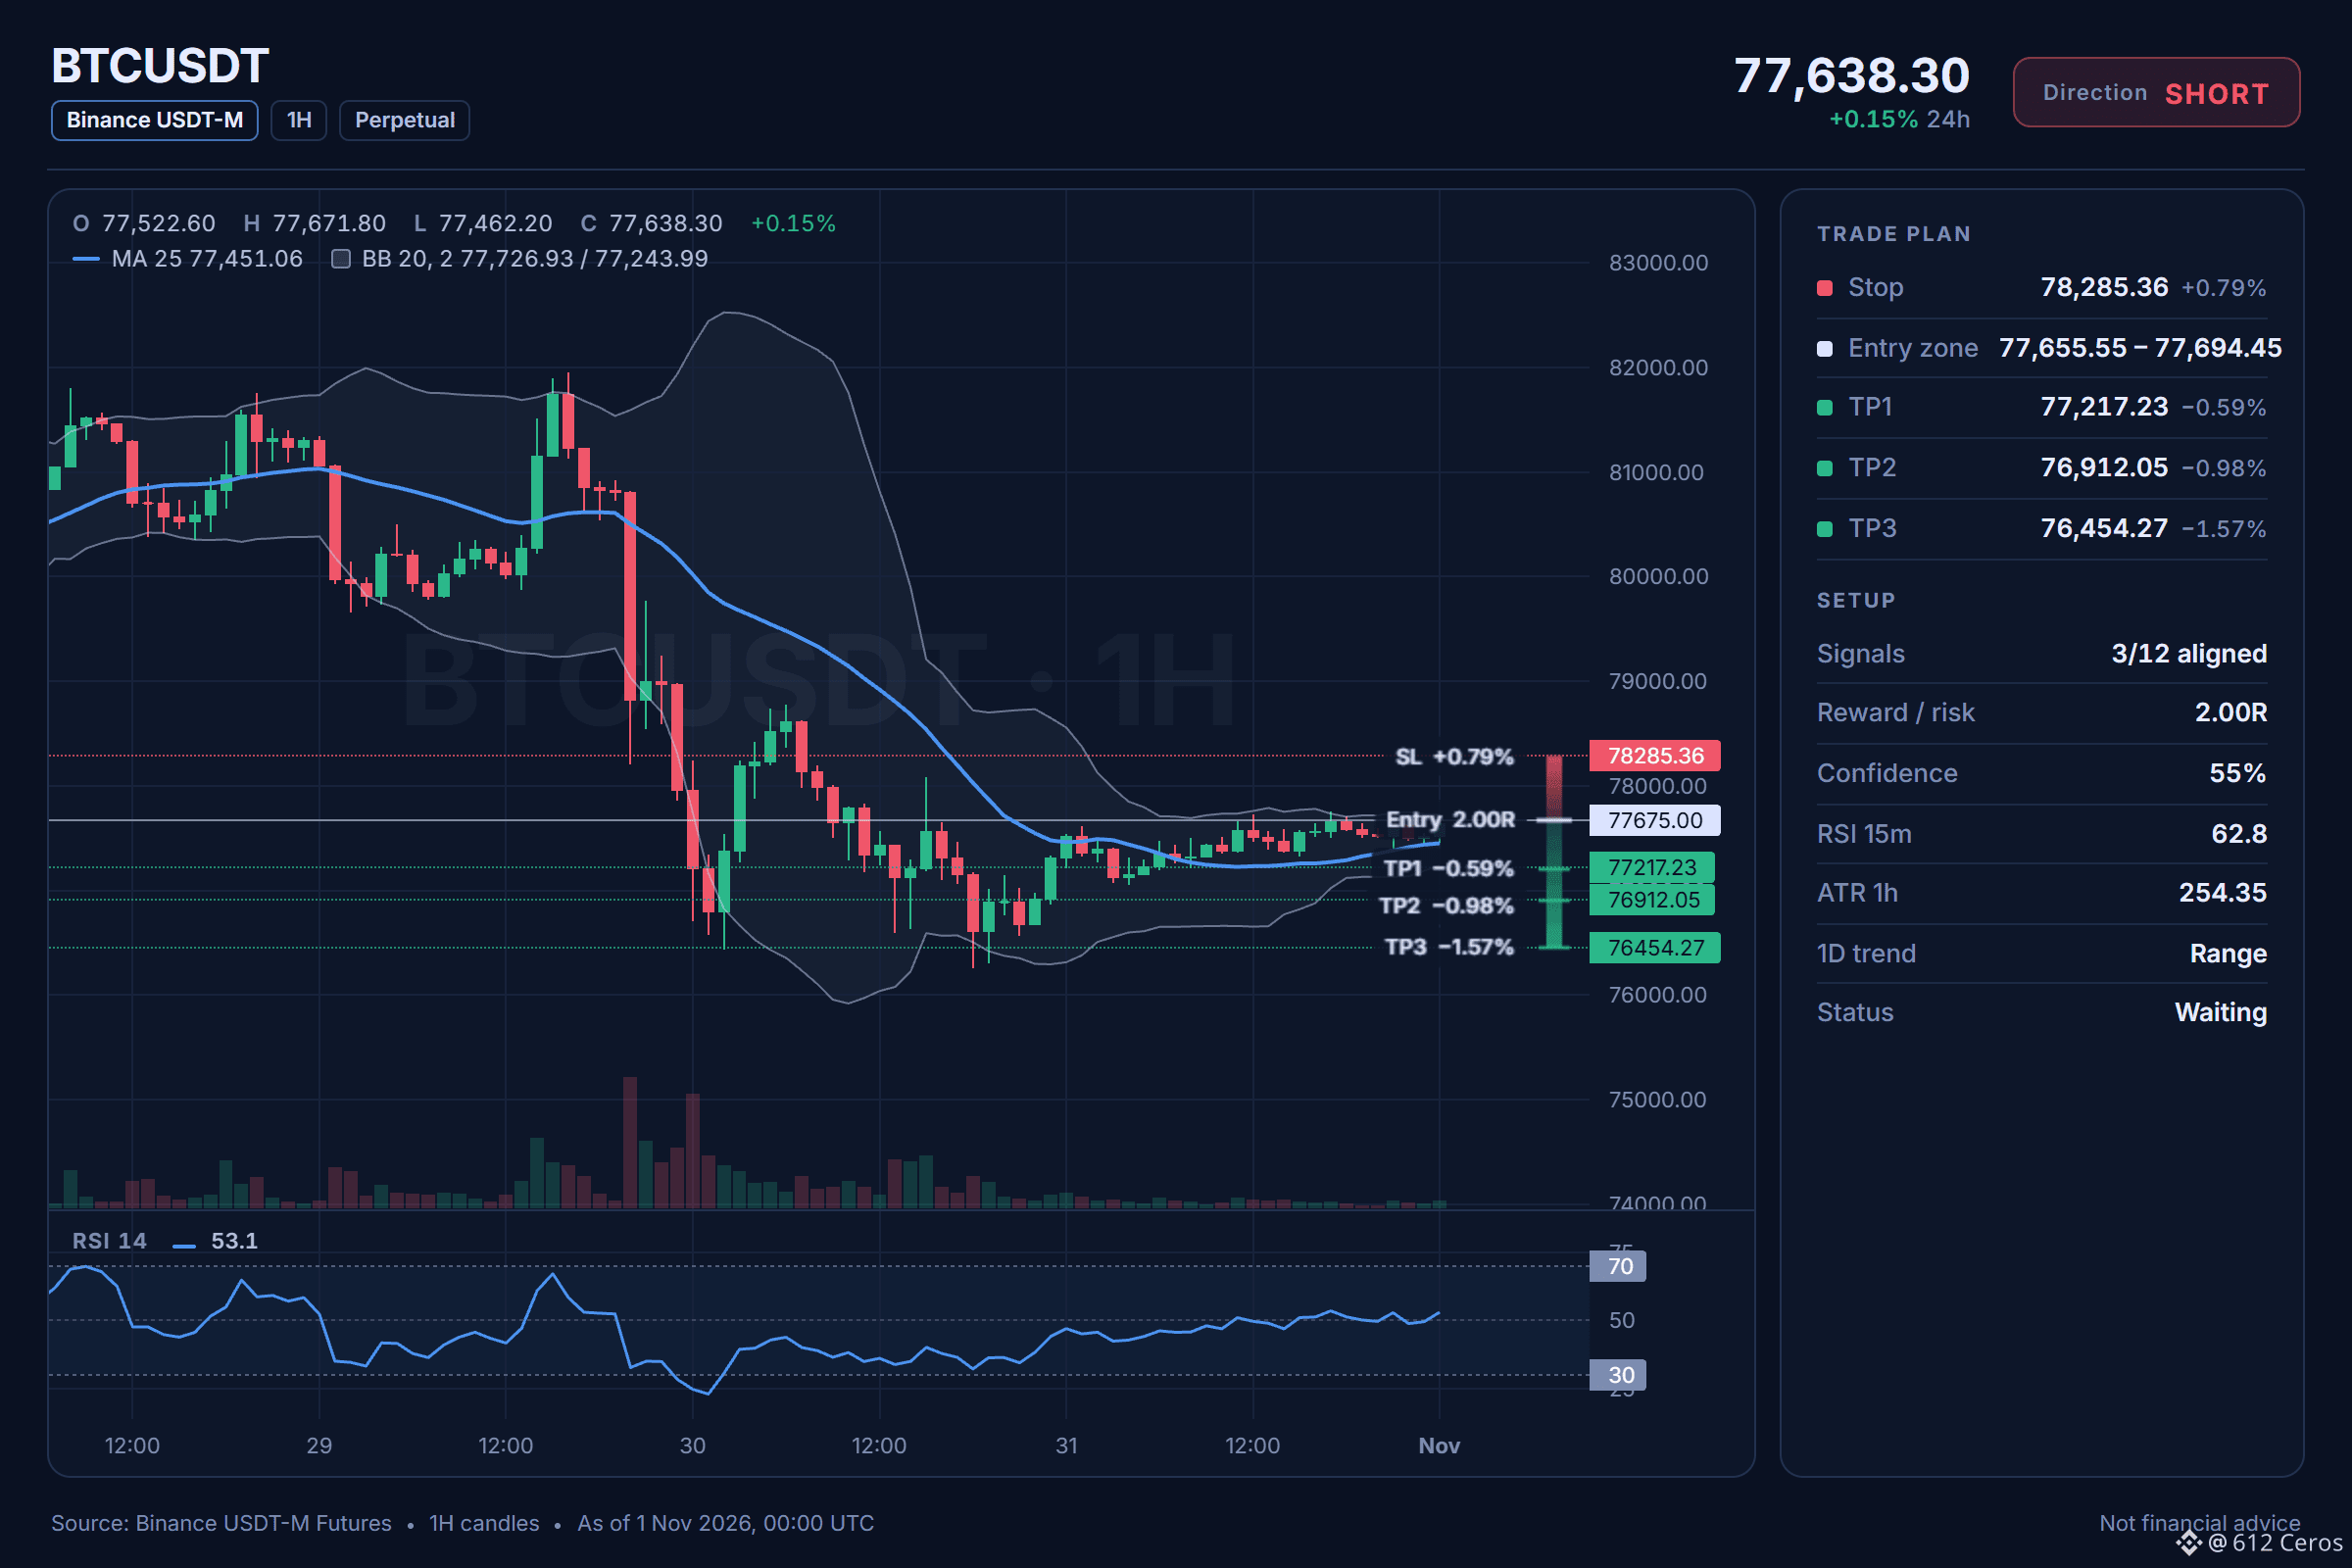
🔴 SHORT $BTC /USDT: expecting price to go DOWN
Bias: SHORT · Leaning
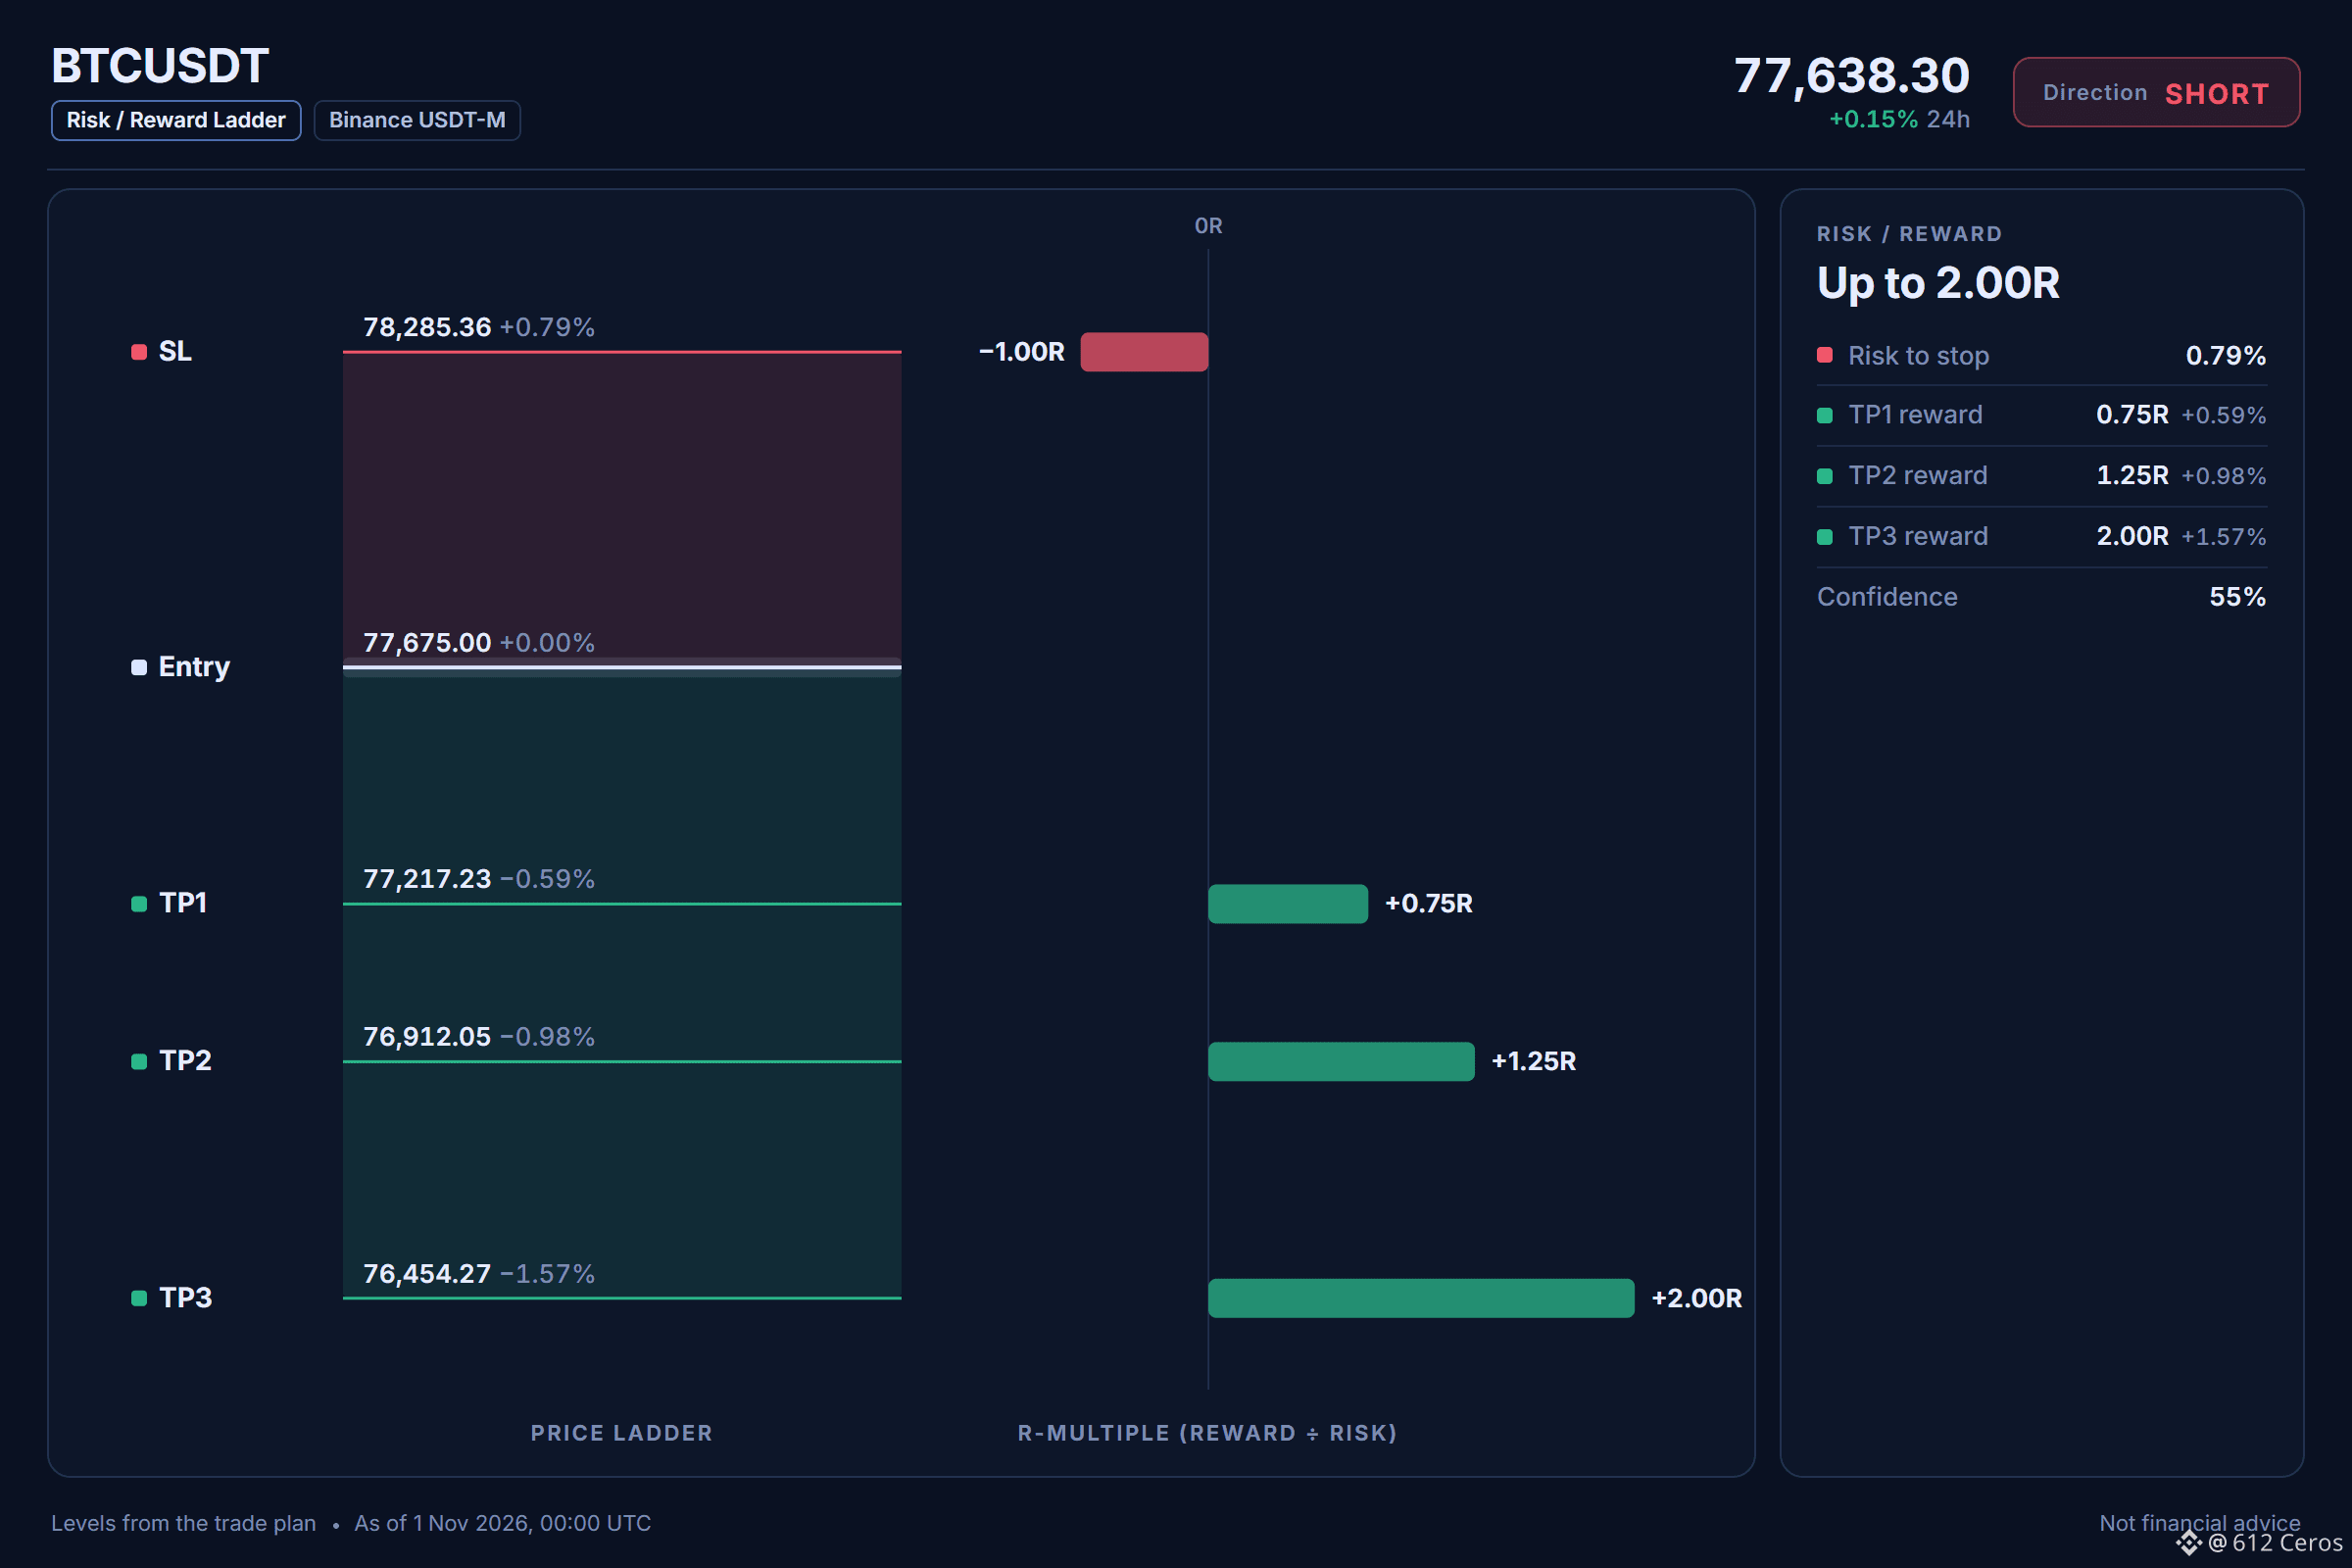
Entry: 77655.55 – 77694.45
TP1: 77217.23 (-0.6%)
TP2: 76912.05 (-1.0%)
TP3: 76454.27 (-1.6%)
SL: 78285.36 (+0.8%)
Plan: enter only inside the zone, close 50% at TP1, 25% at TP2, 25% at TP3, and move the stop to entry after TP1.
Note: moderate conviction only, keep size light.
Why SHORT? What I checked: 3/12 agree, 2 against.
• 4h trend down (below EMA50 & EMA200)
• 1h trend down (below EMA50 & EMA200)
• Sellers have the momentum (4h RSI 38.6)
Watch: BTC is rising, this coin follows (corr 1.00)
Watch: The idea is wrong if price reaches the stop at 78285.36
Net read: The 4h trend is down with bearish momentum, but BTC is rising and short-term buyers are pressing, so conviction is moderate.
Where do you see this short invalidating?
Chart with every level below.
{future}(BTCUSDT)
📲 Want more of my latest signals? Join me here:
[https://app.binance.com/uni-qr/D26WbL9t](https://app.binance.com/uni-qr/D26WbL9t)
⚠️ Personal market analysis only. NFA — manage risk and DYOR.
Educational content, not investment advice or a recommendation to buy, sell, deposit, or withdraw any asset. No paid promotion or referral/affiliate links.
BTC does not always follow its own trend.
🔴 SHORT $BTC /USDT: expecting price to go DOWN
Bias: SHORT · Leaning
Entry: 77655.55 – 77694.45
TP1: 77217.23 (-0.6%)
TP2: 76912.05 (-1.0%)
TP3: 76454.27 (-1.6%)
SL: 78285.36 (+0.8%)
Plan: enter only inside the zone, close 50% at TP1, 25% at TP2, 25% at TP3, and move the stop to entry after TP1.
Note: moderate conviction only, keep size light.
Why SHORT? What I checked: 3/12 agree, 2 against.
• 4h trend down (below EMA50 & EMA200)
• 1h trend down (below EMA50 & EMA200)
• Sellers have the momentum (4h RSI 38.6)
Watch: BTC is rising, this coin follows (corr 1.00)
Watch: The idea is wrong if price reaches the stop at 78285.36
Net read: The 4h trend is down with bearish momentum, but BTC is rising and short-term buyers are pressing, so conviction is moderate.
Where do you see this short invalidating?
Chart with every level below.
📲 Want more of my latest signals? Join me here:
https://app.binance.com/uni-qr/D26WbL9t
⚠️ Personal market analysis only. NFA — manage risk and DYOR.
Educational content, not investment advice or a recommendation to buy, sell, deposit, or withdraw any asset. No paid promotion or referral/affiliate links.
1
574
·
--
Bearish
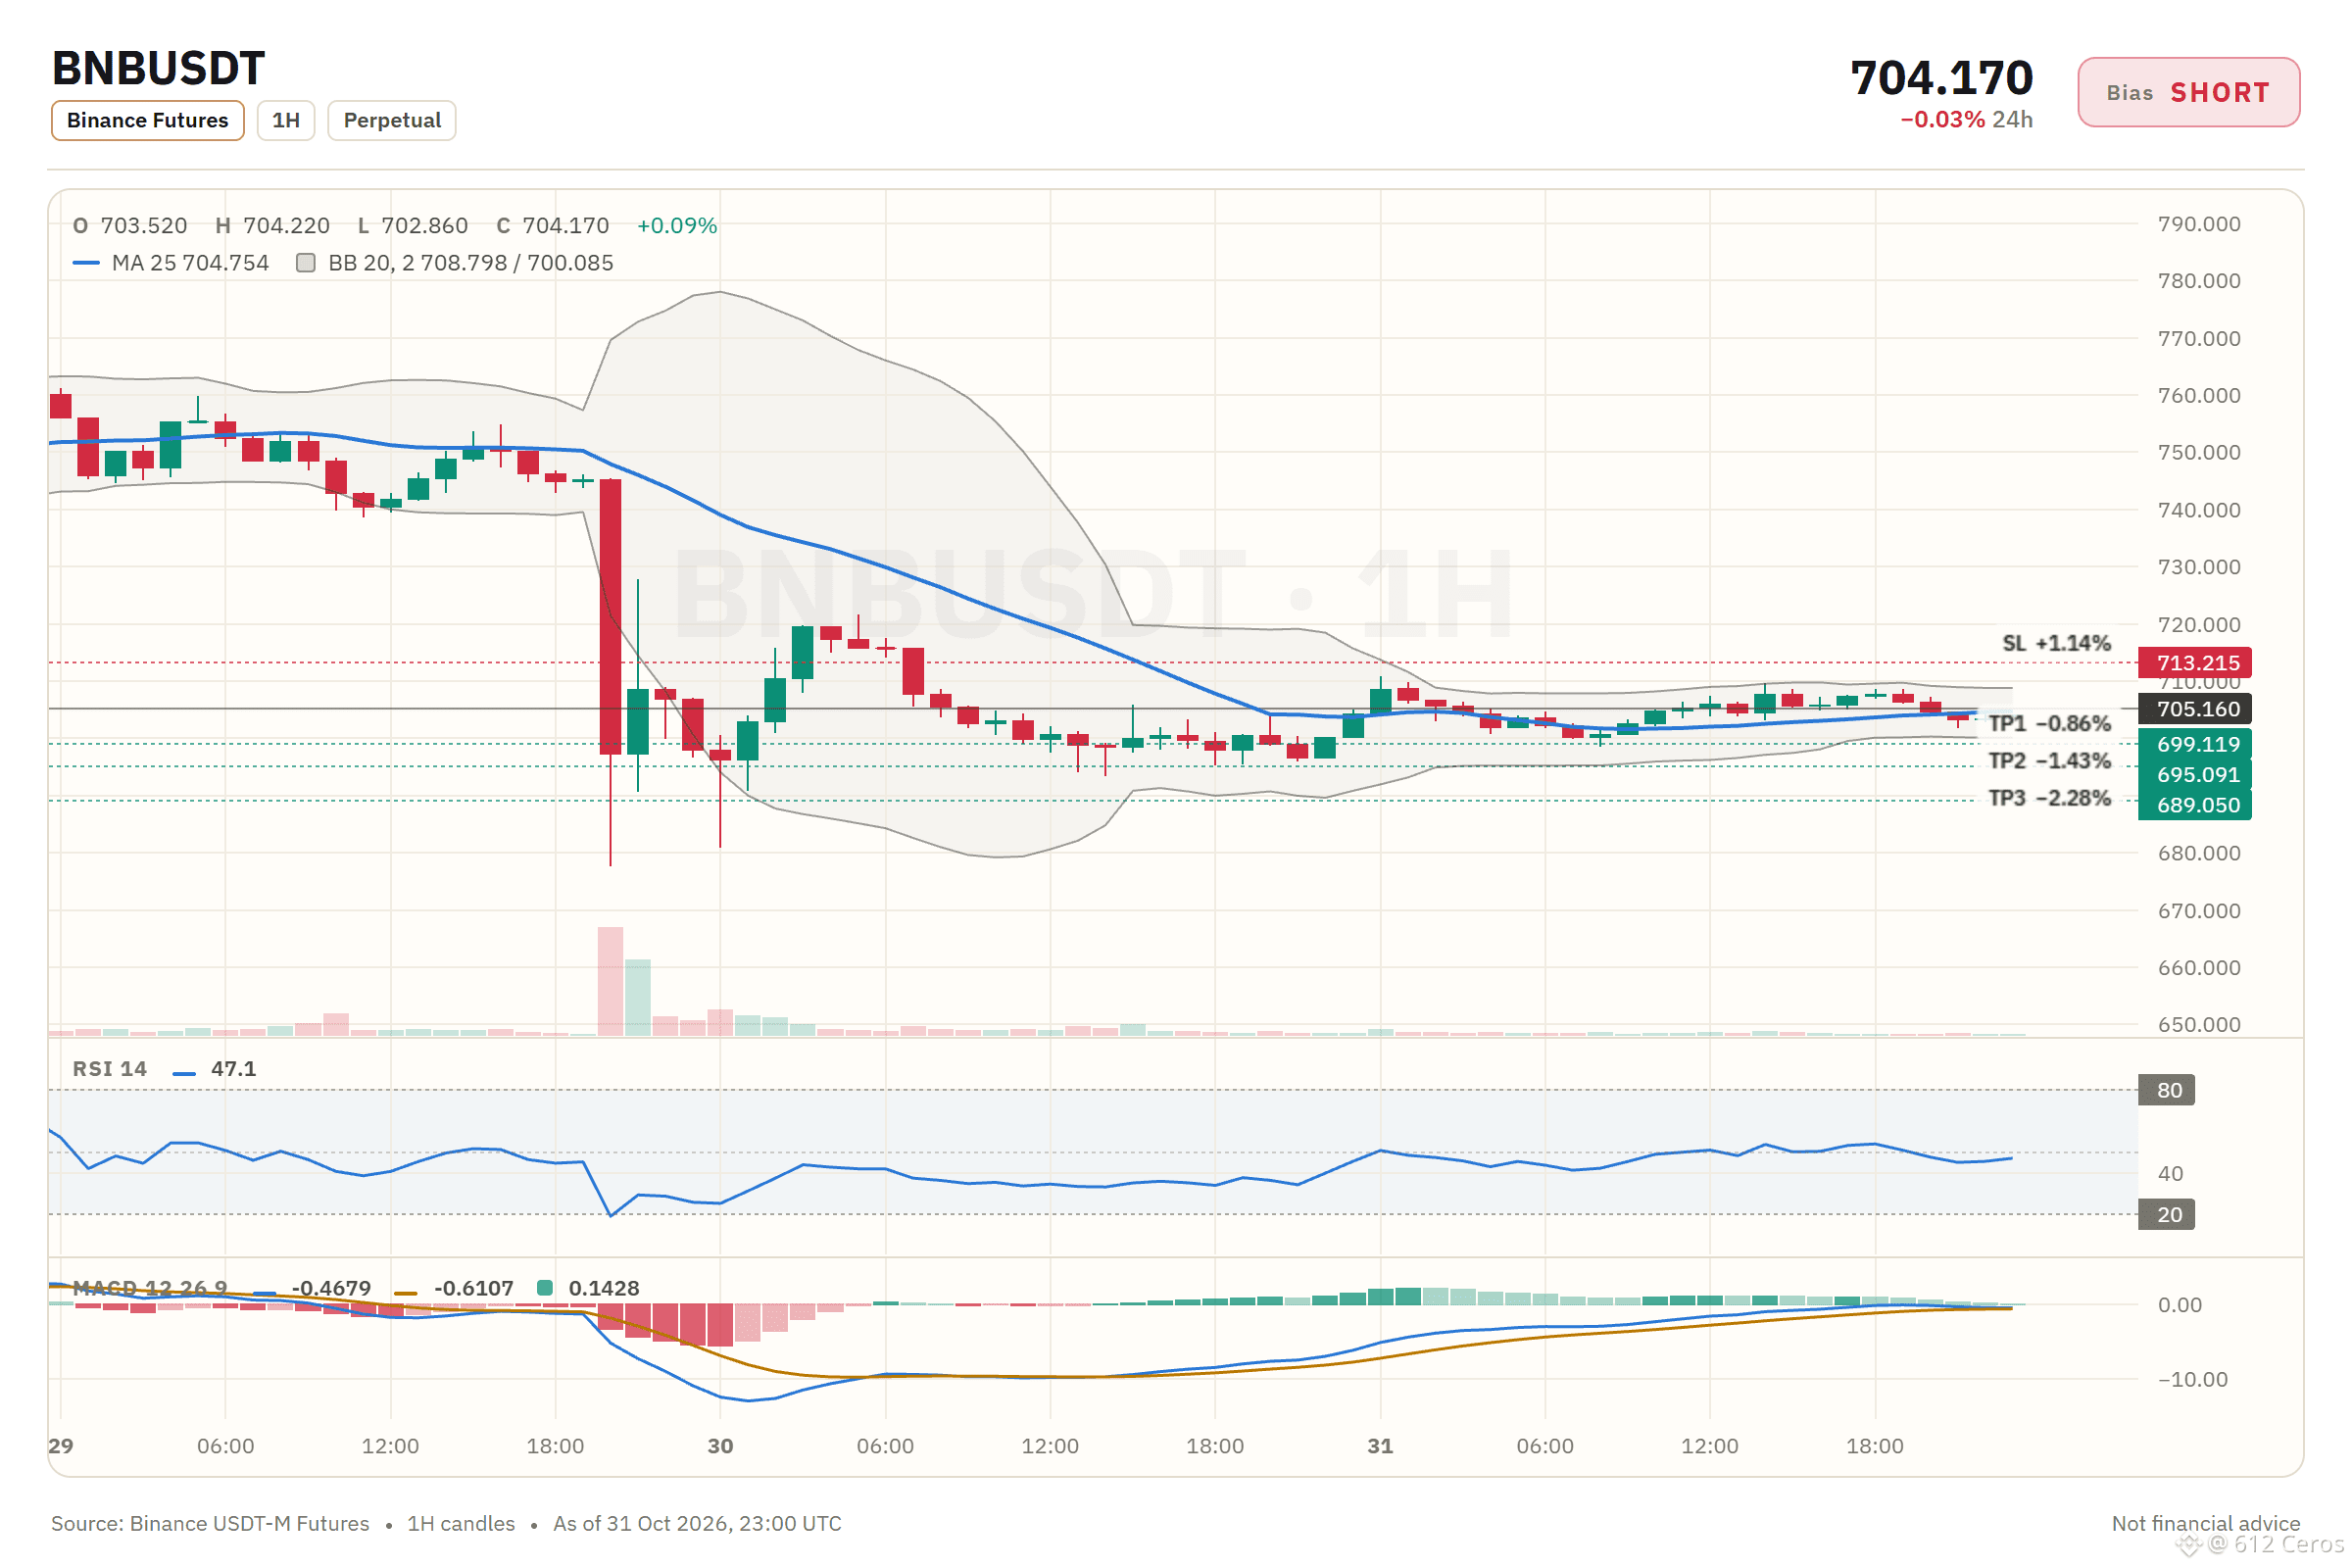
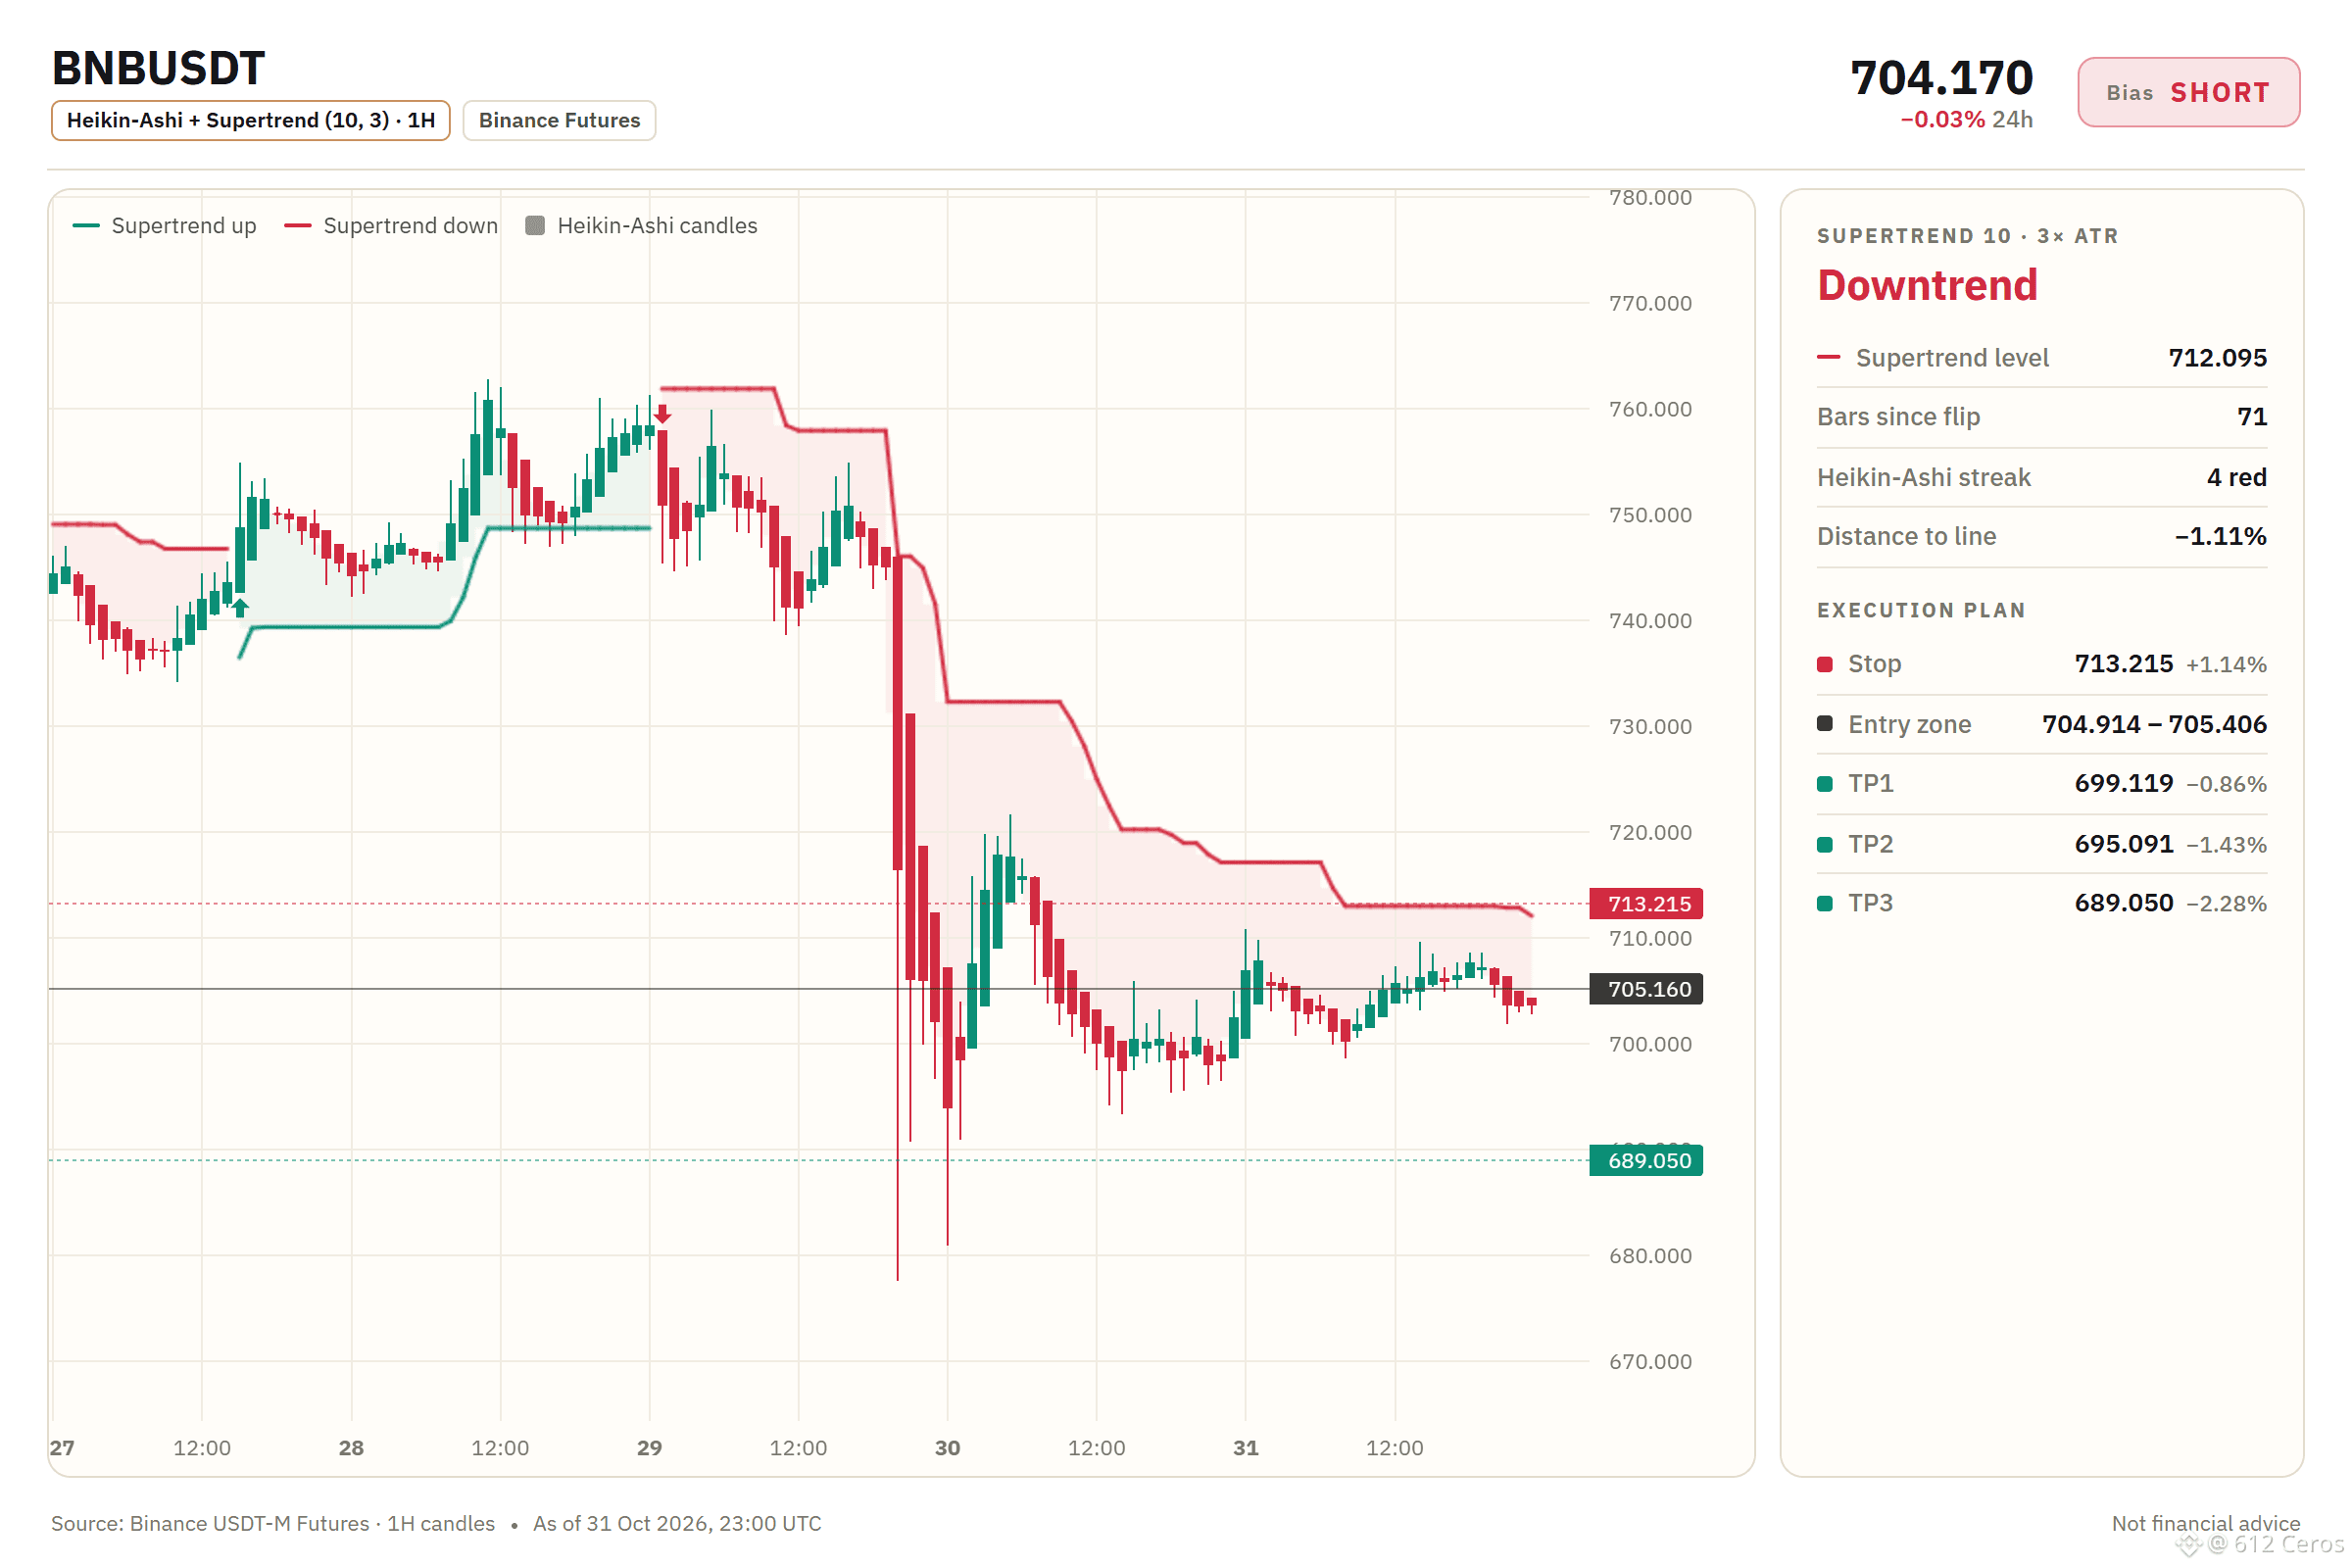
BNB is leaning bearish while most see a range.
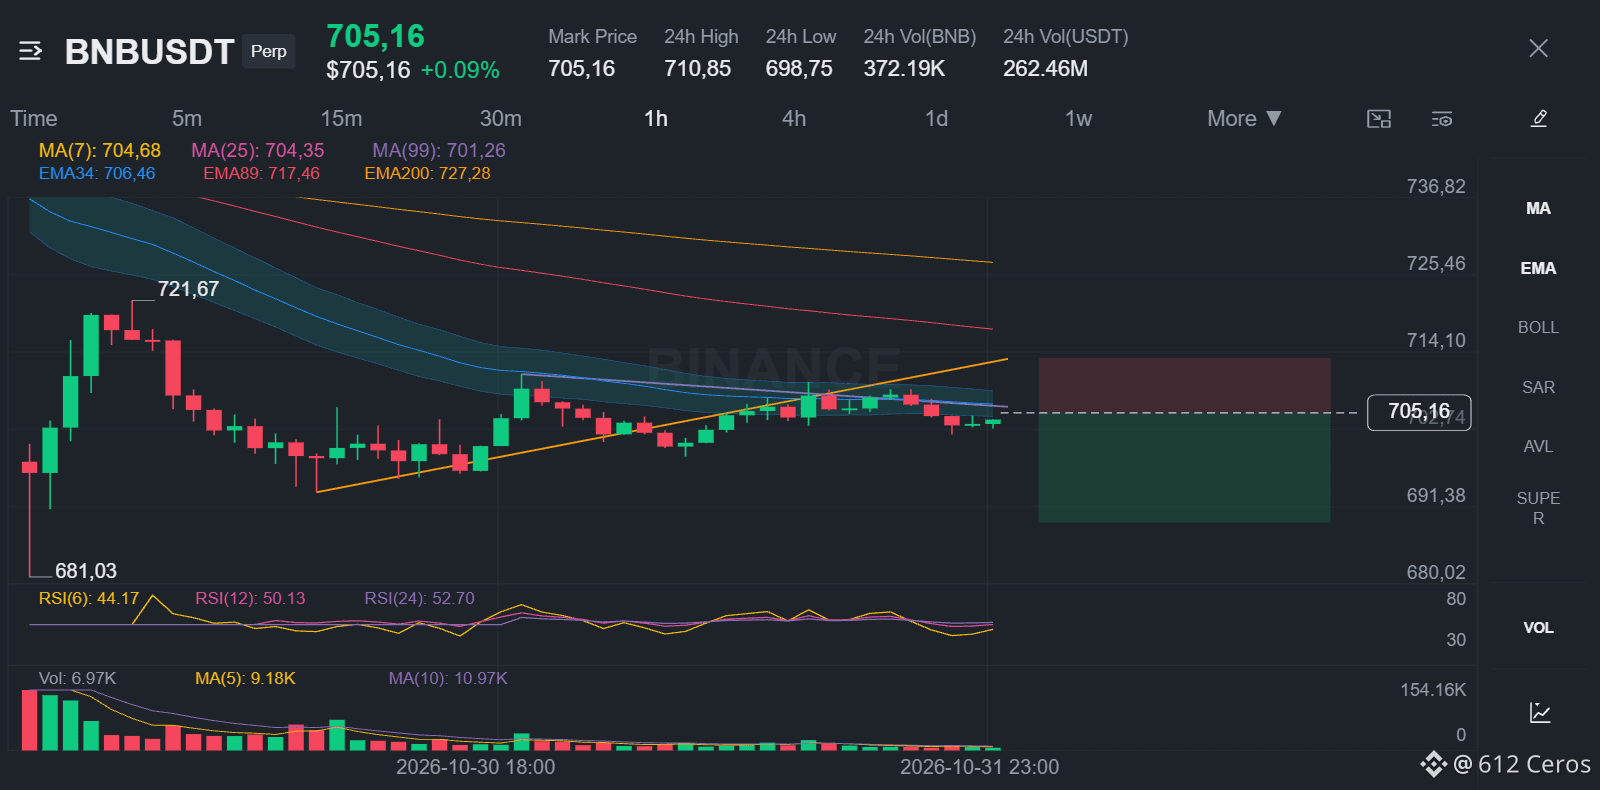
🔴 SHORT $BNB /USDT: expecting price to go DOWN
Bias: SHORT · Leaning
Entry: 704.914 – 705.406
TP1: 699.119 (-0.9%)
TP2: 695.091 (-1.4%)
TP3: 689.050 (-2.3%)
SL: 713.215 (+1.1%)
Plan: enter only inside the zone, close 50% at TP1, 25% at TP2, 25% at TP3, and move the stop to entry after TP1.
Note: moderate conviction only, keep size light.
Why SHORT? 3/12 signals agree, 0 against.
• 4h trend down (below EMA50 & EMA200)
• 1h trend down (below EMA50 & EMA200)
• Sellers have the momentum (4h RSI 39.4)
Q: Why short when the daily trend is a range?
A: The 4h price is below EMA50 and EMA200, so the swing trend is down.
Q: When would this setup be wrong?
A: If the 1h price pushes back above the entry level at 705.406.
What is your BNB level if you disagree?
Chart with every level below.
{future}(BNBUSDT)
📲 Want more of my latest signals? Join me here:
[https://app.binance.com/uni-qr/D26WbL9t](https://app.binance.com/uni-qr/D26WbL9t)
⚠️ Personal market analysis only. NFA — manage risk and DYOR.
Educational content, not investment advice or a recommendation to buy, sell, deposit, or withdraw any asset. No paid promotion or referral/affiliate links.
BNB is leaning bearish while most see a range.
🔴 SHORT $BNB /USDT: expecting price to go DOWN
Bias: SHORT · Leaning
Entry: 704.914 – 705.406
TP1: 699.119 (-0.9%)
TP2: 695.091 (-1.4%)
TP3: 689.050 (-2.3%)
SL: 713.215 (+1.1%)
Plan: enter only inside the zone, close 50% at TP1, 25% at TP2, 25% at TP3, and move the stop to entry after TP1.
Note: moderate conviction only, keep size light.
Why SHORT? 3/12 signals agree, 0 against.
• 4h trend down (below EMA50 & EMA200)
• 1h trend down (below EMA50 & EMA200)
• Sellers have the momentum (4h RSI 39.4)
Q: Why short when the daily trend is a range?
A: The 4h price is below EMA50 and EMA200, so the swing trend is down.
Q: When would this setup be wrong?
A: If the 1h price pushes back above the entry level at 705.406.
What is your BNB level if you disagree?
Chart with every level below.
📲 Want more of my latest signals? Join me here:
https://app.binance.com/uni-qr/D26WbL9t
⚠️ Personal market analysis only. NFA — manage risk and DYOR.
Educational content, not investment advice or a recommendation to buy, sell, deposit, or withdraw any asset. No paid promotion or referral/affiliate links.
657
·
--
Bullish
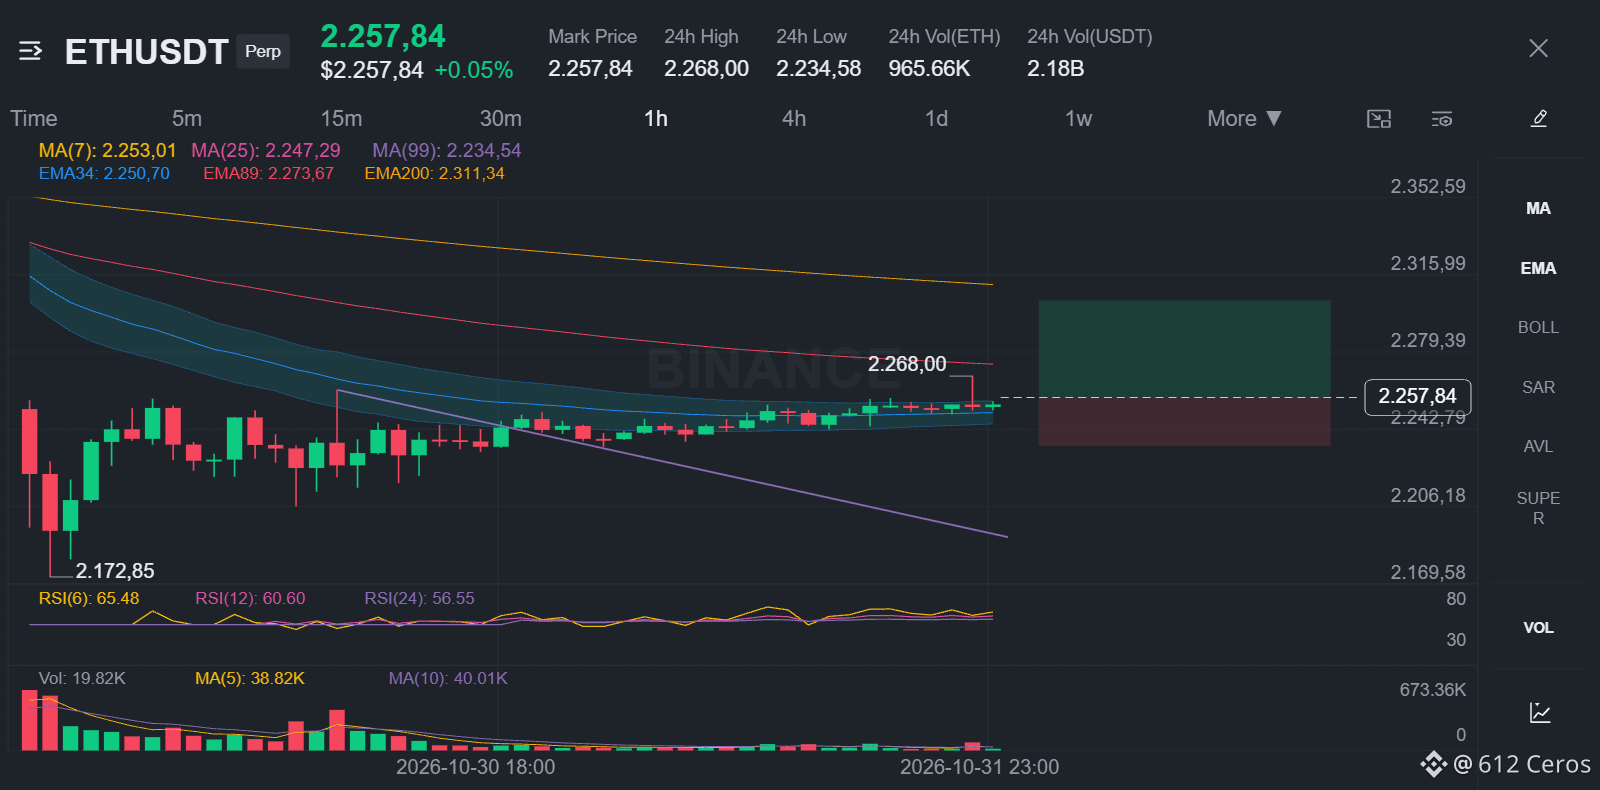
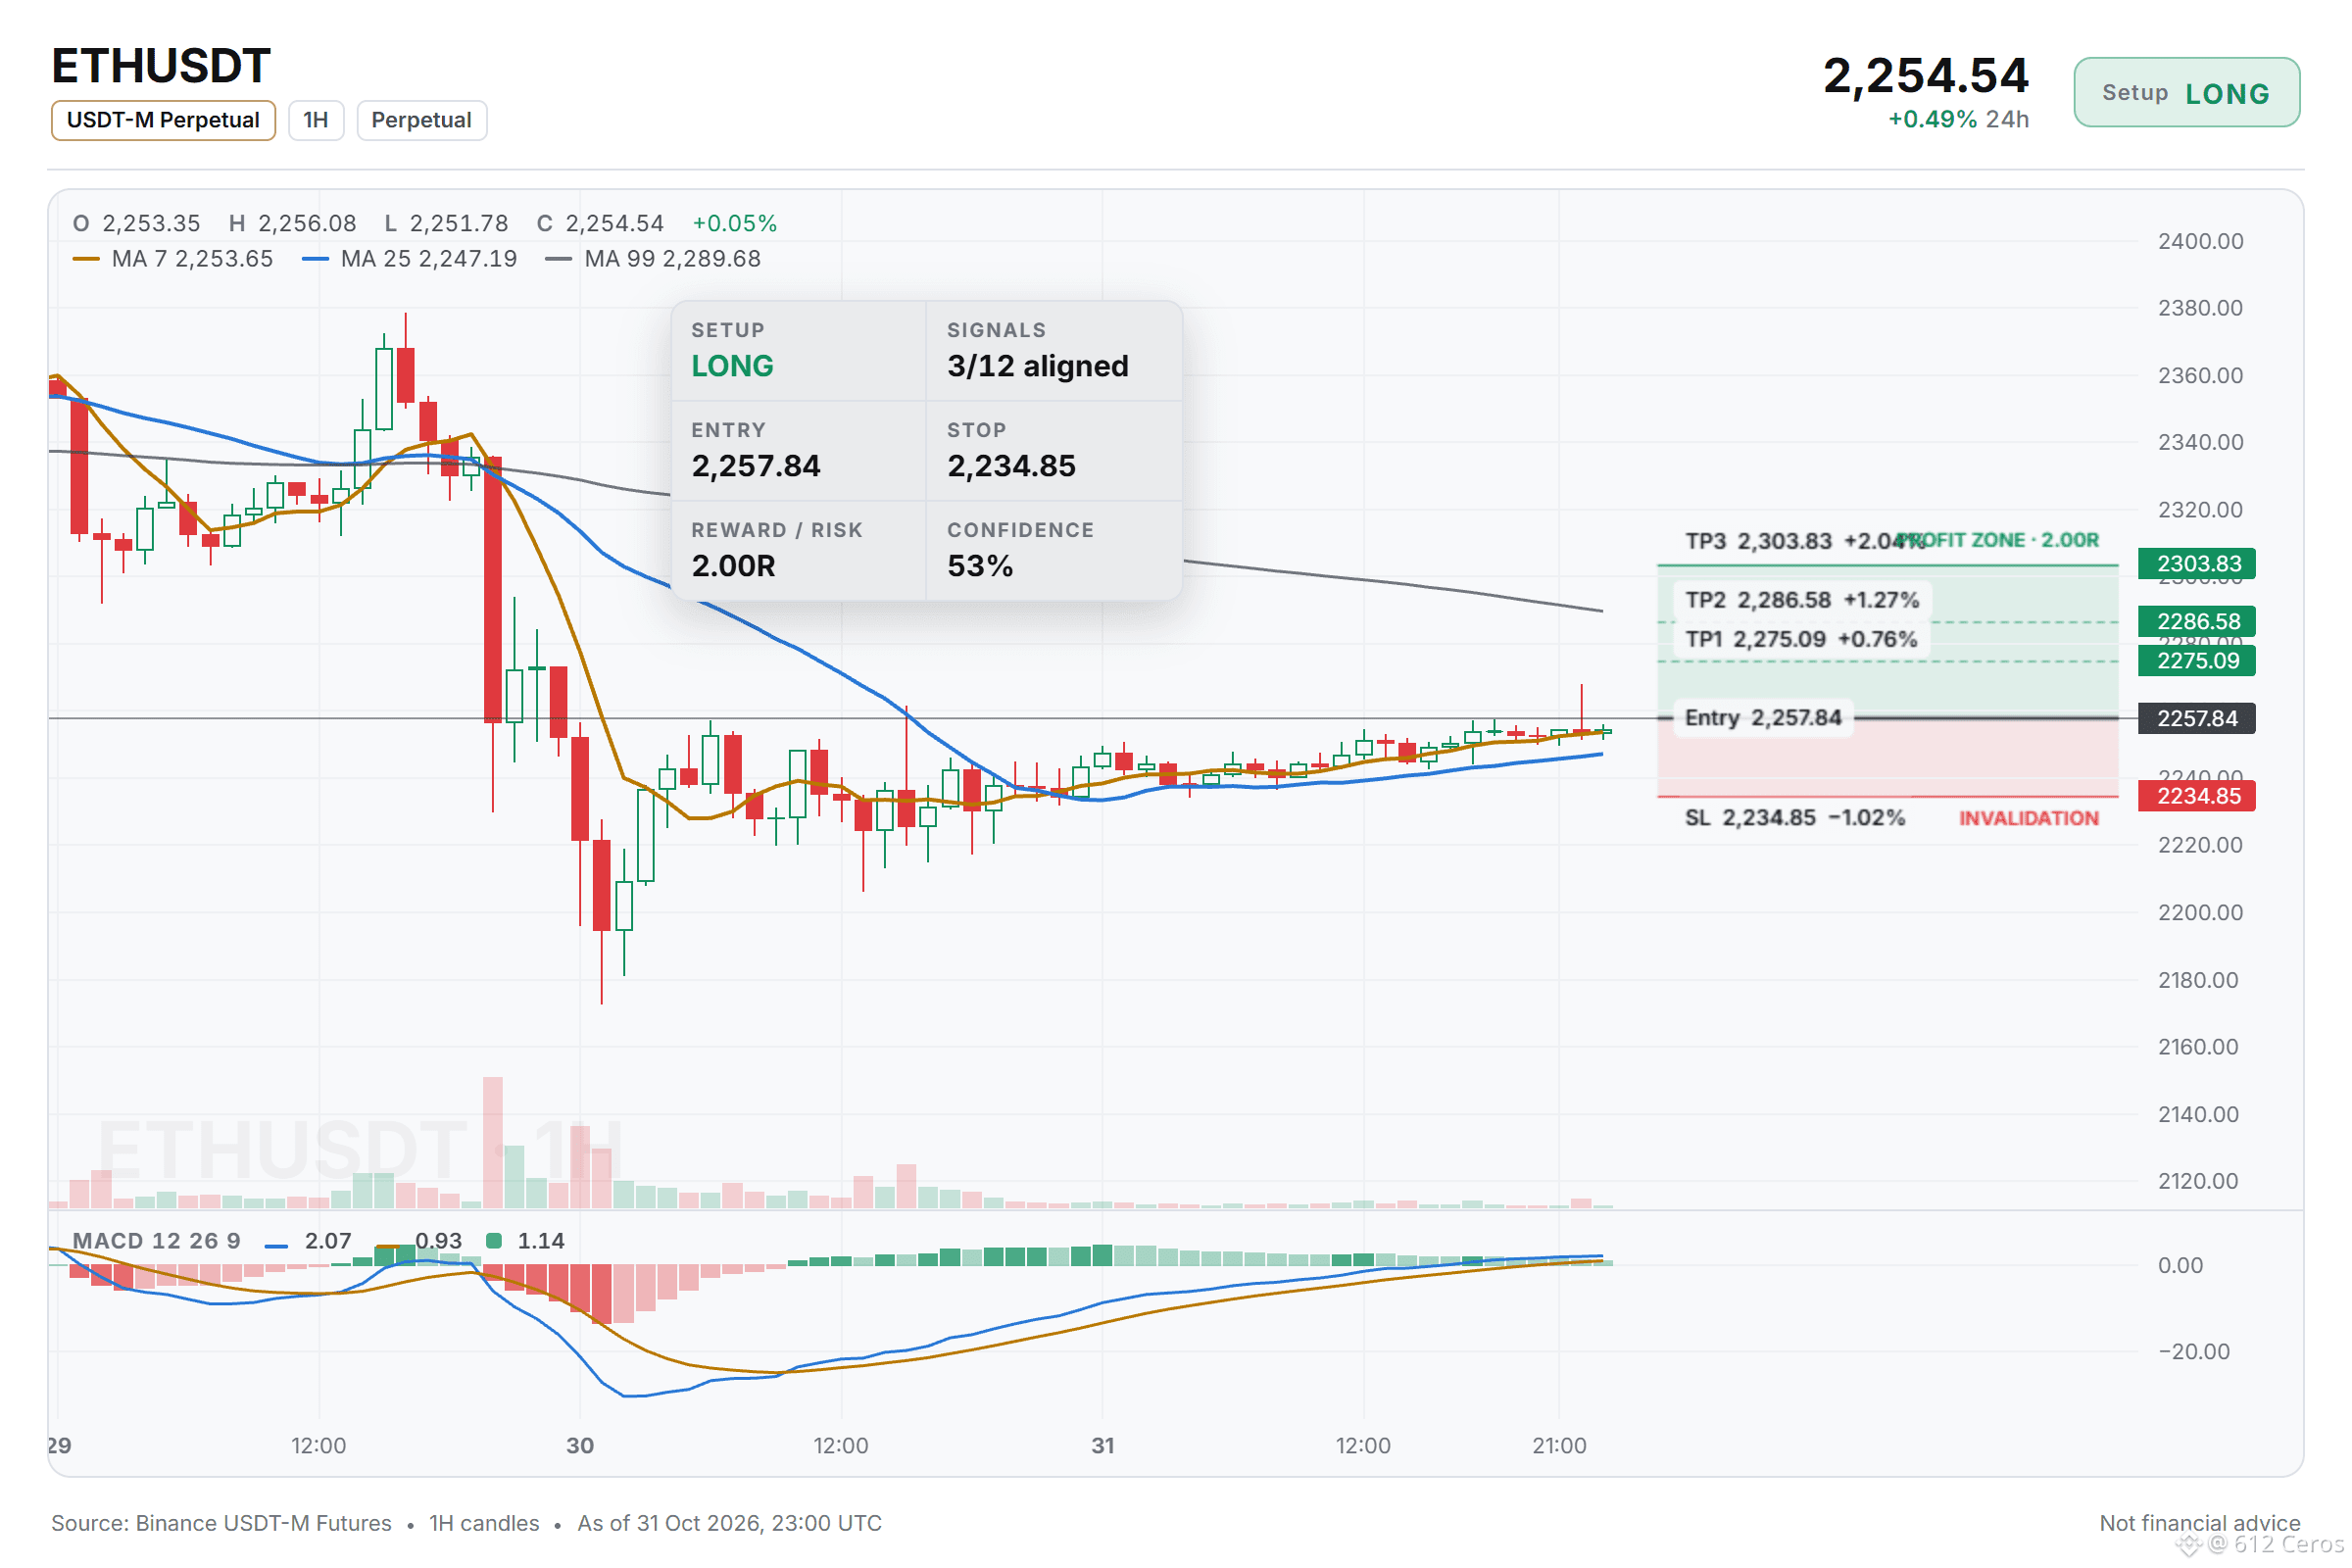
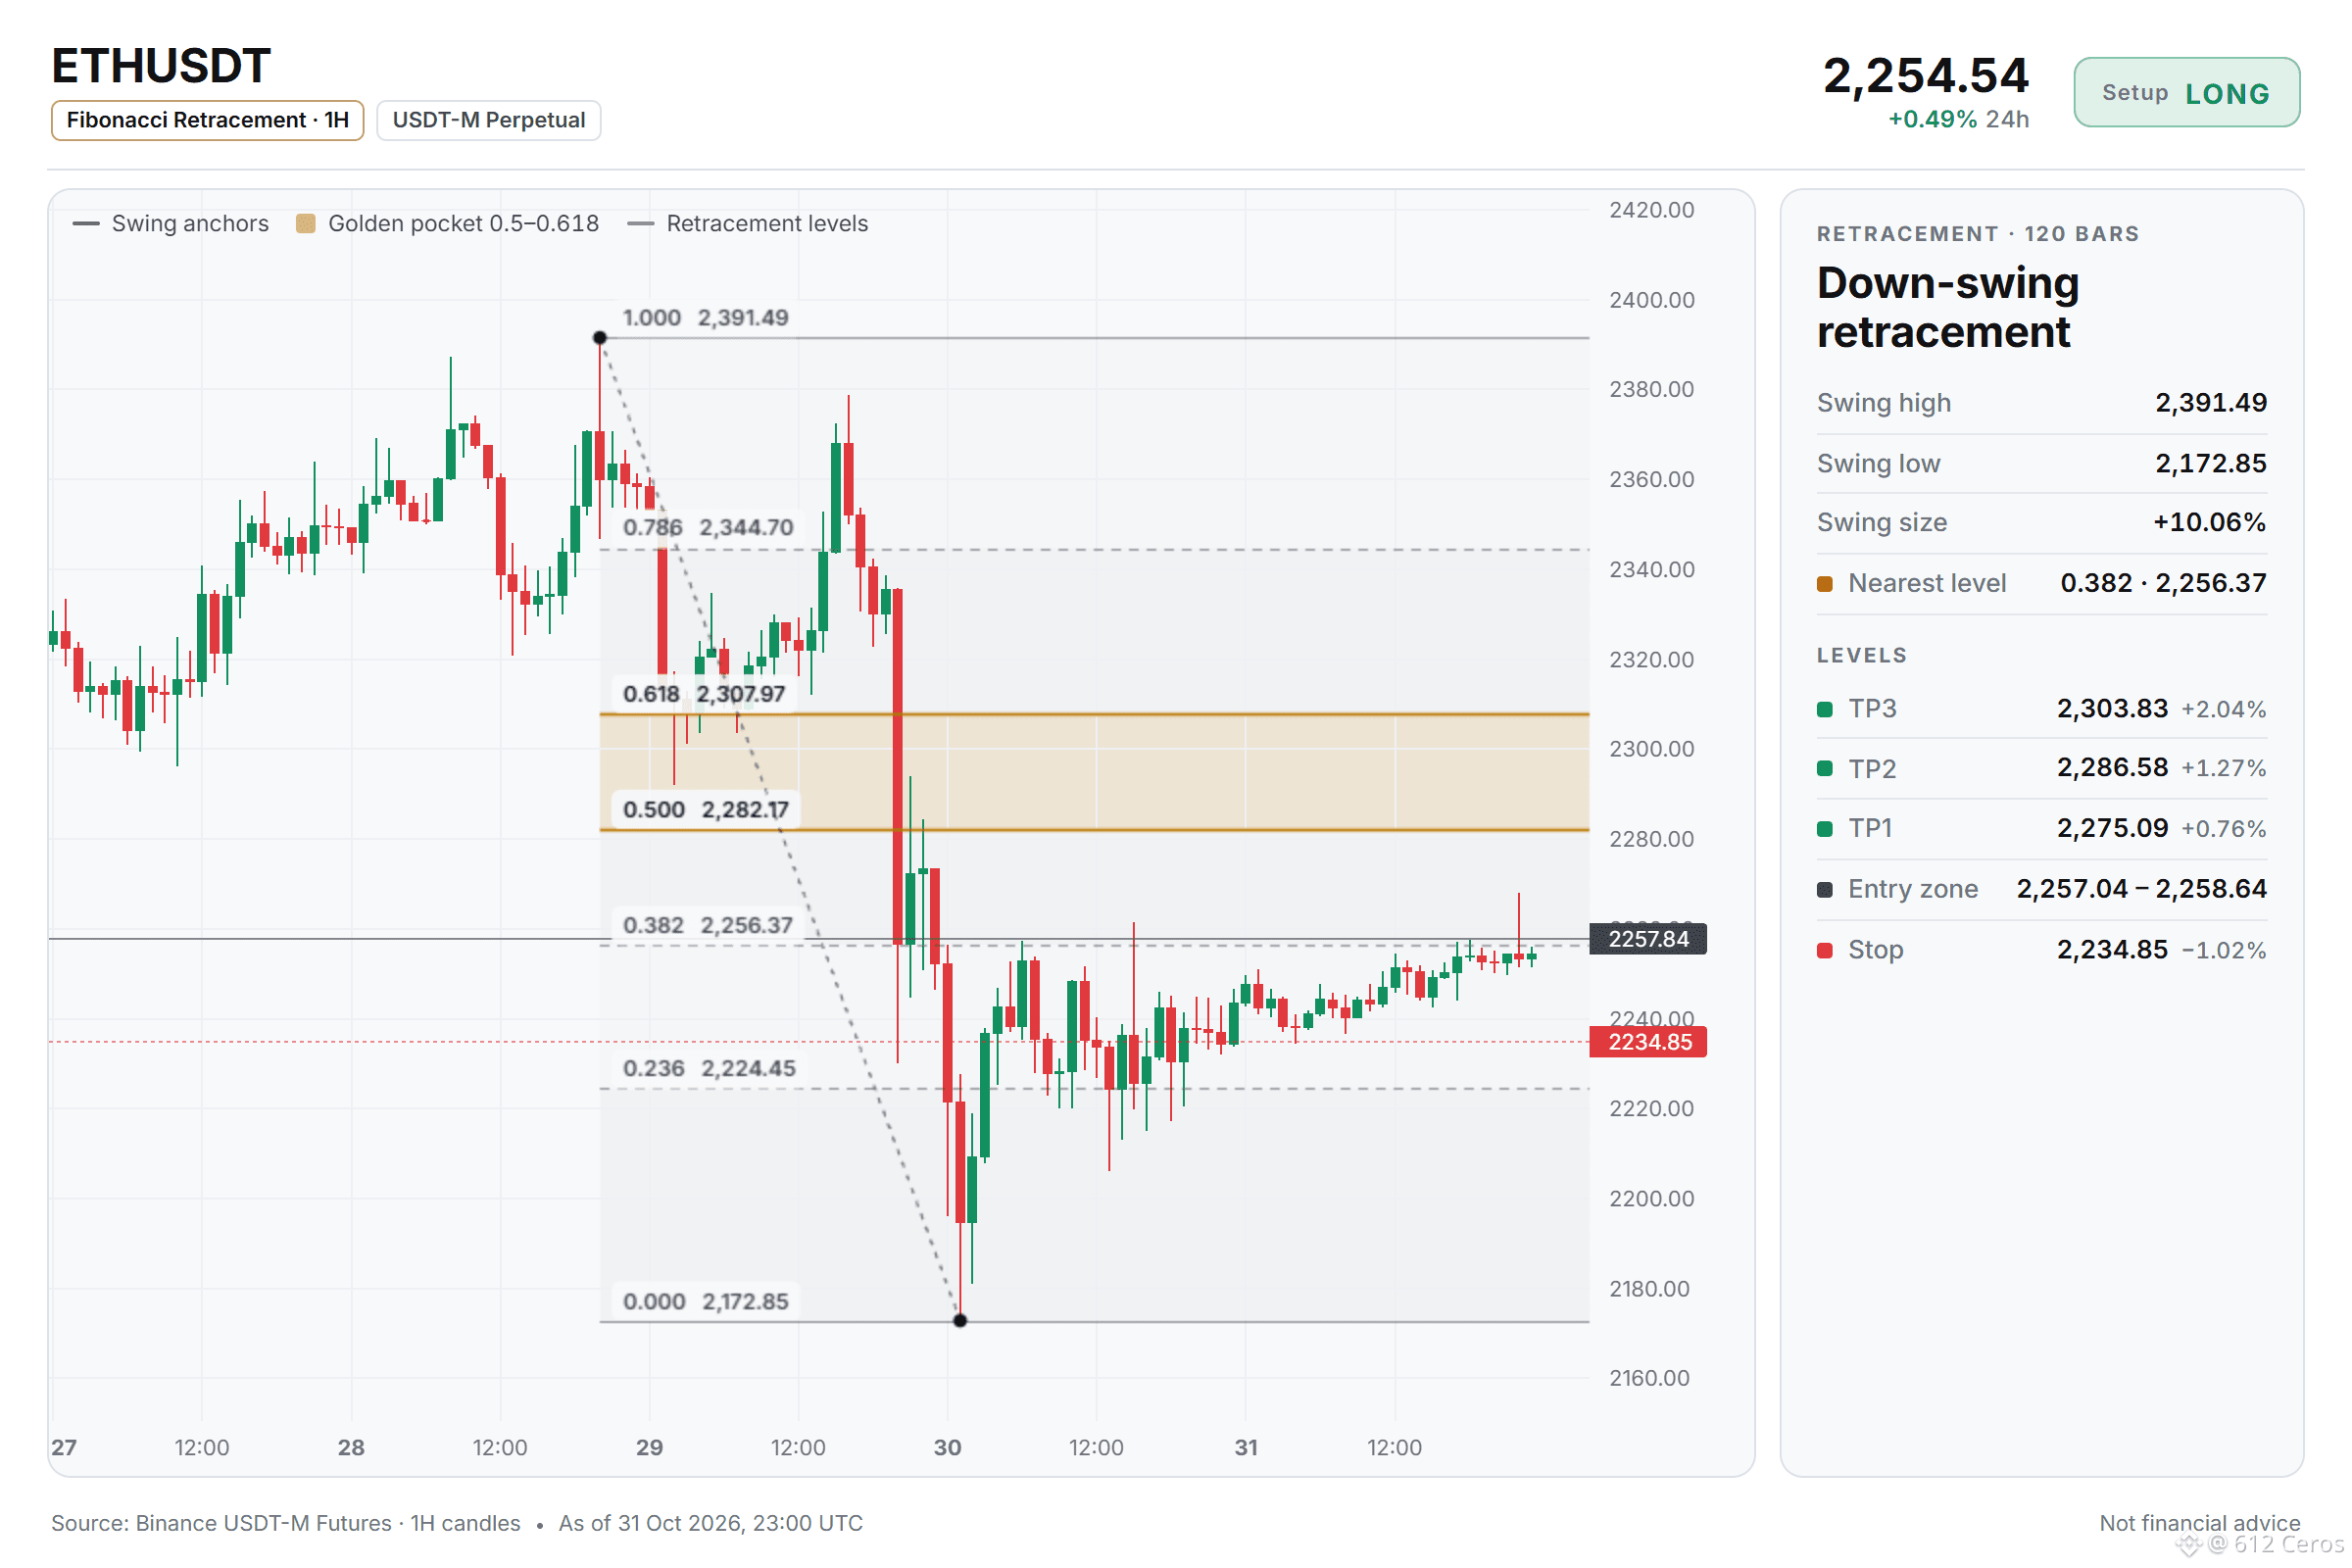
ETH is leaning bullish, but not everyone agrees.
🟢 LONG $ETH /USDT: expecting price to go UP
Bias: LONG · Leaning
Entry: 2257.04 – 2258.64
TP1: 2275.09 (+0.8%)
TP2: 2286.58 (+1.3%)
TP3: 2303.83 (+2.0%)
SL: 2234.85 (-1.0%)
Plan: enter only inside the zone, close 50% at TP1, 25% at TP2, 25% at TP3, and move the stop to entry after TP1.
Note: moderate conviction only, keep size light.
Why LONG? 3/12 signals agree, 2 against.
• Buyers are driving the move (15m ADX 20.1)
• BTC is rising, this coin follows (corr 0.65)
• Buyers have the momentum (1h RSI 55.7)
Risk: 4h trend down (below EMA50 & EMA200)
In plain words:
The 1h price is around 2257.84, and the 1h RSI sits at 55.7, which means buyers still have some momentum. The daily trend is a range, so this long is a small move trade inside a broader sideways market.
Where would you place your long on ETH?
Chart with every level below.
{future}(ETHUSDT)
📲 Want more of my latest signals? Join me here:
[https://app.binance.com/uni-qr/D26WbL9t](https://app.binance.com/uni-qr/D26WbL9t)
⚠️ Personal market analysis only. NFA — manage risk and DYOR.
Educational content, not investment advice or a recommendation to buy, sell, deposit, or withdraw any asset. No paid promotion or referral/affiliate links.
ETH is leaning bullish, but not everyone agrees.
🟢 LONG $ETH /USDT: expecting price to go UP
Bias: LONG · Leaning
Entry: 2257.04 – 2258.64
TP1: 2275.09 (+0.8%)
TP2: 2286.58 (+1.3%)
TP3: 2303.83 (+2.0%)
SL: 2234.85 (-1.0%)
Plan: enter only inside the zone, close 50% at TP1, 25% at TP2, 25% at TP3, and move the stop to entry after TP1.
Note: moderate conviction only, keep size light.
Why LONG? 3/12 signals agree, 2 against.
• Buyers are driving the move (15m ADX 20.1)
• BTC is rising, this coin follows (corr 0.65)
• Buyers have the momentum (1h RSI 55.7)
Risk: 4h trend down (below EMA50 & EMA200)
In plain words:
The 1h price is around 2257.84, and the 1h RSI sits at 55.7, which means buyers still have some momentum. The daily trend is a range, so this long is a small move trade inside a broader sideways market.
Where would you place your long on ETH?
Chart with every level below.
📲 Want more of my latest signals? Join me here:
https://app.binance.com/uni-qr/D26WbL9t
⚠️ Personal market analysis only. NFA — manage risk and DYOR.
Educational content, not investment advice or a recommendation to buy, sell, deposit, or withdraw any asset. No paid promotion or referral/affiliate links.
1
586
·
--
Bearish
Is SOL ready to slide again?
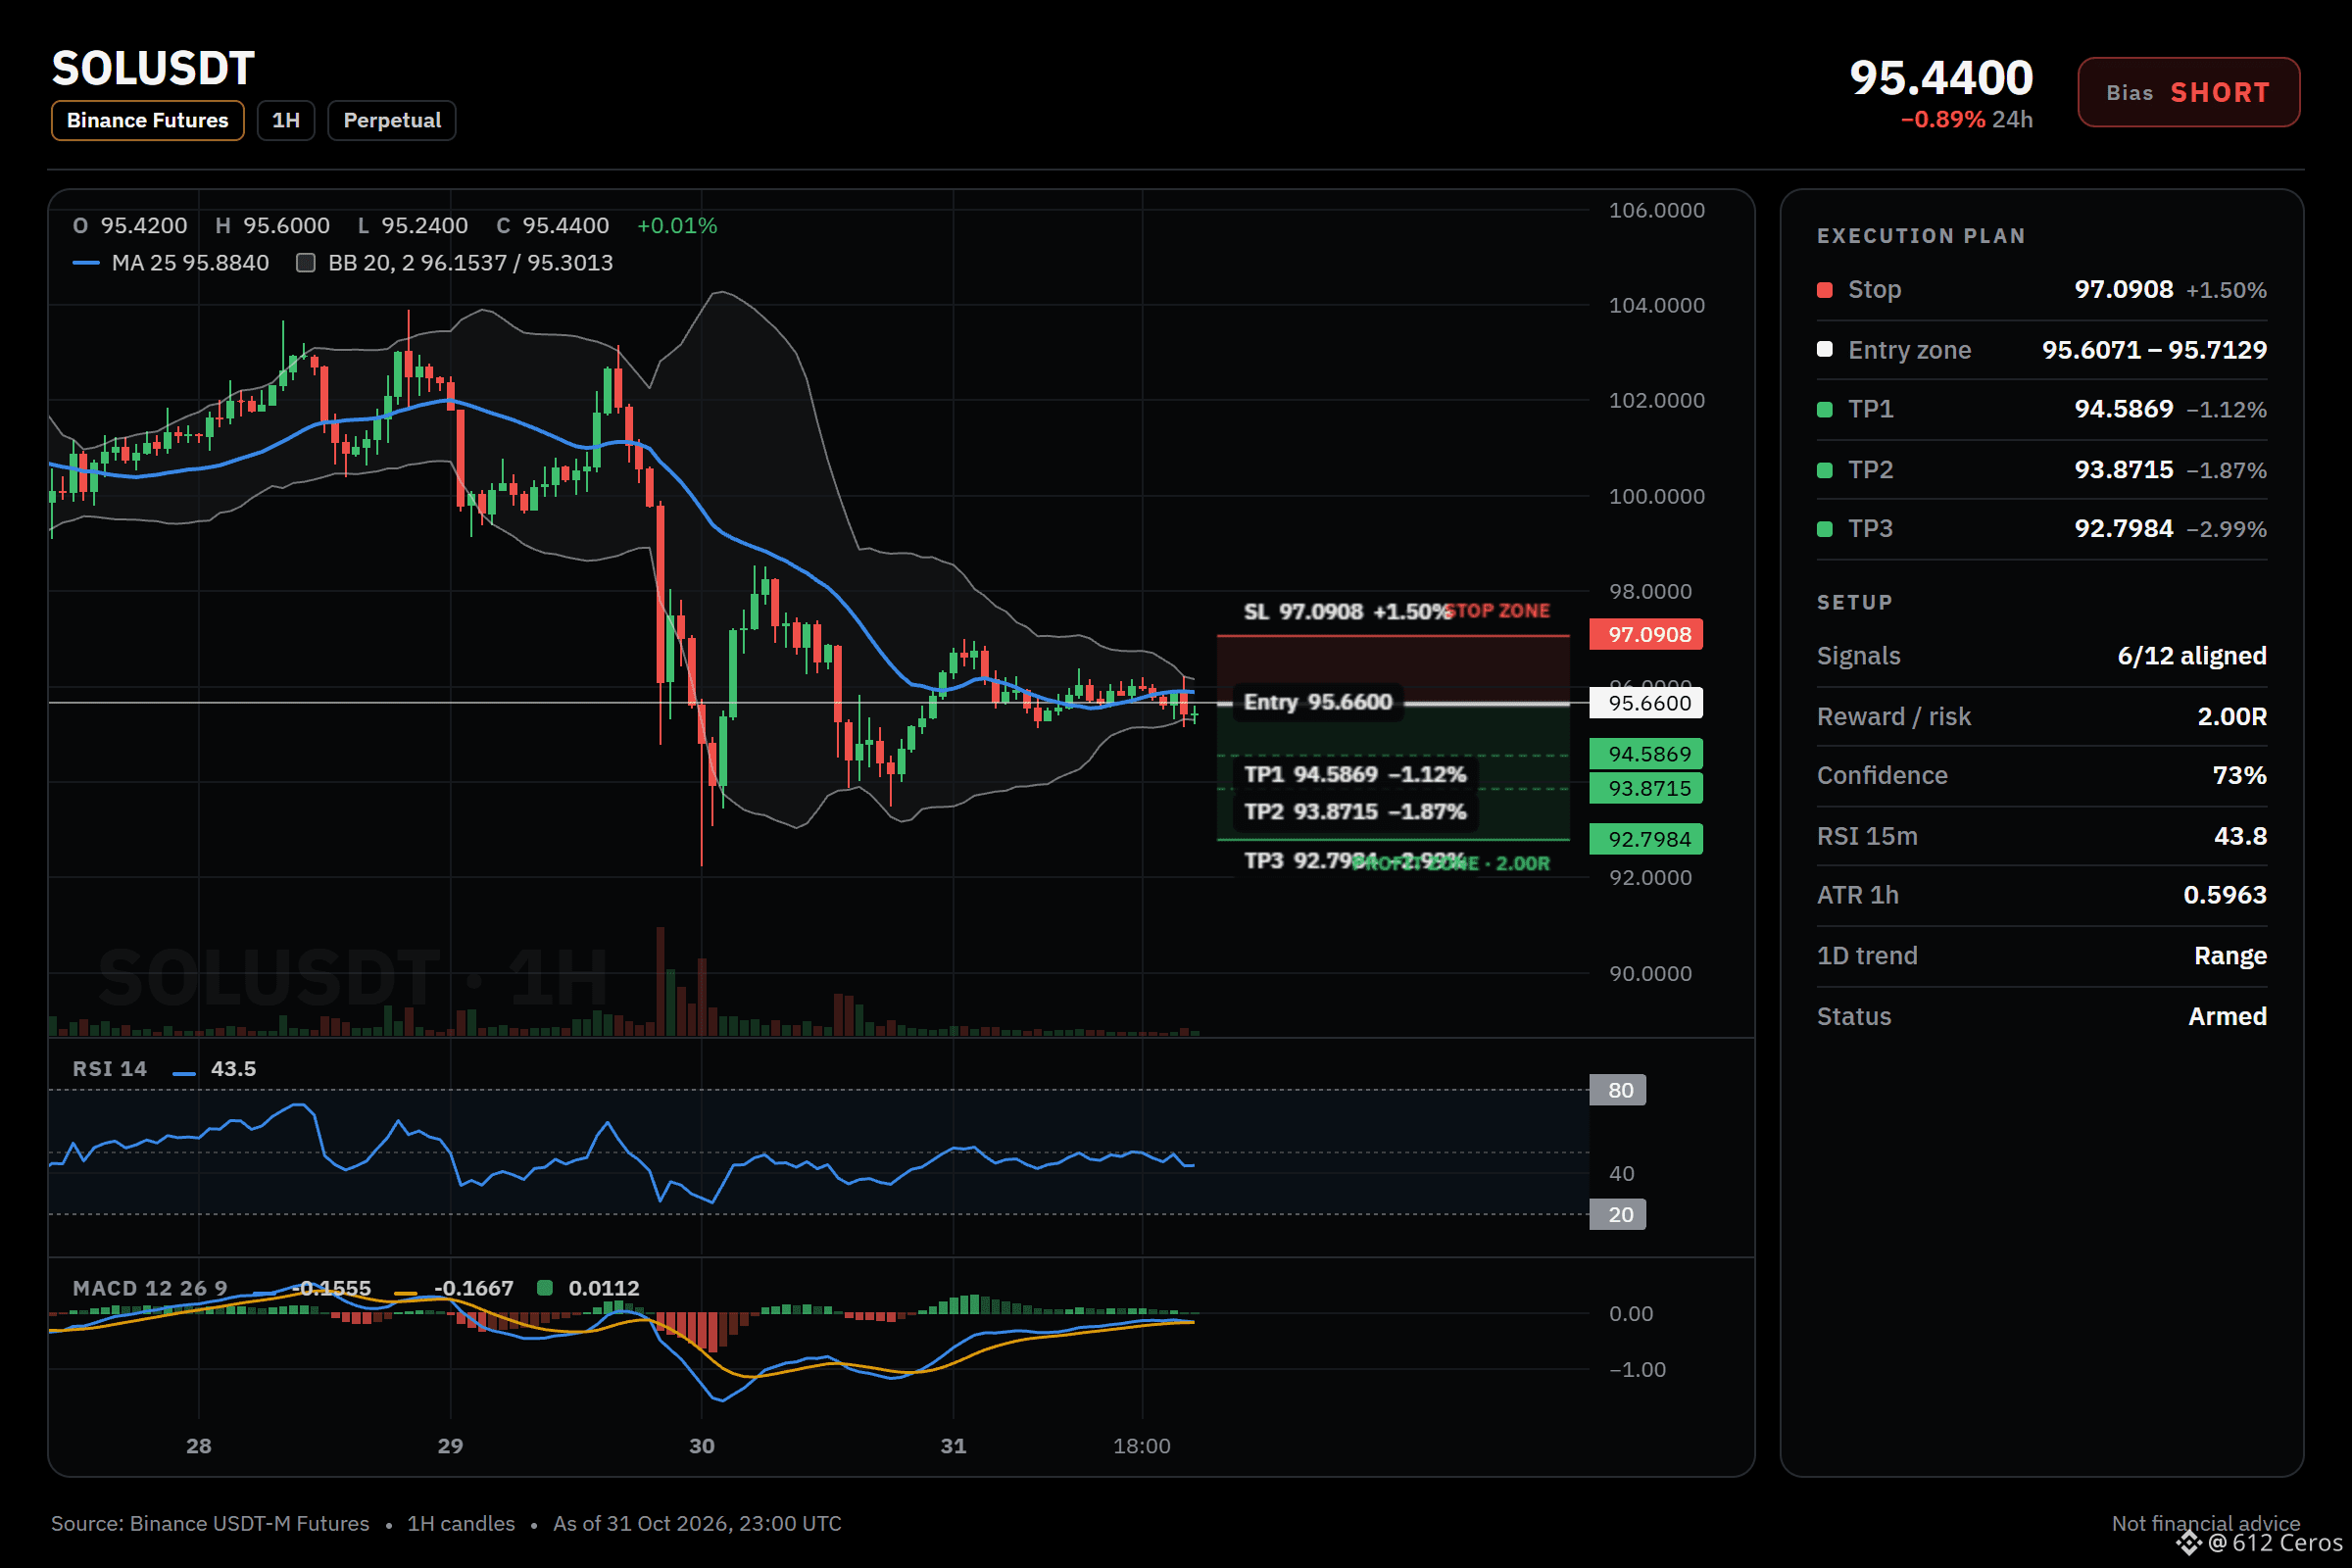
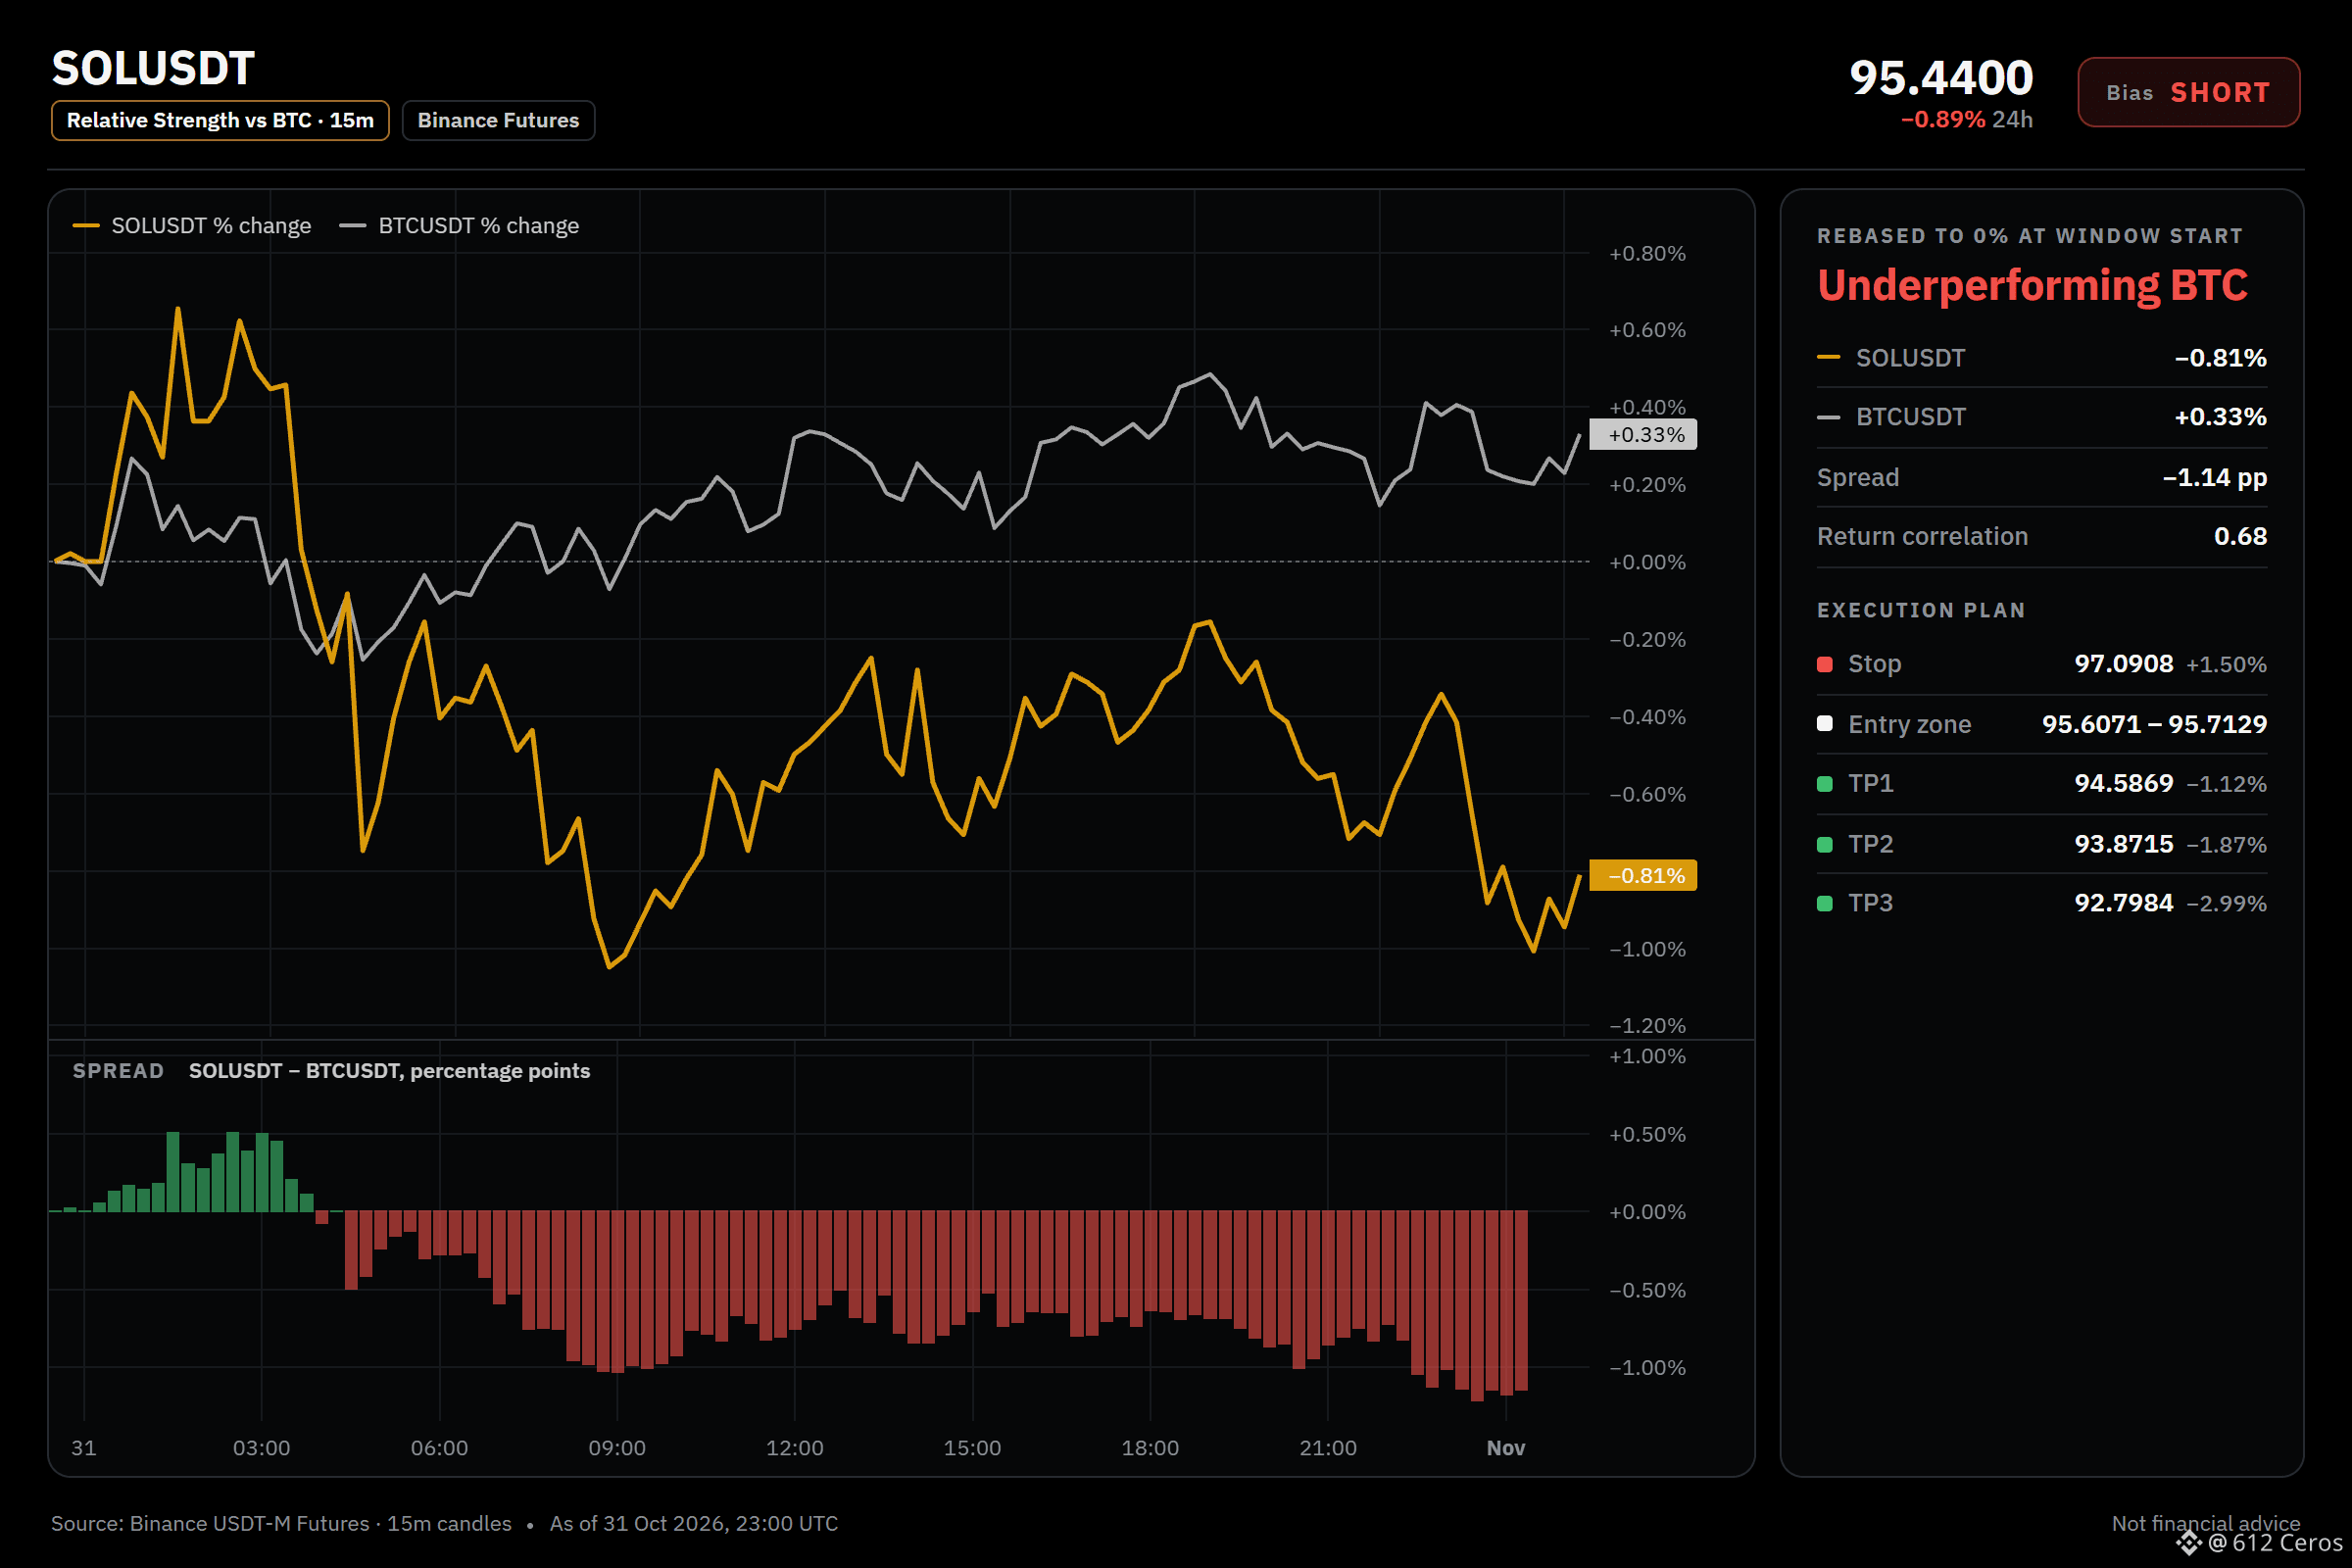
🔴 SHORT $SOL /USDT: expecting price to go DOWN
Bias: SHORT · Strong
Entry: 95.6071 – 95.7129
TP1: 94.5869 (-1.1%)
TP2: 93.8715 (-1.9%)
TP3: 92.7984 (-3.0%)
SL: 97.0908 (+1.5%)
Plan: enter only inside the zone, close 50% at TP1, 25% at TP2, 25% at TP3, and move the stop to entry after TP1.
Why SHORT? 6/12 signals agree, 0 against.
• 4h trend down (below EMA50 & EMA200)
• 1h trend down (below EMA50 & EMA200)
• Sellers are driving the move (15m ADX 23.3)
My read on SOL today
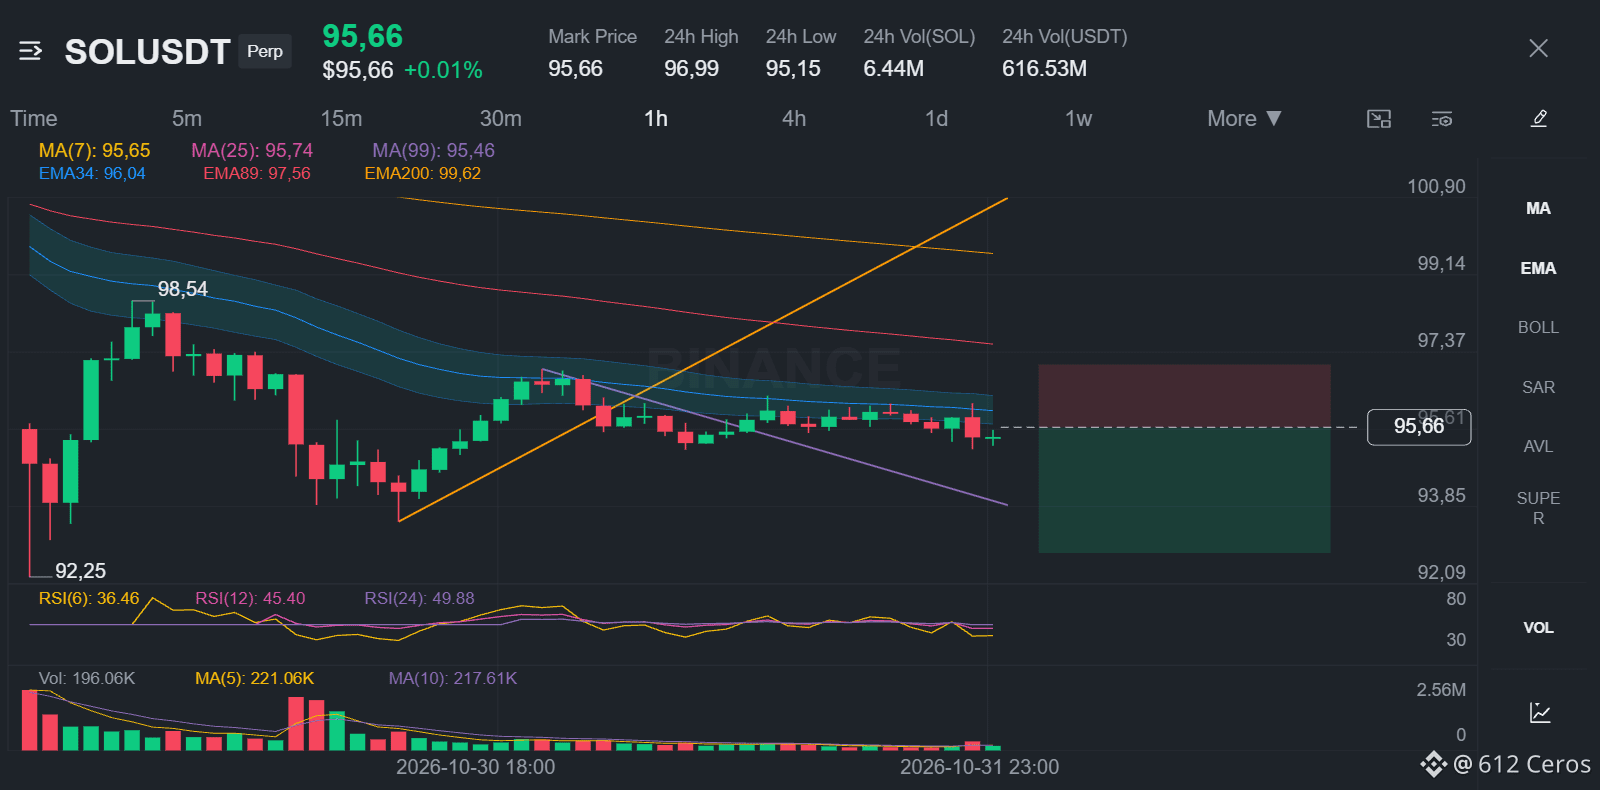
I'm watching a short setup on SOL. The 1h price is 95.6600, and the daily trend is range. I want to see sellers hold below the 4h bearish stack, with the 1h RSI at 43.79 confirming weak momentum. The strongest signal is the 4h trend showing price below EMA50 and EMA200 in a bearish stack, meaning the swing trend is down. The main risk is the daily trend is mixed, which means the big-picture trend is undecided.
Where do you take profit on this trade?
Full setup on the chart below.
{future}(SOLUSDT)
📲 Want more of my latest signals? Join me here:
[https://app.binance.com/uni-qr/D26WbL9t](https://app.binance.com/uni-qr/D26WbL9t)
⚠️ Personal market analysis only. NFA — manage risk and DYOR.
Educational content, not investment advice or a recommendation to buy, sell, deposit, or withdraw any asset. No paid promotion or referral/affiliate links.
Is SOL ready to slide again?
🔴 SHORT $SOL /USDT: expecting price to go DOWN
Bias: SHORT · Strong
Entry: 95.6071 – 95.7129
TP1: 94.5869 (-1.1%)
TP2: 93.8715 (-1.9%)
TP3: 92.7984 (-3.0%)
SL: 97.0908 (+1.5%)
Plan: enter only inside the zone, close 50% at TP1, 25% at TP2, 25% at TP3, and move the stop to entry after TP1.
Why SHORT? 6/12 signals agree, 0 against.
• 4h trend down (below EMA50 & EMA200)
• 1h trend down (below EMA50 & EMA200)
• Sellers are driving the move (15m ADX 23.3)
My read on SOL today
I'm watching a short setup on SOL. The 1h price is 95.6600, and the daily trend is range. I want to see sellers hold below the 4h bearish stack, with the 1h RSI at 43.79 confirming weak momentum. The strongest signal is the 4h trend showing price below EMA50 and EMA200 in a bearish stack, meaning the swing trend is down. The main risk is the daily trend is mixed, which means the big-picture trend is undecided.
Where do you take profit on this trade?
Full setup on the chart below.
📲 Want more of my latest signals? Join me here:
https://app.binance.com/uni-qr/D26WbL9t
⚠️ Personal market analysis only. NFA — manage risk and DYOR.
Educational content, not investment advice or a recommendation to buy, sell, deposit, or withdraw any asset. No paid promotion or referral/affiliate links.
526
·
--
Bearish
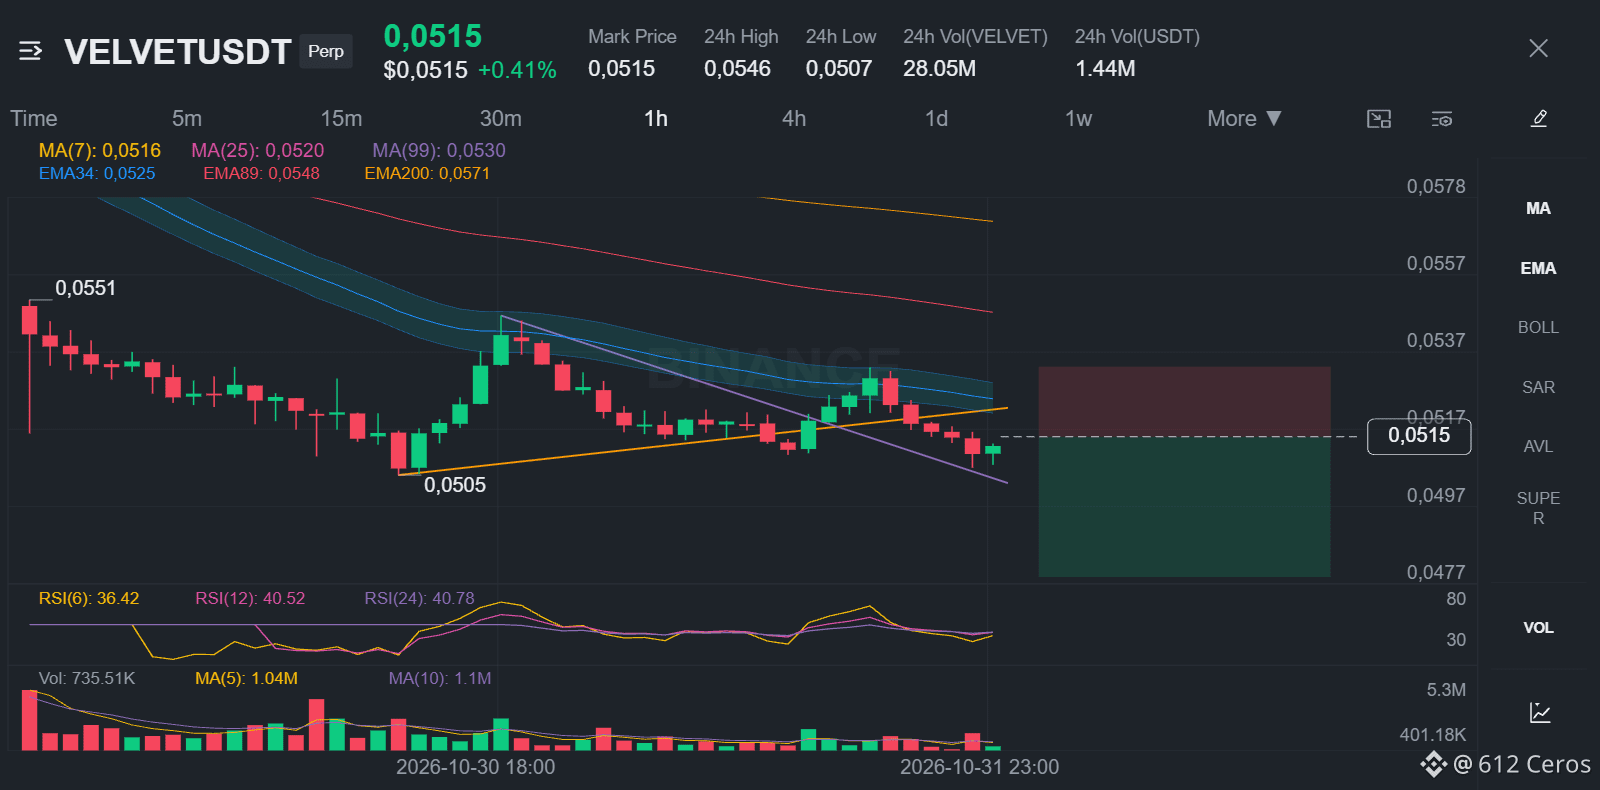
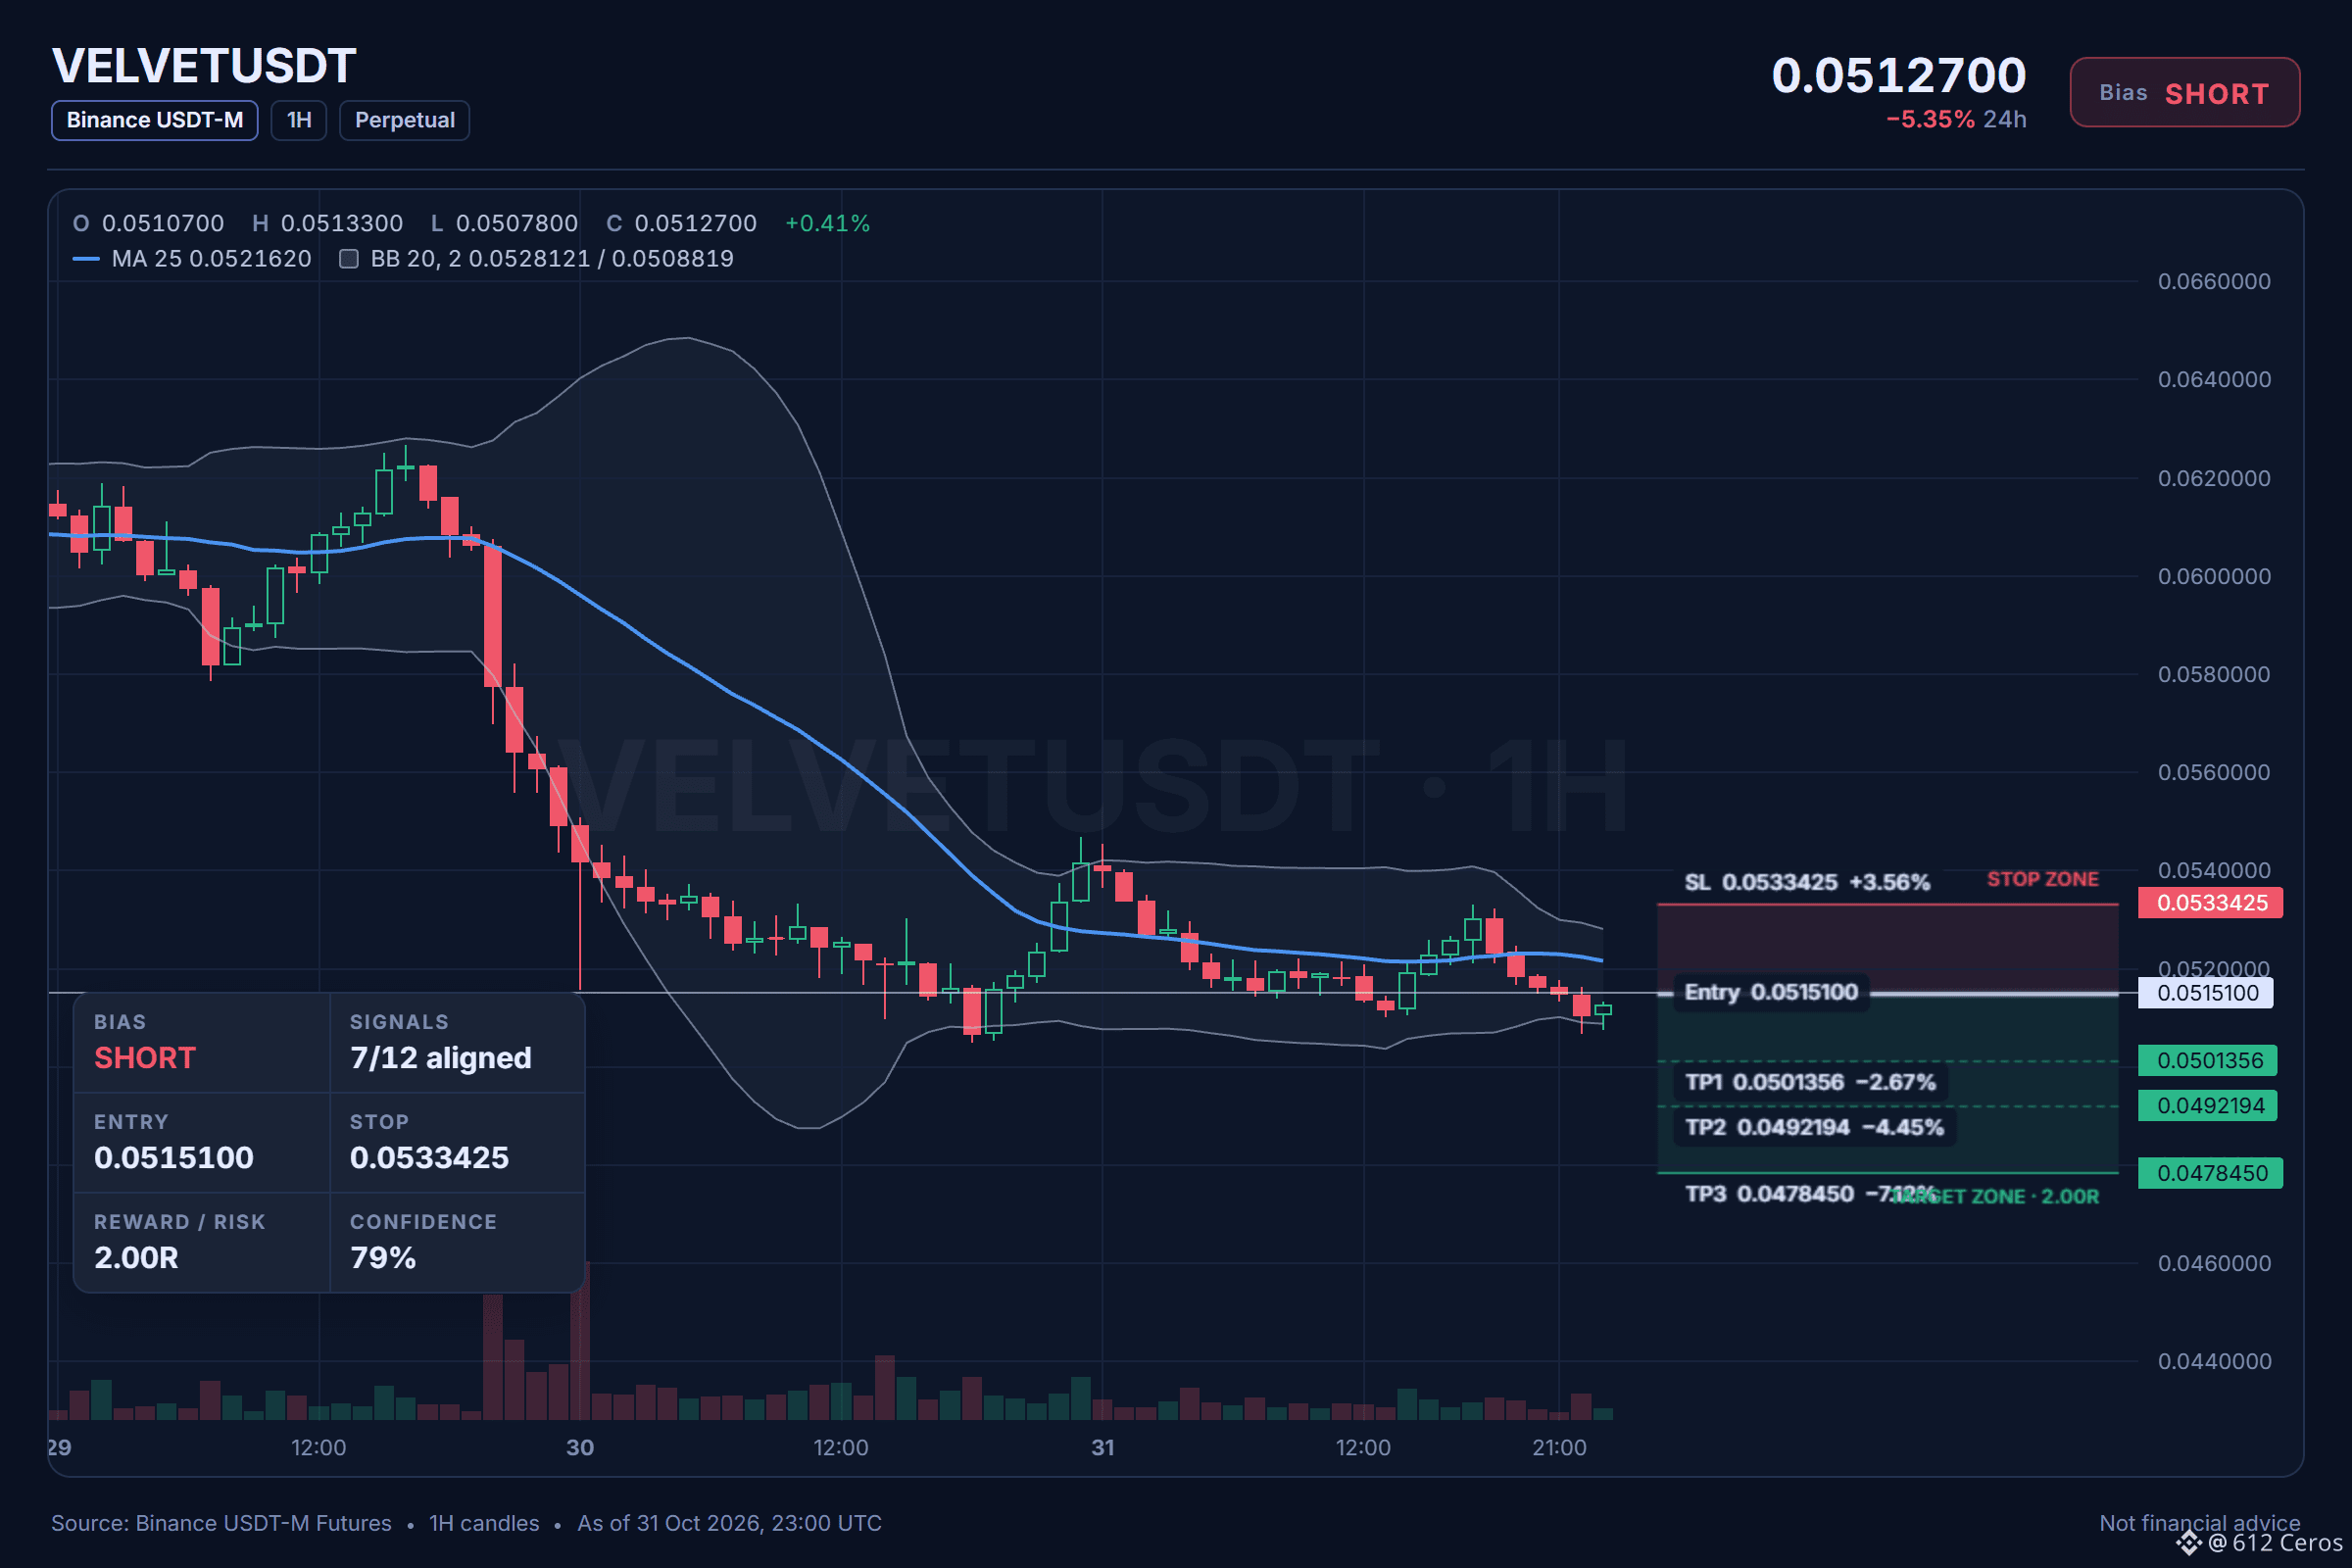
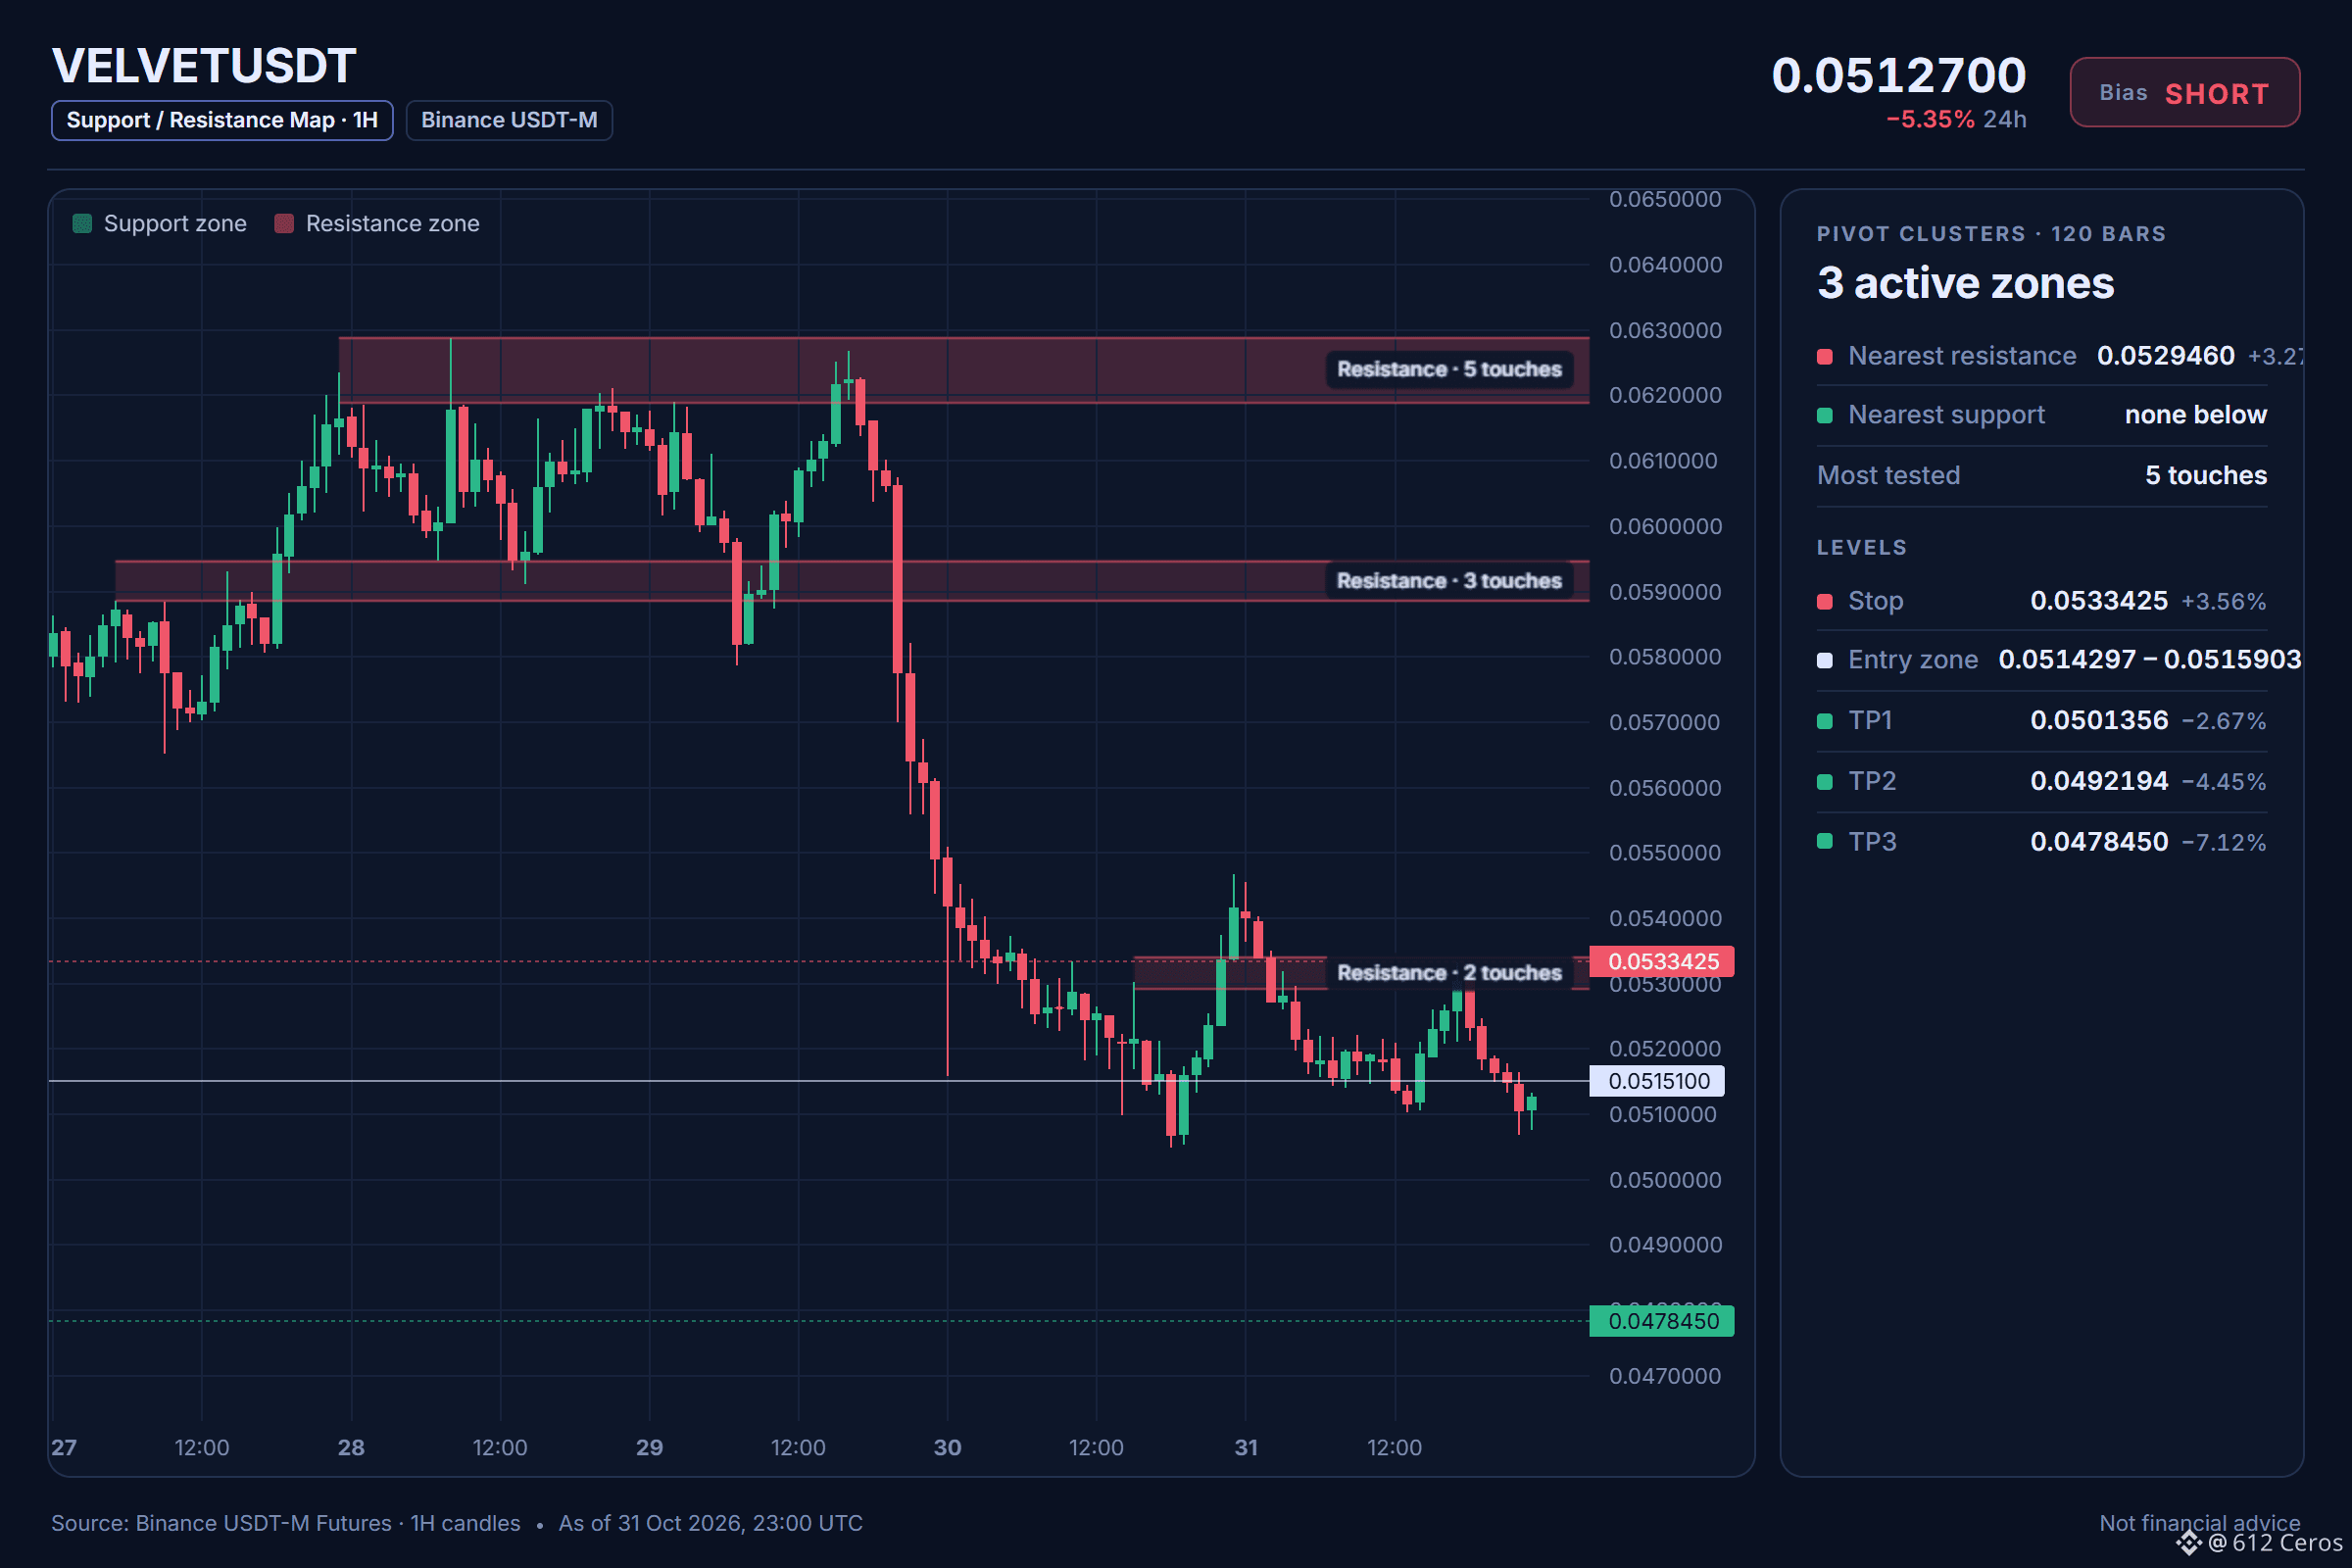
VELVET keeps sliding while the stack stays bearish.
🔴 SHORT $VELVET /USDT: expecting price to go DOWN
Bias: SHORT · Strong
Entry: 0.0514297 – 0.0515903
TP1: 0.0501356 (-2.7%)
TP2: 0.0492194 (-4.4%)
TP3: 0.0478450 (-7.1%)
SL: 0.0533425 (+3.6%)
Plan: enter only inside the zone, close 50% at TP1, 25% at TP2, 25% at TP3, and move the stop to entry after TP1.
Why SHORT? 7/12 signals agree, 0 against.
• Daily trend down (below EMA50 & EMA200)
• 4h trend down (below EMA50 & EMA200)
• 1h trend down (below EMA50 & EMA200)
Bear path:
If price holds below the daily EMA50 and EMA200, it should push toward 0.0515100, as the 1h price sits below the 1h EMA50.
What kills it:
A break above 0.0533425 would signal a trend reversal, so I would exit the short immediately.
What level would make you take the other side?
Full setup on the chart below.
{future}(VELVETUSDT)
📲 Want more of my latest signals? Join me here:
[https://app.binance.com/uni-qr/D26WbL9t](https://app.binance.com/uni-qr/D26WbL9t)
⚠️ Personal market analysis only. NFA — manage risk and DYOR.
Educational content, not investment advice or a recommendation to buy, sell, deposit, or withdraw any asset. No paid promotion or referral/affiliate links.
VELVET keeps sliding while the stack stays bearish.
🔴 SHORT $VELVET /USDT: expecting price to go DOWN
Bias: SHORT · Strong
Entry: 0.0514297 – 0.0515903
TP1: 0.0501356 (-2.7%)
TP2: 0.0492194 (-4.4%)
TP3: 0.0478450 (-7.1%)
SL: 0.0533425 (+3.6%)
Plan: enter only inside the zone, close 50% at TP1, 25% at TP2, 25% at TP3, and move the stop to entry after TP1.
Why SHORT? 7/12 signals agree, 0 against.
• Daily trend down (below EMA50 & EMA200)
• 4h trend down (below EMA50 & EMA200)
• 1h trend down (below EMA50 & EMA200)
Bear path:
If price holds below the daily EMA50 and EMA200, it should push toward 0.0515100, as the 1h price sits below the 1h EMA50.
What kills it:
A break above 0.0533425 would signal a trend reversal, so I would exit the short immediately.
What level would make you take the other side?
Full setup on the chart below.
📲 Want more of my latest signals? Join me here:
https://app.binance.com/uni-qr/D26WbL9t
⚠️ Personal market analysis only. NFA — manage risk and DYOR.
Educational content, not investment advice or a recommendation to buy, sell, deposit, or withdraw any asset. No paid promotion or referral/affiliate links.
502
·
--
Bearish
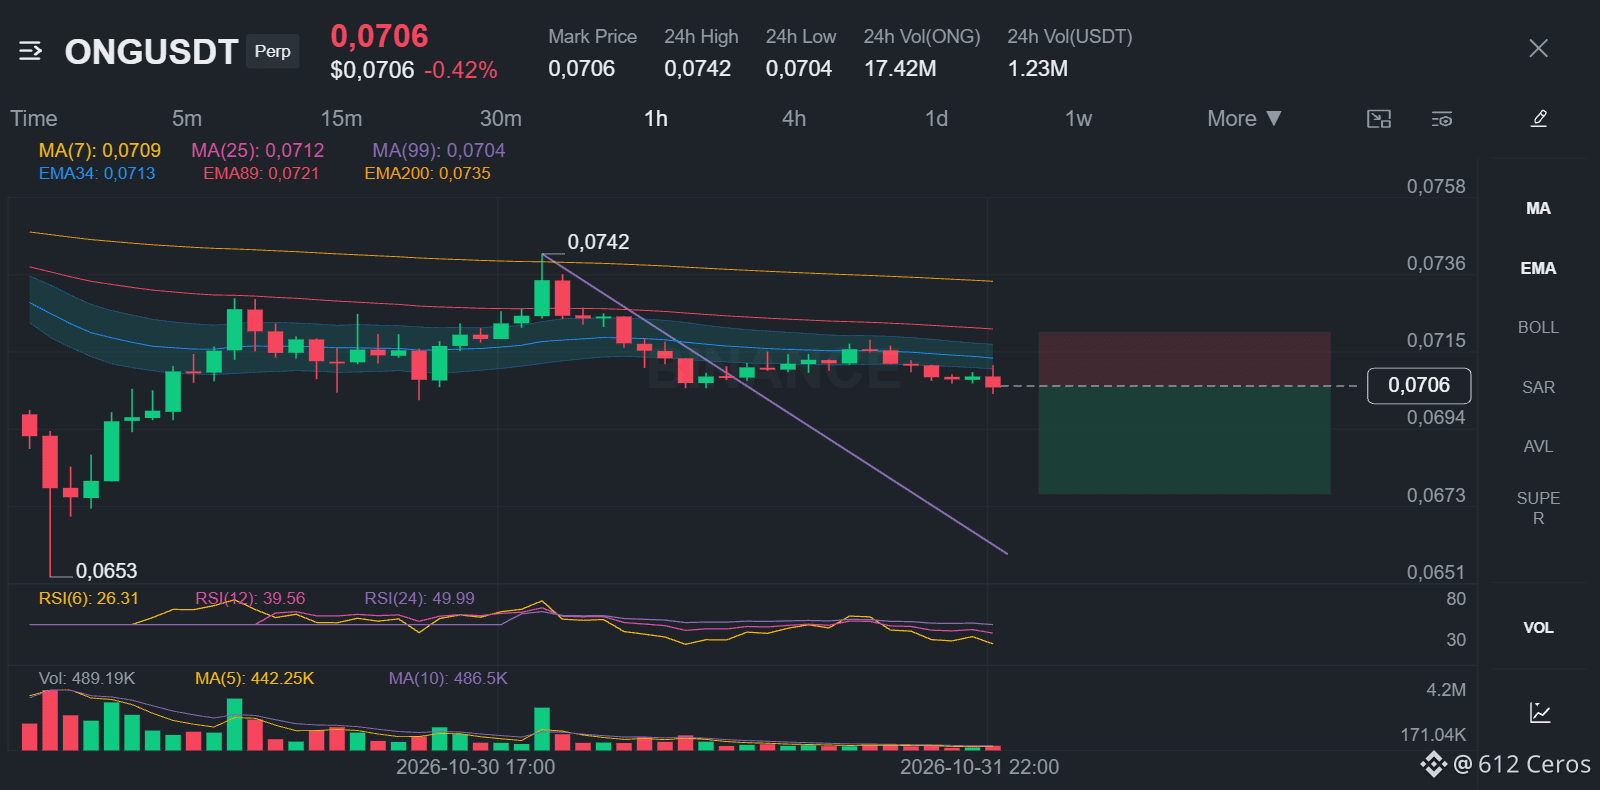
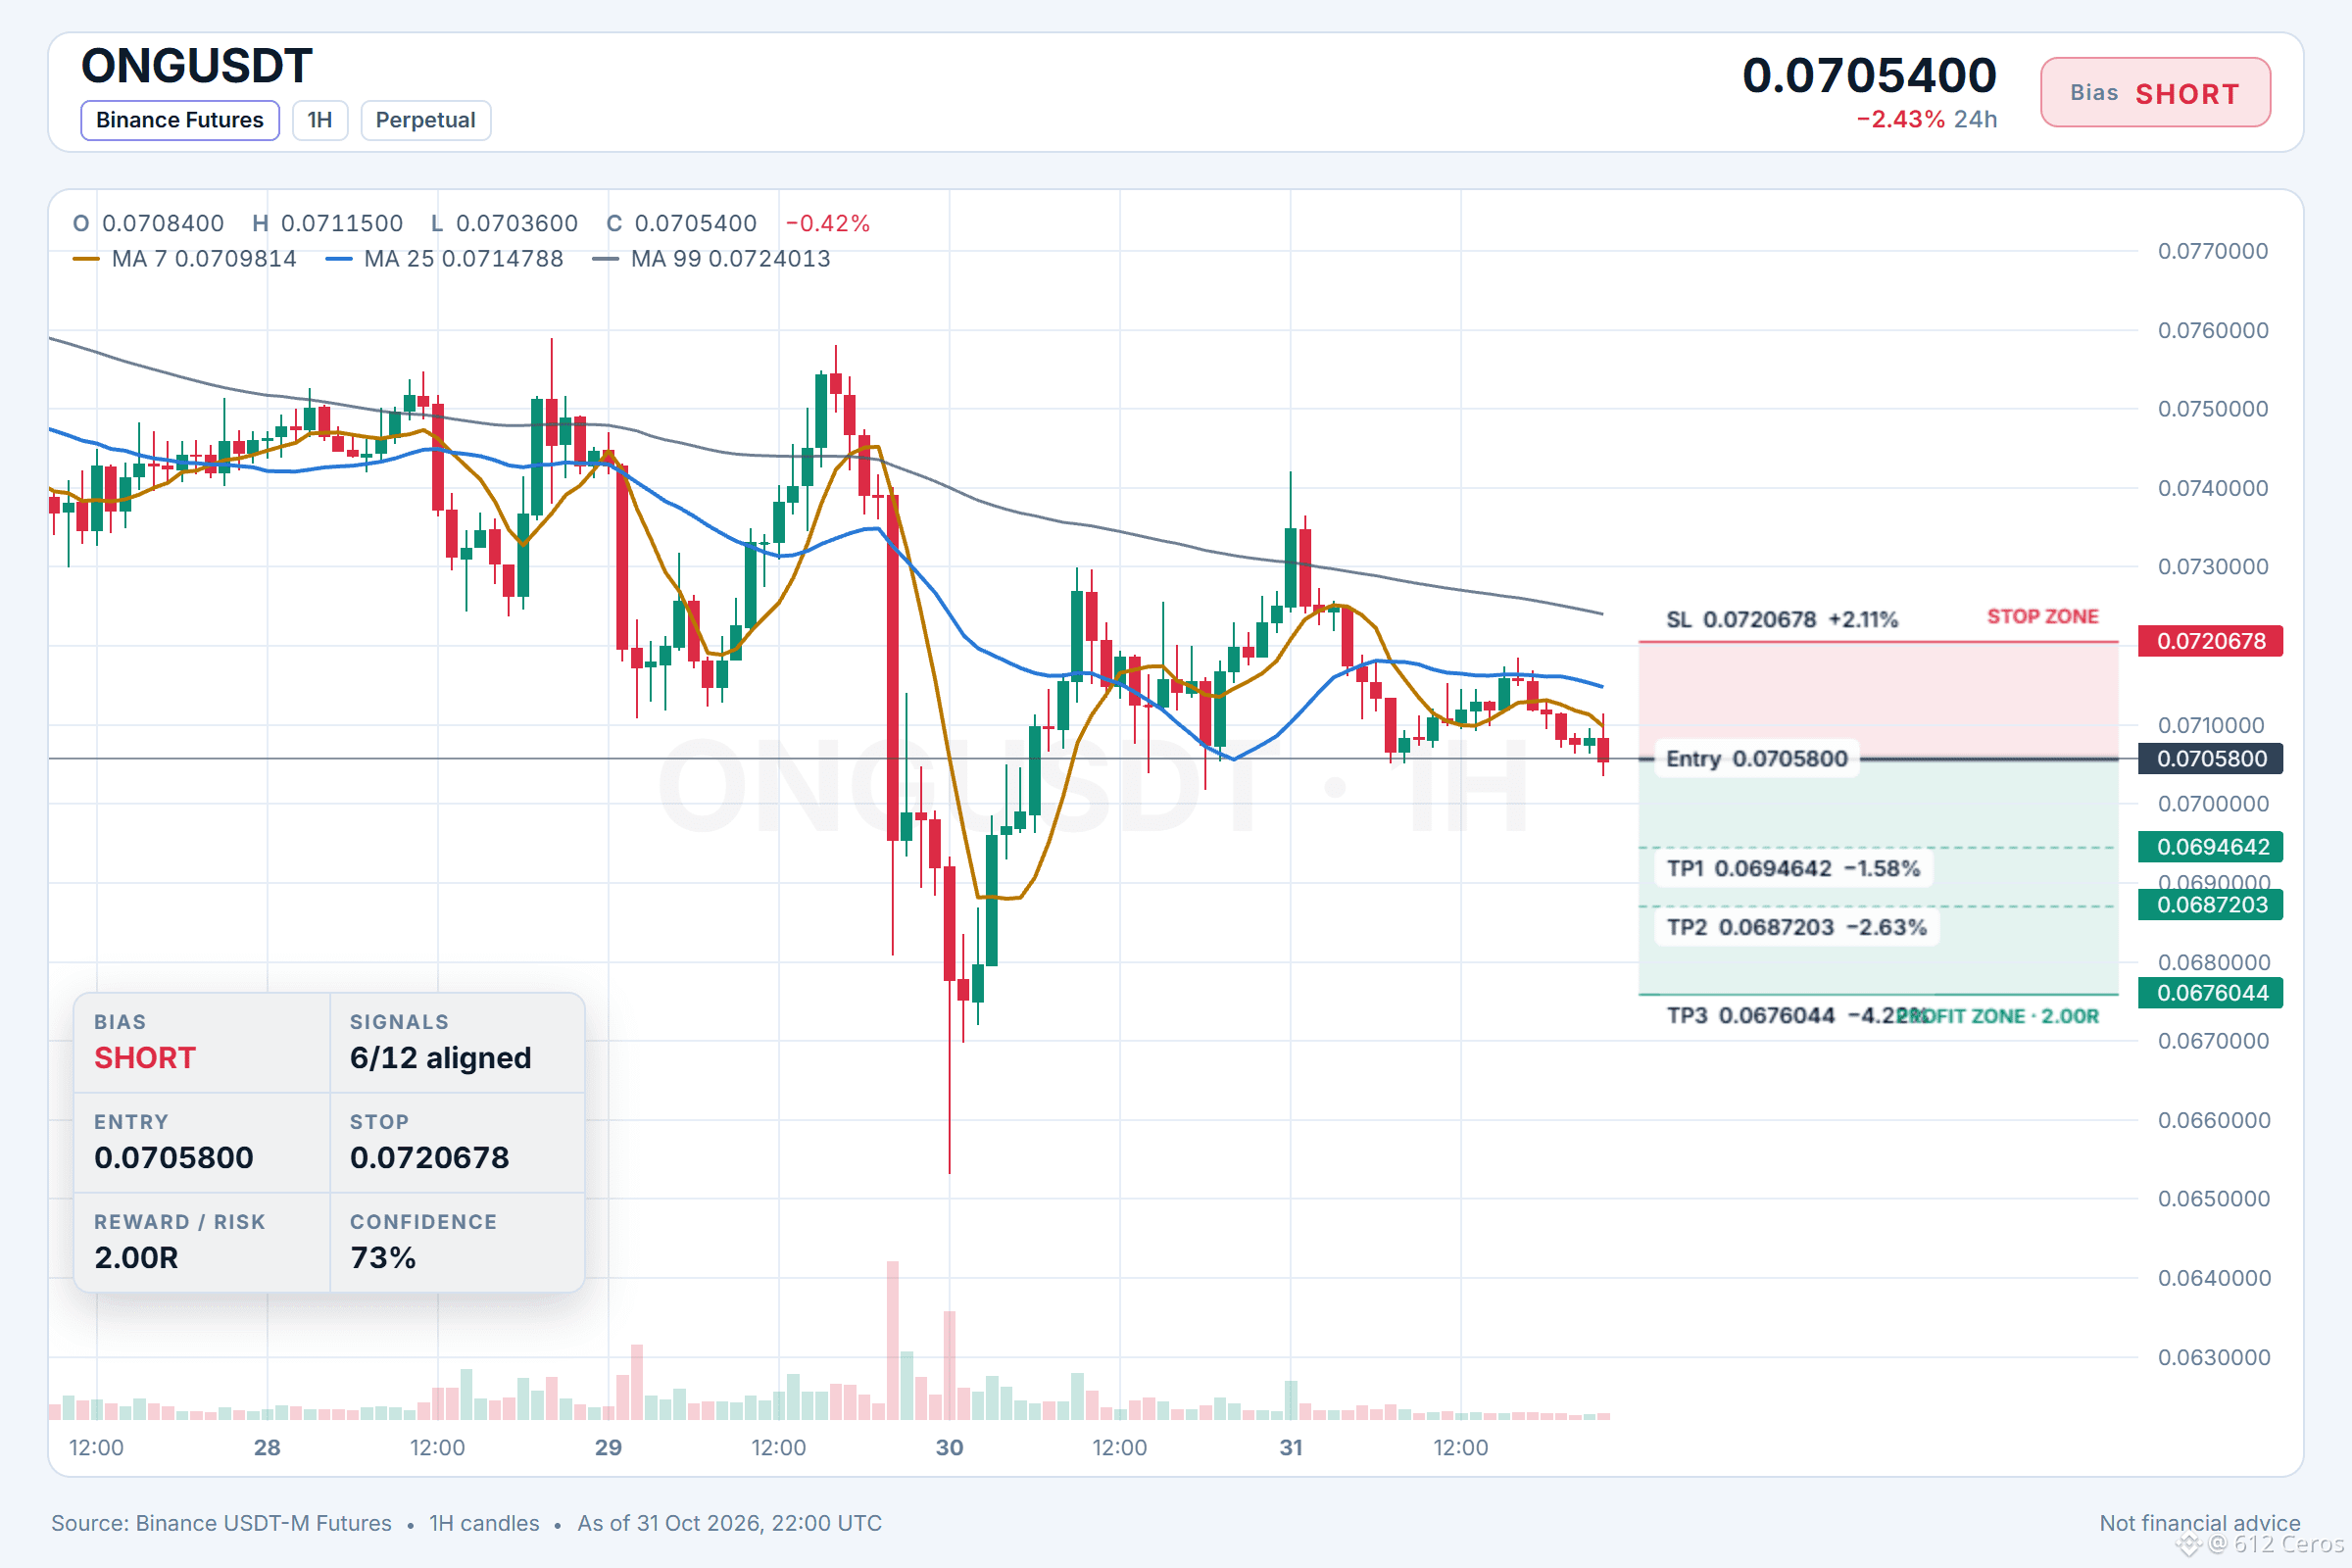
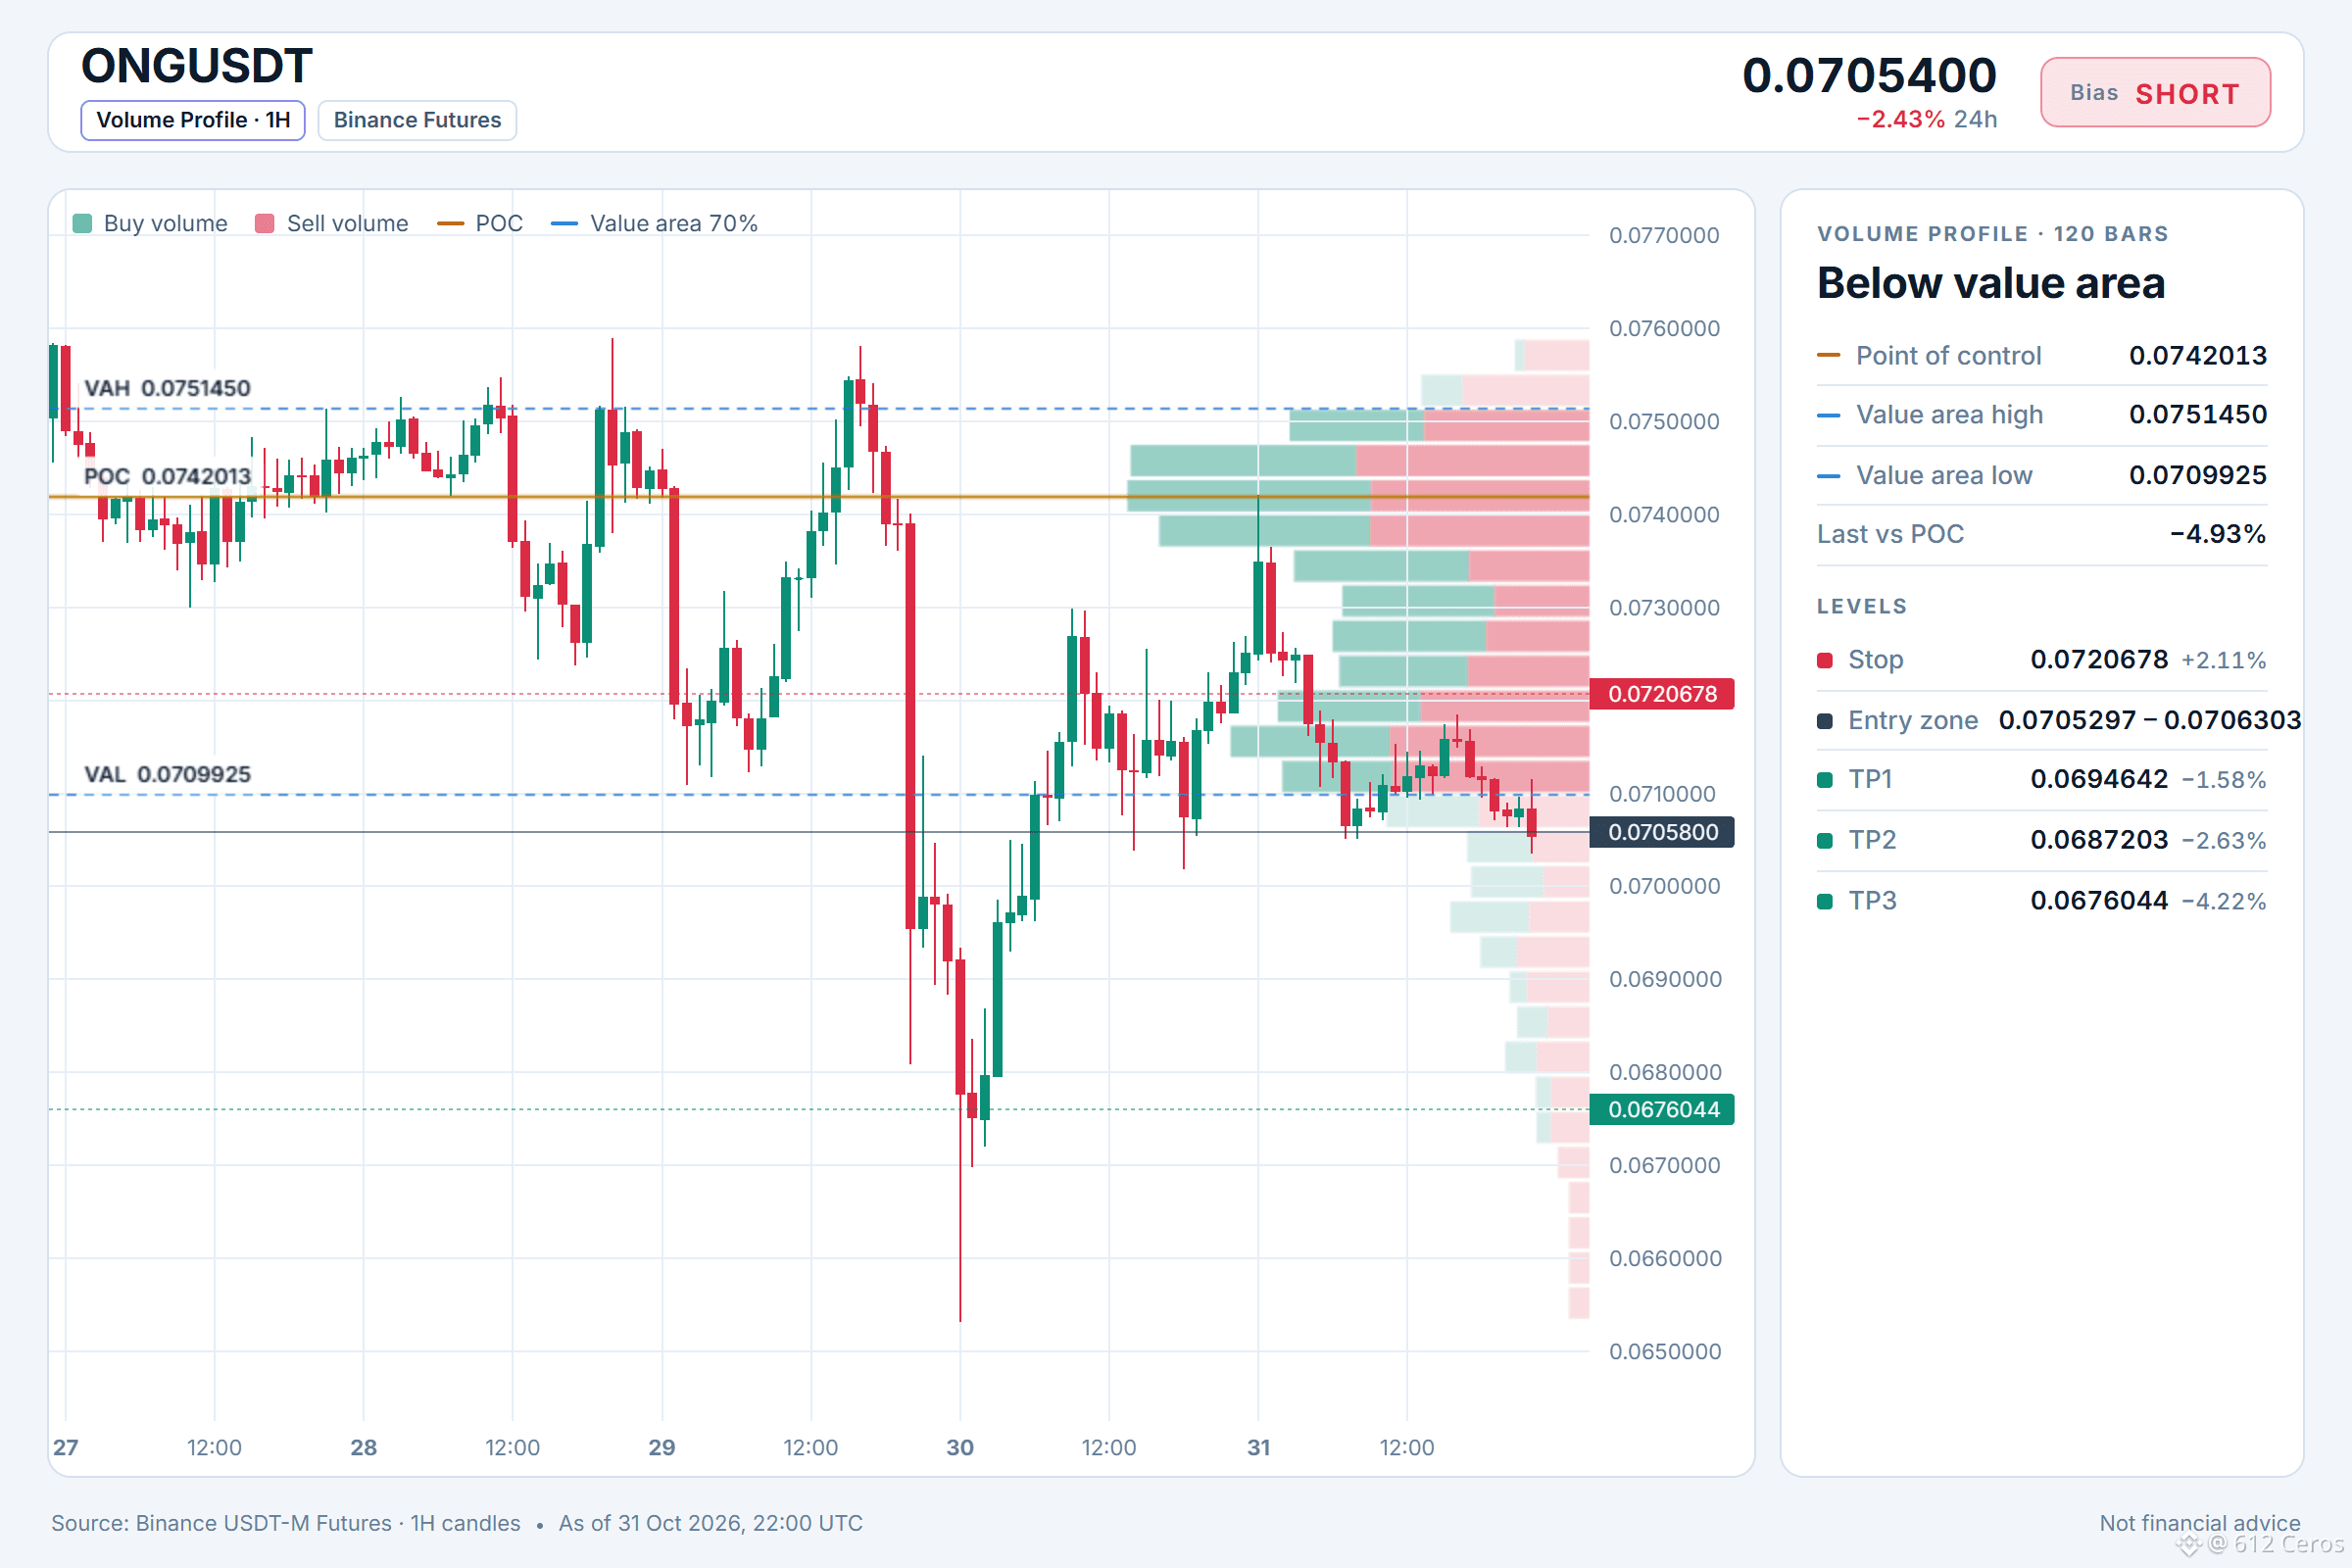
🔴 SHORT $ONG /USDT: expecting price to go DOWN
Bias: SHORT · Strong
Entry: 0.0705297 – 0.0706303
TP1: 0.0694642 (-1.6%)
TP2: 0.0687203 (-2.6%)
TP3: 0.0676044 (-4.2%)
SL: 0.0720678 (+2.1%)
Plan: enter only inside the zone, close 50% at TP1, 25% at TP2, 25% at TP3, and move the stop to entry after TP1.
ONG is sliding in a clear bearish trend.
Why SHORT? 6/12 signals agree, 0 against.
• 4h trend down (below EMA50 & EMA200)
• 1h trend down (below EMA50 & EMA200)
• Sellers are driving the move (15m ADX 21.0)
The 1h price sits below both EMA50 and EMA200, confirming the short-term trend is down with sellers in control.
Where do you set your invalidation for this trade?
Full setup on the chart below.
{future}(ONGUSDT)
📲 Want more of my latest signals? Join me here:
[https://app.binance.com/uni-qr/D26WbL9t](https://app.binance.com/uni-qr/D26WbL9t)
⚠️ Personal market analysis only. NFA — manage risk and DYOR.
Educational content, not investment advice or a recommendation to buy, sell, deposit, or withdraw any asset. No paid promotion or referral/affiliate links.
🔴 SHORT $ONG /USDT: expecting price to go DOWN
Bias: SHORT · Strong
Entry: 0.0705297 – 0.0706303
TP1: 0.0694642 (-1.6%)
TP2: 0.0687203 (-2.6%)
TP3: 0.0676044 (-4.2%)
SL: 0.0720678 (+2.1%)
Plan: enter only inside the zone, close 50% at TP1, 25% at TP2, 25% at TP3, and move the stop to entry after TP1.
ONG is sliding in a clear bearish trend.
Why SHORT? 6/12 signals agree, 0 against.
• 4h trend down (below EMA50 & EMA200)
• 1h trend down (below EMA50 & EMA200)
• Sellers are driving the move (15m ADX 21.0)
The 1h price sits below both EMA50 and EMA200, confirming the short-term trend is down with sellers in control.
Where do you set your invalidation for this trade?
Full setup on the chart below.
📲 Want more of my latest signals? Join me here:
https://app.binance.com/uni-qr/D26WbL9t
⚠️ Personal market analysis only. NFA — manage risk and DYOR.
Educational content, not investment advice or a recommendation to buy, sell, deposit, or withdraw any asset. No paid promotion or referral/affiliate links.
1
1
1
800
·
--
Bearish
XRP is not stuck in a neutral range.
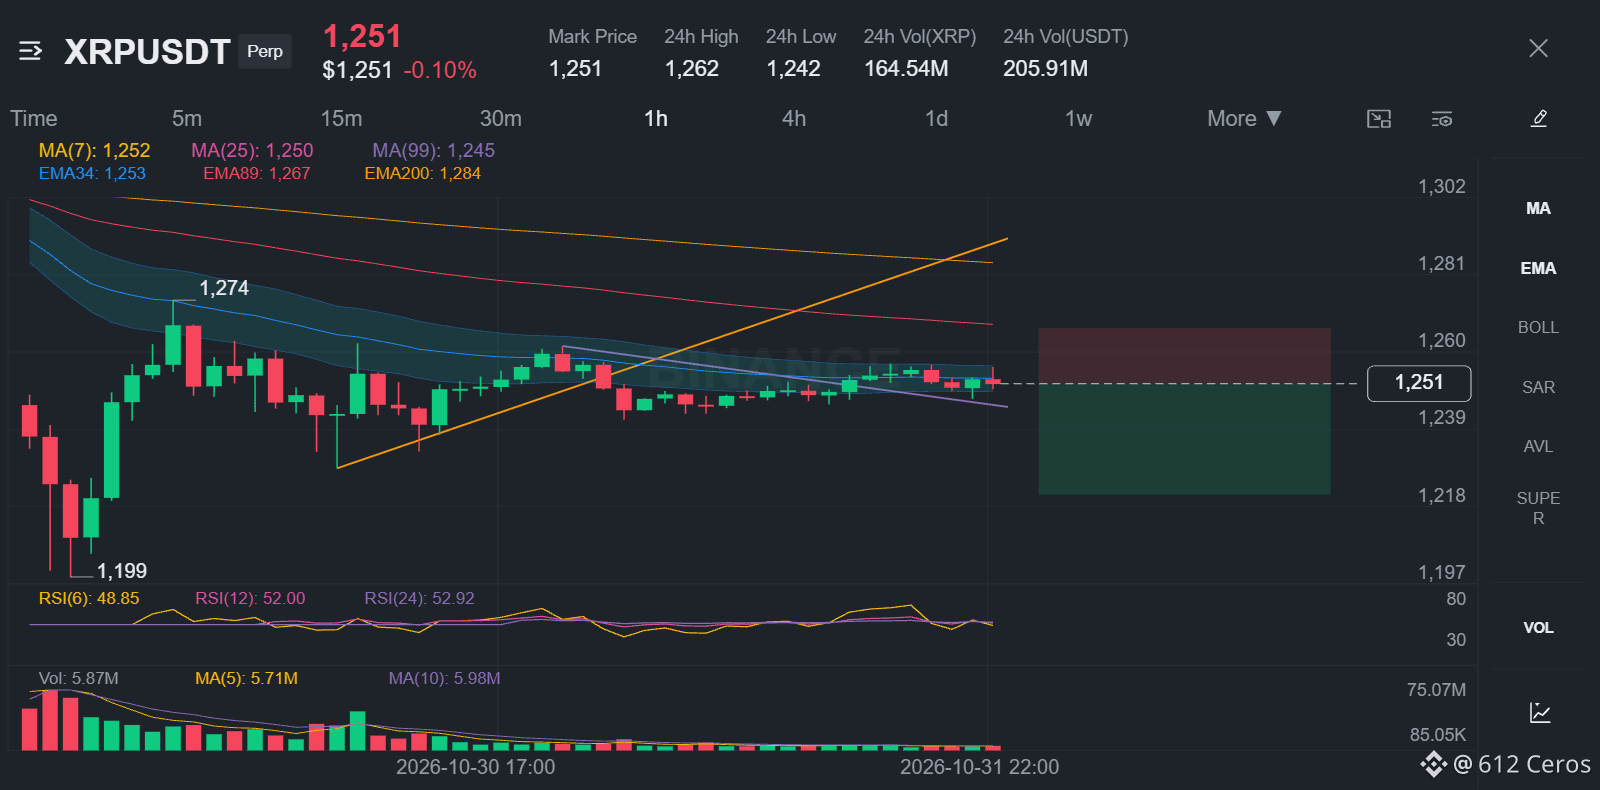
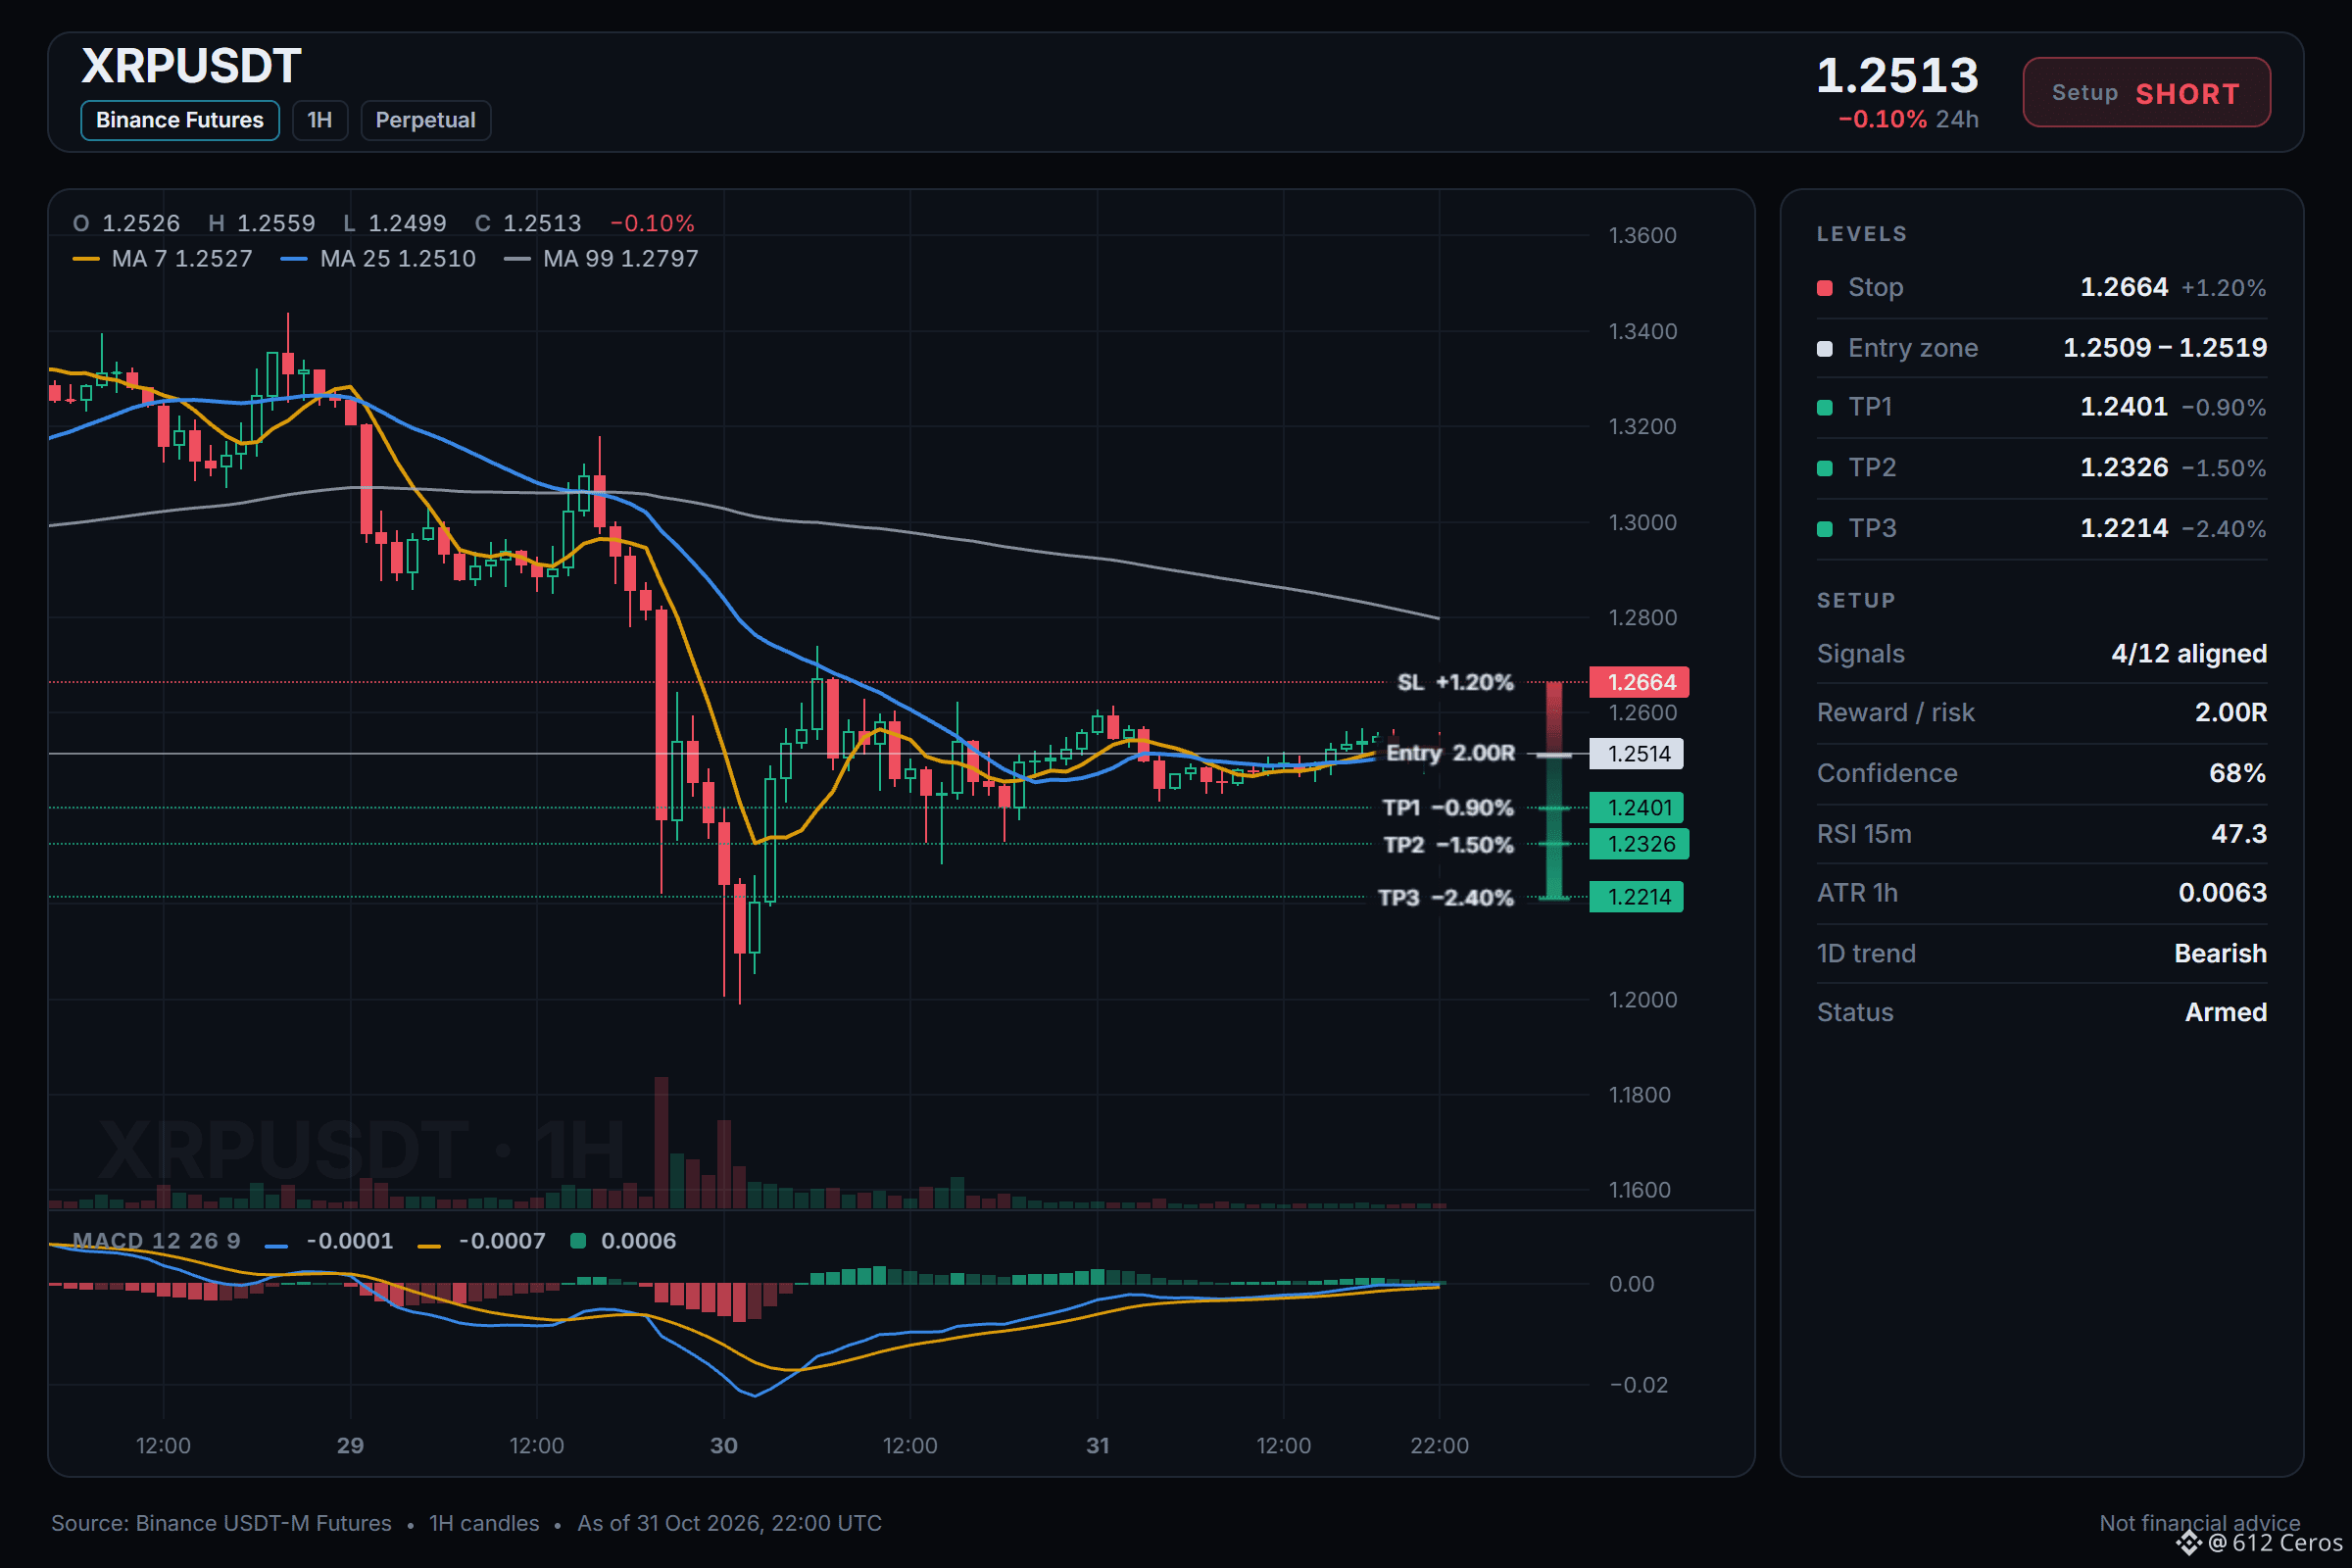
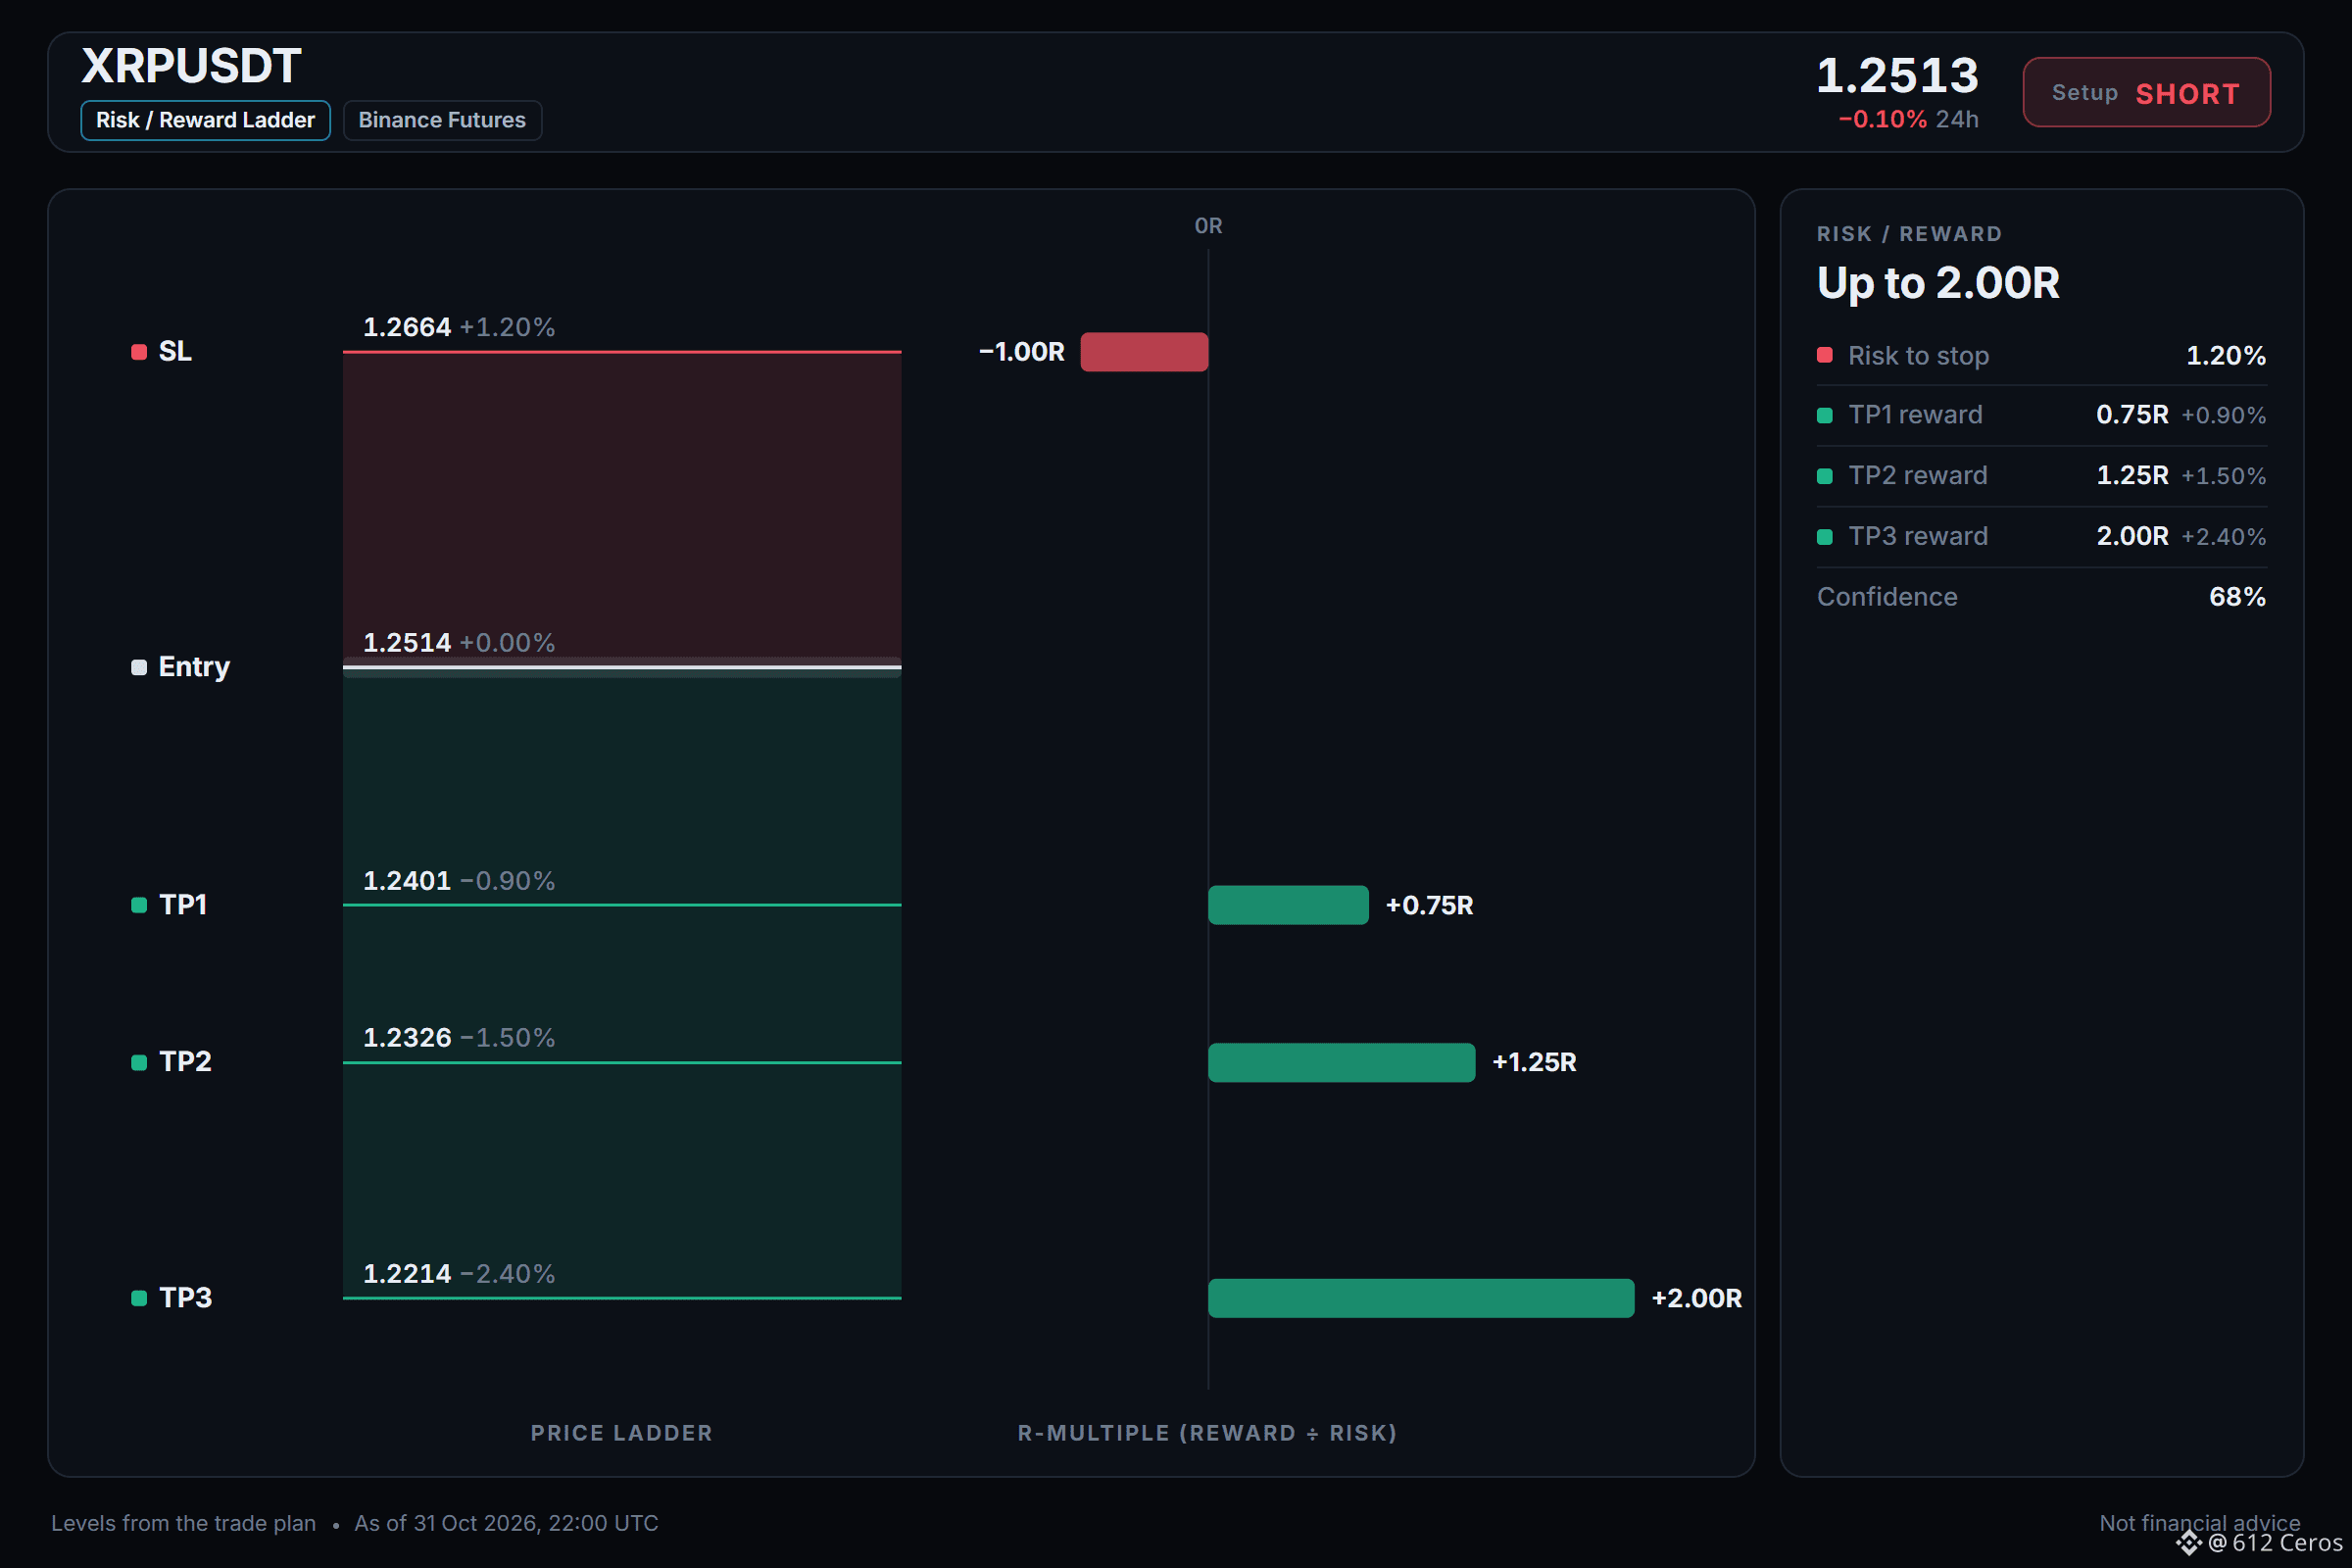
🔴 SHORT $XRP /USDT: expecting price to go DOWN
Bias: SHORT · Leaning
Entry: 1.2509 – 1.2519
TP1: 1.2401 (-0.9%)
TP2: 1.2326 (-1.5%)
TP3: 1.2214 (-2.4%)
SL: 1.2664 (+1.2%)
Plan: enter only inside the zone, close 50% at TP1, 25% at TP2, 25% at TP3, and move the stop to entry after TP1.
Note: moderate conviction only, keep size light.
Why SHORT? 4/12 signals agree, 0 against.
• Daily trend down (below EMA50 & EMA200)
• 4h trend down (below EMA50 & EMA200)
• 1h trend down (below EMA50 & EMA200)
Q: Why short when momentum looks weak?
A: The 4h RSI sits at 40.5, showing sellers control momentum.
Q: When is this setup wrong?
A: A 1h close above 1.2664 invalidates the bearish structure.
Where do you set your XRP stop?
Levels mapped on the chart below.
{future}(XRPUSDT)
📲 Want more of my latest signals? Join me here:
[https://app.binance.com/uni-qr/D26WbL9t](https://app.binance.com/uni-qr/D26WbL9t)
⚠️ Personal market analysis only. NFA — manage risk and DYOR.
Educational content, not investment advice or a recommendation to buy, sell, deposit, or withdraw any asset. No paid promotion or referral/affiliate links.
XRP is not stuck in a neutral range.
🔴 SHORT $XRP /USDT: expecting price to go DOWN
Bias: SHORT · Leaning
Entry: 1.2509 – 1.2519
TP1: 1.2401 (-0.9%)
TP2: 1.2326 (-1.5%)
TP3: 1.2214 (-2.4%)
SL: 1.2664 (+1.2%)
Plan: enter only inside the zone, close 50% at TP1, 25% at TP2, 25% at TP3, and move the stop to entry after TP1.
Note: moderate conviction only, keep size light.
Why SHORT? 4/12 signals agree, 0 against.
• Daily trend down (below EMA50 & EMA200)
• 4h trend down (below EMA50 & EMA200)
• 1h trend down (below EMA50 & EMA200)
Q: Why short when momentum looks weak?
A: The 4h RSI sits at 40.5, showing sellers control momentum.
Q: When is this setup wrong?
A: A 1h close above 1.2664 invalidates the bearish structure.
Where do you set your XRP stop?
Levels mapped on the chart below.
📲 Want more of my latest signals? Join me here:
https://app.binance.com/uni-qr/D26WbL9t
⚠️ Personal market analysis only. NFA — manage risk and DYOR.
Educational content, not investment advice or a recommendation to buy, sell, deposit, or withdraw any asset. No paid promotion or referral/affiliate links.
1
638
·
--
Bearish
Most traders will ignore this obvious bearish setup.
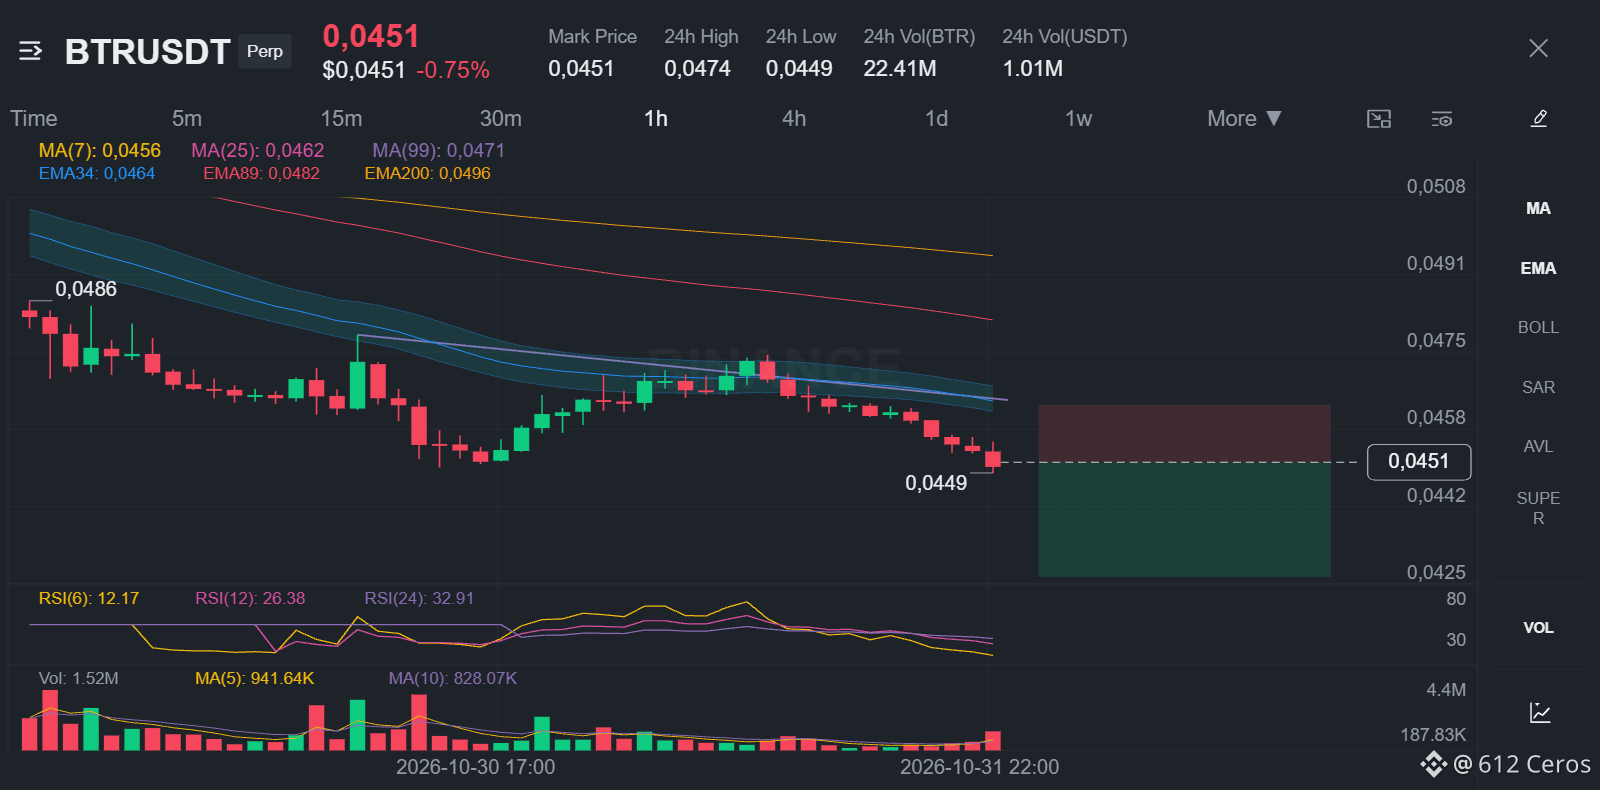
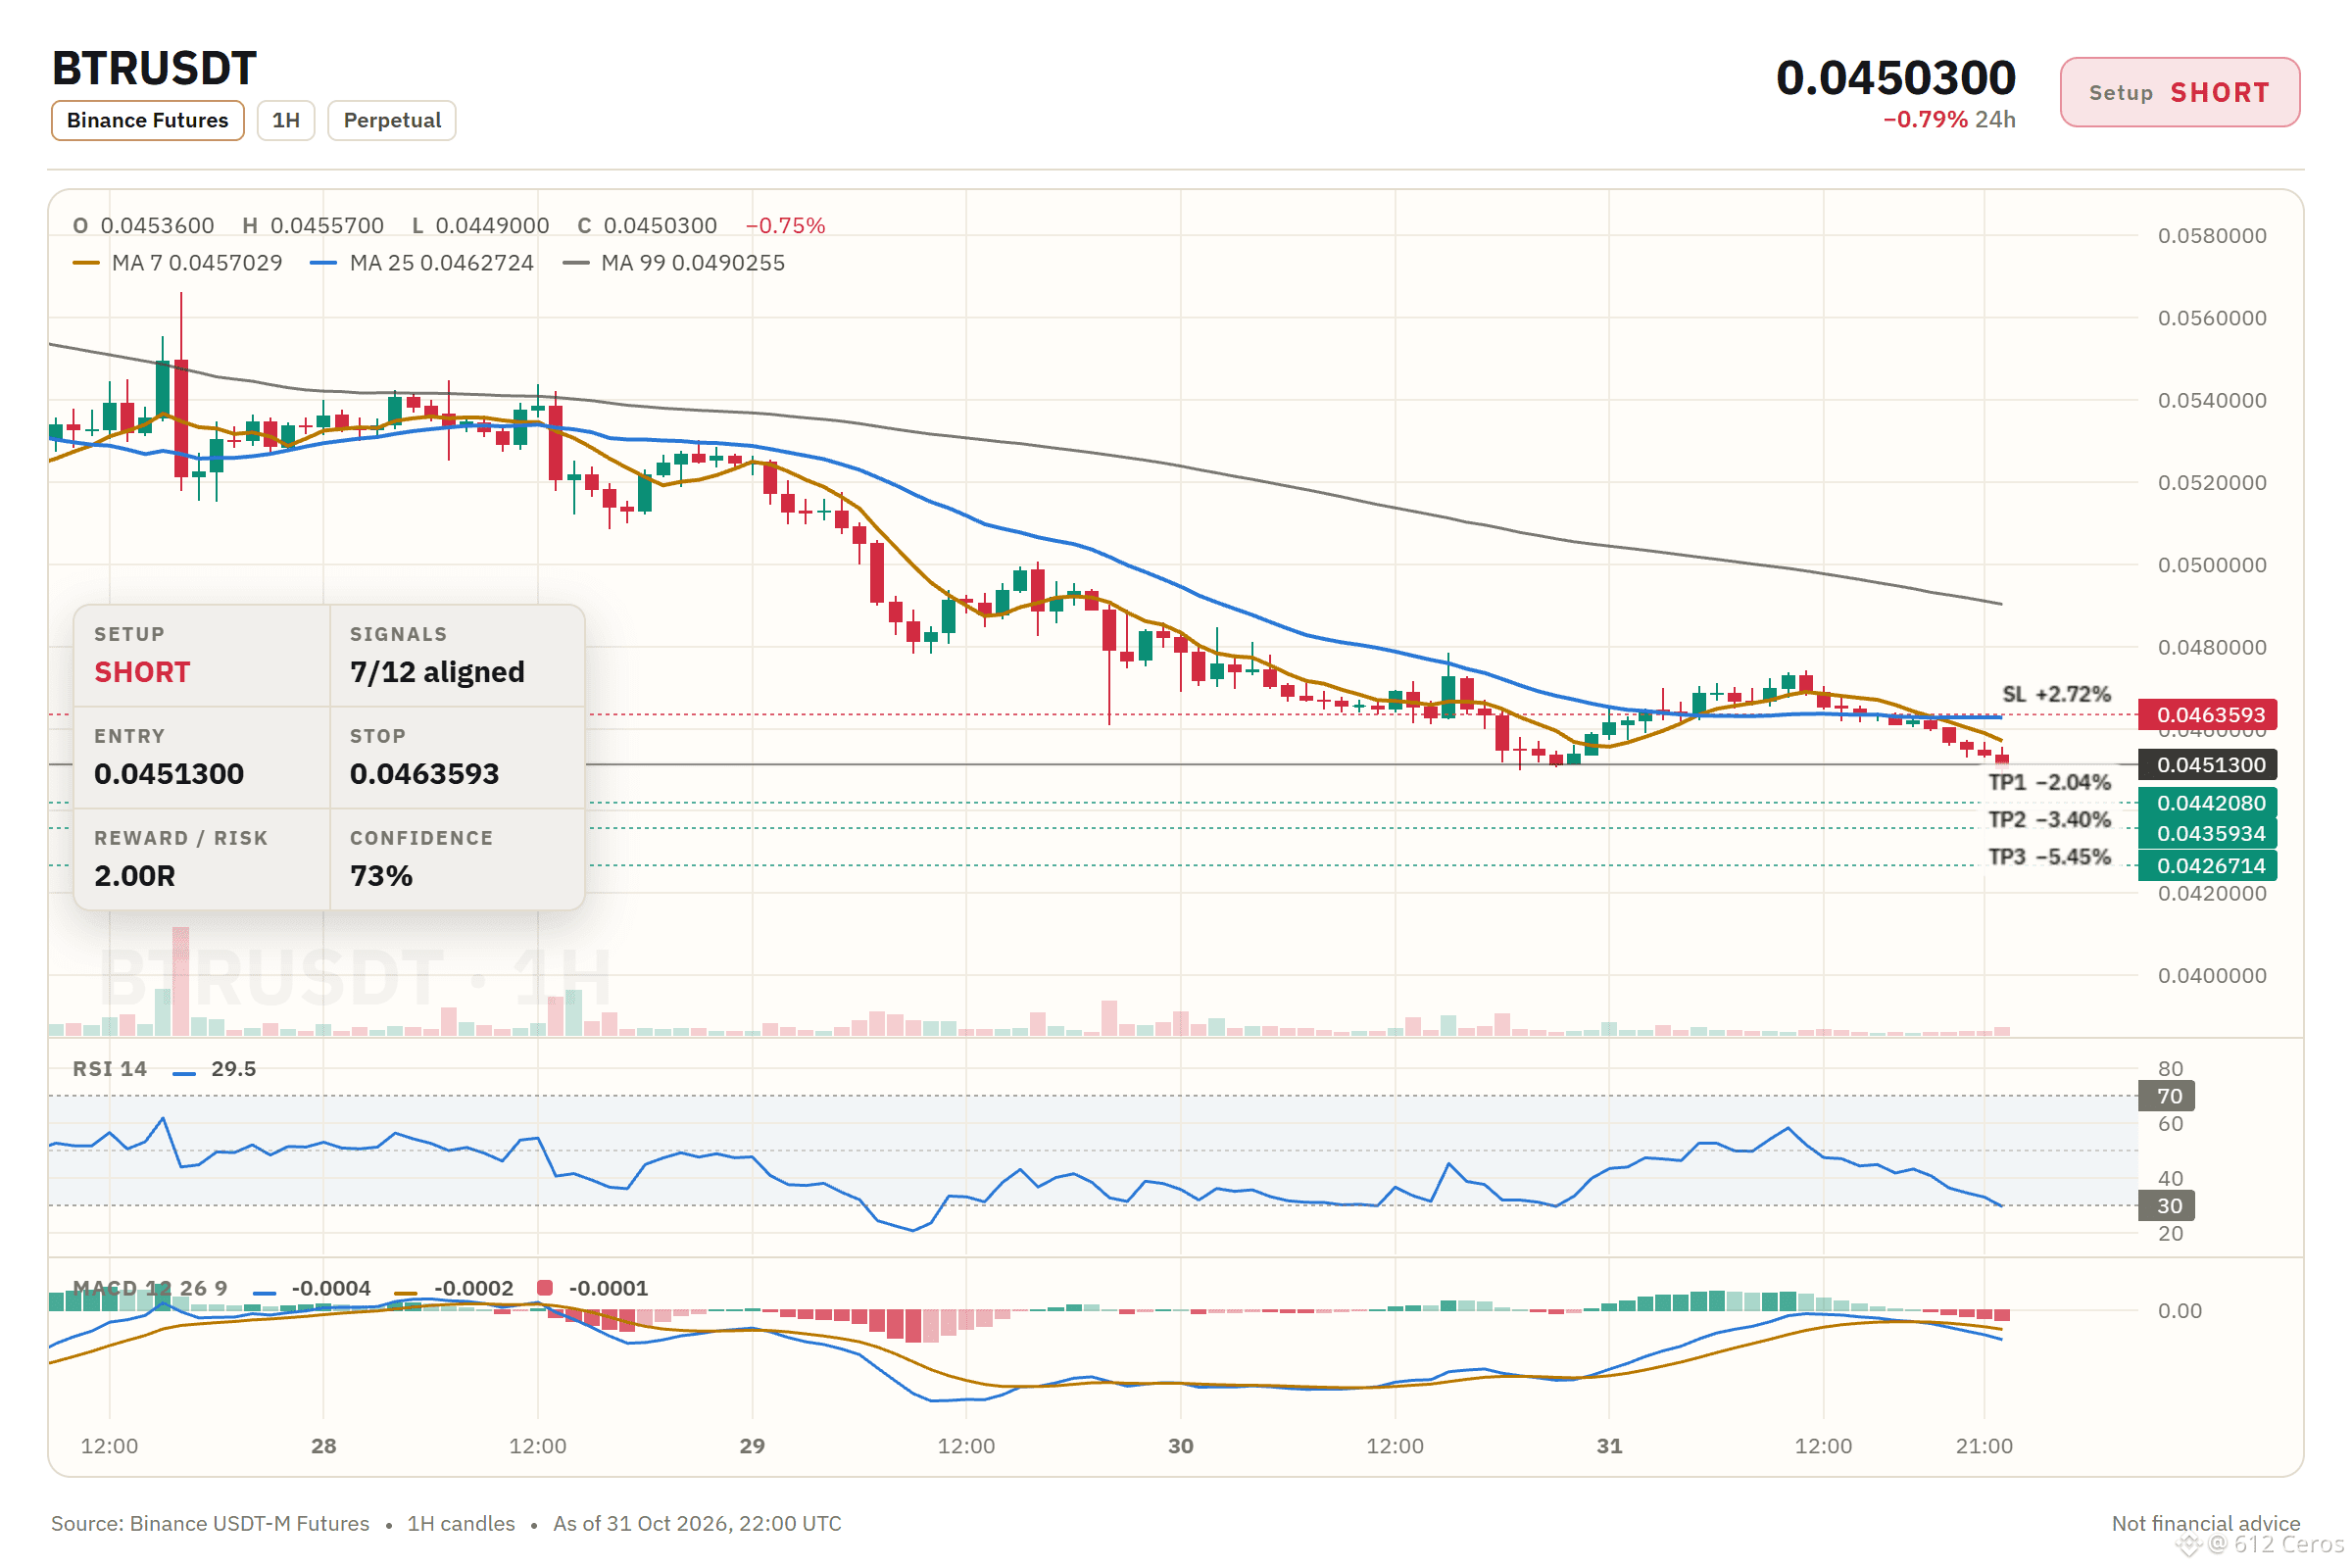
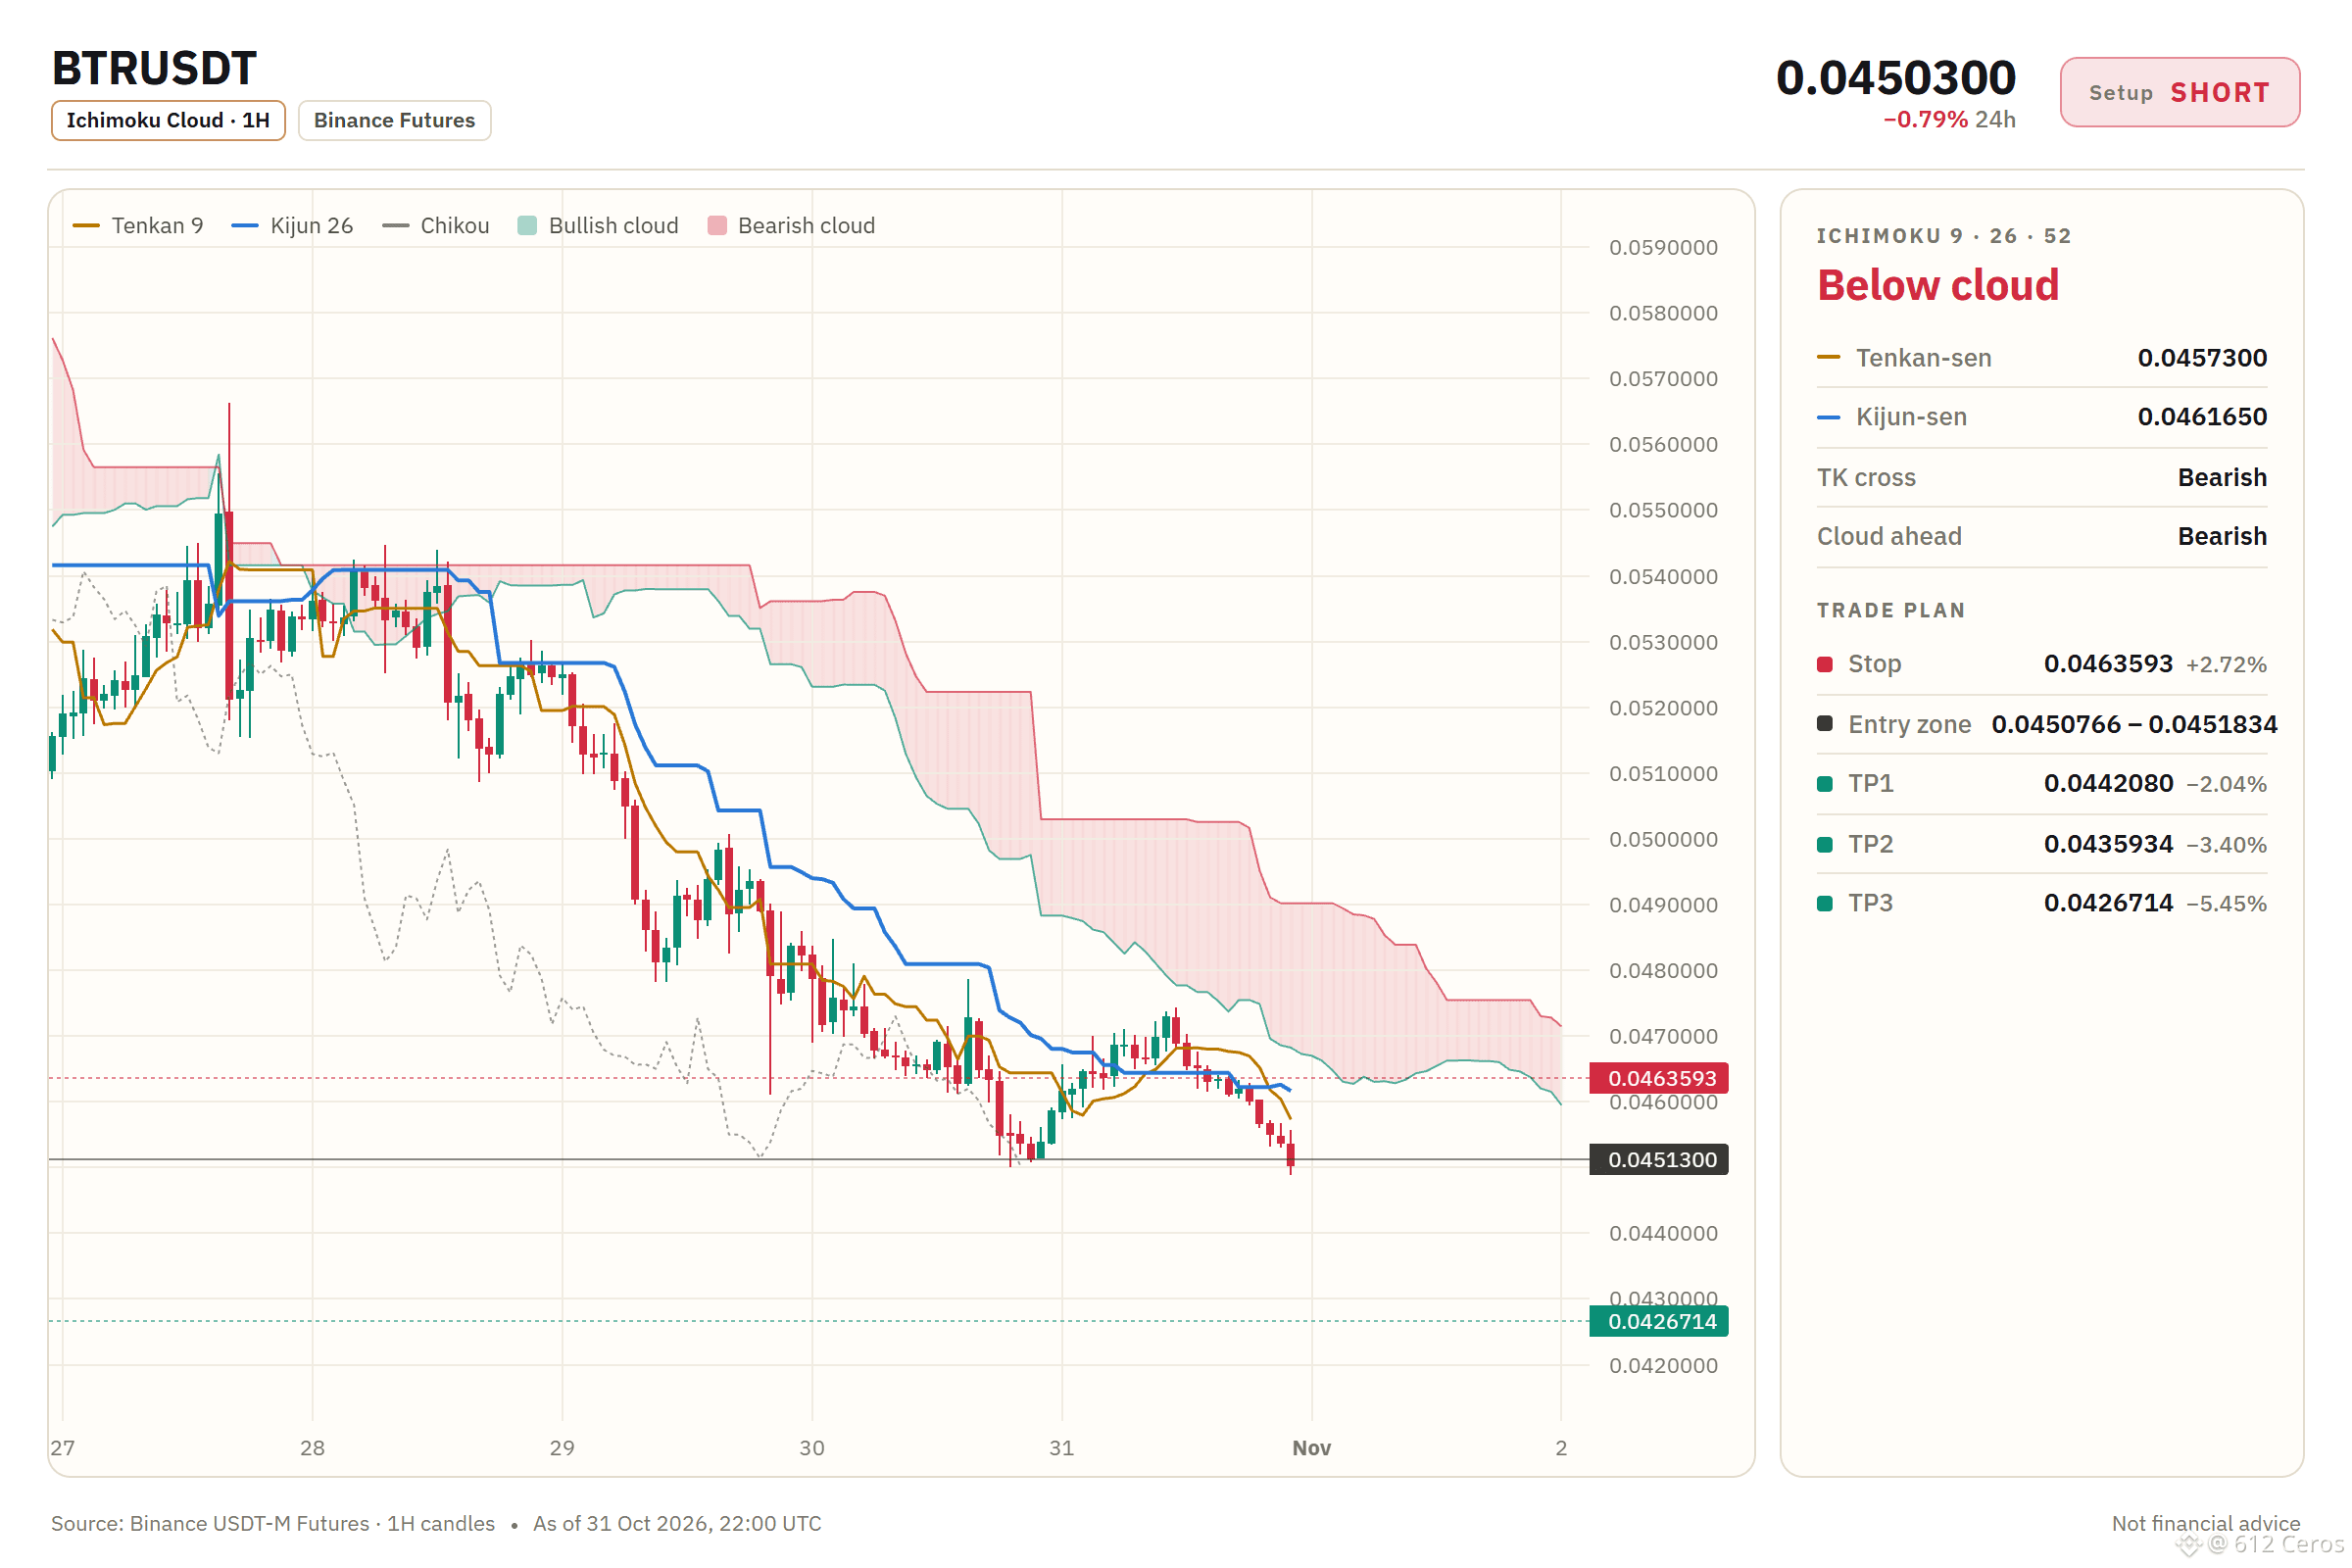
🔴 SHORT $BTR /USDT: expecting price to go DOWN
Bias: SHORT · Strong
Entry: 0.0450766 – 0.0451834
TP1: 0.0442080 (-2.0%)
TP2: 0.0435934 (-3.4%)
TP3: 0.0426714 (-5.4%)
SL: 0.0463593 (+2.7%)
Plan: enter only inside the zone, close 50% at TP1, 25% at TP2, 25% at TP3, and move the stop to entry after TP1.
Why SHORT? 7/12 signals agree, 2 against.
• Daily trend down (below EMA50 & EMA200)
• 4h trend down (below EMA50 & EMA200)
• 1h trend down (below EMA50 & EMA200)
Risk: Far below its average, bounce likely (−3.5 ATR from 1h EMA50)
BTR in 3 points:
1/3 The daily trend shows price below both EMAs in a bearish stack.
2/3 The 1h RSI sits at 20, meaning sellers have strong momentum.
3/3 A bounce from the 1h EMA50 would make this trade wrong.
Where would you place your invalidation level?
Full setup on the chart below.
{future}(BTRUSDT)
📲 Want more of my latest signals? Join me here:
[https://app.binance.com/uni-qr/D26WbL9t](https://app.binance.com/uni-qr/D26WbL9t)
⚠️ Personal market analysis only. NFA — manage risk and DYOR.
Educational content, not investment advice or a recommendation to buy, sell, deposit, or withdraw any asset. No paid promotion or referral/affiliate links.
Most traders will ignore this obvious bearish setup.
🔴 SHORT $BTR /USDT: expecting price to go DOWN
Bias: SHORT · Strong
Entry: 0.0450766 – 0.0451834
TP1: 0.0442080 (-2.0%)
TP2: 0.0435934 (-3.4%)
TP3: 0.0426714 (-5.4%)
SL: 0.0463593 (+2.7%)
Plan: enter only inside the zone, close 50% at TP1, 25% at TP2, 25% at TP3, and move the stop to entry after TP1.
Why SHORT? 7/12 signals agree, 2 against.
• Daily trend down (below EMA50 & EMA200)
• 4h trend down (below EMA50 & EMA200)
• 1h trend down (below EMA50 & EMA200)
Risk: Far below its average, bounce likely (−3.5 ATR from 1h EMA50)
BTR in 3 points:
1/3 The daily trend shows price below both EMAs in a bearish stack.
2/3 The 1h RSI sits at 20, meaning sellers have strong momentum.
3/3 A bounce from the 1h EMA50 would make this trade wrong.
Where would you place your invalidation level?
Full setup on the chart below.
📲 Want more of my latest signals? Join me here:
https://app.binance.com/uni-qr/D26WbL9t
⚠️ Personal market analysis only. NFA — manage risk and DYOR.
Educational content, not investment advice or a recommendation to buy, sell, deposit, or withdraw any asset. No paid promotion or referral/affiliate links.
1
1
631
·
--
Bearish
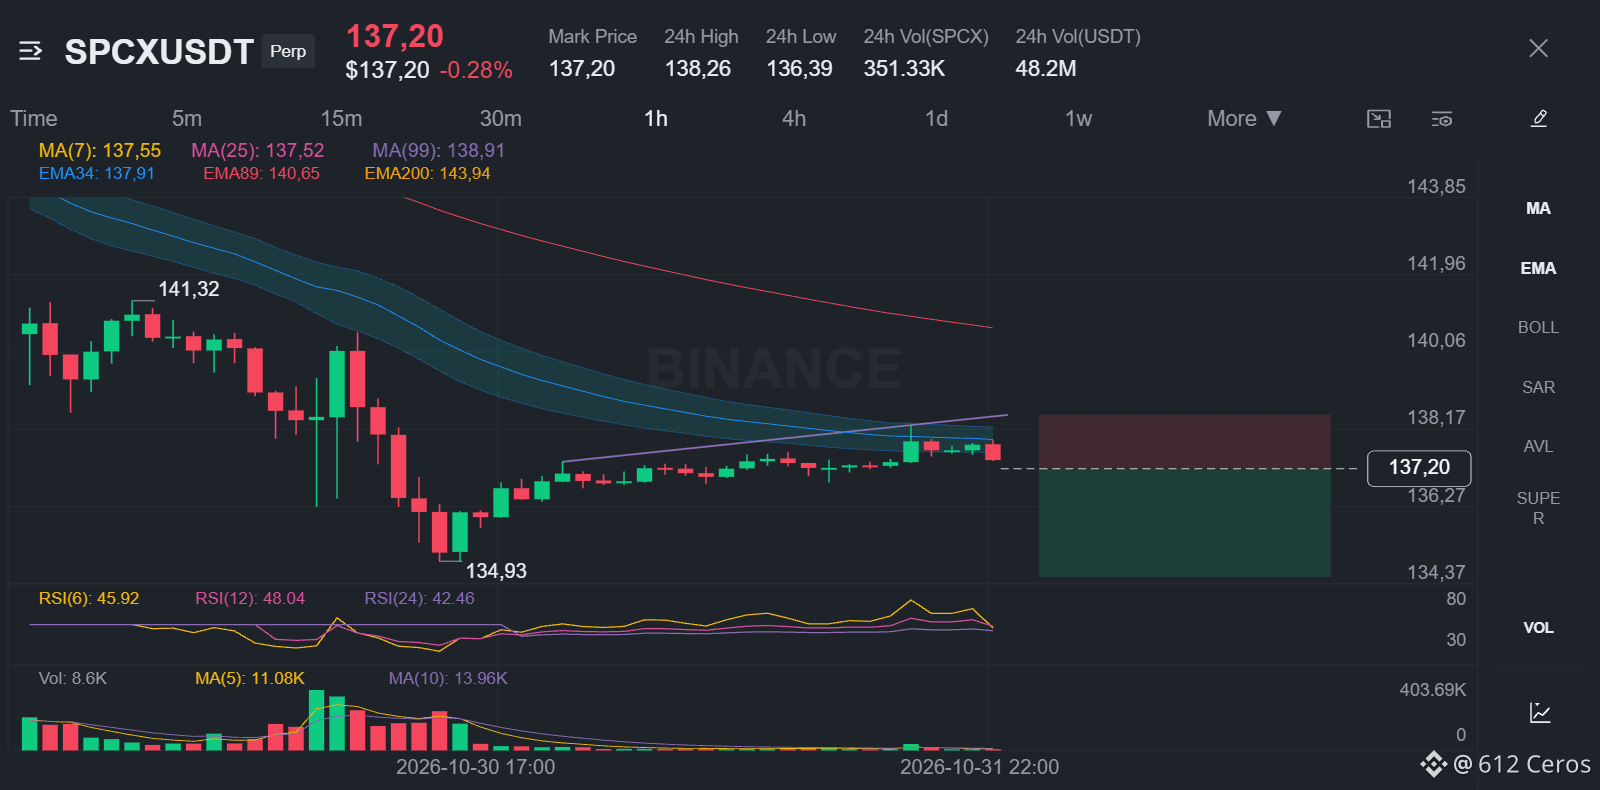
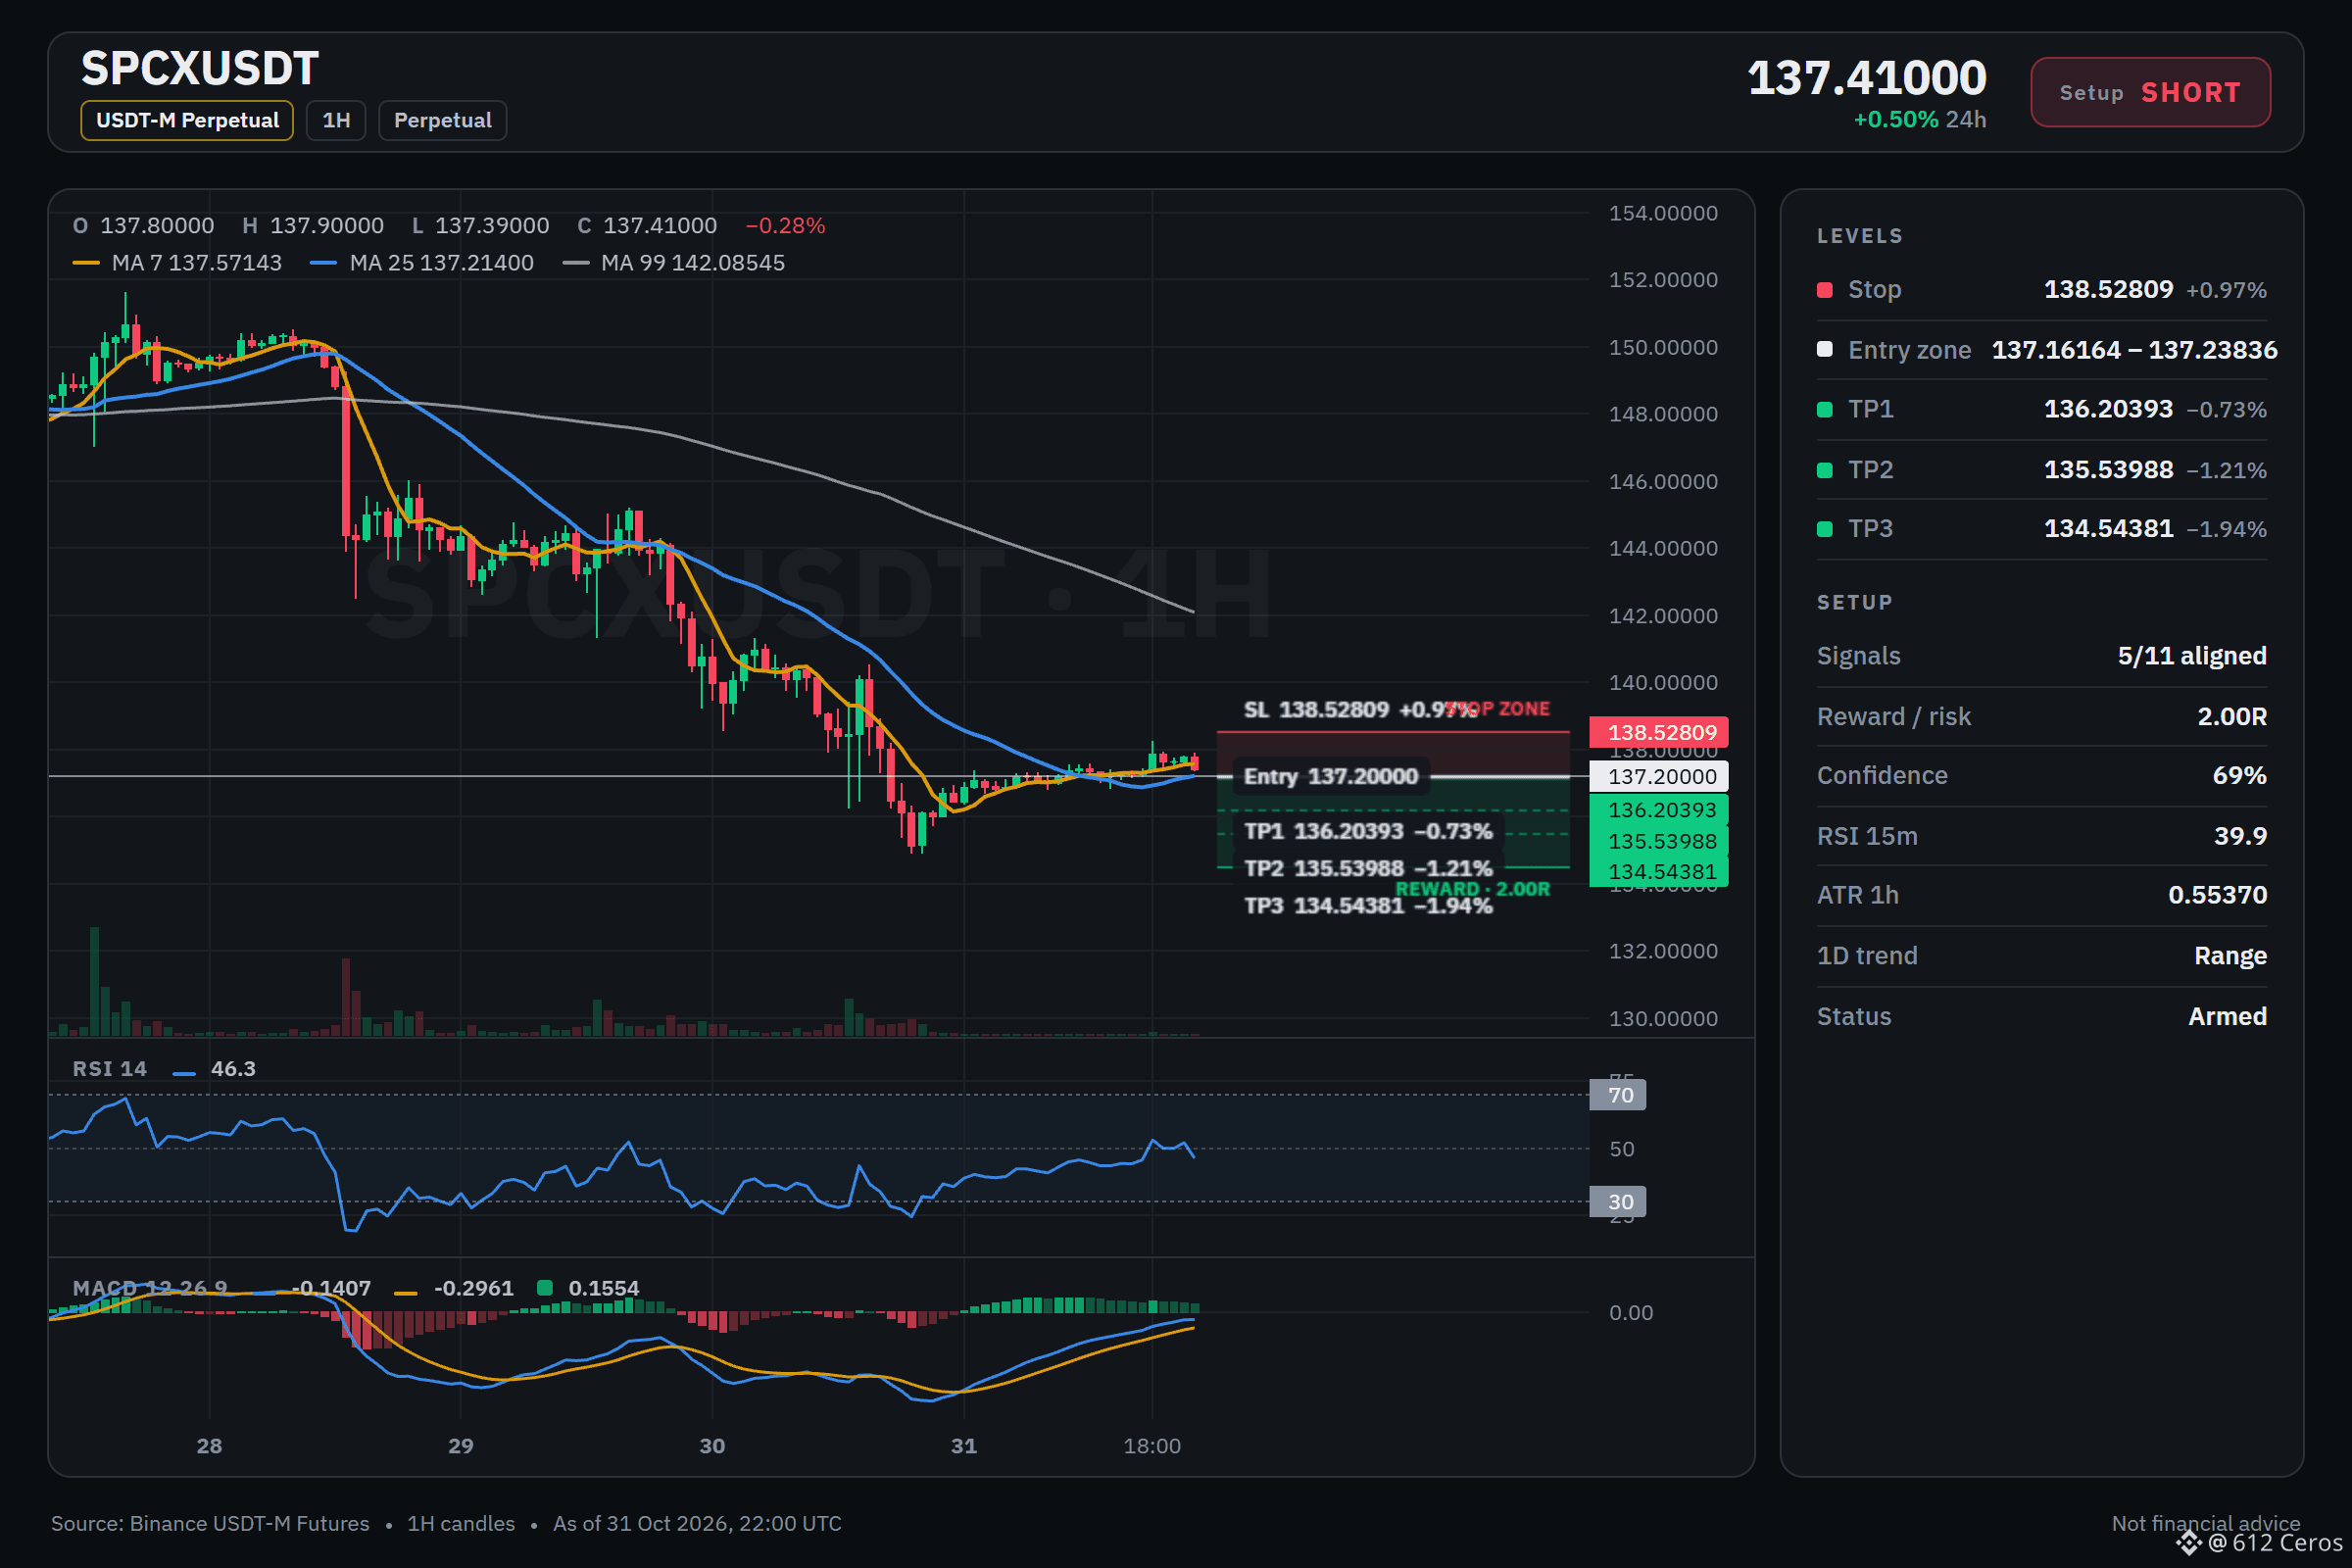
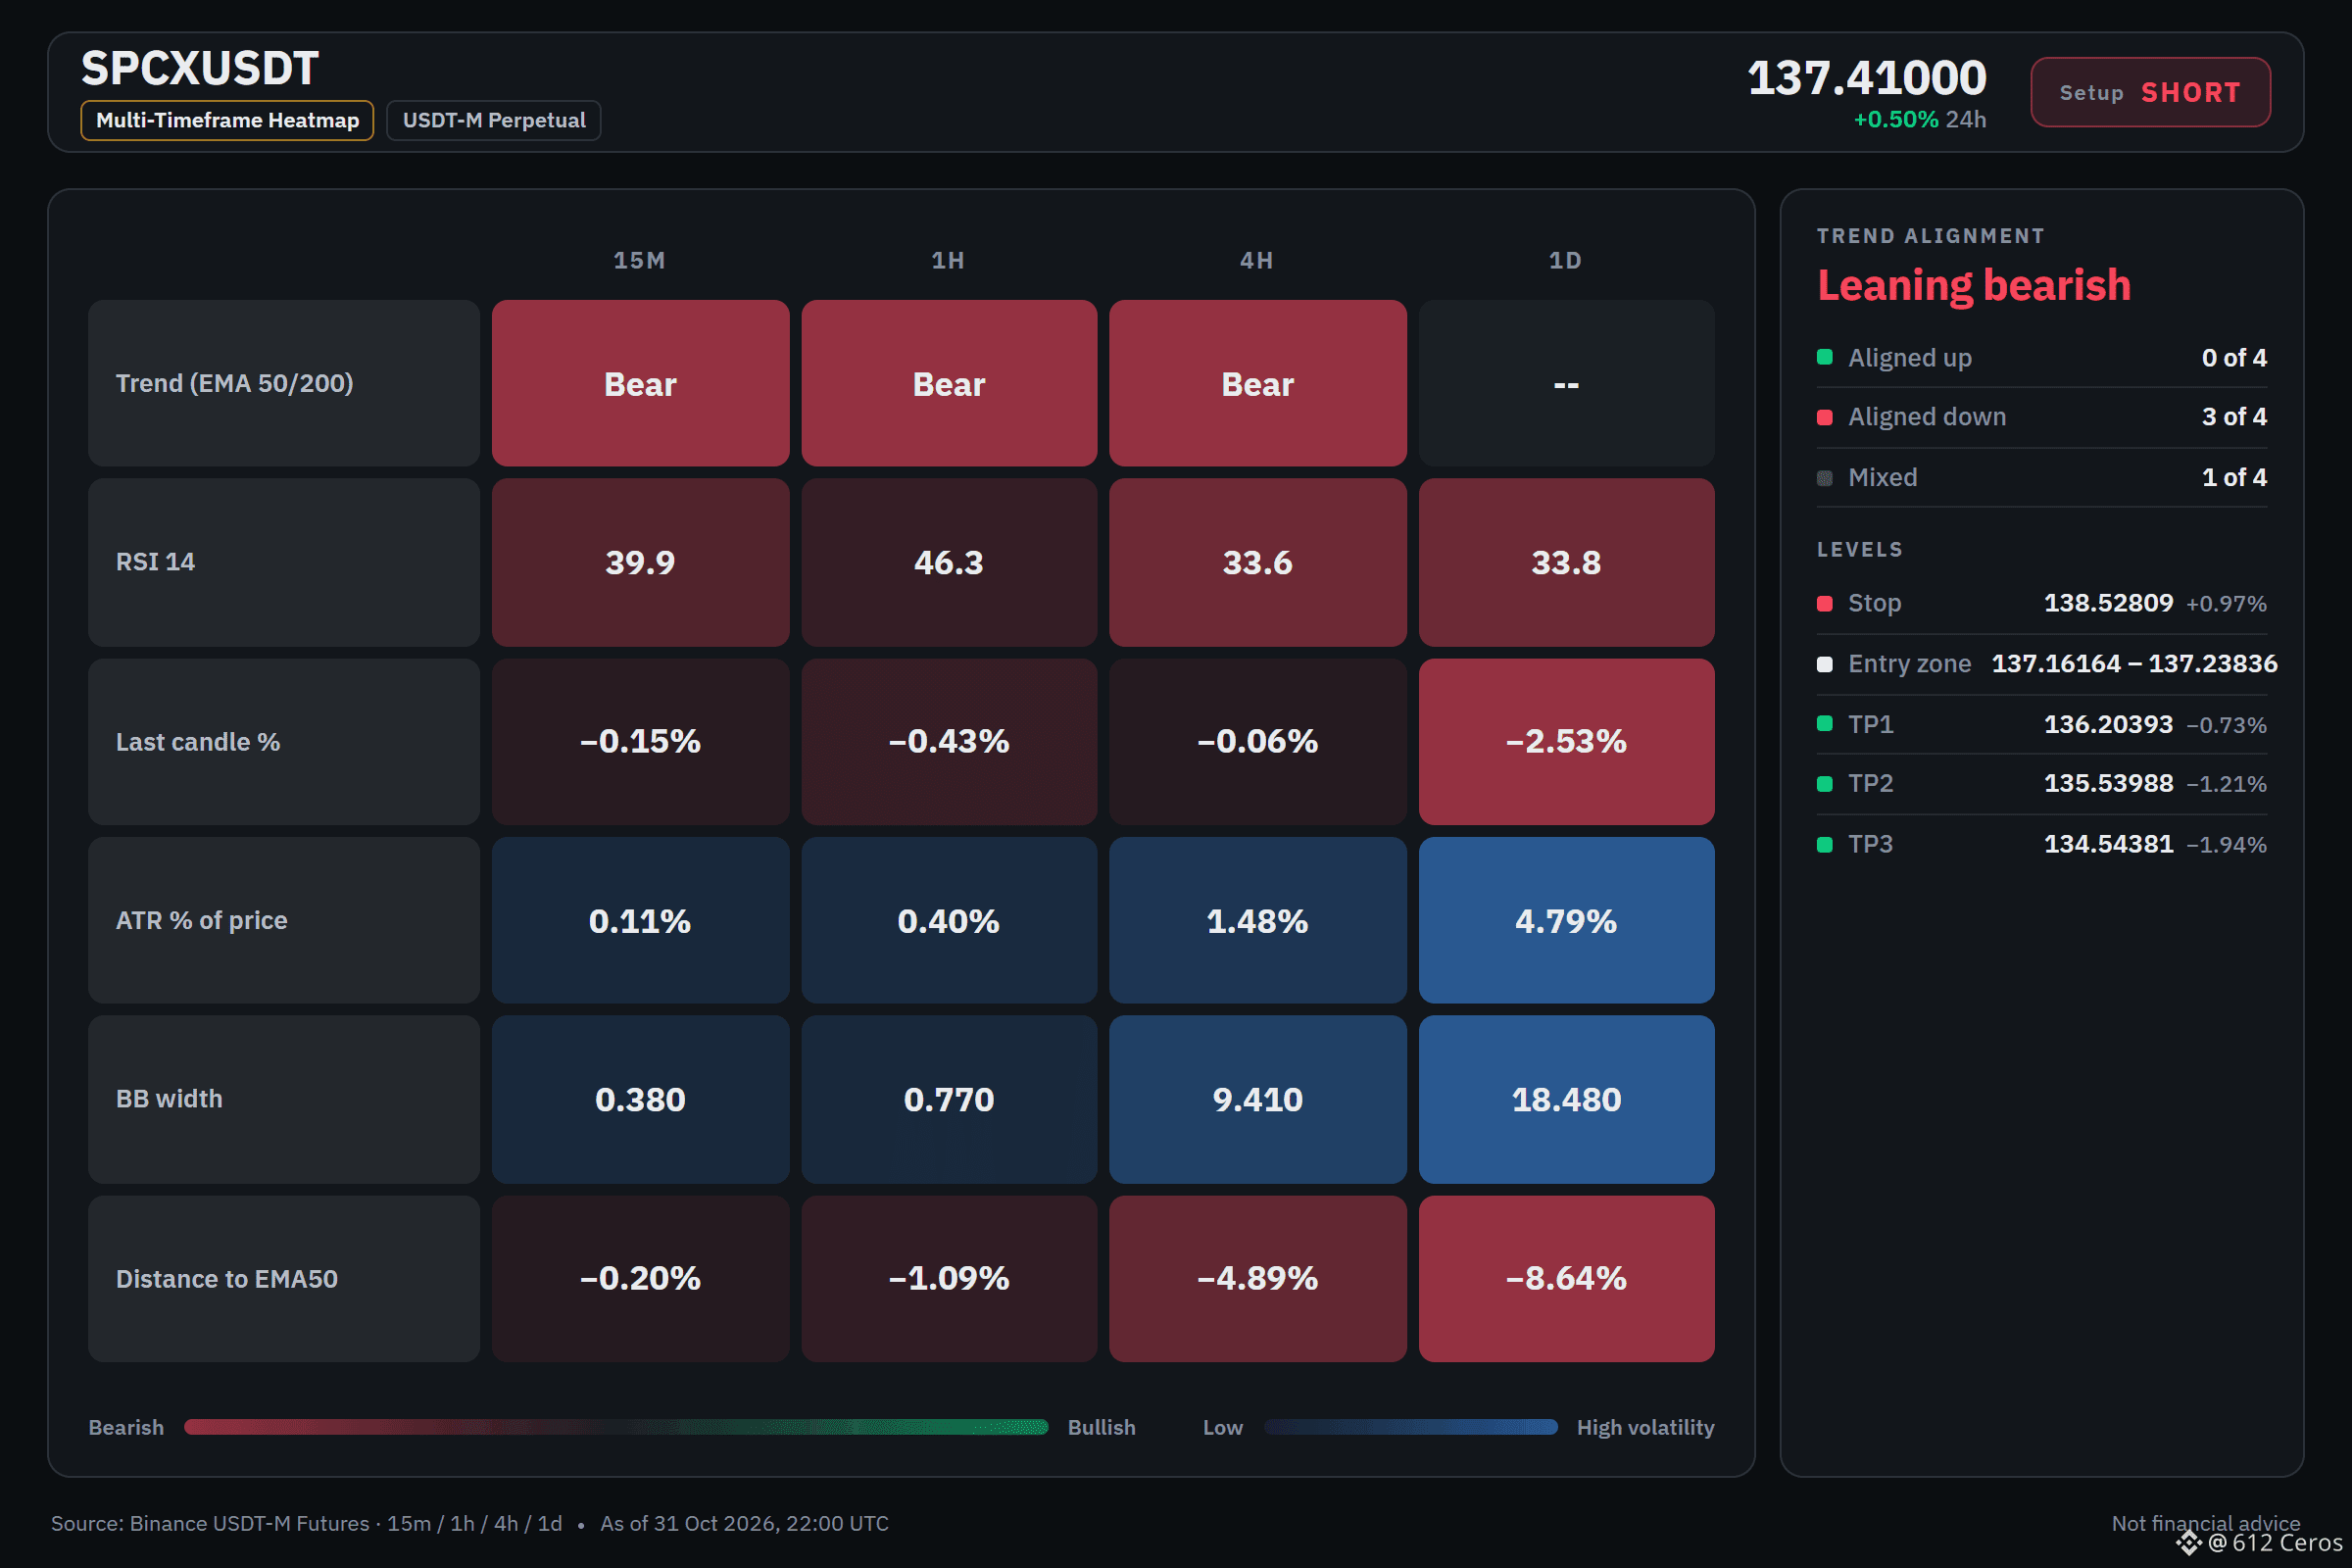
Is SPCX about to break its bearish stack?
🔴 SHORT $SPCX /USDT: expecting price to go DOWN
Bias: SHORT · Leaning
Entry: 137.16164 – 137.23836
TP1: 136.20393 (-0.7%)
TP2: 135.53988 (-1.2%)
TP3: 134.54381 (-1.9%)
SL: 138.52809 (+1.0%)
Plan: enter only inside the zone, close 50% at TP1, 25% at TP2, 25% at TP3, and move the stop to entry after TP1.
Note: moderate conviction only, keep size light.
Why SHORT? What I checked: 5/11 agree, 1 against.
• 4h trend down (below EMA50 & EMA200)
• 1h trend down (below EMA50 & EMA200)
• Sellers are driving the move (15m ADX 21.6)
Watch: Range bottom, buyers often step in (RSI z −2.11)
Watch: The idea is wrong if price reaches the stop at 138.52809
Verdict: The 4h trend shows price below EMA50 and EMA200, but RSI z-score minus 2.11 in a range hints at a bounce, so conviction is moderate.
What is your level if you skip this short?
Full setup on the chart below.
{future}(SPCXUSDT)
📲 Want more of my latest signals? Join me here:
[https://app.binance.com/uni-qr/D26WbL9t](https://app.binance.com/uni-qr/D26WbL9t)
⚠️ Personal market analysis only. NFA — manage risk and DYOR.
Educational content, not investment advice or a recommendation to buy, sell, deposit, or withdraw any asset. No paid promotion or referral/affiliate links.
Is SPCX about to break its bearish stack?
🔴 SHORT $SPCX /USDT: expecting price to go DOWN
Bias: SHORT · Leaning
Entry: 137.16164 – 137.23836
TP1: 136.20393 (-0.7%)
TP2: 135.53988 (-1.2%)
TP3: 134.54381 (-1.9%)
SL: 138.52809 (+1.0%)
Plan: enter only inside the zone, close 50% at TP1, 25% at TP2, 25% at TP3, and move the stop to entry after TP1.
Note: moderate conviction only, keep size light.
Why SHORT? What I checked: 5/11 agree, 1 against.
• 4h trend down (below EMA50 & EMA200)
• 1h trend down (below EMA50 & EMA200)
• Sellers are driving the move (15m ADX 21.6)
Watch: Range bottom, buyers often step in (RSI z −2.11)
Watch: The idea is wrong if price reaches the stop at 138.52809
Verdict: The 4h trend shows price below EMA50 and EMA200, but RSI z-score minus 2.11 in a range hints at a bounce, so conviction is moderate.
What is your level if you skip this short?
Full setup on the chart below.
📲 Want more of my latest signals? Join me here:
https://app.binance.com/uni-qr/D26WbL9t
⚠️ Personal market analysis only. NFA — manage risk and DYOR.
Educational content, not investment advice or a recommendation to buy, sell, deposit, or withdraw any asset. No paid promotion or referral/affiliate links.
1
669
·
--
Bearish
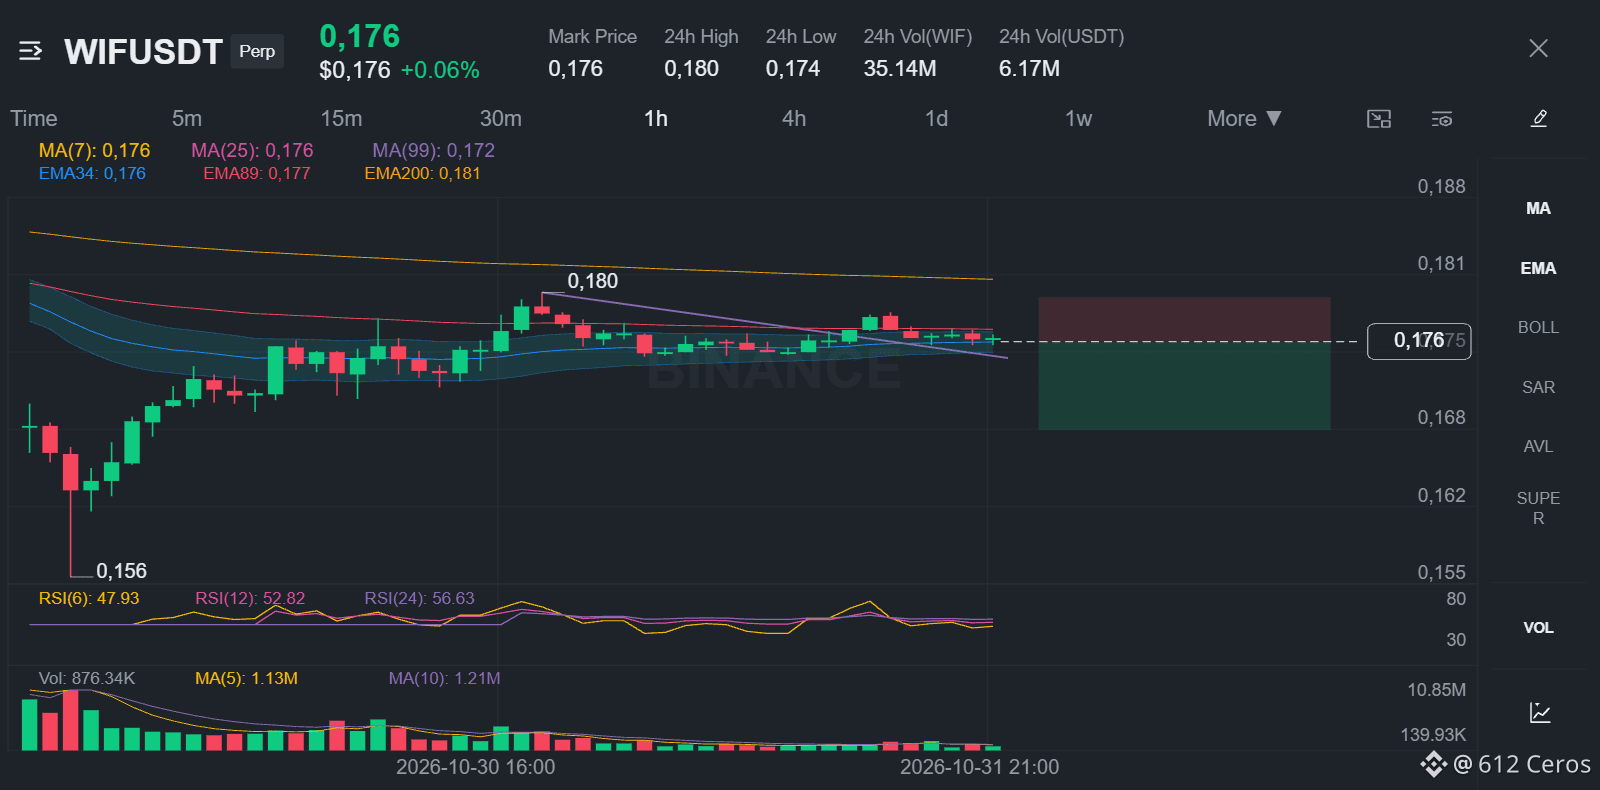
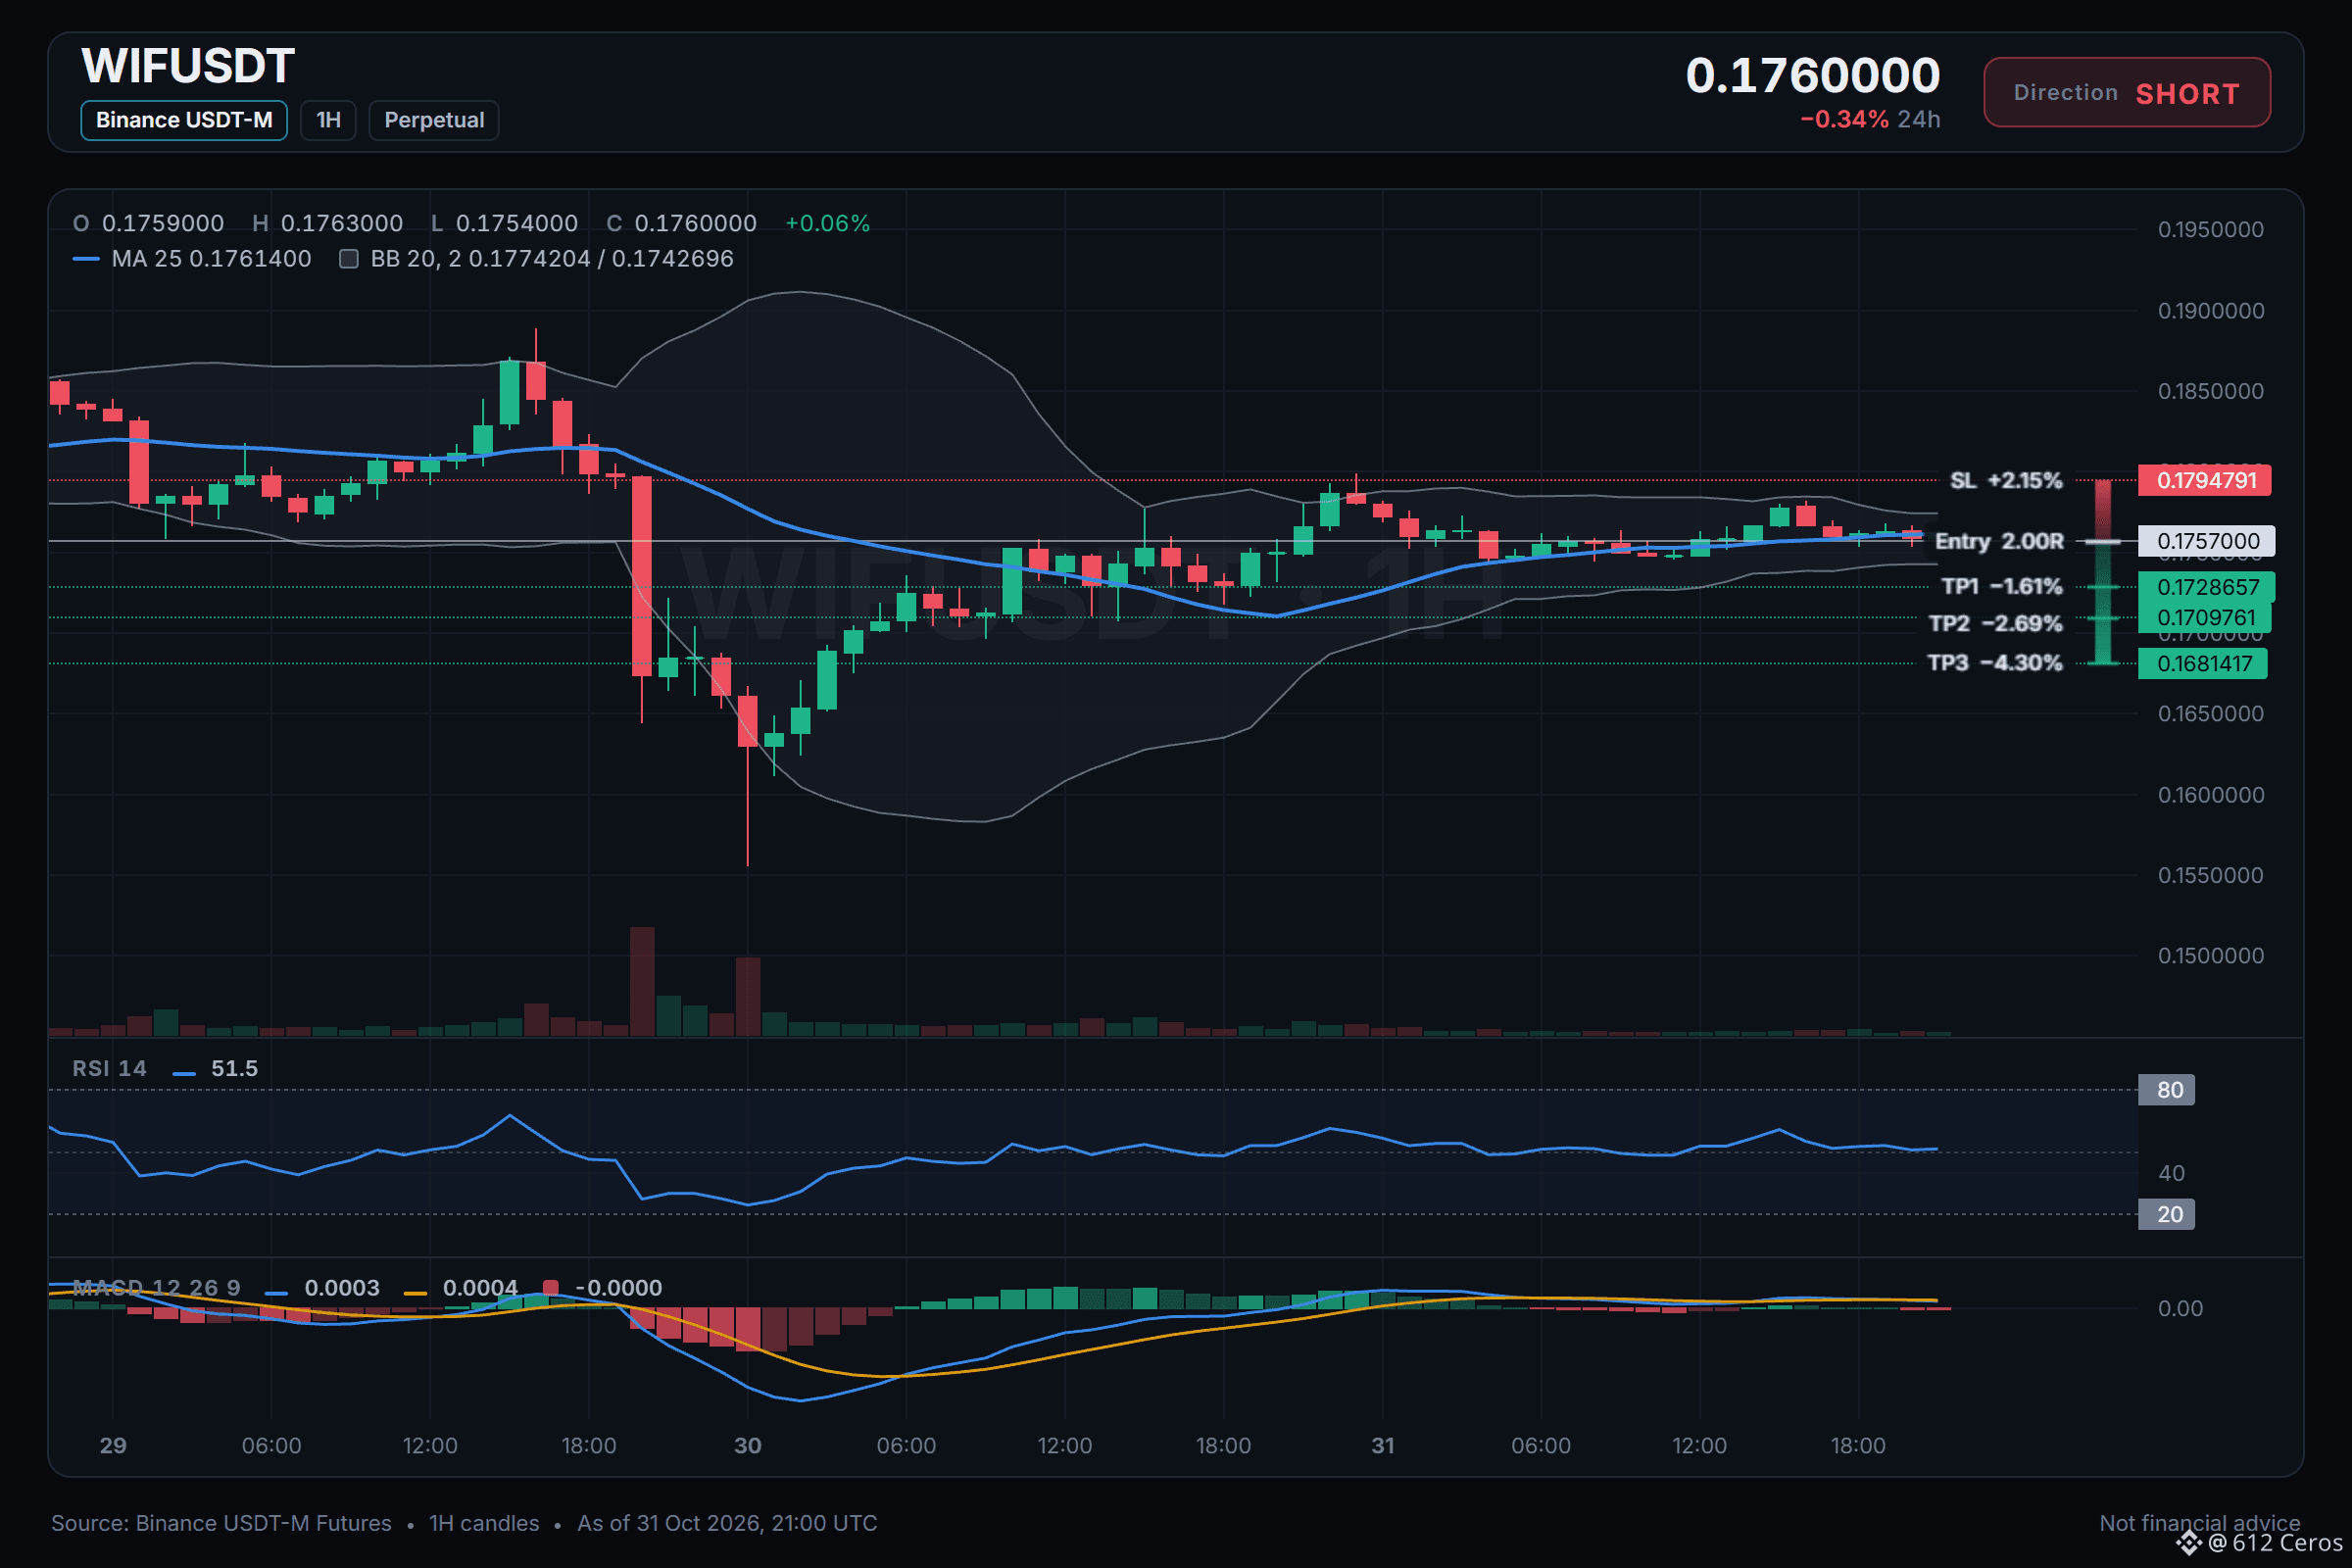
🔴 SHORT $WIF /USDT: expecting price to go DOWN
Bias: SHORT · Leaning
Entry: 0.1755610 – 0.1758390
TP1: 0.1728657 (-1.6%)
TP2: 0.1709761 (-2.7%)
TP3: 0.1681417 (-4.3%)
SL: 0.1794791 (+2.2%)
Plan: enter only inside the zone, close 50% at TP1, 25% at TP2, 25% at TP3, and move the stop to entry after TP1.
Note: moderate conviction only, keep size light.
WIF looks weak but has not convinced me yet.
Why SHORT? 3/12 signals agree, 0 against.
• 4h trend down (below EMA50 & EMA200)
• 1h trend down (below EMA50 & EMA200)
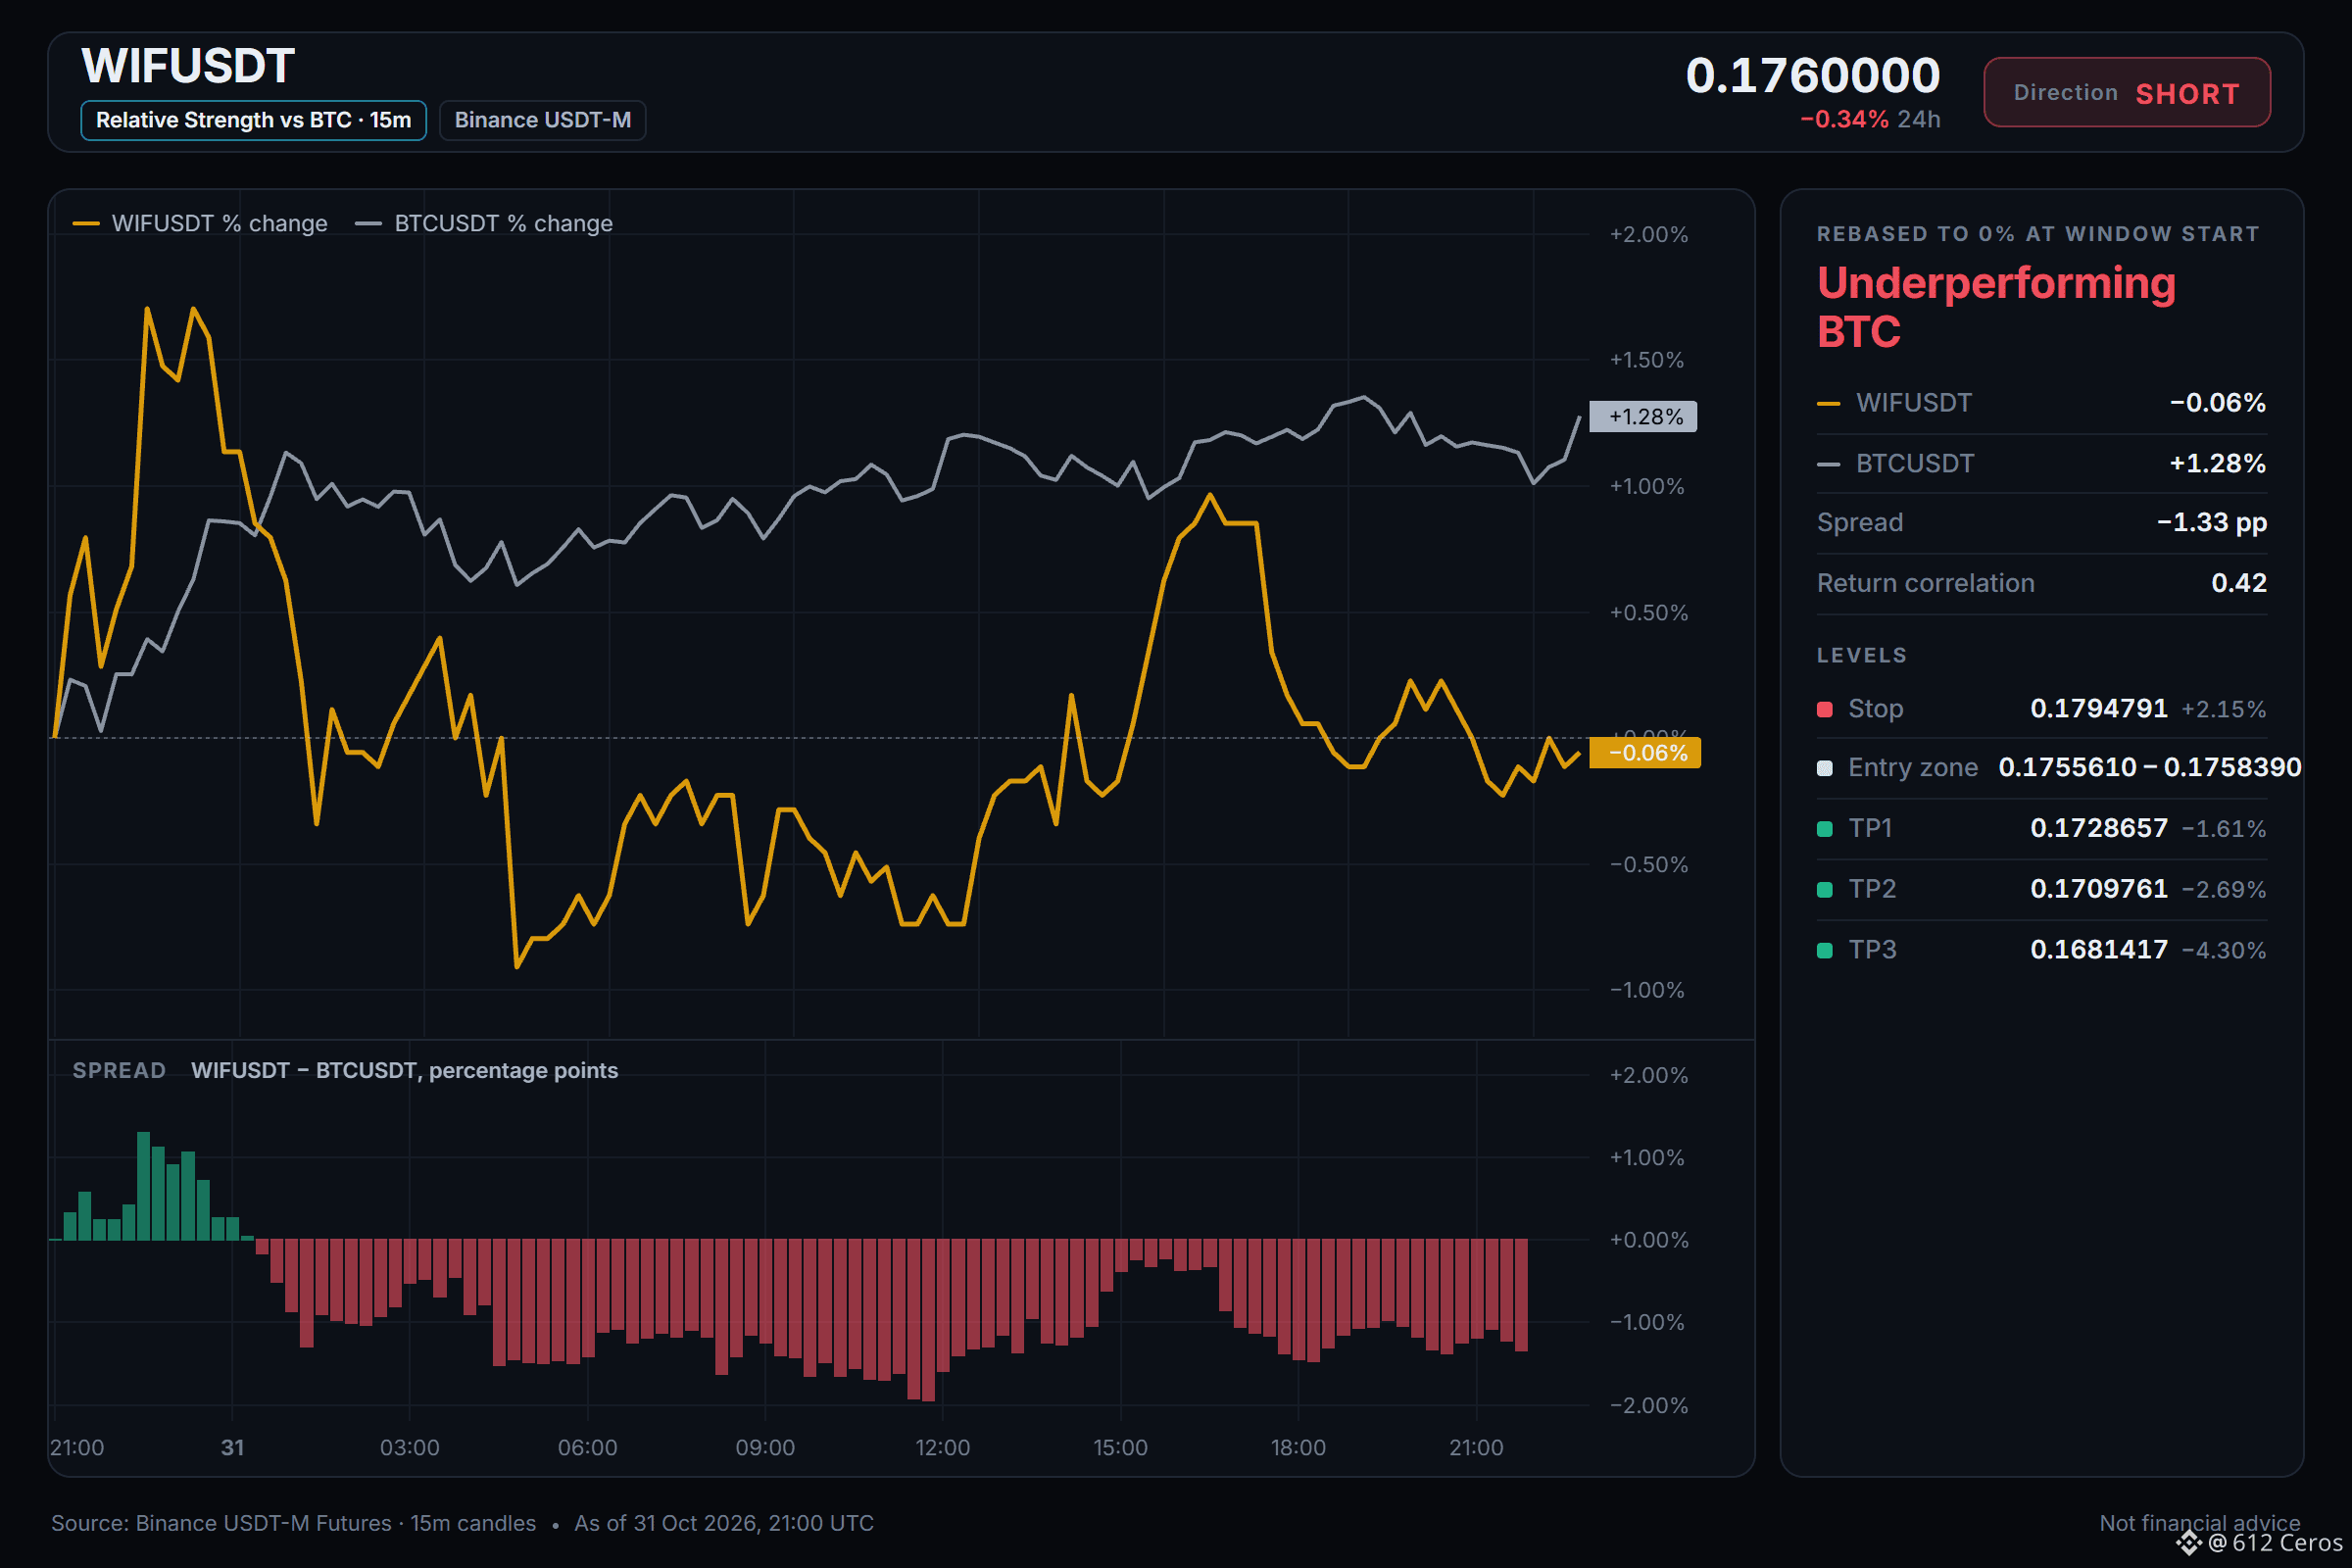
• Weaker than BTC (−1.59% 24h vs BTC)
The 4h trend shows price below both EMAs in a bearish stack, and the 1h trend matches. The 1h price is 0.1757000.
What is your invalidation level for WIF?
Levels mapped on the chart below.
{future}(WIFUSDT)
📲 Want more of my latest signals? Join me here:
[https://app.binance.com/uni-qr/D26WbL9t](https://app.binance.com/uni-qr/D26WbL9t)
⚠️ Personal market analysis only. NFA — manage risk and DYOR.
Educational content, not investment advice or a recommendation to buy, sell, deposit, or withdraw any asset. No paid promotion or referral/affiliate links.
🔴 SHORT $WIF /USDT: expecting price to go DOWN
Bias: SHORT · Leaning
Entry: 0.1755610 – 0.1758390
TP1: 0.1728657 (-1.6%)
TP2: 0.1709761 (-2.7%)
TP3: 0.1681417 (-4.3%)
SL: 0.1794791 (+2.2%)
Plan: enter only inside the zone, close 50% at TP1, 25% at TP2, 25% at TP3, and move the stop to entry after TP1.
Note: moderate conviction only, keep size light.
WIF looks weak but has not convinced me yet.
Why SHORT? 3/12 signals agree, 0 against.
• 4h trend down (below EMA50 & EMA200)
• 1h trend down (below EMA50 & EMA200)
• Weaker than BTC (−1.59% 24h vs BTC)
The 4h trend shows price below both EMAs in a bearish stack, and the 1h trend matches. The 1h price is 0.1757000.
What is your invalidation level for WIF?
Levels mapped on the chart below.
📲 Want more of my latest signals? Join me here:
https://app.binance.com/uni-qr/D26WbL9t
⚠️ Personal market analysis only. NFA — manage risk and DYOR.
Educational content, not investment advice or a recommendation to buy, sell, deposit, or withdraw any asset. No paid promotion or referral/affiliate links.
1
1
1.3k
·
--
Bearish
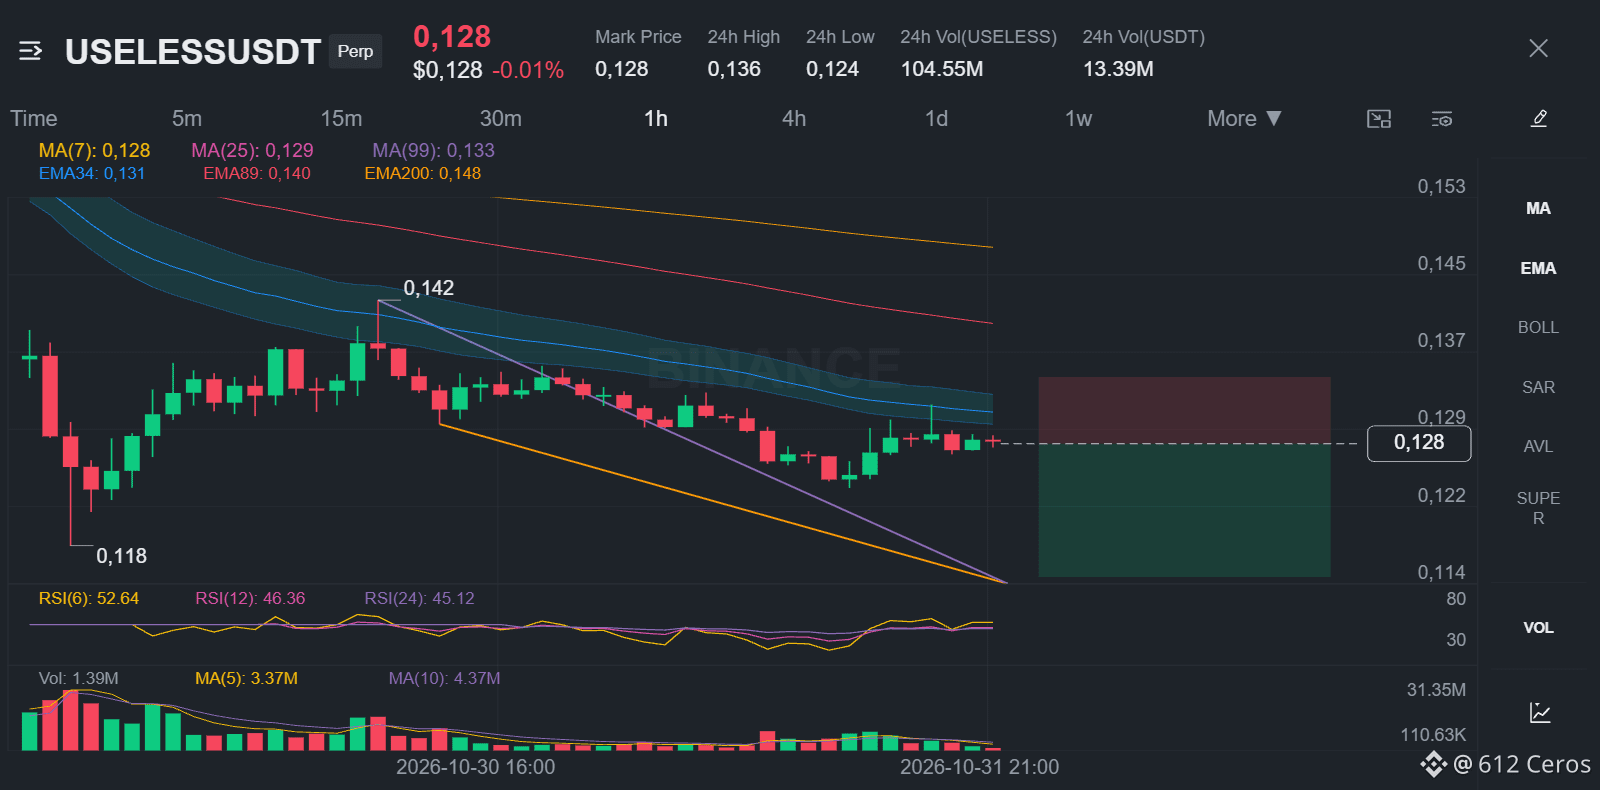
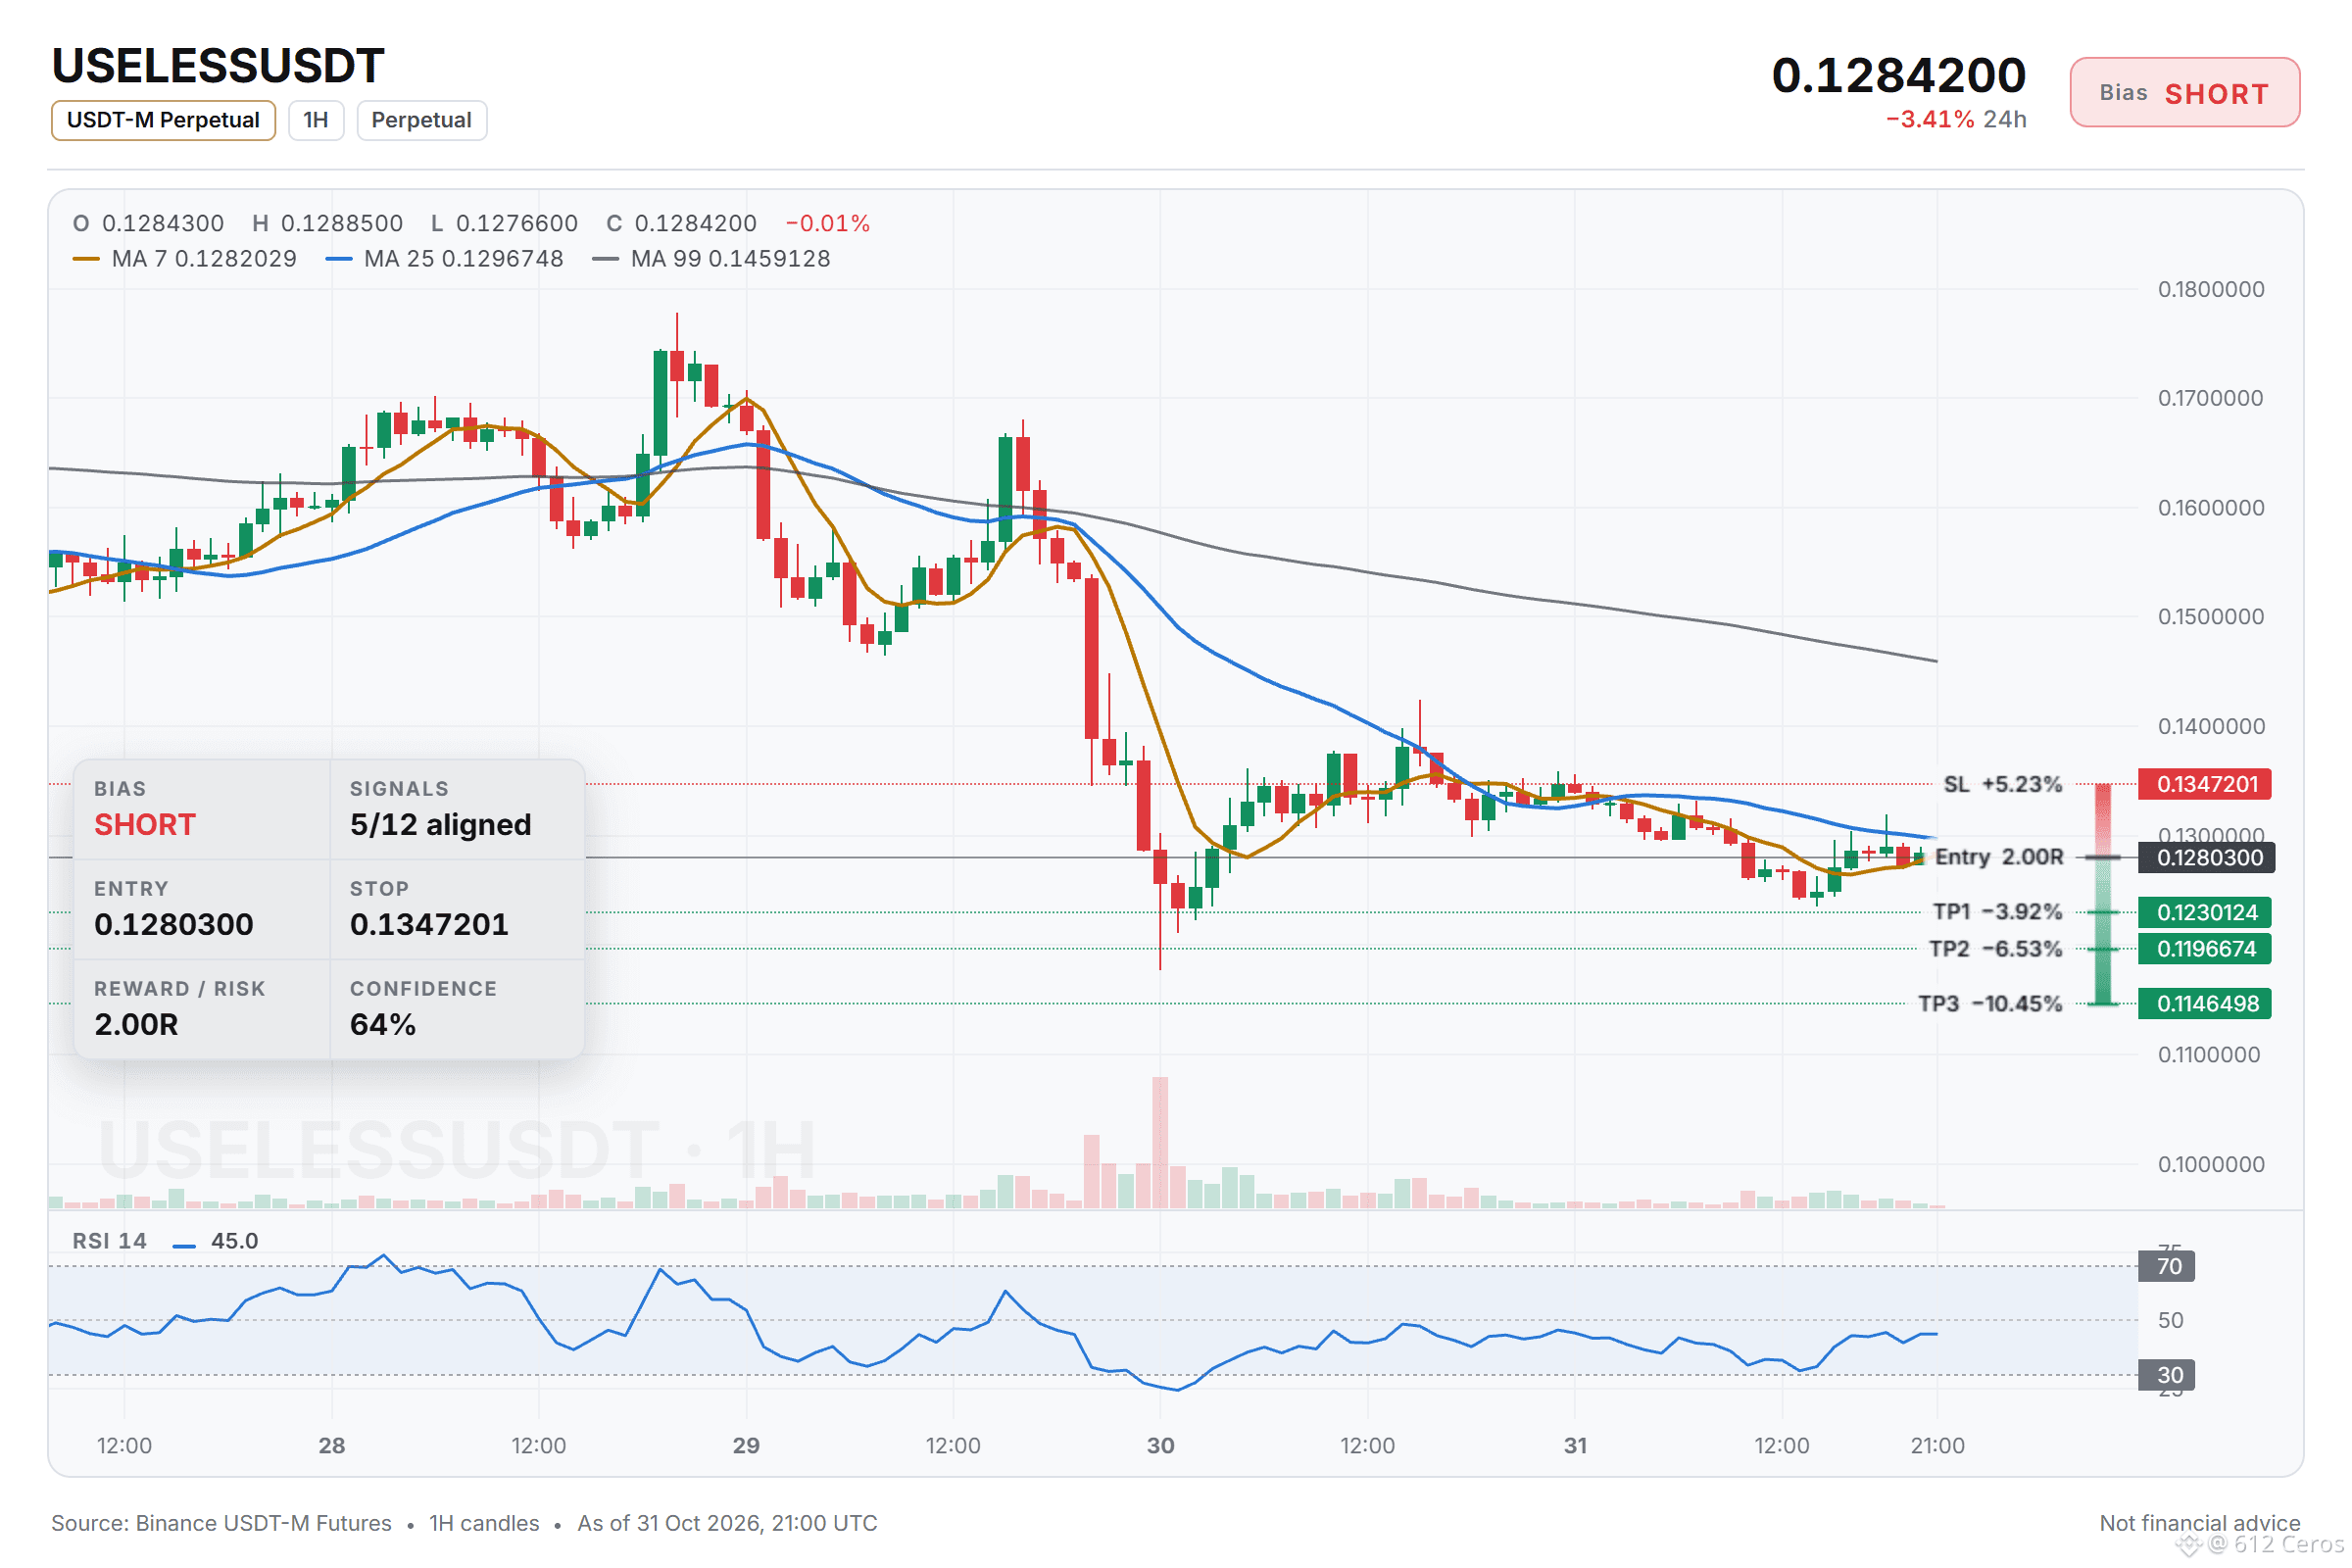
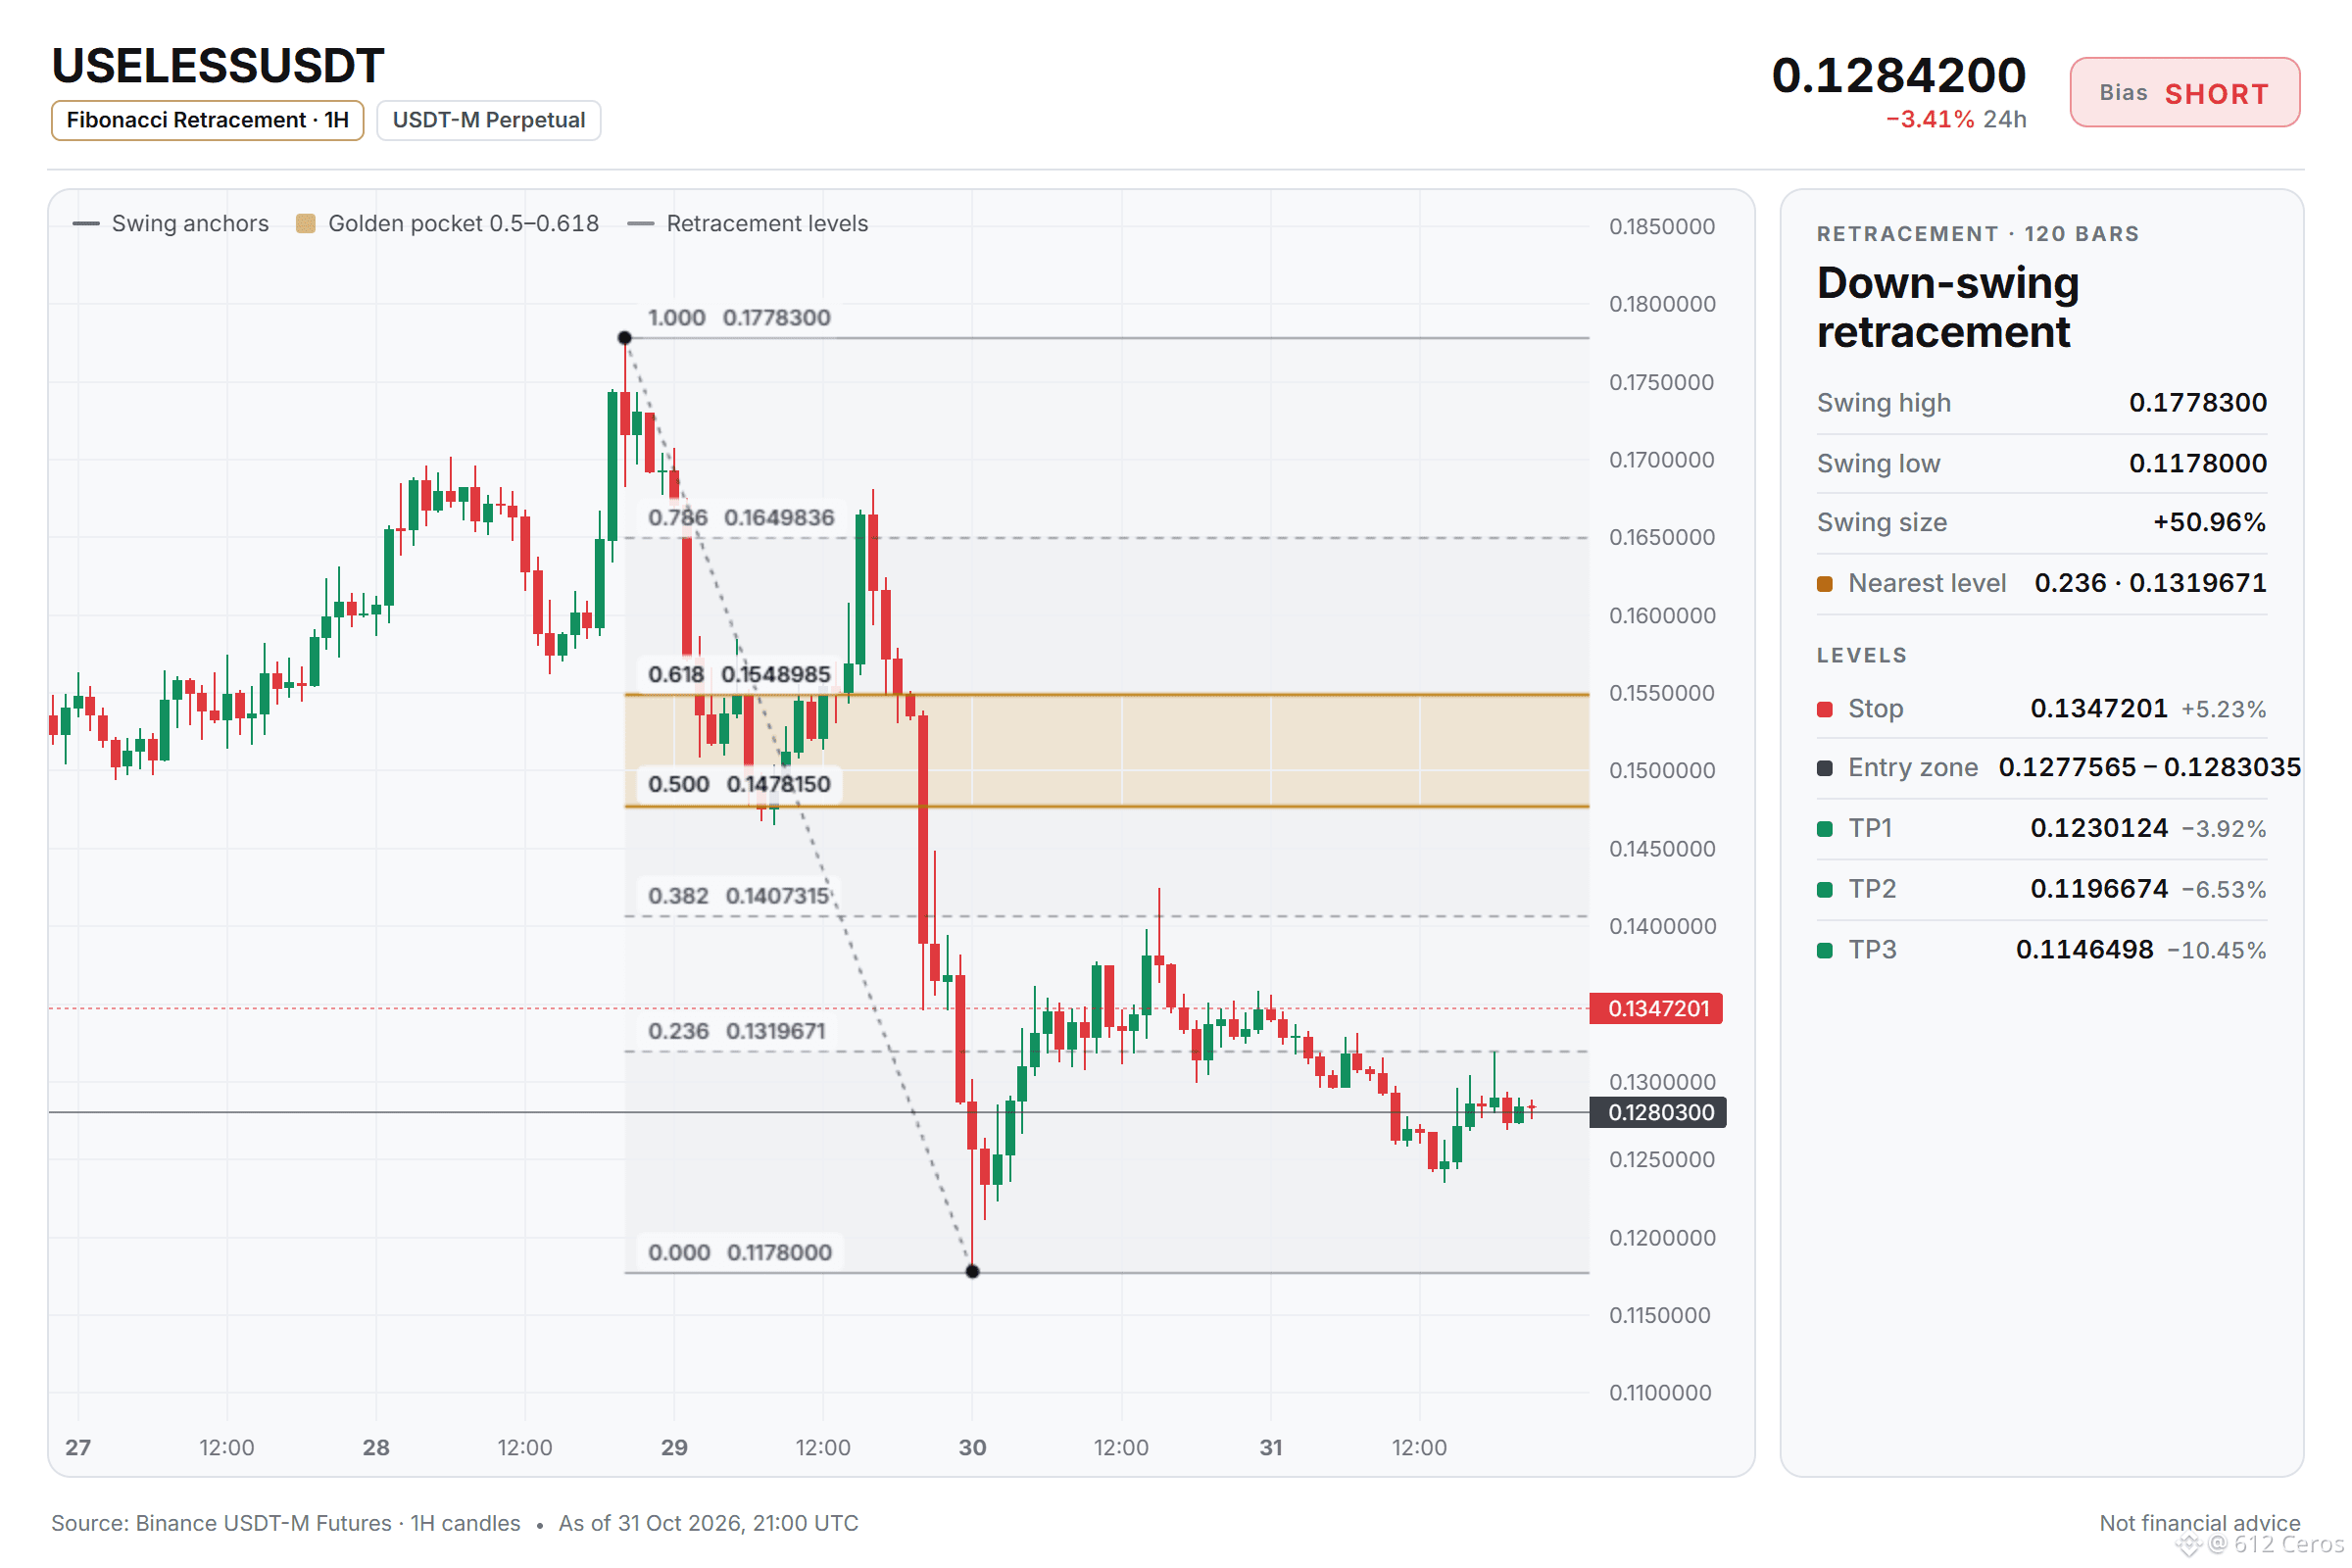
USELESS short setup: the levels I'm watching
🔴 SHORT $USELESS /USDT: expecting price to go DOWN
Bias: SHORT · Leaning
Entry: 0.1277565 – 0.1283035
TP1: 0.1230124 (-3.9%)
TP2: 0.1196674 (-6.5%)
TP3: 0.1146498 (-10.5%)
SL: 0.1347201 (+5.2%)
Plan: enter only inside the zone, close 50% at TP1, 25% at TP2, 25% at TP3, and move the stop to entry after TP1.
Note: moderate conviction only, keep size light.
Why SHORT? 5/12 signals agree, 1 against.
• 4h trend down (below EMA50 & EMA200)
• 1h trend down (below EMA50 & EMA200)
• Sellers have the momentum (4h RSI 37.2)
Risk: Buyers are driving the move (15m ADX 27.0)
Why I like it:
The daily trend reads range, and 5/12 signals aligned favour the short side. The plan is to work the 0.1277565 – 0.1283035 zone, scale out at 0.1230124 and 0.1196674, and stay patient for 0.1146498. A move through 0.1347201 means the idea is wrong and the stop does its job.
Does USELESS tag 0.1230124 first, or the stop?
Full setup on the chart below.
{future}(USELESSUSDT)
📲 Want more of my latest signals? Join me here:
[https://app.binance.com/uni-qr/D26WbL9t](https://app.binance.com/uni-qr/D26WbL9t)
⚠️ Personal market analysis only. NFA — manage risk and DYOR.
Educational content, not investment advice or a recommendation to buy, sell, deposit, or withdraw any asset. No paid promotion or referral/affiliate links.
USELESS short setup: the levels I'm watching
🔴 SHORT $USELESS /USDT: expecting price to go DOWN
Bias: SHORT · Leaning
Entry: 0.1277565 – 0.1283035
TP1: 0.1230124 (-3.9%)
TP2: 0.1196674 (-6.5%)
TP3: 0.1146498 (-10.5%)
SL: 0.1347201 (+5.2%)
Plan: enter only inside the zone, close 50% at TP1, 25% at TP2, 25% at TP3, and move the stop to entry after TP1.
Note: moderate conviction only, keep size light.
Why SHORT? 5/12 signals agree, 1 against.
• 4h trend down (below EMA50 & EMA200)
• 1h trend down (below EMA50 & EMA200)
• Sellers have the momentum (4h RSI 37.2)
Risk: Buyers are driving the move (15m ADX 27.0)
Why I like it:
The daily trend reads range, and 5/12 signals aligned favour the short side. The plan is to work the 0.1277565 – 0.1283035 zone, scale out at 0.1230124 and 0.1196674, and stay patient for 0.1146498. A move through 0.1347201 means the idea is wrong and the stop does its job.
Does USELESS tag 0.1230124 first, or the stop?
Full setup on the chart below.
📲 Want more of my latest signals? Join me here:
https://app.binance.com/uni-qr/D26WbL9t
⚠️ Personal market analysis only. NFA — manage risk and DYOR.
Educational content, not investment advice or a recommendation to buy, sell, deposit, or withdraw any asset. No paid promotion or referral/affiliate links.
824
·
--
Bearish
I am not convinced ACE can hold this level.
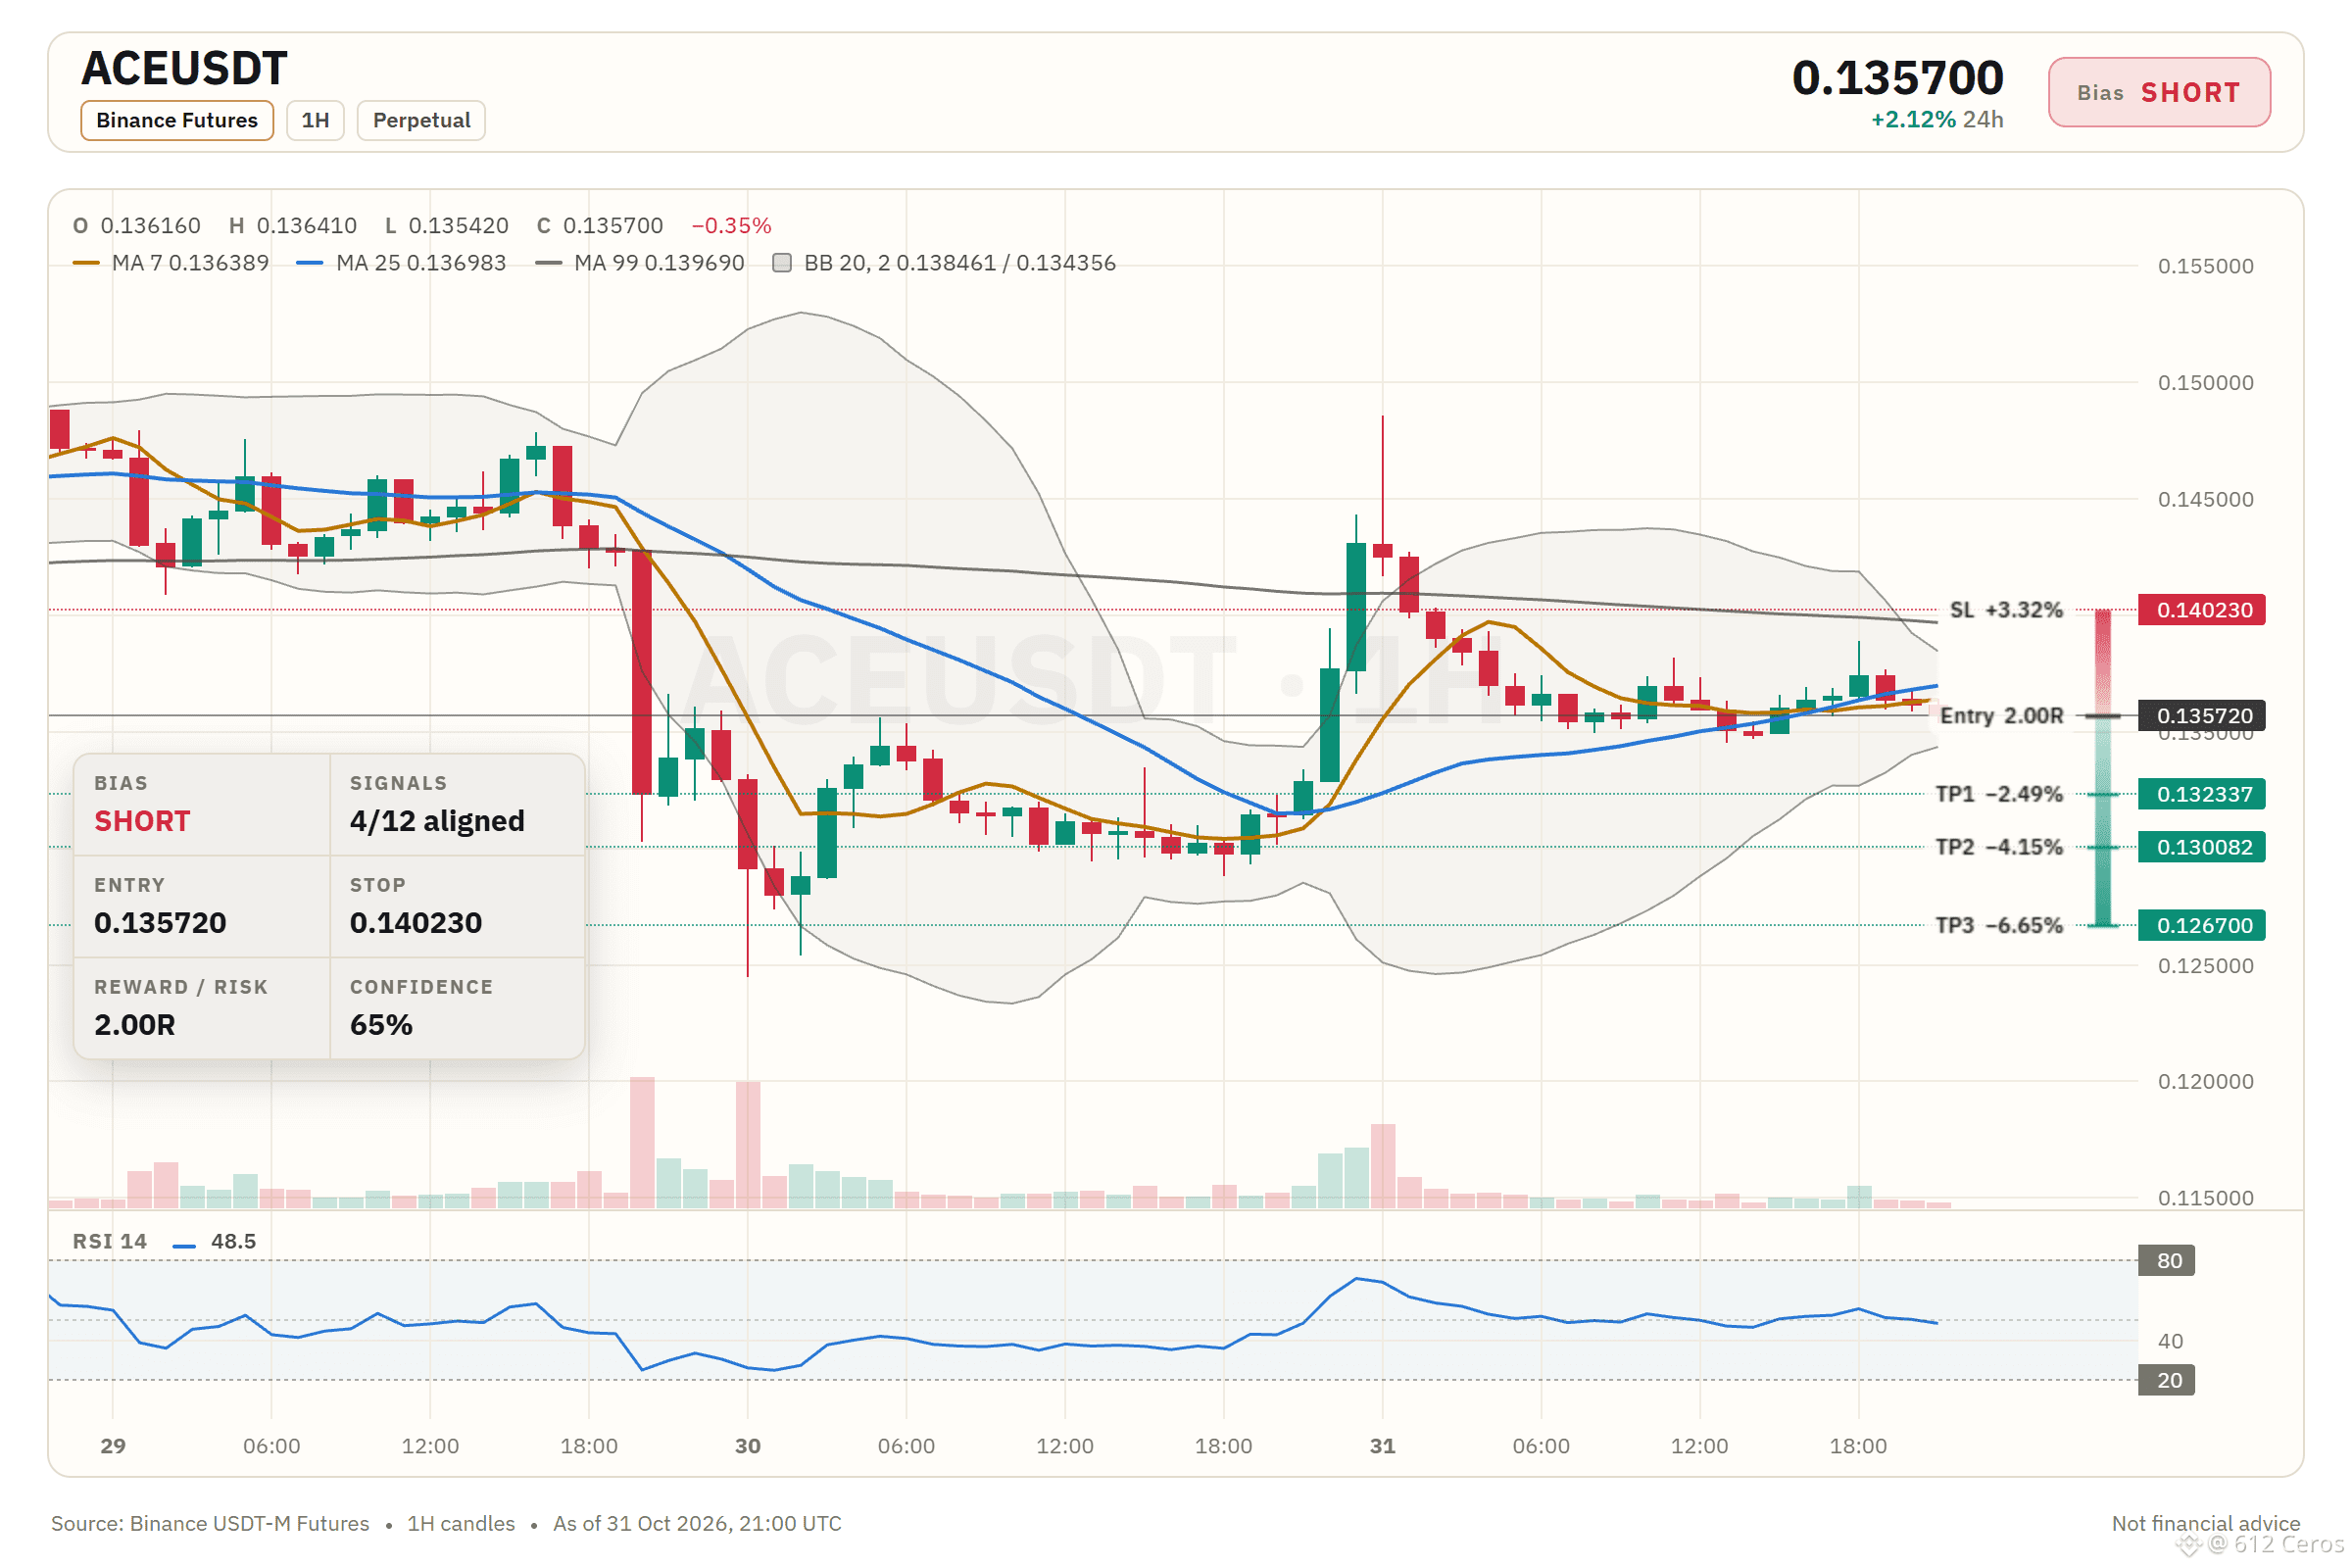
🔴 SHORT $ACE /USDT: expecting price to go DOWN
Bias: SHORT · Leaning
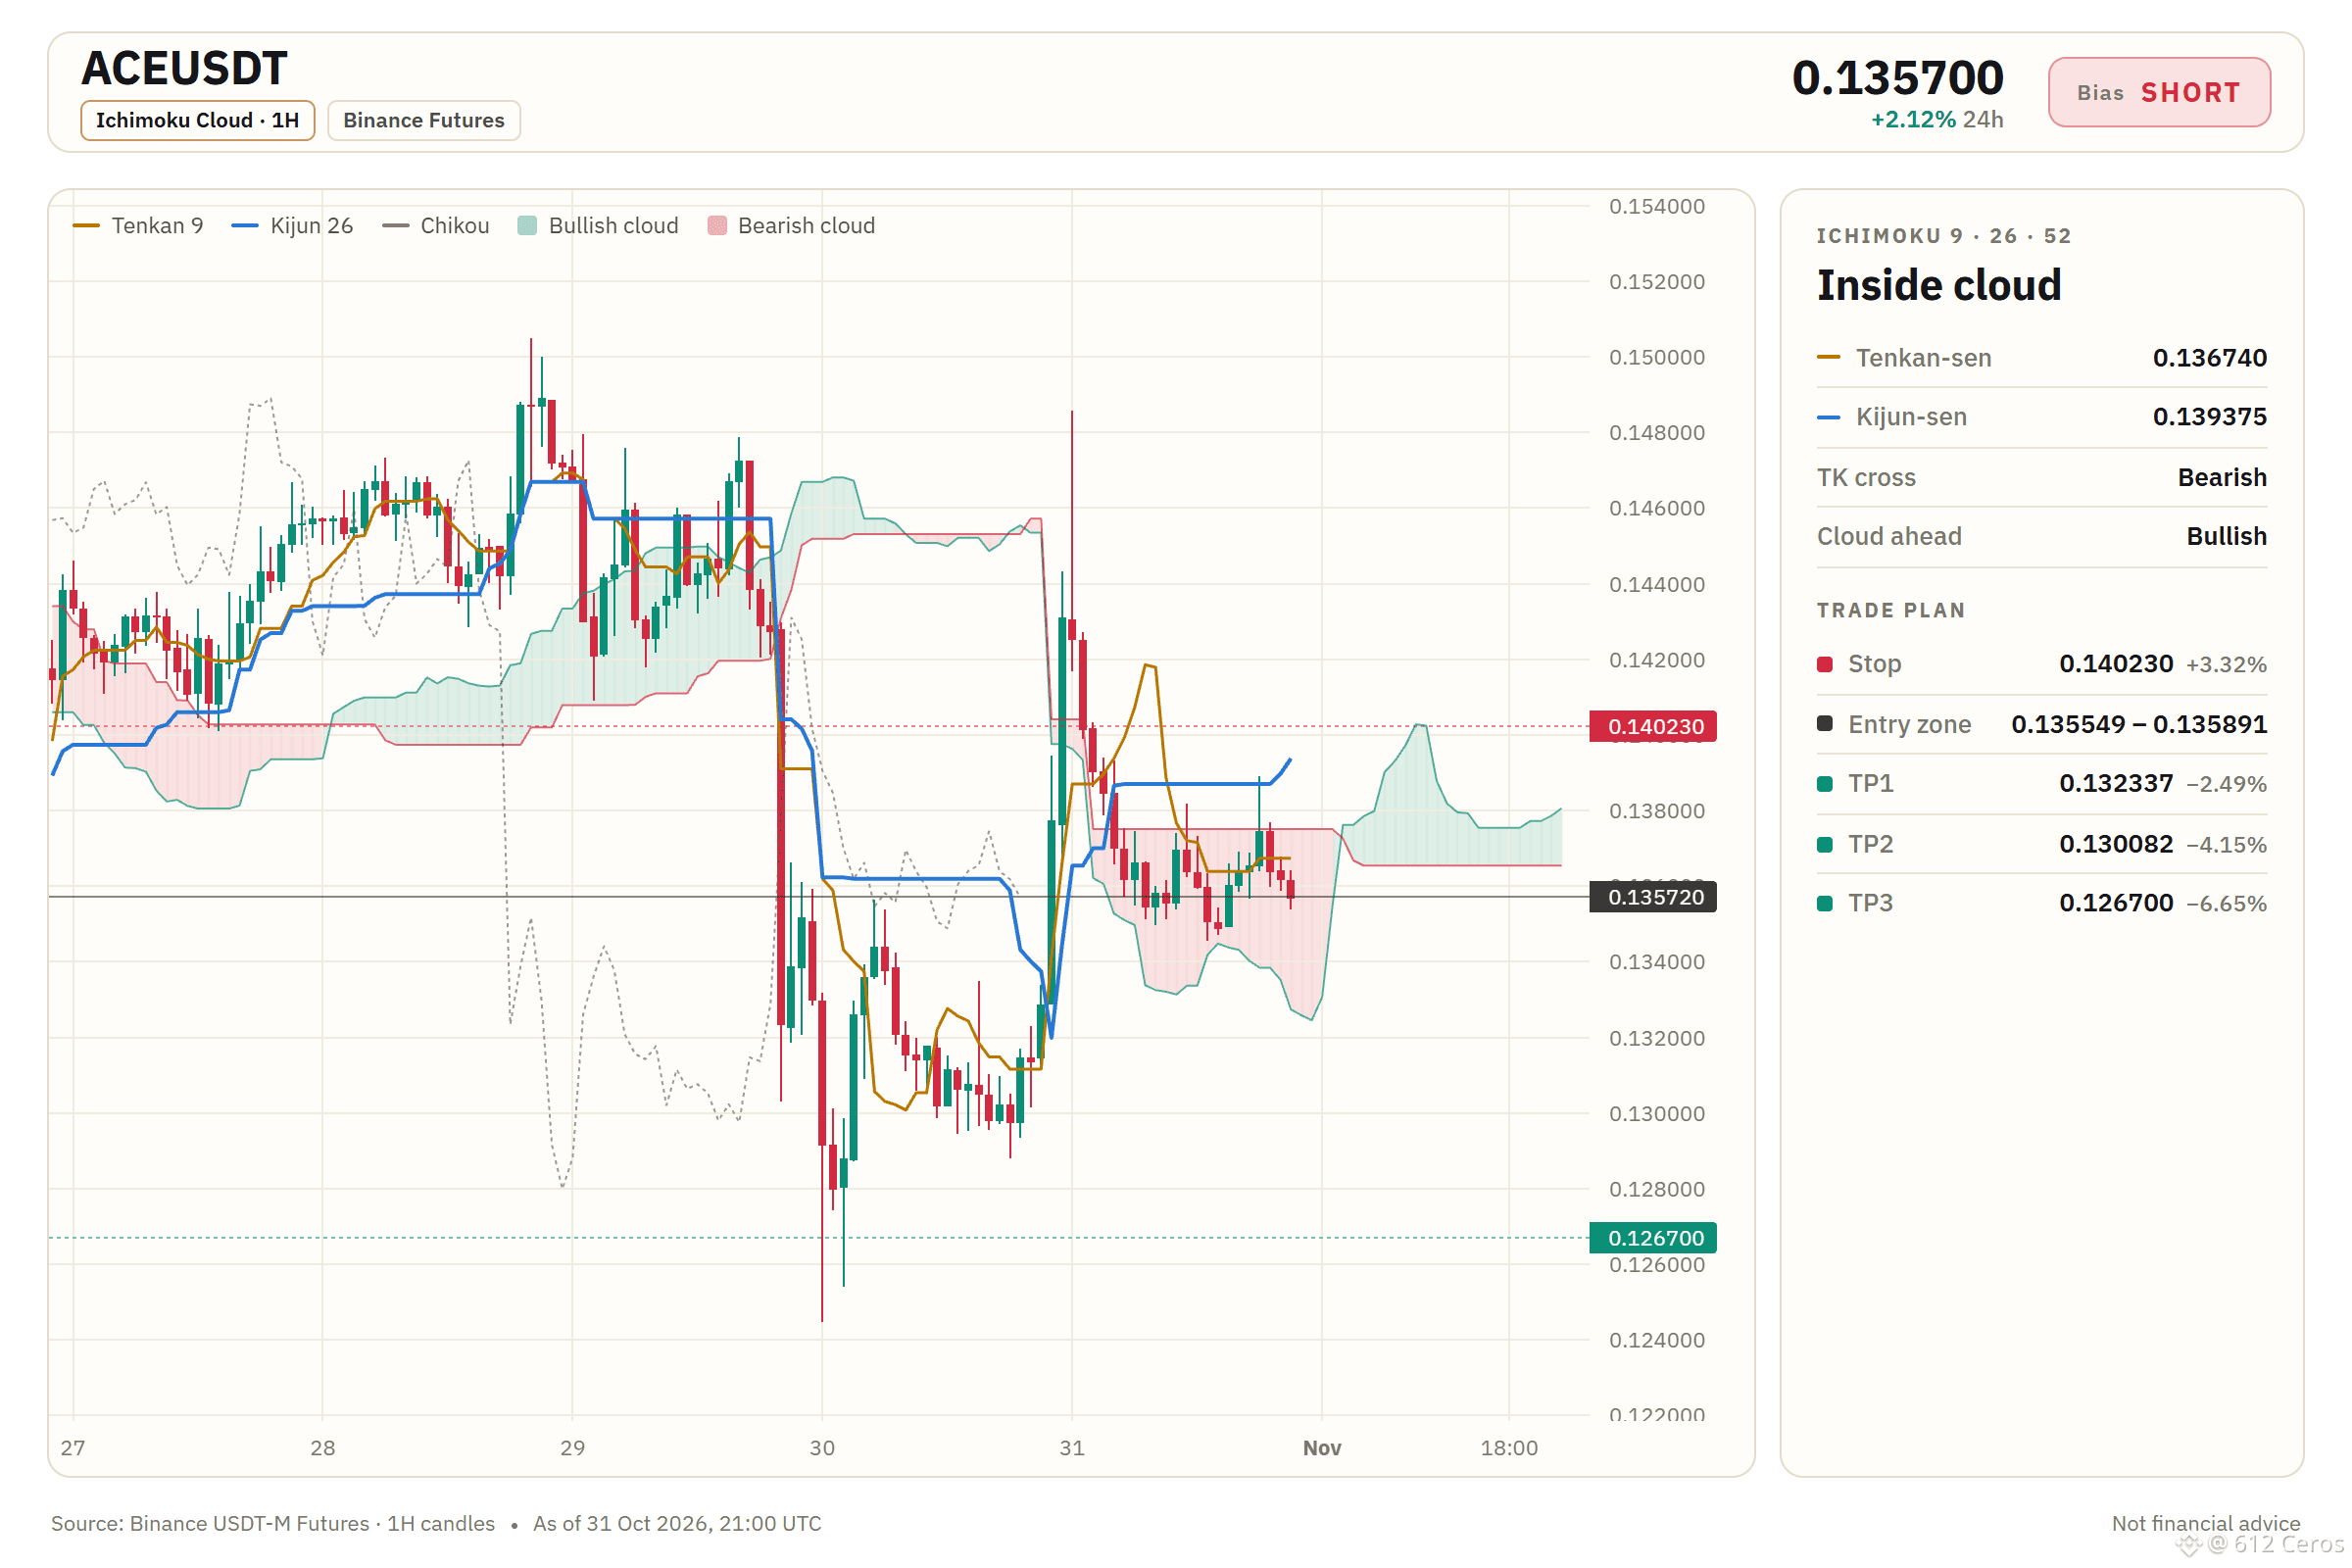
Entry: 0.135549 – 0.135891
TP1: 0.132337 (-2.5%)
TP2: 0.130082 (-4.2%)
TP3: 0.126700 (-6.6%)
SL: 0.140230 (+3.3%)
Plan: enter only inside the zone, close 50% at TP1, 25% at TP2, 25% at TP3, and move the stop to entry after TP1.
Note: moderate conviction only, keep size light.
Why SHORT? 4/12 signals agree, 0 against.
• 4h trend down (below EMA50 & EMA200)
• 1h trend down (below EMA50 & EMA200)
• Sellers are pushing right now (−0.01% 15m candle)
My read on ACE today
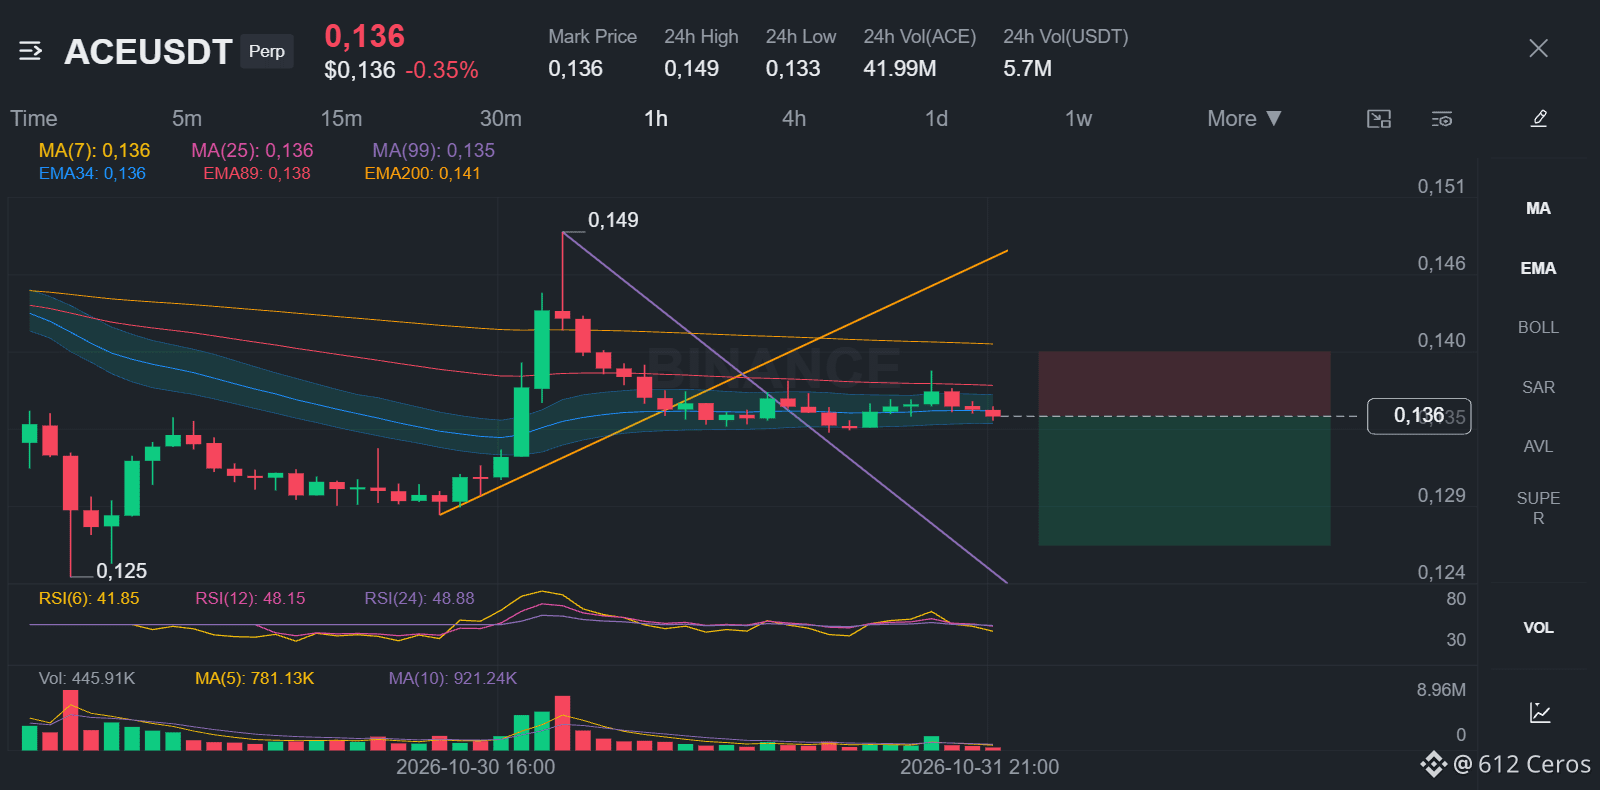
I'm watching ACE for a short trade. The 1h price is near 0.1357 and the daily trend is a range. I want to see the 1h price break below the entry low of 0.135549 to confirm sellers are in control.
What is your invalidation level for ACE?
Full setup on the chart below.
{future}(ACEUSDT)
📲 Want more of my latest signals? Join me here:
[https://app.binance.com/uni-qr/D26WbL9t](https://app.binance.com/uni-qr/D26WbL9t)
⚠️ Personal market analysis only. NFA — manage risk and DYOR.
Educational content, not investment advice or a recommendation to buy, sell, deposit, or withdraw any asset. No paid promotion or referral/affiliate links.
I am not convinced ACE can hold this level.
🔴 SHORT $ACE /USDT: expecting price to go DOWN
Bias: SHORT · Leaning
Entry: 0.135549 – 0.135891
TP1: 0.132337 (-2.5%)
TP2: 0.130082 (-4.2%)
TP3: 0.126700 (-6.6%)
SL: 0.140230 (+3.3%)
Plan: enter only inside the zone, close 50% at TP1, 25% at TP2, 25% at TP3, and move the stop to entry after TP1.
Note: moderate conviction only, keep size light.
Why SHORT? 4/12 signals agree, 0 against.
• 4h trend down (below EMA50 & EMA200)
• 1h trend down (below EMA50 & EMA200)
• Sellers are pushing right now (−0.01% 15m candle)
My read on ACE today
I'm watching ACE for a short trade. The 1h price is near 0.1357 and the daily trend is a range. I want to see the 1h price break below the entry low of 0.135549 to confirm sellers are in control.
What is your invalidation level for ACE?
Full setup on the chart below.
📲 Want more of my latest signals? Join me here:
https://app.binance.com/uni-qr/D26WbL9t
⚠️ Personal market analysis only. NFA — manage risk and DYOR.
Educational content, not investment advice or a recommendation to buy, sell, deposit, or withdraw any asset. No paid promotion or referral/affiliate links.
626
·
--
Bullish
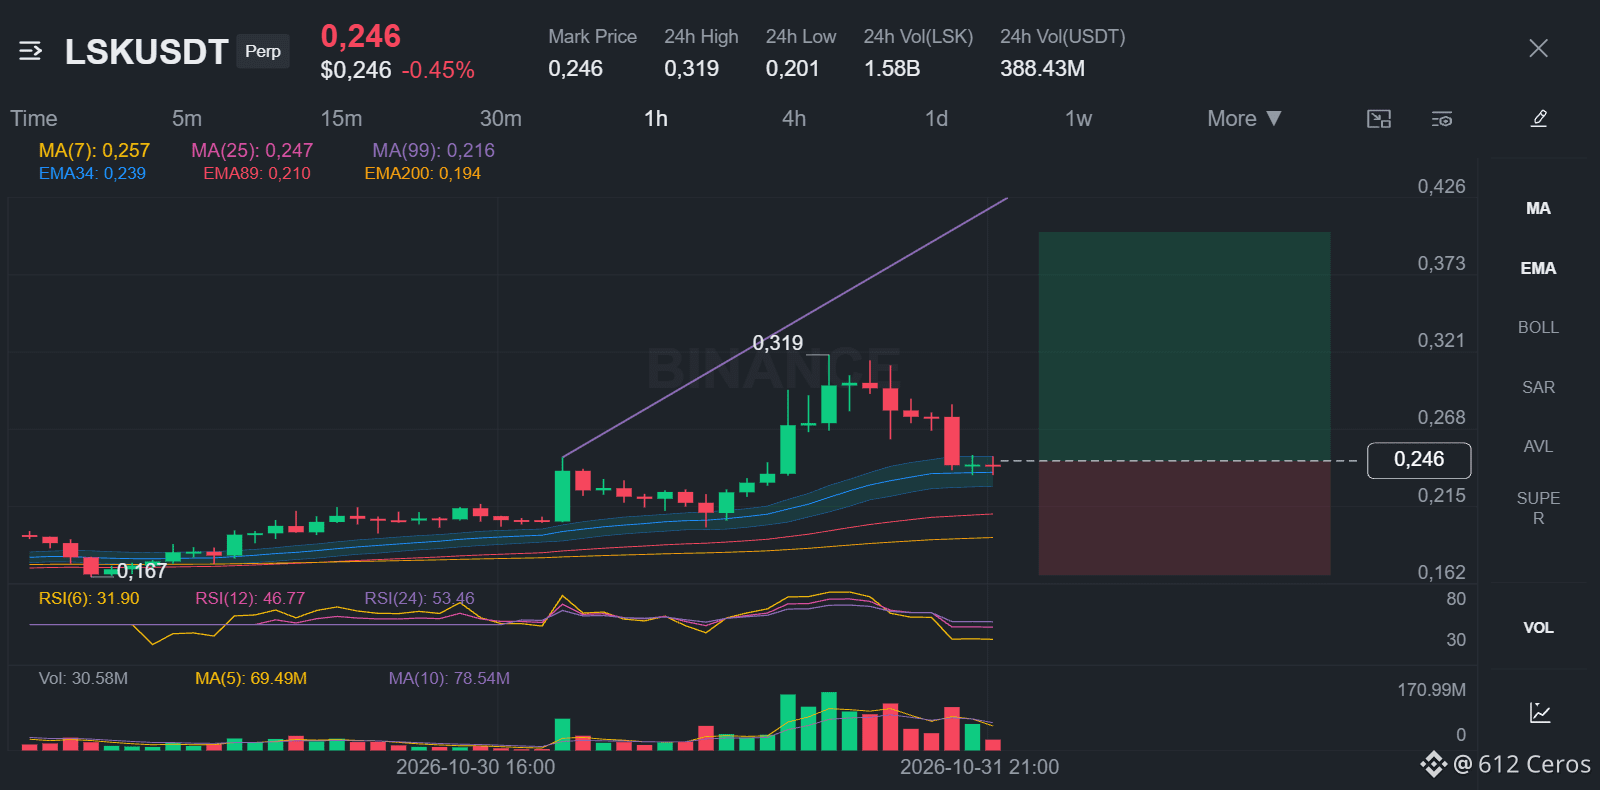
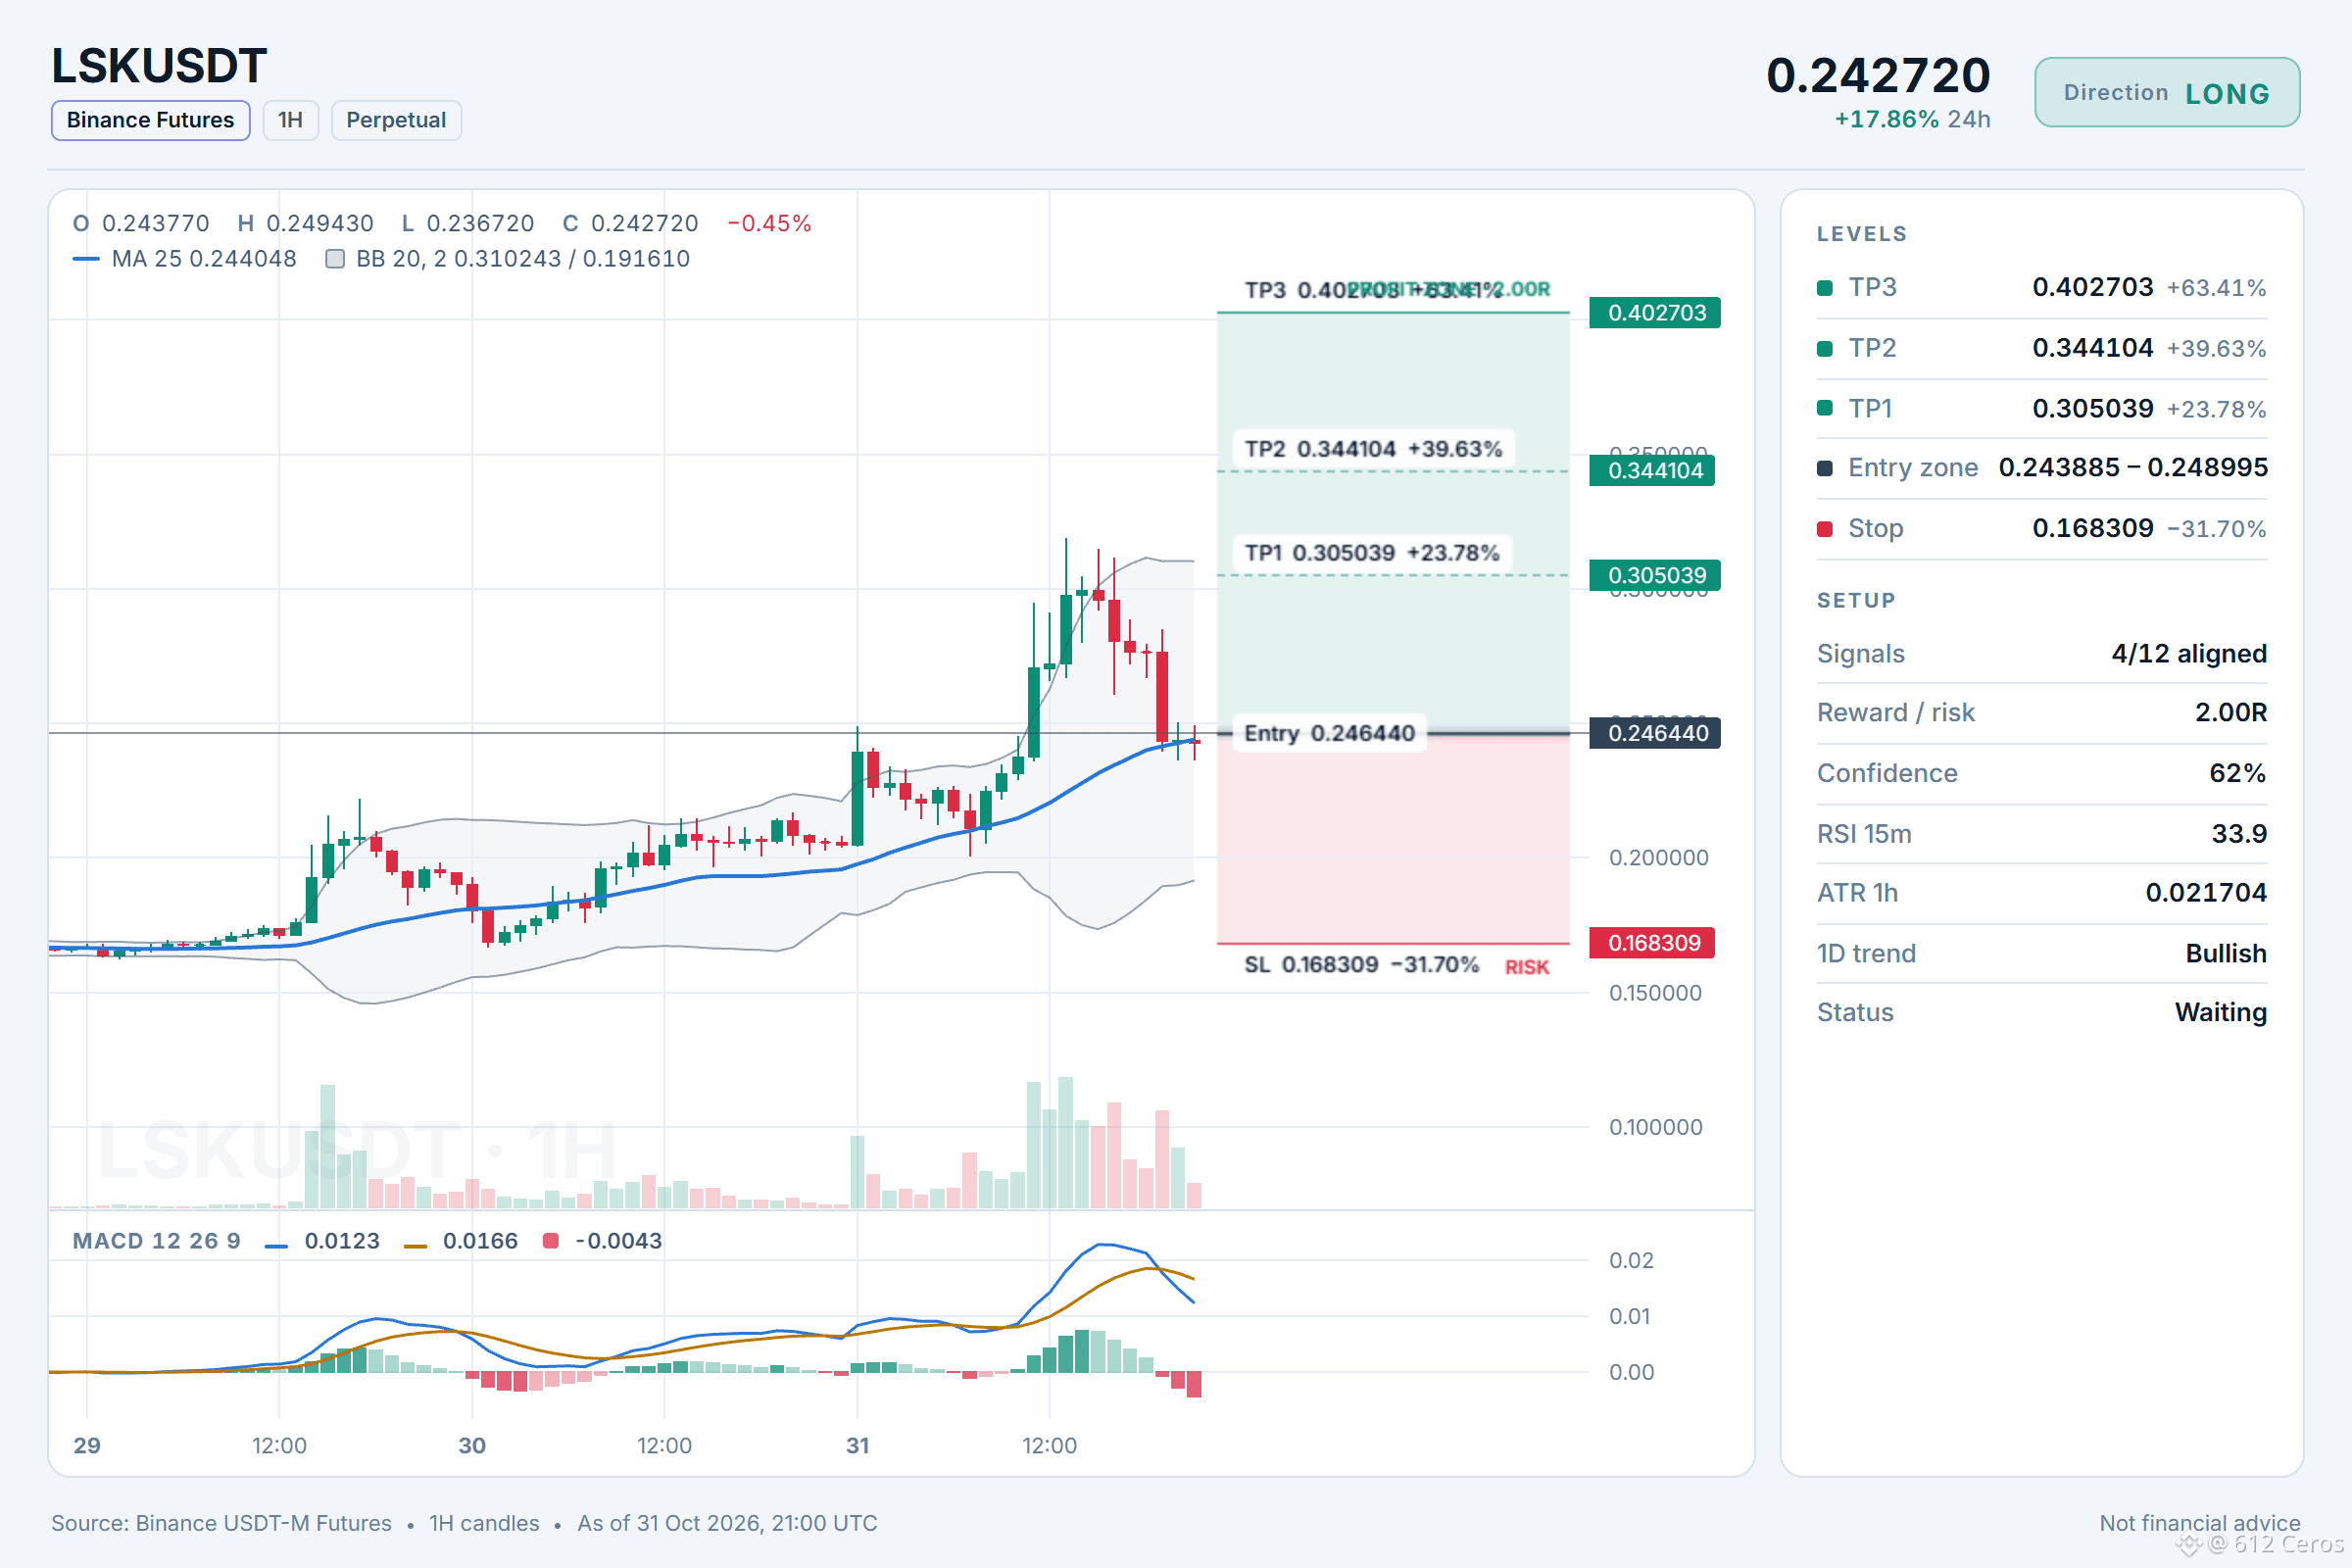
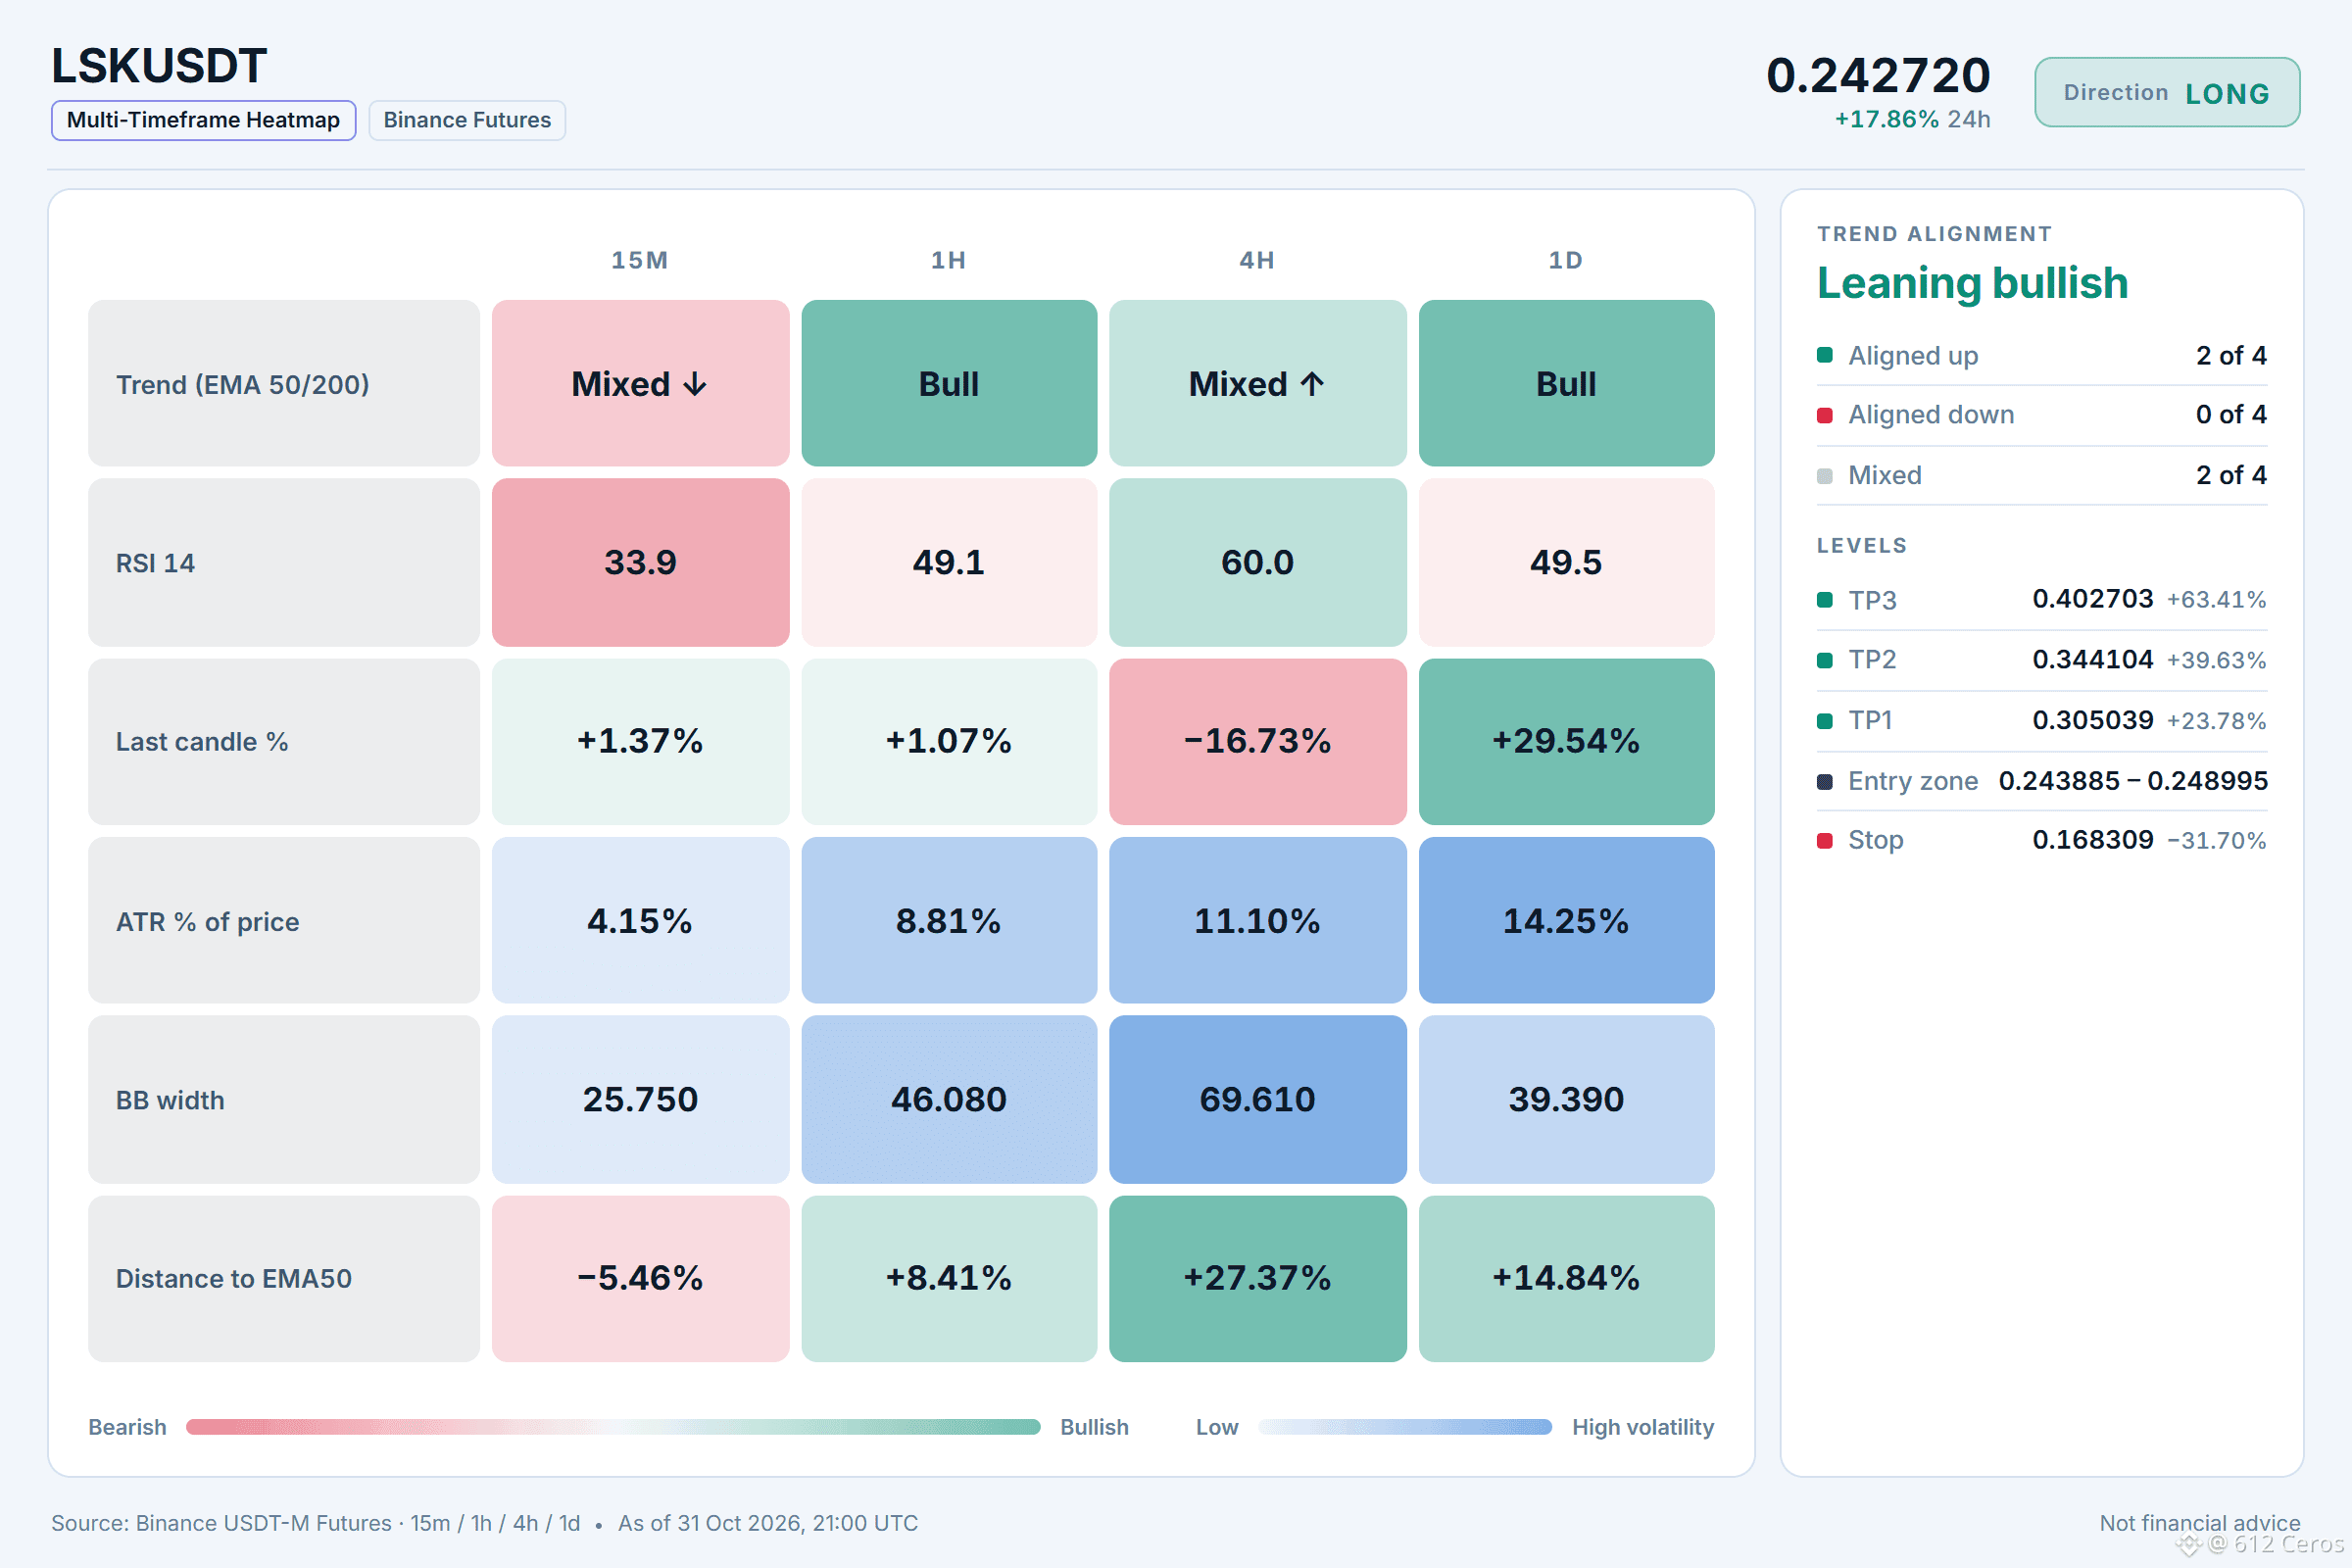
LSK holds above its stacked daily EMAs.
🟢 LONG $LSK /USDT: expecting price to go UP
Bias: LONG · Leaning
Entry: 0.243885 – 0.248995
TP1: 0.305039 (+23.8%)
TP2: 0.344104 (+39.6%)
TP3: 0.402703 (+63.4%)
SL: 0.168309 (-31.7%)
Plan: enter only inside the zone, close 50% at TP1, 25% at TP2, 25% at TP3, and move the stop to entry after TP1.
Note: moderate conviction only, keep size light.
Why LONG? 4/12 signals agree, 1 against.
• Daily trend up (above EMA50 & EMA200)
• 1h trend up (above EMA50 & EMA200)
• Buyers have the momentum (4h RSI 60.0)
Risk: Sellers are driving the move (15m ADX 24.6)
Why now?
The daily trend is bullish with price above both the 50 and 200 EMA, and the 1h trend is also bullish with the same stacked EMAs. The 4h RSI shows buyers have momentum at 60, but the 15m ADX shows sellers are in control with a DI minus of 29.8 versus DI plus of 14.7.
What is your invalidation level for this long?
Full setup on the chart below.
{future}(LSKUSDT)
📲 Want more of my latest signals? Join me here:
[https://app.binance.com/uni-qr/D26WbL9t](https://app.binance.com/uni-qr/D26WbL9t)
⚠️ Personal market analysis only. NFA — manage risk and DYOR.
Educational content, not investment advice or a recommendation to buy, sell, deposit, or withdraw any asset. No paid promotion or referral/affiliate links.
LSK holds above its stacked daily EMAs.
🟢 LONG $LSK /USDT: expecting price to go UP
Bias: LONG · Leaning
Entry: 0.243885 – 0.248995
TP1: 0.305039 (+23.8%)
TP2: 0.344104 (+39.6%)
TP3: 0.402703 (+63.4%)
SL: 0.168309 (-31.7%)
Plan: enter only inside the zone, close 50% at TP1, 25% at TP2, 25% at TP3, and move the stop to entry after TP1.
Note: moderate conviction only, keep size light.
Why LONG? 4/12 signals agree, 1 against.
• Daily trend up (above EMA50 & EMA200)
• 1h trend up (above EMA50 & EMA200)
• Buyers have the momentum (4h RSI 60.0)
Risk: Sellers are driving the move (15m ADX 24.6)
Why now?
The daily trend is bullish with price above both the 50 and 200 EMA, and the 1h trend is also bullish with the same stacked EMAs. The 4h RSI shows buyers have momentum at 60, but the 15m ADX shows sellers are in control with a DI minus of 29.8 versus DI plus of 14.7.
What is your invalidation level for this long?
Full setup on the chart below.
📲 Want more of my latest signals? Join me here:
https://app.binance.com/uni-qr/D26WbL9t
⚠️ Personal market analysis only. NFA — manage risk and DYOR.
Educational content, not investment advice or a recommendation to buy, sell, deposit, or withdraw any asset. No paid promotion or referral/affiliate links.
1.5k
·
--
Bearish
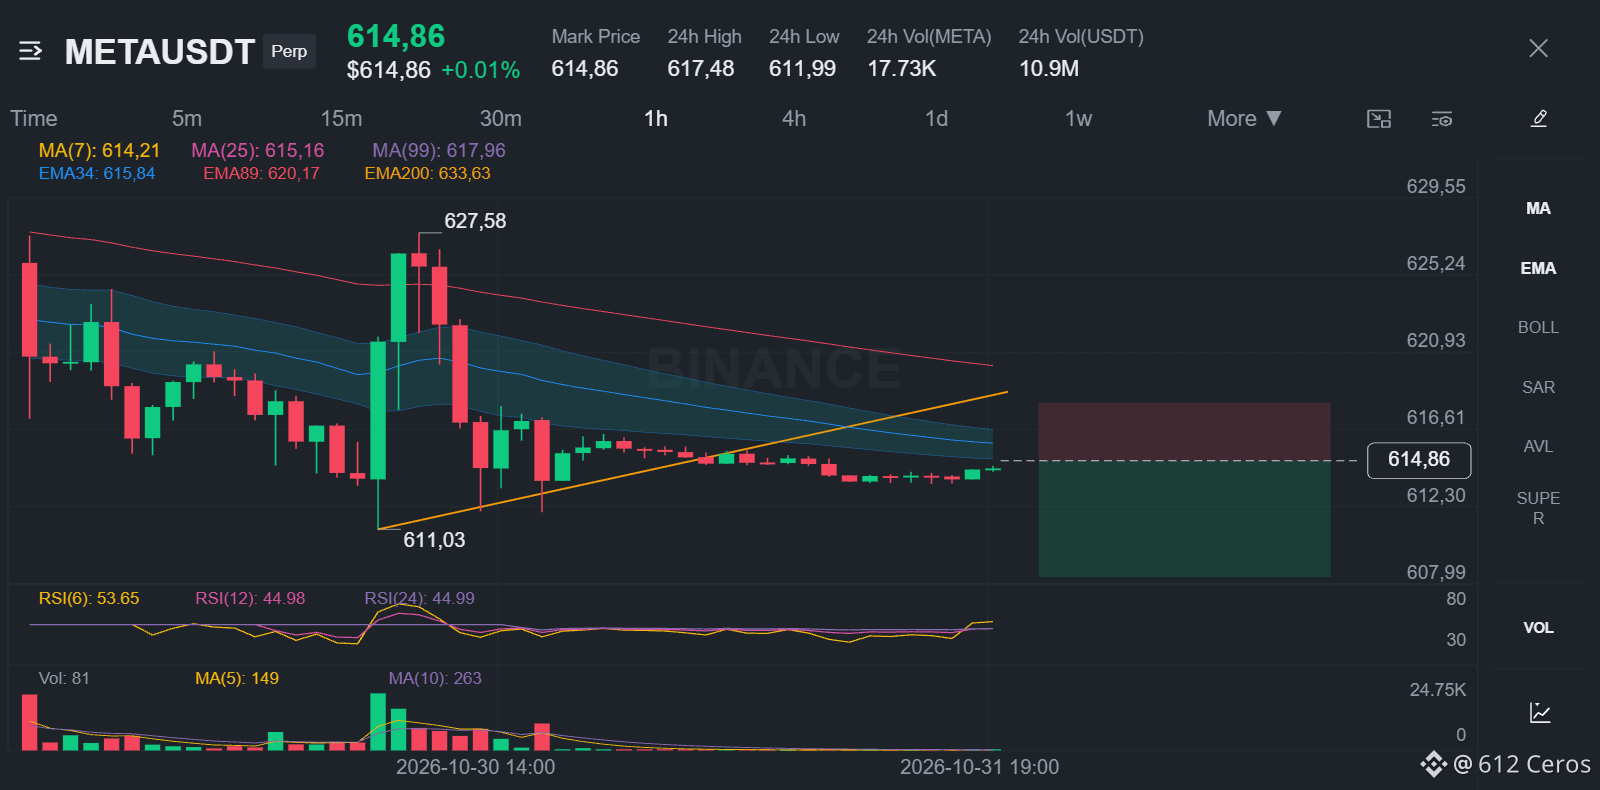
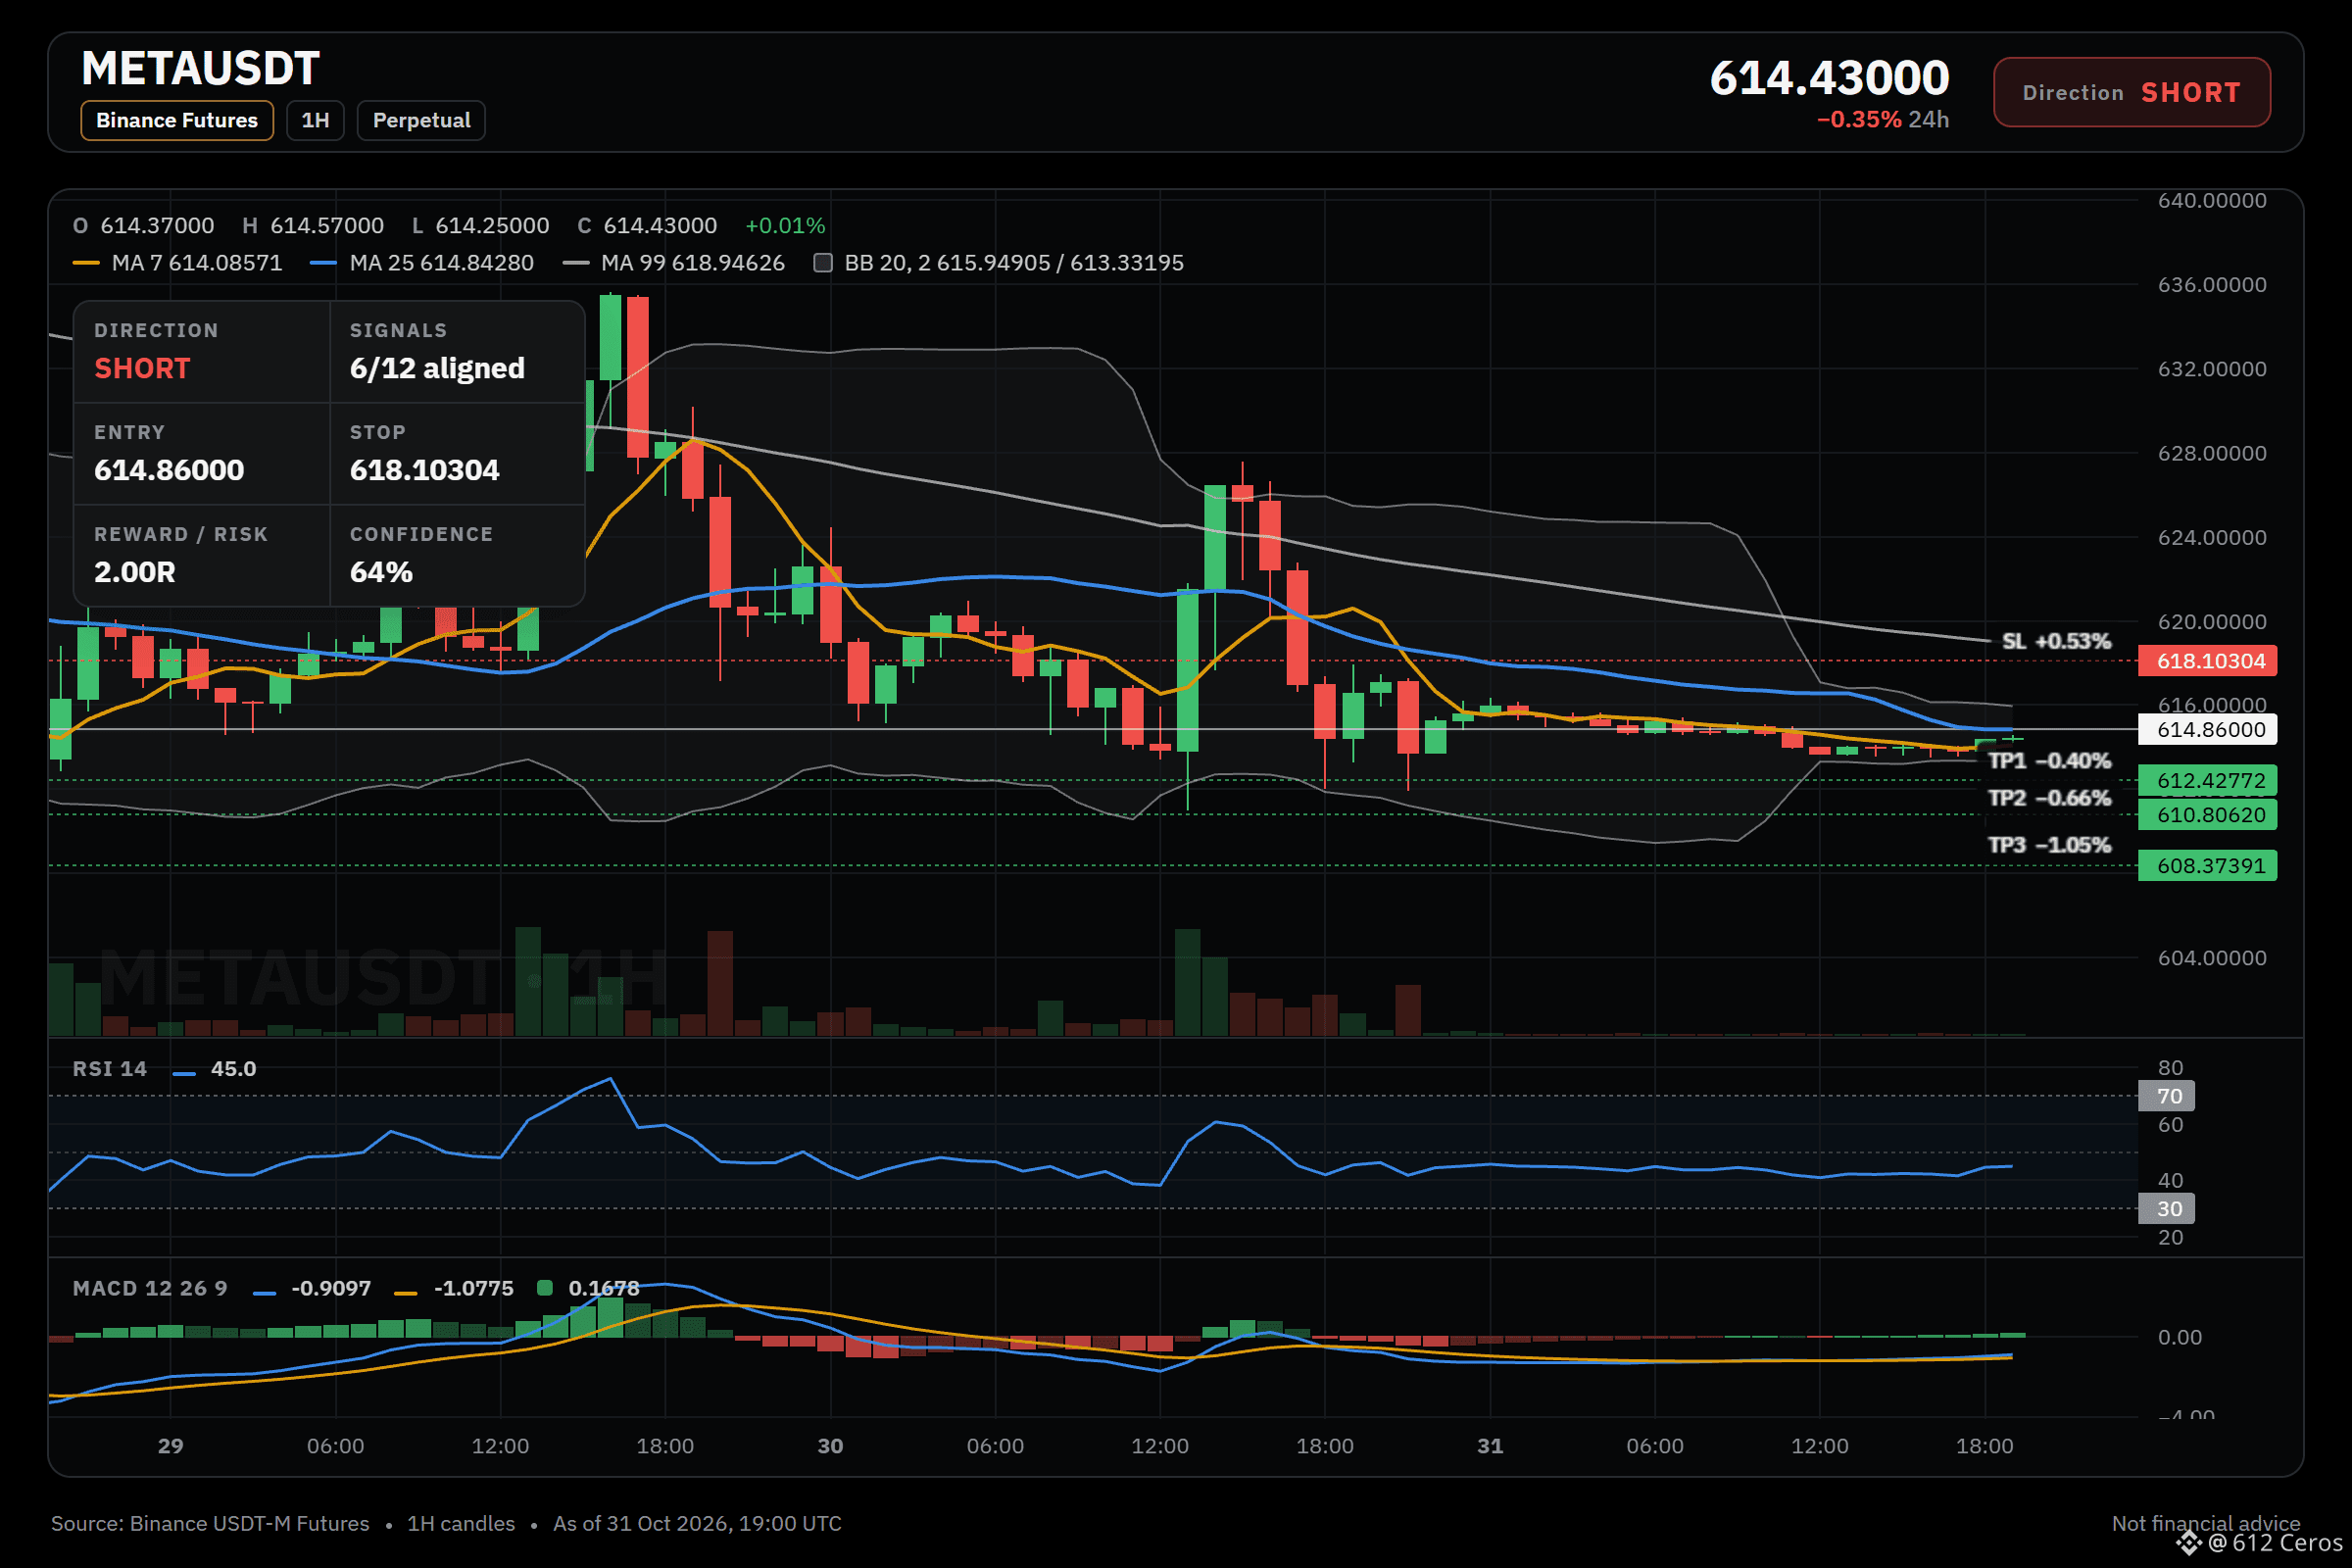
META sits under stacked EMAs; I lean short.
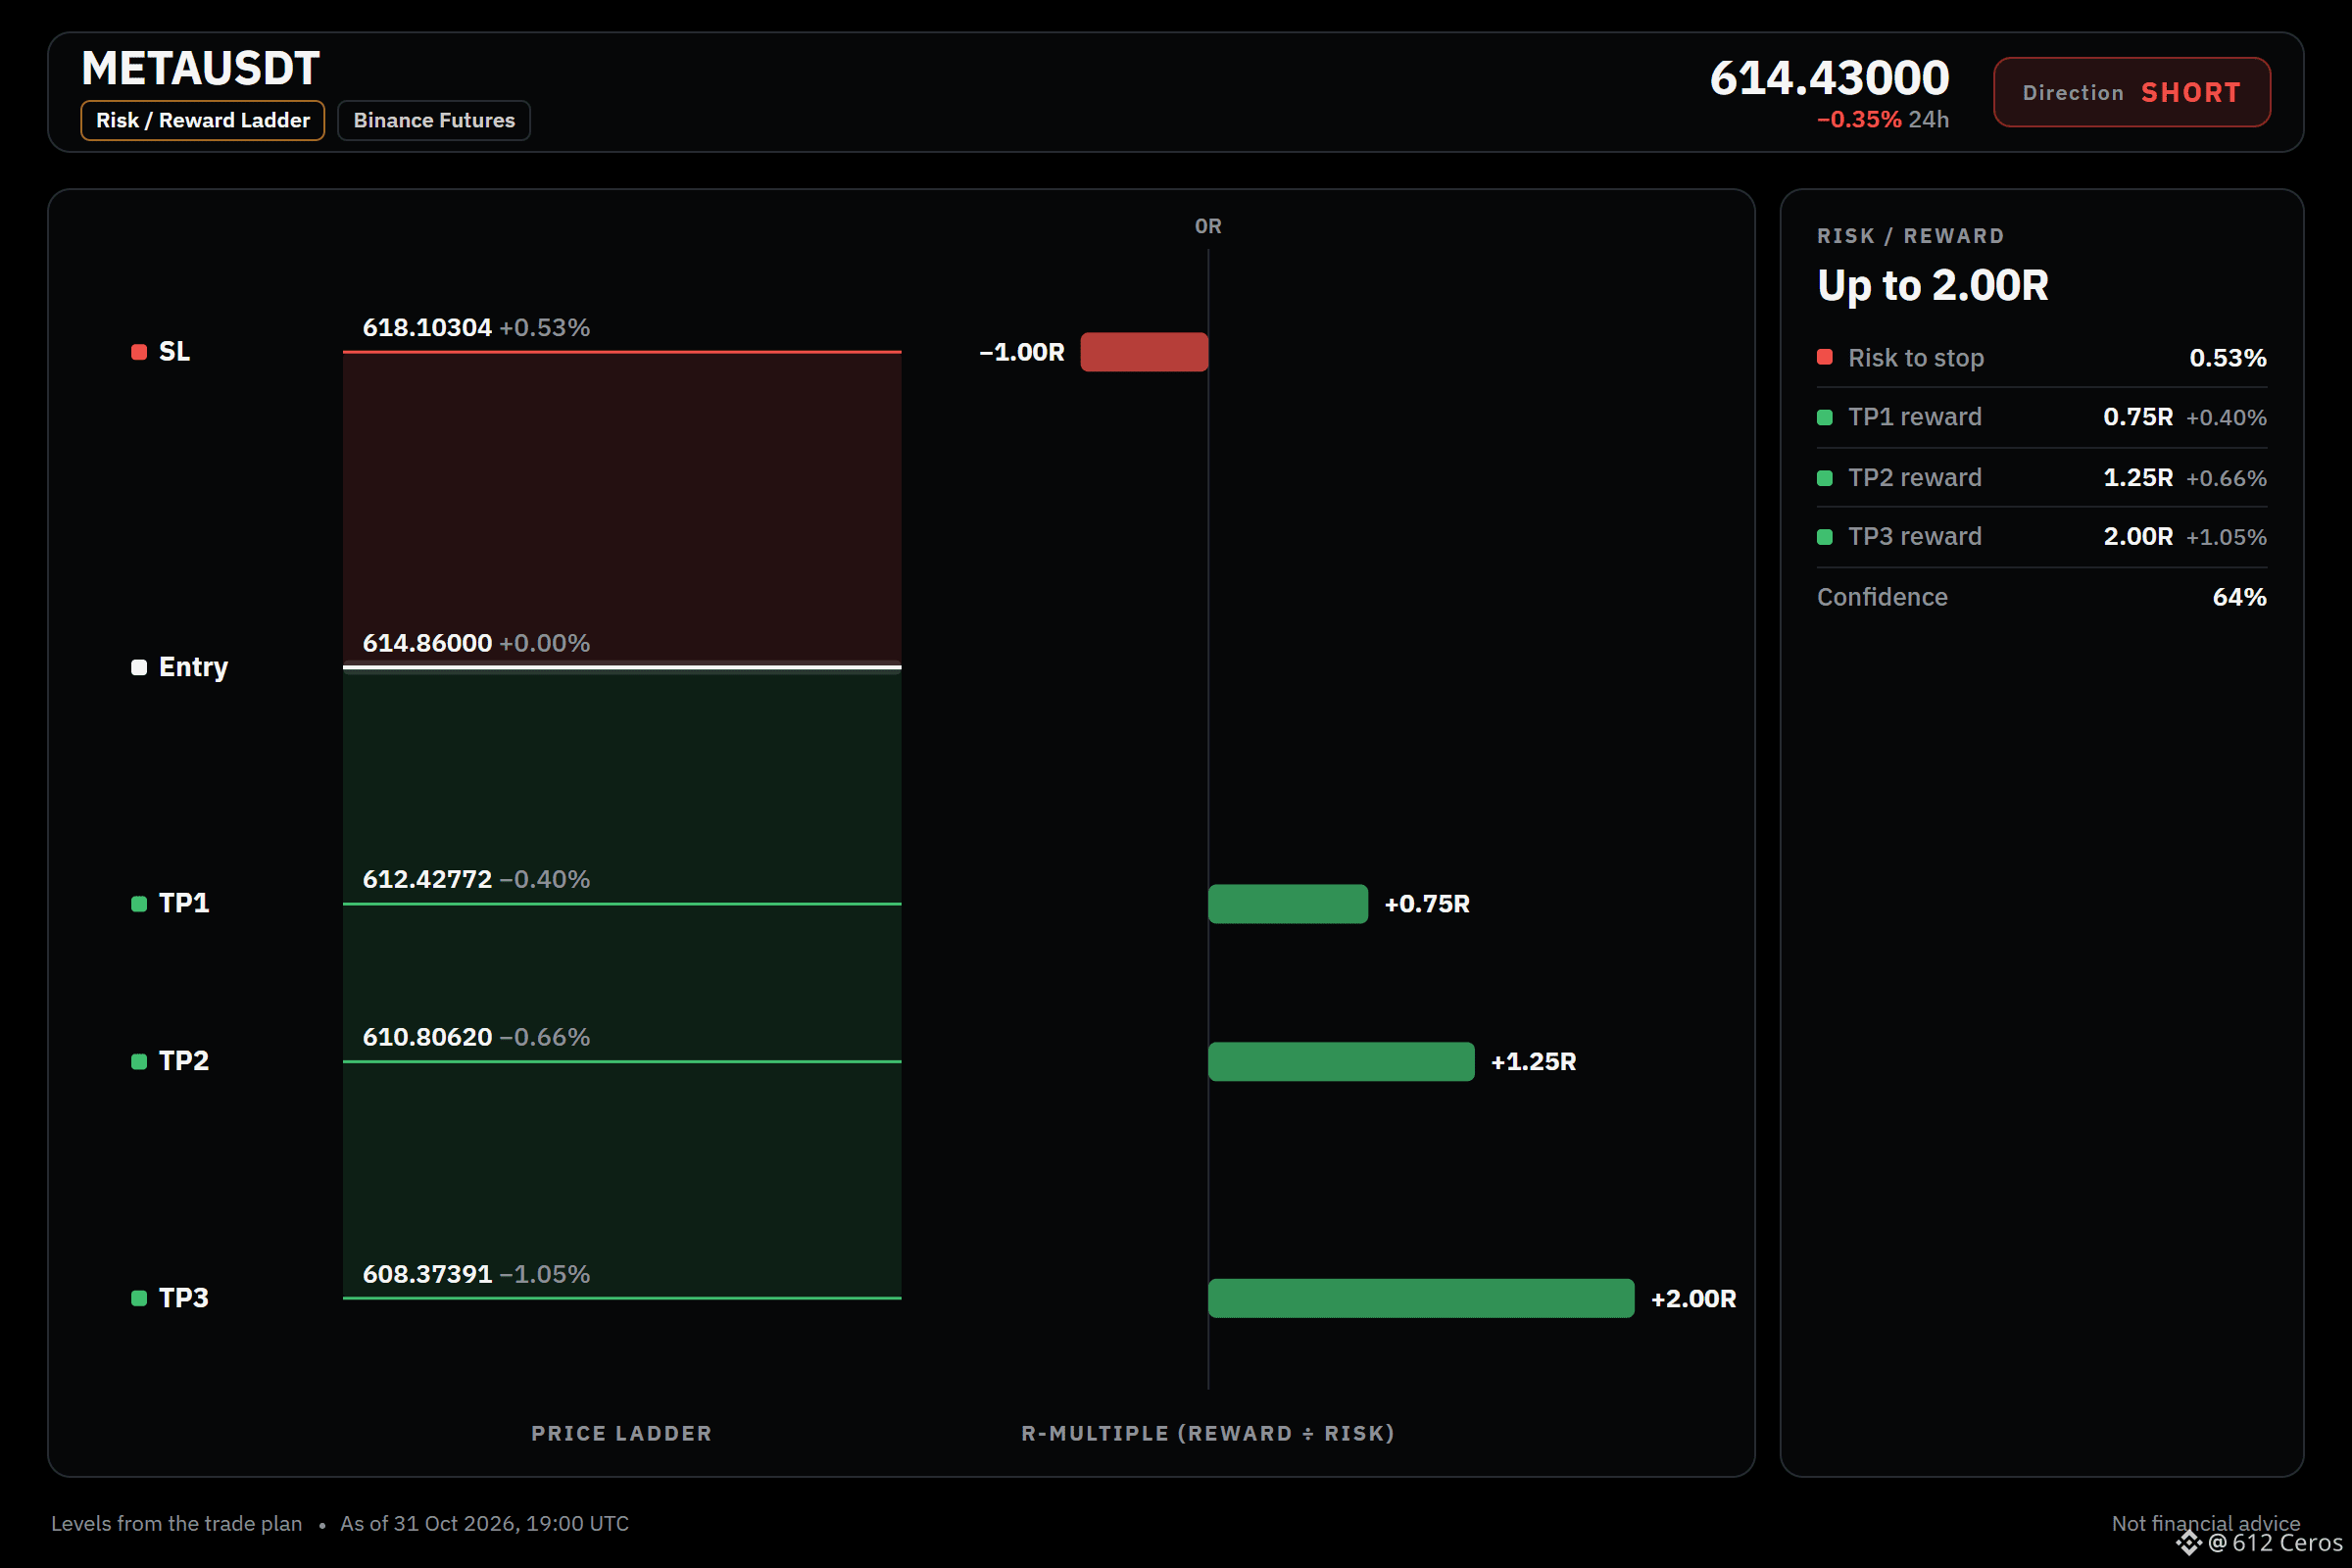
🔴 SHORT $META /USDT: expecting price to go DOWN
Bias: SHORT · Leaning
Entry: 614.78539 – 614.93461
TP1: 612.42772 (-0.4%)
TP2: 610.80620 (-0.7%)
TP3: 608.37391 (-1.1%)
SL: 618.10304 (+0.5%)
Plan: enter only inside the zone, close 50% at TP1, 25% at TP2, 25% at TP3, and move the stop to entry after TP1.
Note: moderate conviction only, keep size light.
Why SHORT? 6/12 signals agree, 2 against.
• 4h trend down (below EMA50 & EMA200)
• 1h trend down (below EMA50 & EMA200)
• Sellers have the momentum (4h RSI 40.2)
Risk: Buyers are driving the move (15m ADX 23.8)
If it plays out:
Price should keep sliding toward the entry low, with the 4h RSI confirming sellers have momentum below 45.
If it fails:
ADX shows buyers are driving the 15m move, so I would close and exit the short.
Where do you take profits on this short?
Levels mapped on the chart below.
{future}(METAUSDT)
📲 Want more of my latest signals? Join me here:
[https://app.binance.com/uni-qr/D26WbL9t](https://app.binance.com/uni-qr/D26WbL9t)
⚠️ Personal market analysis only. NFA — manage risk and DYOR.
Educational content, not investment advice or a recommendation to buy, sell, deposit, or withdraw any asset. No paid promotion or referral/affiliate links.
META sits under stacked EMAs; I lean short.
🔴 SHORT $META /USDT: expecting price to go DOWN
Bias: SHORT · Leaning
Entry: 614.78539 – 614.93461
TP1: 612.42772 (-0.4%)
TP2: 610.80620 (-0.7%)
TP3: 608.37391 (-1.1%)
SL: 618.10304 (+0.5%)
Plan: enter only inside the zone, close 50% at TP1, 25% at TP2, 25% at TP3, and move the stop to entry after TP1.
Note: moderate conviction only, keep size light.
Why SHORT? 6/12 signals agree, 2 against.
• 4h trend down (below EMA50 & EMA200)
• 1h trend down (below EMA50 & EMA200)
• Sellers have the momentum (4h RSI 40.2)
Risk: Buyers are driving the move (15m ADX 23.8)
If it plays out:
Price should keep sliding toward the entry low, with the 4h RSI confirming sellers have momentum below 45.
If it fails:
ADX shows buyers are driving the 15m move, so I would close and exit the short.
Where do you take profits on this short?
Levels mapped on the chart below.
📲 Want more of my latest signals? Join me here:
https://app.binance.com/uni-qr/D26WbL9t
⚠️ Personal market analysis only. NFA — manage risk and DYOR.
Educational content, not investment advice or a recommendation to buy, sell, deposit, or withdraw any asset. No paid promotion or referral/affiliate links.
3
895
Log in to explore more content
Join global crypto users on Binance Square
⚡️ Get latest and useful information about crypto.
💬 Trusted by the world’s largest crypto exchange.
👍 Discover real insights from verified creators.
Email / Phone number
Trending Topics
BinanceHadAlreadyCovered$6BofHackLoss
235 views
4 Discussing
Binance Says It Has Already Covered $6 Billion of Hack Loss
Binance News
·27 Likes
·13.8k views
FBIConfirmsNorthKoreaIsResponsibleForBinanceCryptoHack
832 views
19 Discussing
BinanceSAFUFundTransferCompleted7499BTC
54,825 views
1,012 Discussing