


Original title: Bitcoin looks busy but 31% of its users vanished as ETFs bleed $4.5B in 2026
Original author: Oluwapelumi Adejumo, CryptoSlate
Original compilation: Deep Tide TechFlow
Deep Tide introduction: Trading volume has not collapsed, but active addresses have continued to shrink for six months, falling to a five-year low. This divergence of 'apparent prosperity, internal emptiness' is a contrary signal to the structural health of the bull market.
Using Glassnode, Santiment, and CryptoQuant for cross-validation, three future scenarios are proposed, suitable as a reference framework for judging BTC trends at the moment.
The full text is as follows:
Bitcoin's network activity has weakened for six consecutive months, but this trend has not been reflected in many core indicators that traders typically focus on.
Clearer signals are not from transaction volume—transaction volume remains stable—but from participation breadth. Even if the network continues to process a similar number of transactions, the number of on-chain active addresses continues to decline.
In a market where price discovery increasingly occurs in ETFs and derivatives, this division is crucial. It signifies that Bitcoin's on-chain footprint is shrinking while market exposure continues to remain active elsewhere.
As the bear market continues, this trend has become increasingly difficult to ignore.
Glassnode data shows that in mid-August 2025, the eight-day average of Bitcoin's active addresses was approximately 778,680. As of February 23, this number had fallen to about 535,942, a decline of about 31%.
CryptoQuant has also marked low network activity for six consecutive months, describing the current phase as a period of continued weakness in on-chain participation.
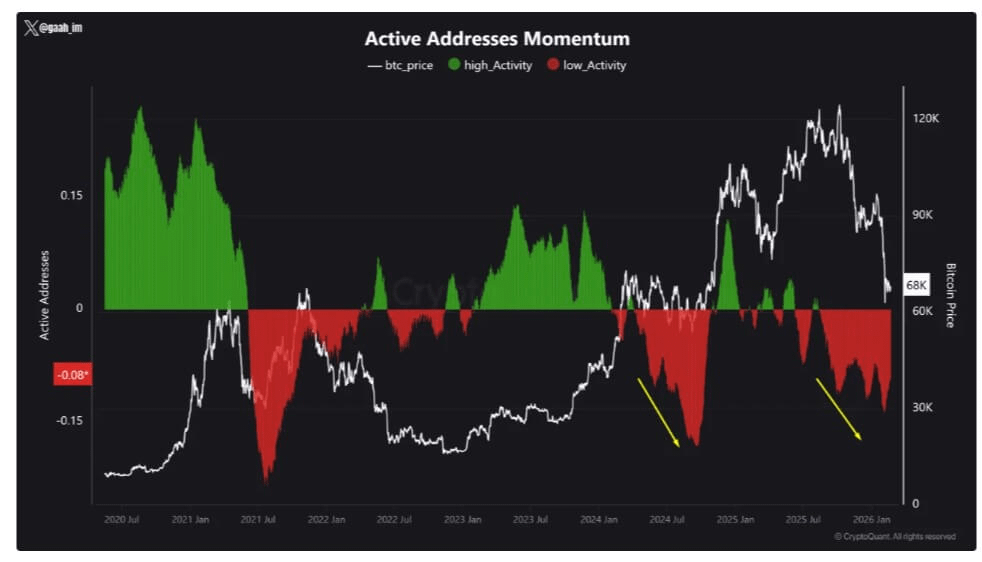
Bitcoin Active Addresses Momentum
Source: CryptoQuant
The last time the market exhibited a similar pattern was in 2024—Bitcoin subsequently experienced a decline of about 30%.
This does not mean that a repeat is imminent, but it reinforces a historical pattern: prolonged network weakness often coincides with a phase of weakening market confidence.
Breadth is declining, but throughput has not collapsed.
The number of Bitcoin transactions has not declined in tandem with the number of active addresses.
In mid-August 2025, the average daily transaction count was approximately 444,000. Data from Blockchain.com shows that the average over the past 30 days was about 439,000.
Intraday data remains volatile, ranging from about 289,000 to 702,000 transactions, but the overall throughput trend has not collapsed.
This divergence is key to understanding the current situation.
If transaction volume remains stable while active addresses decline, it indicates that fewer entities are undertaking the same amount of on-chain activity.
This situation has various causes and does not require a surge of retail investors. Exchanges and custodians can handle withdrawals in bulk; large holders can consolidate transfers; institutional fund flows can be managed through fewer wallets; operational activities may also cause a temporary spike in transaction counts without indicating a genuine return of users.
The result is: the on-chain activity still appears busy, but the underlying participants are dwindling.
That is why the decline in breadth is more indicative than the raw throughput. Steady transaction counts may obscure an increasingly concentrated activity among repeat traders, large institutions, and operational fund flows.
In this pattern, Bitcoin's chain still operates normally, but the breadth of user participation it represents is no longer as genuine.
Blockchain analysis firm Santiment provides a more straightforward description from a longer time dimension.
The institution stated that since February 2021, the number of unique addresses initiating Bitcoin transactions has decreased by 42%, and the number of new addresses has decreased by 47%.
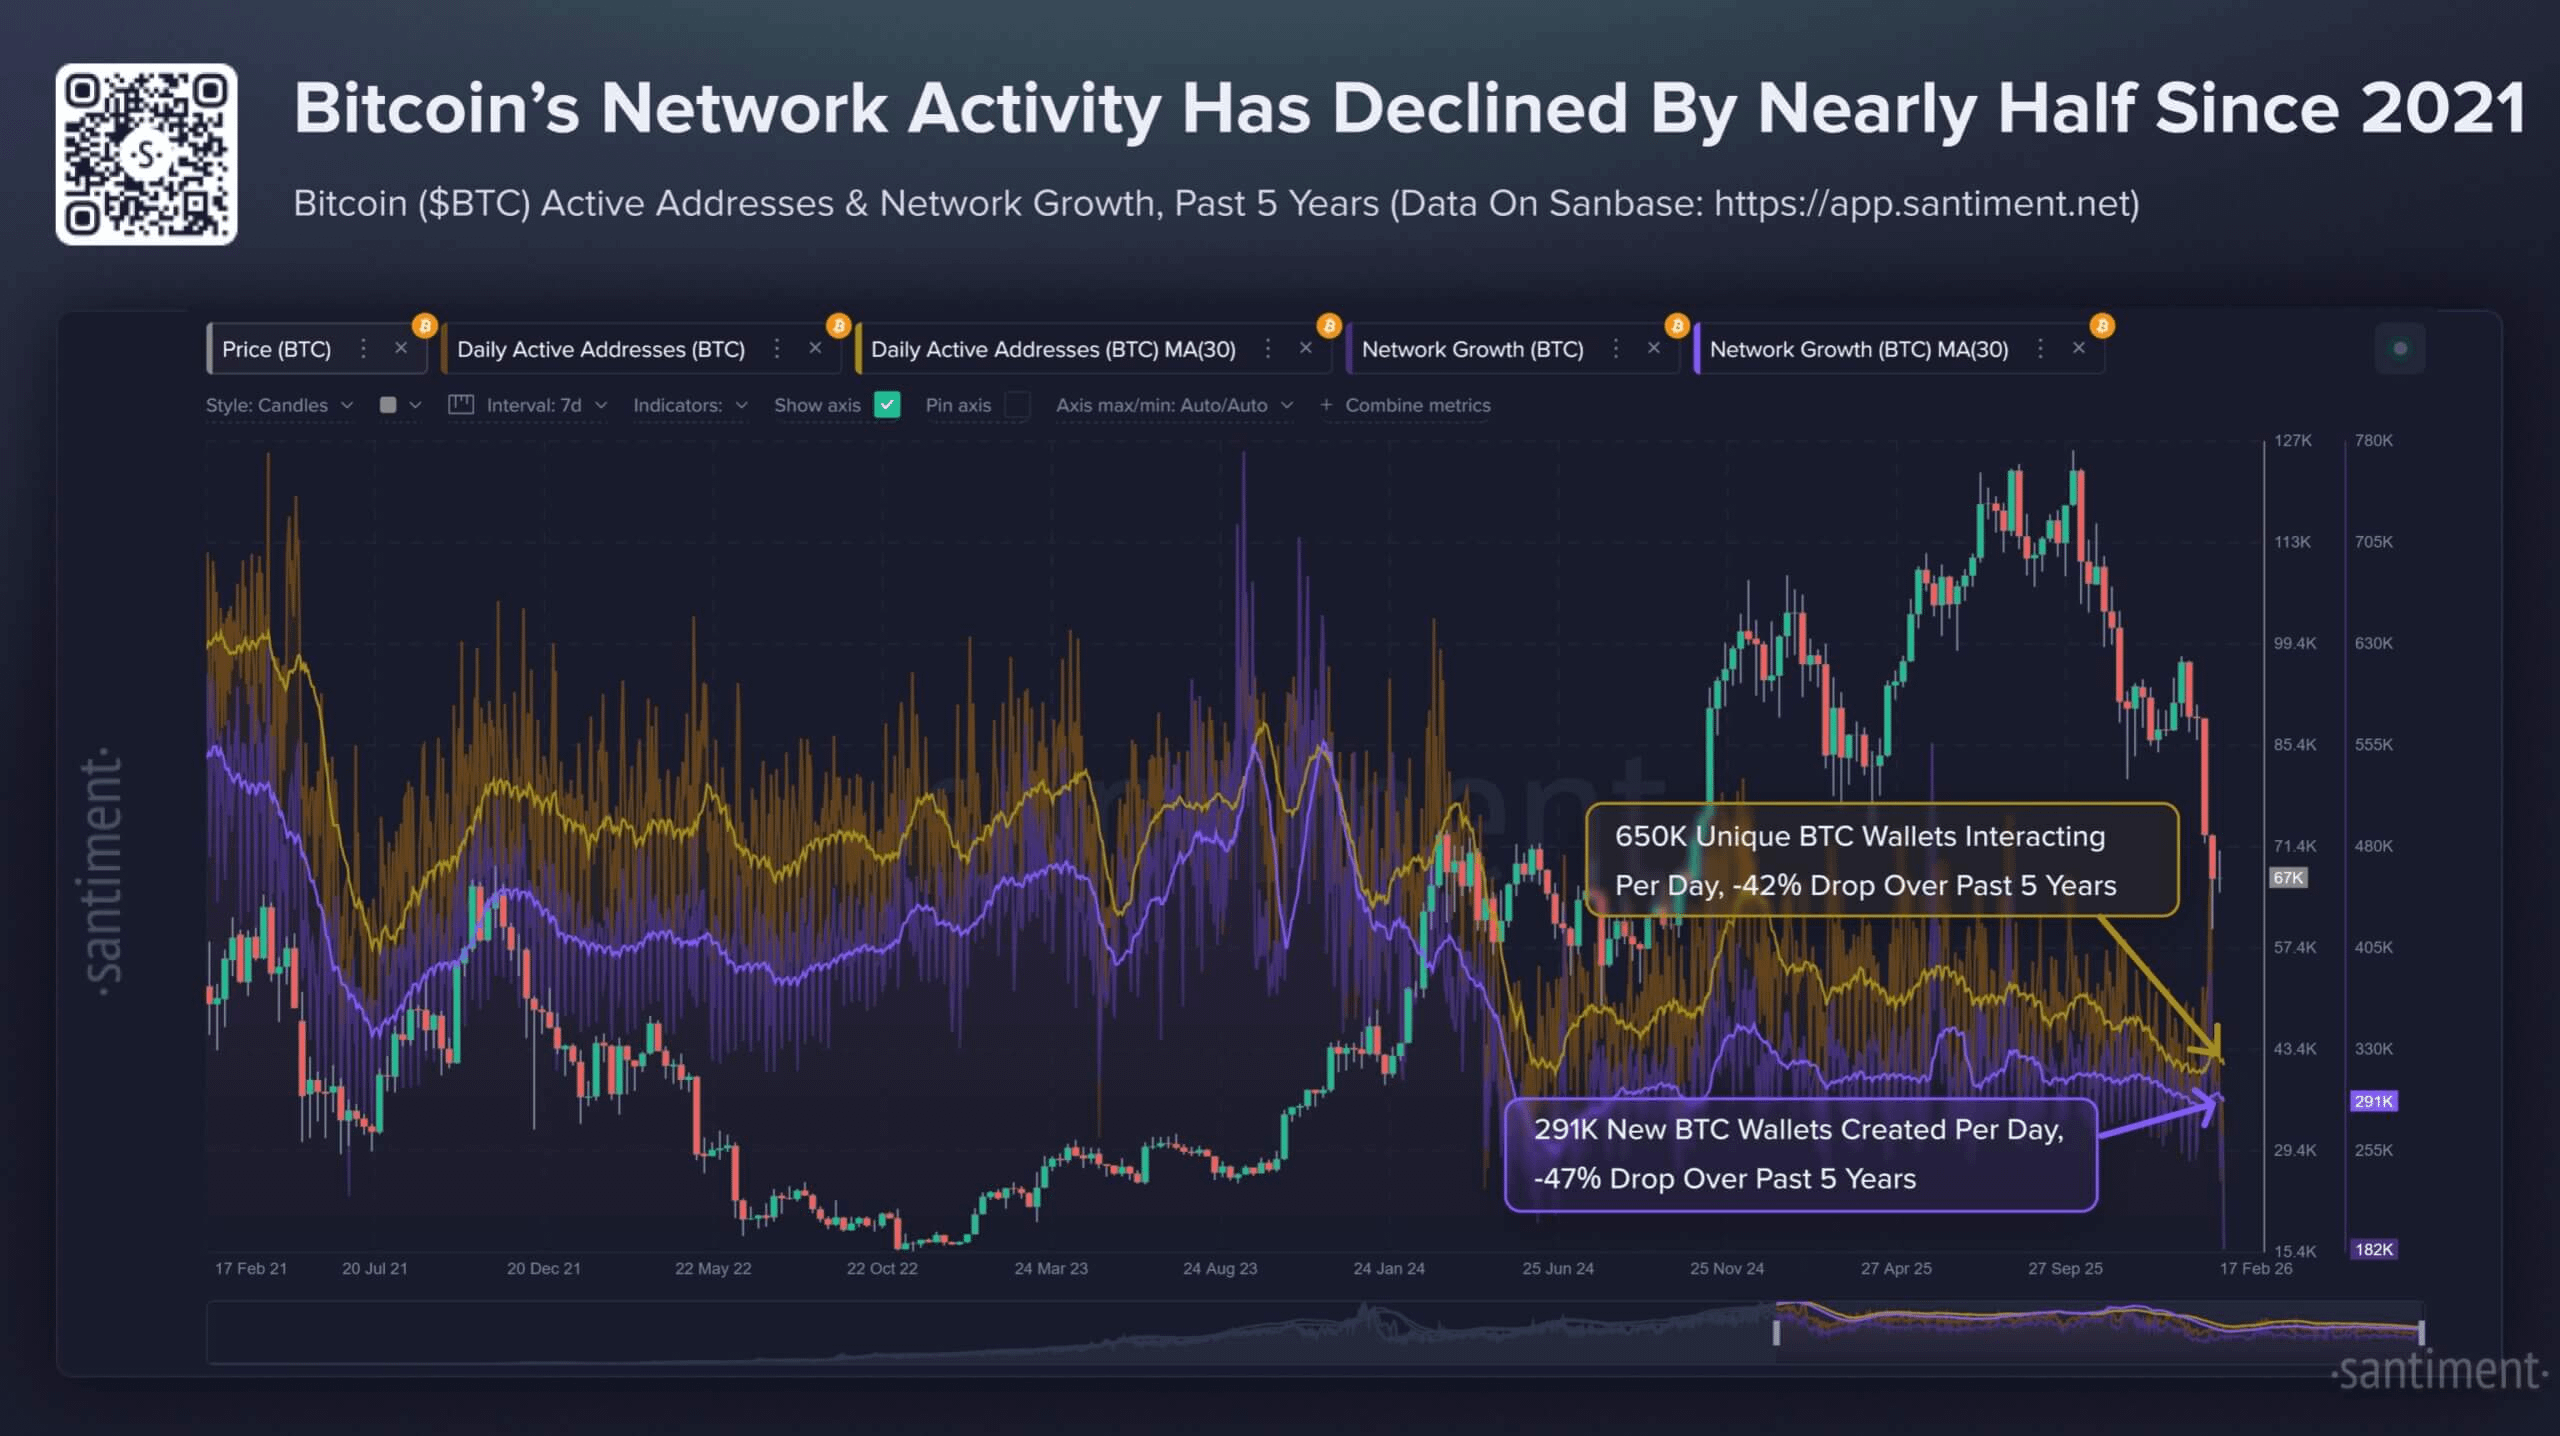
Santiment did not characterize this as evidence that crypto is dead or that a multi-year bear market is locked in, but it does describe a bearish divergence extending through 2025—market capitalization is rising while Bitcoin's utility metrics are weakening.
This tension is now reflected in the six-month trend. Prices and market narratives may persist, but the chain itself is becoming increasingly quiet.
Low transaction fees indicate shrinking demand for block space.
Transaction fee data further confirms that Bitcoin Layer 1 is in a state of weak demand.
Data from mempool.space shows that the network's recent average transaction fee is approximately $0.24, roughly equivalent to 1.8 sats/vB.
This is a low level for a network that experienced continuous block space competition during previous cycle peaks. At the current transaction pace, this fee level implies daily fee revenue of less than $100,000.
In contrast, block subsidies are still about 450 BTC per day, with transaction fee revenues making up a very small proportion.
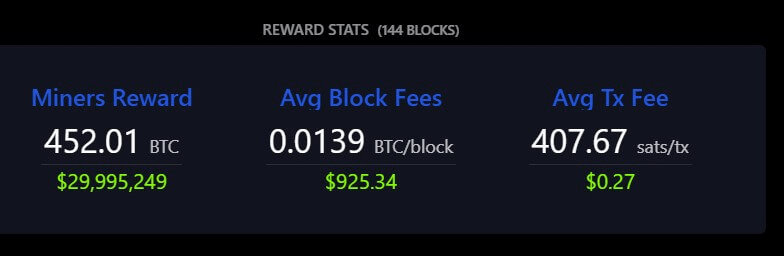
Bitcoin Average Block Fees
Source: Mempool.space
This is not an immediate security issue, nor does it mean that Bitcoin's security model is facing recent pressure.
This is because block subsidies still dominate miner revenues. However, it points to a long-term reality that Bitcoin has not yet been forced to confront in this cycle.
The topic of transitioning to fee-supported security budgets returns every cycle, but in the current environment, this transition has not been tested—because the demand for transaction fees is inherently weak.
From a practical standpoint, the currently quiet fee market delays this discussion.
The chain is not facing persistent congestion pressure, and users are not fiercely bidding to get on-chain. This situation can change rapidly during volatile events, speculative waves, or new demand shocks, but it has not occurred yet.
Currently, block space is in a noticeably low usage state compared to past bull market phases, aligning with the broader backdrop of declining participation breadth.
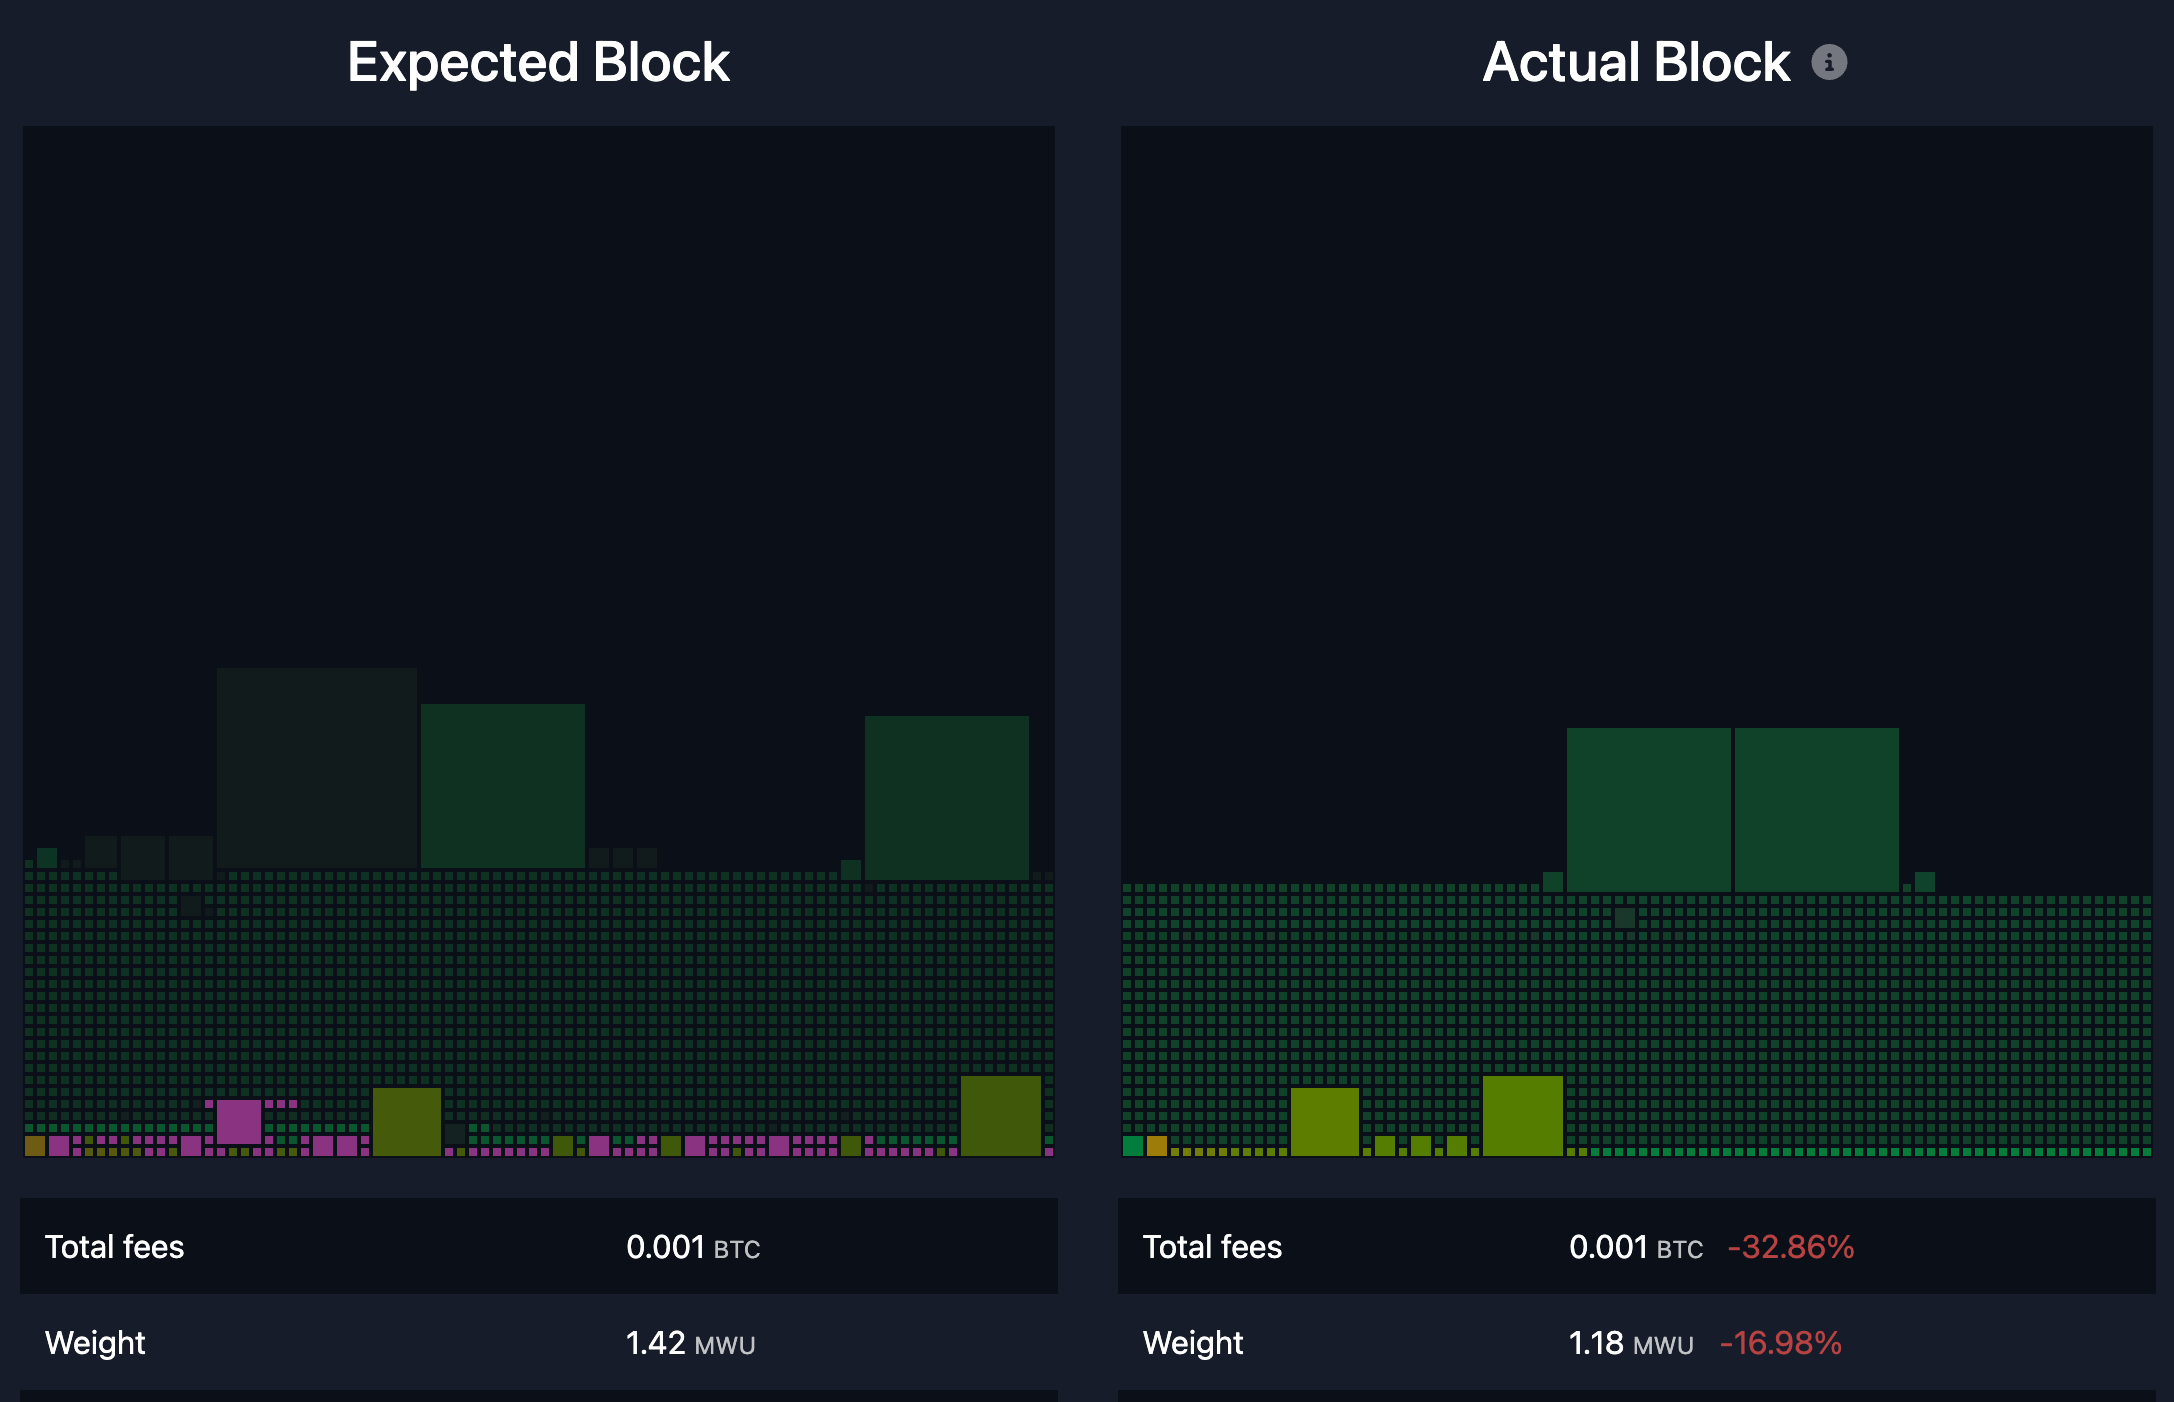
Bitcoin's Empty Mempool
Source: Mononaut
CryptoQuant's assessment also aligns with this fee environment—low network activity is typically associated with decreased market interest in the asset and generally loss-making periods.
When interest wanes, new participants decrease, and self-initiated transfers decline, the pressure from transaction fees dissipates.
Bitcoin can still be actively traded as a financial asset, but the chain itself no longer reflects broad user participation.
The macro environment and ETF fund flows are changing the way Bitcoin is traded.
The macro context helps explain why this trend persists.
Bitcoin is becoming increasingly like a high-beta asset sensitive to macro conditions, especially prominent during risk-averse periods.
Over the past year, U.S. inflation has eased, with the January 2026 CPI year-over-year growth rate at 2.4%; the Federal Reserve's target interest rate range was cited as 3.50% to 3.75% at the end of January.
In a simpler market environment, easing inflation may support a clearer rebound in risk assets.
However, market attention is focused on multiple volatility catalysts—including uncertainty in tariff policies. This factor has driven significant fluctuations in interest rates and the dollar, keeping overall risk appetite unstable.
In this environment, both retail and institutional investors tend to reduce their operating frequency. Retail participation declines, and turnover among traders decreases. Institutions can maintain their exposure but tend to adjust positions through products that do not require on-chain transfers.
This is precisely why the spot Bitcoin ETF has become a key narrative protagonist.
Coinperps data shows that U.S. Bitcoin ETFs have seen net outflows for multiple consecutive weeks, with a cumulative outflow of about $3.8 billion over the past five weeks, and an outflow of about $4.5 billion year-to-date.
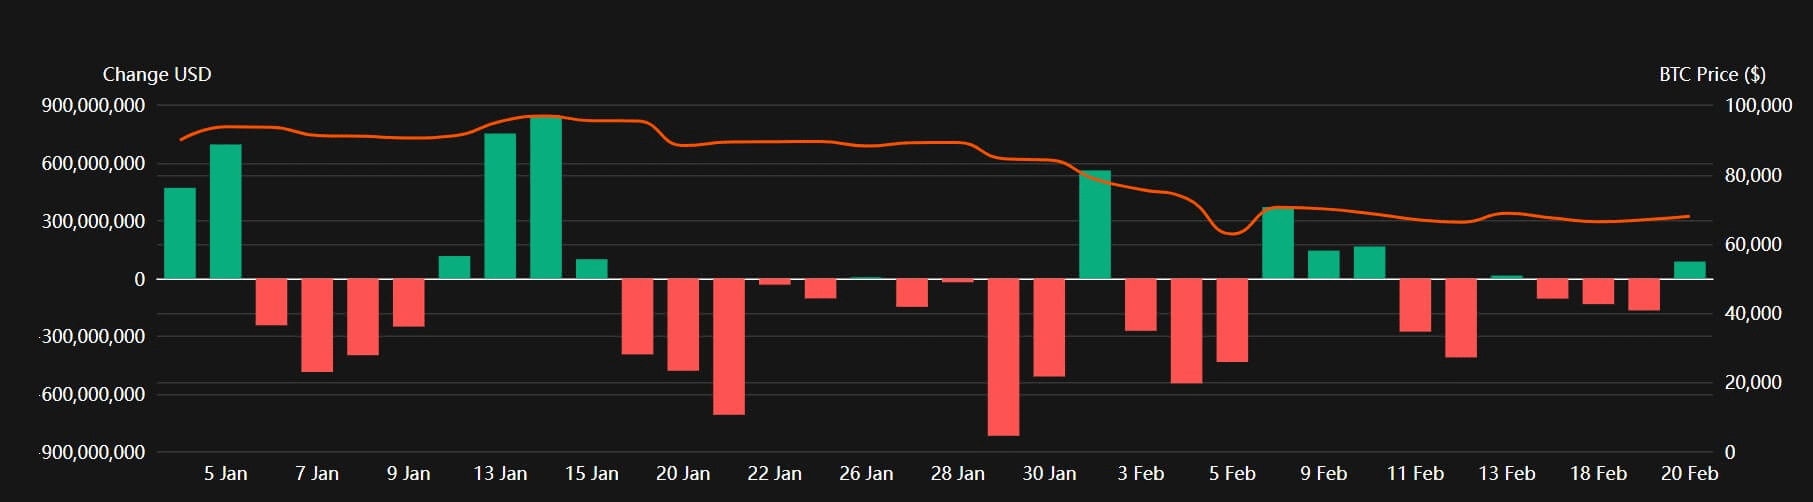
2026 U.S. Bitcoin ETF Daily Fund Flows
Source: Coinperps
This has shifted activity from self-custody wallets to brokerage accounts.
This also explains why the market can remain active while the chain becomes increasingly quiet. Exposure is still changing hands, but more turnover is occurring off-chain.
This is an important shift in Bitcoin's role. It increasingly resembles a financial product encased in institutional shell, while Layer 1 is used more selectively for settlements, storage, and periodic transfers.
Meanwhile, everyday trading energy in the crypto space is flowing to other areas, especially stablecoins.
Coin Metrics lists stablecoins as the core driver of on-chain activity, with the total supply of stablecoins approaching $300 billion and trading volume continuing to rise.
If other stablecoin tracks on different chains accommodate more everyday settlement needs, Bitcoin's Layer 1 will naturally become more singular in function.
This in itself does not undermine Bitcoin's investment logic, but it does alter its form.
Three potential scenarios for the next three to six months
The decline in network breadth over the past six months constructs three potential paths for Bitcoin's future trajectory.
The first scenario is one of continued indifference, which appears to be the baseline scenario in a risk-averse market environment.
In this scenario, active addresses remain low (between 450,000 and 600,000), transaction counts remain volatile but do not collapse, fees remain low, and ETF fund flows continue to stabilize or show slight negative values.
Here, Bitcoin may still fluctuate sharply due to macro headlines, but on-chain participation does not confirm a broad recovery. The trading logic of the asset resembles that of a macro tool rather than a network that is entering a new expansion phase.
The second scenario is liquidity thawing, which is the more optimistic path.
If inflation continues to ease and easing expectations stabilize risk appetite, ETF fund flows may shift from net outflows to sustained net inflows. In this environment, the growth of active addresses will become a key confirming signal.
A rebound to 650,000 to 800,000 active addresses would mean that participation breadth is recovering, not just a return of price momentum. This looks more like a classic cyclical recovery—price increases supported by the growth of on-chain user participation.
The third scenario is a structural replacement, which may be the most noteworthy.
In this scenario, Bitcoin's price rises, but on-chain breadth continues to languish. ETFs, derivatives, and custodial settlements continue to dominate, while stablecoins are accommodating more trading demand elsewhere in the crypto space.
Here, Bitcoin increasingly resembles a digital macro asset and settlement layer, rather than a chain with widespread daily retail activity.
This scenario will mark the evolution of Bitcoin's role, reflecting the profound changes that have occurred compared to years ago.
Original link