


Staring at a crypto chart for the first time feels like reading hieroglyphics. Red and green candles, wavy lines, strange formations it's overwhelming. But once you learn the basics, charts become your most powerful edge.
Here's everything you need to start reading crypto charts with confidence. 👇
🕯️ 1. Start With Candlesticks
Candlestick charts are the gold standard for crypto traders. Each candle tells a story:
Green body = buyers won (price closed higher than it opened)
Red body = sellers won (price closed lower than it opened)
Wicks = the highest and lowest price reached during that period
Key candlestick patterns to know:
Hammer → Bullish reversal signal in a downtrend
Shooting Star → Bearish reversal signal in an uptrend
Bullish/Bearish Engulfing → Strong momentum shift
Doji → Market indecision, often signals a reversal
📈 2. Identify Support & Resistance
Support is a price floor where buyers step in. Resistance is a ceiling where sellers take over. These are the most important levels on any chart.
🔑 Key rule: Once broken, resistance becomes support (and vice versa). Bitcoin's $20K level is the perfect historical example ultimate resistance in 2017, then critical support during the 2022 bear market.
🔍 3. Spot Chart Patterns
Patterns reveal trader psychology and often predict the next move.
Reversal Patterns (trend is about to change):
Head & Shoulders → Bearish | 81% success rate after neckline break
Double Top / Double Bottom → 84–88% reliability once confirmed
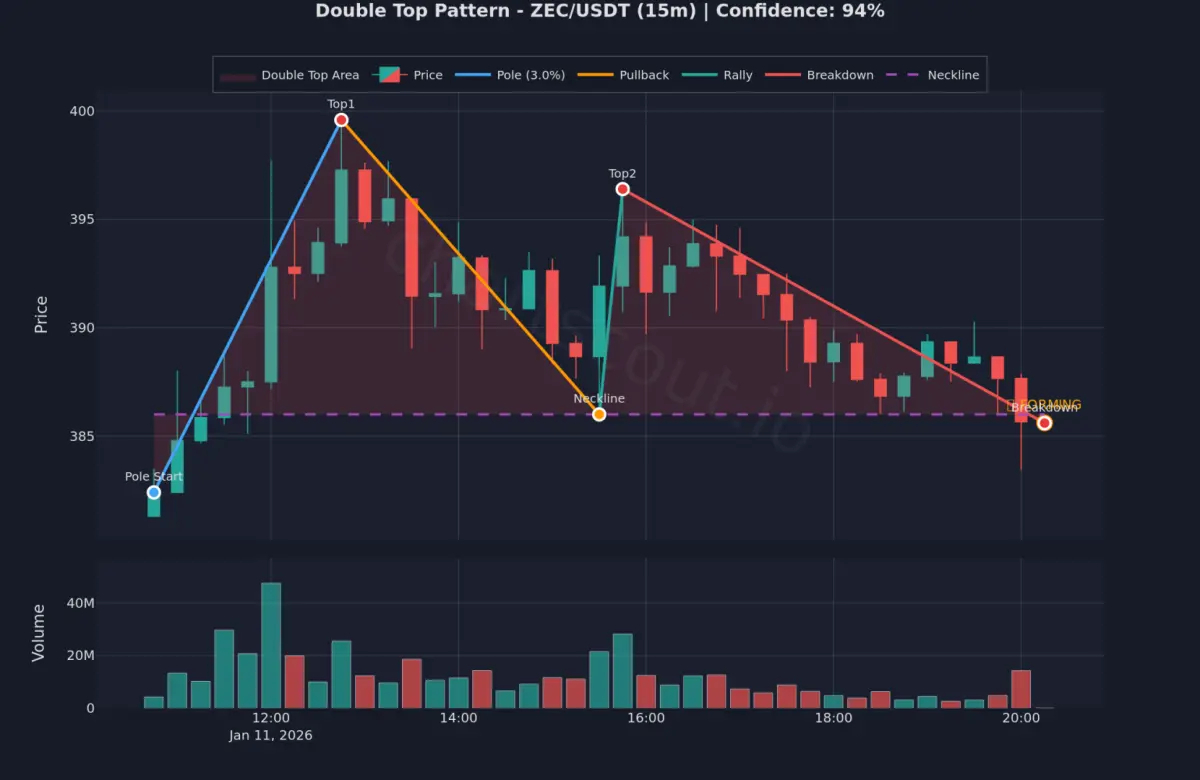
Double Top Detected 📉 Powered by ChartScout.io Continuation Patterns (trend will resume):
Bull/Bear Flags → Strong move, brief pause, then continues
Ascending / Descending Triangles → Breakout in direction of trend bias
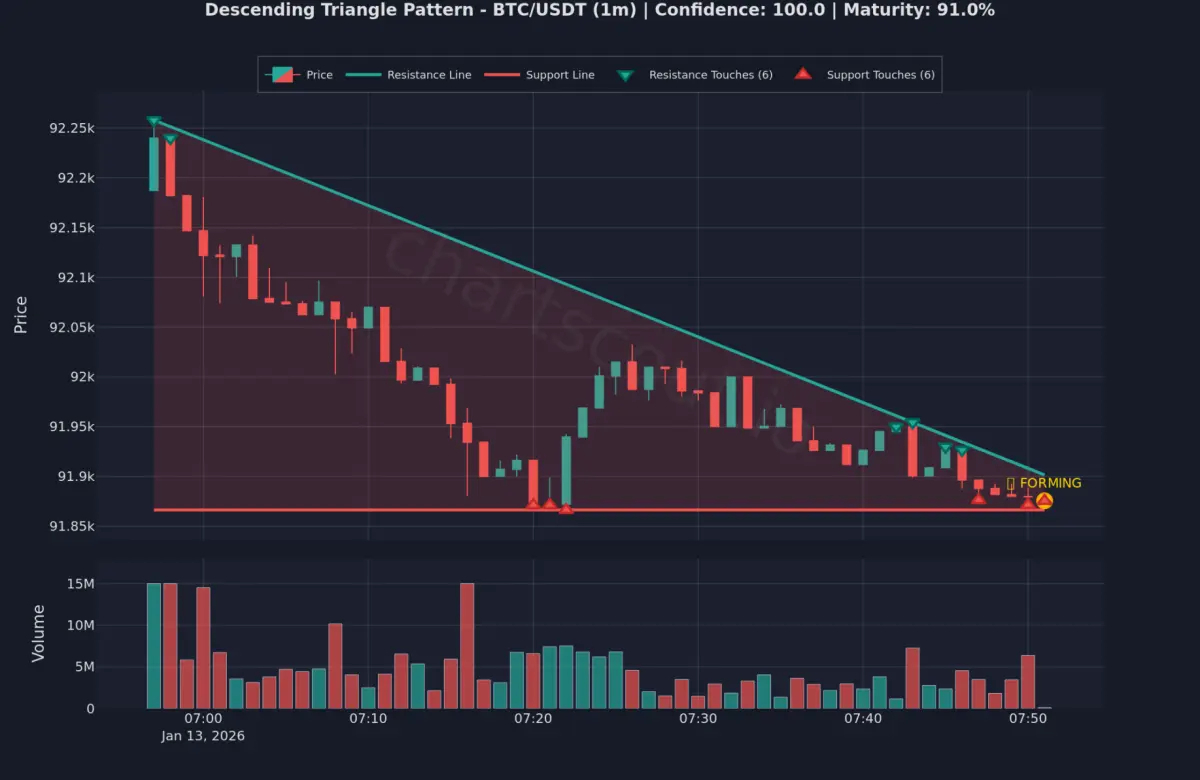
Descending Triangles Detected Powered by ChartScout.io
📊 4. Always Check Volume
Volume = conviction. Price action without volume is just noise.
Rising price + rising volume → Strong uptrend ✅
Rising price + falling volume → Weak rally, watch out ⚠️
Breakout + volume spike → Valid signal 🚀
Breakout + low volume → Likely a fakeout ❌
A valid breakout should ideally show volume at least 25–30% above the 20-day average.
⏱️ 5. Choose the Right Timeframe
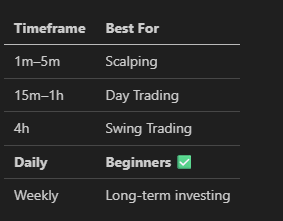
Start with the daily chart. It filters noise, gives you time to think, and provides the clearest signals.
❌ Common Beginner Mistakes
Fighting the trend ("catching a falling knife")
Using 10+ indicators → creates confusion, not clarity
Trading breakouts without volume confirmation
Forcing patterns that aren't clearly there
Trading without a defined entry, stop-loss, and target
🚀 Bottom Line
Reading charts is a skill. Start with candlesticks, master support & resistance, confirm with volume, and always trade with the trend. You don't need dozens of indicators just 2–3 solid ones (200 SMA + RSI + Volume) and a clear process.
The difference between winners and losers isn't talent. It's consistent practice and discipline.
📌 Want real time chart pattern alerts across 1,000+ pairs? Check out ChartScout.io AI-powered pattern detection across Binance, Bybit, KuCoin & MEXC. 🔔
Full Article: https://chartscout.io/how-to-read-crypto-charts
Disclaimer: This is educational content only, not financial advice. Crypto trading involves substantial risk. Always do your own research and never invest more than you can afford to lose. lol its using old reference ignore it.
#CryptoTrading #TechnicalAnalysis #CryptoCharts #bitcoin #Altcoin