
Résumé
Fundamental analysis of cryptocurrencies involves diving into the information available about a financial asset. For example, you can look at its use cases, the number of people using it, or the team behind the project.
Your goal is to reach a conclusion about whether the asset is overvalued or undervalued. At this point, you can use your conclusions to make decisions about your positions.
Introduction
Trading assets as volatile as cryptocurrencies requires a certain amount of skill. Choosing a strategy, understanding the world of trading, and mastering technical and fundamental analysis are practices that come with a learning curve.
When it comes to technical analysis, some skills can be inherited from traditional financial markets. Many cryptocurrency traders use the same technical indicators seen in Forex, stocks, and commodities trading. Tools such as RSI, MACD, and Bollinger Bands seek to predict market behavior regardless of the asset being traded. As a result, these technical analysis tools are also extremely popular in the cryptocurrency space.
In fundamental analysis of cryptocurrencies, although the approach is similar to that used in traditional markets, you can’t really use proven tools to evaluate crypto assets. To successfully conduct FA with cryptocurrencies, we need to understand where they get their value from.
In this article we will try to identify indicators that can be used to create your own indicators.
What is fundamental analysis (FA)?
Fundamental analysis (FA) is an approach used by investors to establish the “intrinsic value” of an asset or company. By examining a number of internal and external factors, their primary goal is to determine whether the asset or company is overvalued or undervalued. They can then use this information to enter or exit positions strategically.
Technical analysis also provides valuable trading data, but it gives different results. TA users believe that they can predict future price movements based on the past performance of assets. This is done by identifying candlestick patterns and studying key indicators.
Traditional fundamental analysts typically rely on a company's earnings to determine what they consider its true value. Metrics include earnings per share (how much a company makes in profit for each share outstanding) or price-to-book (how investors value the company relative to its book value). They may do this analysis for multiple companies in the same niche, for example, to determine how their potential investment compares to others.
For a more comprehensive introduction to fundamental analysis, see the article What is Fundamental Analysis?
The problem of fundamental analysis applied to cryptocurrencies
Cryptocurrency networks can’t really be measured in the same way as traditional companies. The most decentralized assets, like Bitcoin (BTC), are more akin to commodities. However, even for the most centralized cryptocurrencies (like those issued by organizations), traditional AF metrics can’t tell us much.
So we need to focus on different techniques. The first step in this process is to identify strong indicators. By strong, we mean those that cannot be easily manipulated. Twitter followers or Telegram/Reddit users are probably not good indicators, for example, because it is easy to create fake accounts or buy followers.
It’s important to note that there is no single metric that can give us a complete picture of the network we’re evaluating. We could look at the number of active addresses on a blockchain and see that it’s growing rapidly. But that doesn’t tell us much on its own. It could just be a standalone actor transferring funds to itself with new addresses each time.
In the following sections, we will look at three categories of cryptocurrency AF indicators: blockchain data indicators, project-related indicators, and financial indicators. This list will not be exhaustive, but it should provide us with a basis for further indicator creation.
Blockchain indicators

Blockchain indicators are those that can be observed by examining the data provided by the blockchain. We could examine the data ourselves by maintaining a node for the desired network, but this can be time-consuming and expensive. Especially if we only consider the investment and do not want to waste time or resources to perform the analysis.
A simpler solution would be to extract information from websites or using APIs specifically designed to help make investment decisions. For example, CoinMarketCap’s analysis of Bitcoin blockchain indicators gives us a myriad of information. Other sources include data charts from Coinmetrics or project reports from Binance Research.
Number of transactions
The number of transactions is a good measure of the activity taking place on a network. By plotting the data for specific periods (or using moving averages), we can see how the activity changes over time.
Note that this indicator should be used with caution. As with active addresses, we cannot ensure that there is not just one entity transferring their funds between their own wallets to inflate the blockchain indicators.
Transaction value
Not to be confused with the number of transactions, transaction value tells us the value transferred over a given period of time. For example, if a total of ten Ethereum transactions, each worth $50, were sent on the same day, we would say that the daily transaction volume was $500. We could measure this in a fiat currency like USD, or in the protocol’s native unit (ETH).
Active addresses
Active addresses are the blockchain addresses that are active over a given period of time. Calculation methods vary, but a popular method is to count both the senders and recipients of each transaction over specific periods of time (e.g., days, weeks, or months). Some traders also look at the number of unique addresses cumulatively, meaning they track the total number of addresses over time.
Fees paid
Perhaps more important for some cryptocurrencies than others, the fees paid can be an indication of the demand for block space. You could think of them as bids in an auction: users compete with each other to have their transactions included quickly. Those who bid higher will have their transactions confirmed (mined) faster, while those who bid lower will have to wait longer.
For cryptocurrencies that are decreasing in issuance, this is an interesting metric to study. Major proof-of-work (PoW) blockchains provide a block reward. In some cases, it is composed of a block subsidy and transaction fees. The block subsidy decreases periodically (during events such as the Bitcoin halving).
Since the cost of mining tends to increase over time, but the block subsidy slowly decreases, it makes sense that transaction fees must increase. Otherwise, miners would not be able to make a profit and would no longer support the network. This would have a negative effect on the security of the blockchain.
Hash rate and staked amount
Blockchains today use many different consensus algorithms, each with their own mechanisms. Since they play a vital role in securing the network, it can be helpful to dive into the data surrounding them for fundamental analysis.
Hash rate is often used as a measure of network health for proof-of-work cryptocurrencies. The higher the hash rate, the harder it is to pull off a 51% attack. But an increase over time can also indicate a growing interest in mining, likely due to lower fixed fees and higher rewards. Conversely, a decrease in hash rate indicates that miners are disconnecting from the network because it is no longer profitable for them to secure it.
Factors that can influence overall mining costs include the current price of the asset, the number of transactions processed, and fees spent to name a few. Of course, direct mining costs (electricity, computing power) are also important elements to consider.
Staking (in the context of Proof of Stake, for example) is another related concept with a similar game theory to mining. However, the mechanisms work differently. The basic idea is that users stake their own funds to participate in validating blocks. Thus, we could consider the amount staked at a given time to assess interest (or lack thereof).
Project indicators

Where blockchain metrics are derived from observable blockchain data, project metrics involve a qualitative approach, looking at factors such as team performance (if applicable), the whitepaper, and the upcoming roadmap.
The white paper
It is highly recommended to read the whitepaper of any project before investing. This is a technical document that gives us an overview of the cryptocurrency project. A good whitepaper should define the goals of the network, and ideally give us an overview of:
The technology used (is it open source?)
The intended use case(s)
The roadmap for updates and new features
The supply and distribution method of coins or tokens
It is a good idea to cross-reference this information with discussions about the project. What are others saying about it? Are there any risks identified? Do the goals seem realistic?
The team
If there is a specific team behind the crypto network, the background of its members can reveal whether the team has the skills required to make the project a reality. Have the members successfully undertaken projects in this sector before? Is their expertise sufficient to achieve the planned milestones? Have they been involved in shady projects or scams?
If there is no team, what is the developer community like? If the project has a public GitHub, check how many contributors there are and measure the activity. A currency that has been in constant development may be more attractive than a currency whose repository hasn't been updated in two years.
Competitors
A solid white paper should give us an idea of the use case the crypto asset is targeting. At this point, it is important to identify the projects it competes with, as well as the existing infrastructure it seeks to replace.
Ideally, fundamental analysis should be just as rigorous. An asset may look attractive on its own, but the same indicators applied to similar crypto assets may reveal that the indicators are weaker than for other cryptos.
Tokenomics and initial distribution
Some projects create tokens and then look for a problem they can solve. This doesn’t mean the project itself isn’t viable, but the token associated with it may not be particularly useful in that context. Therefore, it’s important to determine whether the utility of the token is real. And, by extension, whether that utility is something the market at large will recognize, and to what extent it would likely value that utility.
Another important factor to consider on this front is how the funds were initially distributed. Was it through an ICO or IEO, or can users earn tokens by mining? In the former case, the whitepaper should indicate how much is reserved for the founders and team, and how much will be available to investors. In the latter case, we might look for evidence that the creator of the asset premined (mining on the network before it was announced).
Focusing on distribution can give us an idea of the risks that may be present. For example, if the vast majority of the supply was held by just a few parties, we might conclude that it is a risky investment because these parties could potentially manipulate the market.

Financial indicators
Information about how the asset is currently traded, its past trading price, liquidity, etc. can all be useful for fundamental analysis. However, other interesting indicators that might fall into this category are those that relate to the economics and incentives of the crypto asset’s protocols.
Capitalisation
Network capitalization (or value) is calculated by multiplying the circulating supply by the current price. Basically, it represents the hypothetical cost of purchasing each available unit of the crypto asset (assuming no slippage).
Capitalization in itself can be misleading. In theory, it would be easy to issue a useless token with a supply of ten million units. If just one of those tokens were traded for $1, the capitalization would be $10 million. This valuation is clearly flawed. Without a strong value proposition, it is unlikely that the broader market will be interested in the token.
Since we are talking about circulating supply, it is impossible to truly determine the number of units in circulation for a given cryptocurrency or token. Coins can be destroyed, keys lost, and funds forgotten. What we see instead are approximations that attempt to exclude coins that are no longer in circulation.
However, capitalization is widely used to determine the growth potential of networks. Some cryptocurrency investors consider that “small-cap” coins are more likely to grow than “large-cap” coins. Others believe that large caps have stronger network effects, and therefore have a better chance than unestablished small caps.
Liquidity and volume
Liquidity is a measure of how easy it is to buy or sell an asset. A liquid asset is one that we would have no problem selling at its market price. Another related concept is a liquid market, which is a competitive market that is flooded with bids and offers (resulting in a lower bid-ask spread).
One problem we may encounter with an illiquid market is that we are unable to sell our assets at a “fair” price. This tells us that no buyers are willing to make the trade, leaving us with two options: reduce the price or wait for liquidity to increase.
Trading volume is an indicator that can help us determine liquidity. It can be measured in several ways and is used to show the total value traded during a given period. Typically, charts display daily trading volumes (denominated in native units or dollars).
Being familiar with liquidity can be useful in the context of fundamental analysis. Ultimately, it serves as an indicator of market interest in a potential investment.
Supply mechanisms
For some, the supply mechanisms of a currency or token are among the most interesting properties from an investment perspective. Indeed, models such as the Stock-to-Flow (S2F) ratio are gaining popularity among Bitcoin supporters.
The maximum supply, circulating supply, and inflation rate can inform decisions. Some currencies reduce the number of new units produced over time, making them attractive to investors who believe that demand for new units will outstrip their supply.
On the other hand, other investors might consider a rigidly enforced cap to be detrimental in the long run. There is concern that it will discourage the use of coins/tokens, with users choosing to hoard them instead. Others criticize it on the grounds that it disproportionately rewards early adopters, while a policy of constant inflation would be fairer to newcomers.
Indicators and tools of fundamental analysis
We have already defined indicators as quantitative and sometimes qualitative data used in a basic analysis. But by themselves, these indicators do not give us all the information. To better understand the fundamentals of a currency, we must also look at other indicators.
An indicator often combines multiple metrics using statistical formulas to facilitate causal analysis. However, there is still a lot of overlap between a metric and an indicator, making the definition quite broad.
While the number of active wallets is valuable, we can combine it with other data to derive more precise information. For example, we can look at the percentage of the total number of wallets or divide a market cap by the number of active wallets. This calculation would give us the average amount held per active wallet. Both of these pieces of information would allow you to draw conclusions about the activity of the network and the level of trust of users holding the asset. We will come back to this in more detail in the next section.
Fundamental analysis tools make it easy to collect all of these metrics. While you can look at raw data on blockchain explorers, an aggregator or dashboard can save time. Some tools allow you to create your own metrics with your chosen data.
Combining data and creating AF indicators
Now that we know the difference between data and metrics, let’s see how to combine data to better understand the financial health of the assets we’re interested in. Why do we do this? Well, as we pointed out in the previous section, every metric has its shortcomings. Furthermore, if you only look at a collection of numbers for each cryptocurrency project, you’re missing out on a lot of crucial information. Consider the following scenario:
Currency A | Currency B | |
Capitalisation | 100 000 000 $ | 5 000 000 $ |
Number of transactions (6 months) | 20 000 000 | 40 000 000 |
Average transaction value (6 months) | 50 $ | 100 $ |
Active addresses (6 months) | 30 000 | 2 000 |
Used alone, the number of active addresses doesn’t tell us anything essential if we compare the two projects. We could certainly say that Coin A had more active addresses in the last six months than Coin B, but that’s far from a complete analysis. What does this number have to do with market cap? Or the number of transactions?
A more conservative approach is to create a rate that we could apply to some statistics for currency A, and then compare them with the same rate calculated for currency B. This way, we are not blindly comparing individual data for each currency. Instead, we can create a standard to value currencies independently.
For example, we might decide that the relationship between market cap and number of transactions is much more telling than just market cap. In this case, we might divide market cap by number of transactions. For currency A, we get a ratio of 5, and for currency B, our ratio is 0.125.
Working with this ratio alone, we might think that currency B has more value or potential than currency A, because the calculated number is lower. This means that there are a much higher number of transactions compared to the capitalization of currency B. Therefore, we might think that currency B has more utility or that currency A is overvalued.
These observations should not be interpreted as investment advice. This is simply an example of how we can perform an analysis. Without understanding the goals of the projects and the function of the currencies, you cannot determine whether the comparatively lower number of transactions of currency A is a positive or negative development.
A similar ratio that has gained some popularity in the cryptocurrency markets is the NVT ratio. Coined by analyst Willy Woo, the network value-to-transaction ratio has been called the “price-to-earnings ratio of the cryptocurrency world.” In other words, it’s a ratio of capitalization (or network value) divided by transaction amount (usually on a daily chart).
We are only scratching the surface of the possibilities of how indicators can be used. Fundamental analysis is about developing a system that can be used to evaluate projects as a whole. The better research we do, the more data we have to work with.
AF Key Indicators and Data
There are a lot of indicators and data to choose from. For a beginner, start with a few of the most popular ones. Each indicator gives only a partial picture of the market, so use a variety of them in your analysis.
Transaction Value Ratio (NVT)
If you've heard of the price-to-earnings ratio used to analyze stocks, the Daily Trading Value indicator offers a similar approach. It simply involves dividing a currency's market capitalization by its daily trading volume.
We use daily trading volume as a proxy for the underlying, inherent value of a currency. This concept is based on the premise that the more volume circulating in the system, the more valuable the project is. If a currency’s market cap increases while daily trading volume lags, the market could enter a speculative bubble phase. Prices increase without any increase in underlying value. Alternatively, the price of a currency or token may remain stable while daily trading volume increases. This scenario could suggest a potential buying opportunity.
The higher the value of the ratio, the more likely it is that a bubble will occur. This point is usually considered reached when the NVT ratio is above 90-95. A falling ratio indicates that the cryptocurrency is less overvalued.
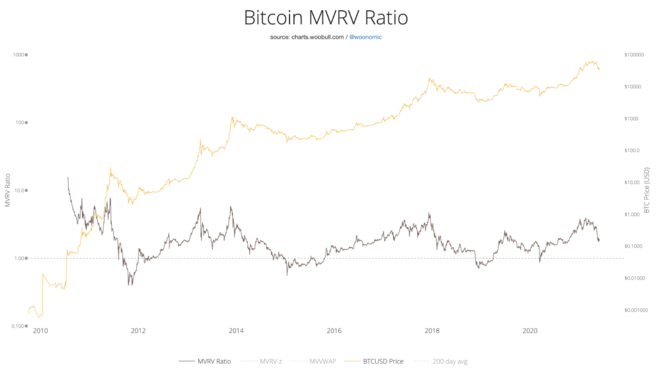
Market Value to Realized Value (MVRV) Ratio
Before we dive into this statistic, we need to understand what realized value means for a crypto asset. Market value, otherwise known as capitalization, is simply the total supply of coins multiplied by the current market price. Realized value, on the other hand, does not take into account coins lost to inaccessible wallets.
Coins in dormant wallets are valued at the price of their last movement. For example, a Bitcoin forgotten in a wallet since February 2016 will only be valued at around $400.
To get our MVRV indicator, we simply divide the market cap by the realized market cap. If the market cap is much higher than the realized market cap, we will end up with a relatively high ratio. A ratio above 3.7 suggests that a correction may be occurring as traders take profits due to the currency being overvalued.
This number means that the currency may be currently overvalued. You can see this before two big profit-takings on Bitcoin in 2014 (MRVR of around 6) and 2018 (MRVR of around 5). If the value is too low and below 1, it indicates that the market is undervalued. It would be interesting to buy in this situation, as buying pressure increases and pushes the price up.
Modèle stock-to-flow
The stock-to-flow indicator is a popular indicator of the price of a cryptocurrency that is typically in limited supply. The model treats each cryptocurrency as a finite and scarce resource, similar to metals or gemstones. Since there is a known limited supply with no new sources to be found, investors use these assets as a store of value.
We calculate the metric by taking the total global circulating supply and dividing it by the amount produced per year. With Bitcoin, you can do this with easy-to-find numbers and circulation data on recently mined Bitcoin. The decreasing mining yields result in a higher ratio reflecting its scarcity, making the asset more valuable. Bitcoin undergoes a block reward halving periodically, and as we can see, this is reflected in the flow of new Bitcoins into the market.
As you can see, stock prices have been a reasonably good indicator of Bitcoin price. Bitcoin price has been overlaid on the 365-day average of the ratio and shows a good fit. However, there are some drawbacks to this model.
For example, gold currently has a stock-to-flow ratio of about 60, meaning it would take 60 years to mine the current supply of gold at the current flow. Bitcoin is on track to reach a ratio of 1600 in about 20 years, setting a price forecast and capitalization higher than the current wealth in the world.
The stock-to-flow model also has a hard time accepting deflation, as this would suggest a negative price. When users lose their wallet keys and there are no more bitcoins produced, we would see a negative ratio. The stock-to-flow ratio would then go to infinity and then negative if we graphed this.
If you want to learn more about the model, check out our guide to Bitcoin and the Stock to Flow Model.
Examples of fundamental analysis tools
Base rank
Baserank is a cryptoasset research platform that aggregates information and reviews from analysts and investors. The cryptocurrency is given an overall rating from 0 to 100 after taking the average of each reviewer’s rating. While there are premium reviews for subscribers, free users can still see a full overview of reviews divided into sections, including team risks, usefulness, and investment. If you are short on time and need a quick overview of a project or coin, an aggregator like Baserank is perfect for the task. However, you should always do a deeper research on projects you are interested in before investing.

Crypto Fees
As you might have guessed from the name, this tool shows you the fees of each network over the last 24 hours or seven days. This is an easy-to-use metric to analyze the traffic and usage of a blockchain network. Networks with high fees usually experience high demand.
However, this should not be taken literally. Some blockchains are built with low fees in mind, making it difficult to compare them to other networks. In this case, it is best to look at this information in conjunction with the transaction amount or another indicator. For example, high-cap coins like Dogecoin or Cardano are lower on the charts due to their low transaction fees.

Glassnode Studio
Glassnode Studio offers a dashboard displaying a wide range of blockchain indicators and data. Like most of the tools offered, it is available as a subscription. However, the volume of free data it offers is suitable for amateur investors and quite detailed. It is much easier to find all the information in one place rather than gathering it yourself using blockchain explorers. Glassnode's main strength is the large number of indicator categories and subcategories that you can browse. However, if you are interested in Binance Smart Chain projects, you will quickly be limited.
Glassnode Studio also integrates TradingView into all of its charting tools for anyone who wants to combine their indicators with technical analysis. It’s common for investors and traders to combine multiple types of analysis when making decisions. Being able to do everything in one place is a plus.

To conclude
When used correctly, fundamental analysis can provide invaluable insights into cryptocurrencies that technical analysis cannot. Being able to separate the market price from the “real” value of a network is a great skill to have when trading. Of course, there are things that TA can tell us that can’t be predicted with FA. That’s why many traders use a combination of both approaches.
As with many strategies, there is no one-size-fits-all AF strategy. We hope this article helps you understand some of the factors to consider before entering or exiting cryptocurrency positions.