
What is the Relative Strength Index indicator?
In essence, technical analysis (TA) involves predicting future market trends by examining previous action. In both traditional and cryptocurrency markets, most traders rely on specialized indicators and previous data analysis tools as a way to identify patterns in the markets, and thus perhaps be able to predict the next price movements.
The Relative Strength Index (RSI) is a TA indicator developed in the late 1970s as a tool for stockbrokers to analyze the performance of a security over a period of time. It is, basically, a momentum oscillator that measures the magnitude of price movements, as well as their speed. The RSI can be a very useful tool depending on the type of trading carried out, which is why it is widely used by traders and technical analysts.
In 1978, a mechanical engineer named J. Welles Wilder focused his analytical training on technical trading. He began his career in finance in real estate in the 1960s. After his partners bought him out of the business in 1972, he took his $100,000 in profits and began trading in the stock market - which led him to look for reliable tools to recognize profitable patterns. In 1978, Wilder compiled his research and experiences into mathematical formulas and indicators that traders could use in their activity. The Relative Strength Index would be one of those indicators.
How does the RSI indicator work?
By default, the RSI measures changes in an asset's price over 14 periods (14 days for daily charts, 14 hours for hourly charts, and so on). The formula divides the average gain that the price has had over that time by the average loss it has endured, and then expresses this strength on an adjustment scale between 0 and 100.
As we have already noted, the RSI is a momentum indicator, a technical trading tool that measures the rate of price change. When momentum increases, it means that the stock is being actively bought in the market. When momentum decreases, it is a sign that traders' interest in the stock is decreasing.
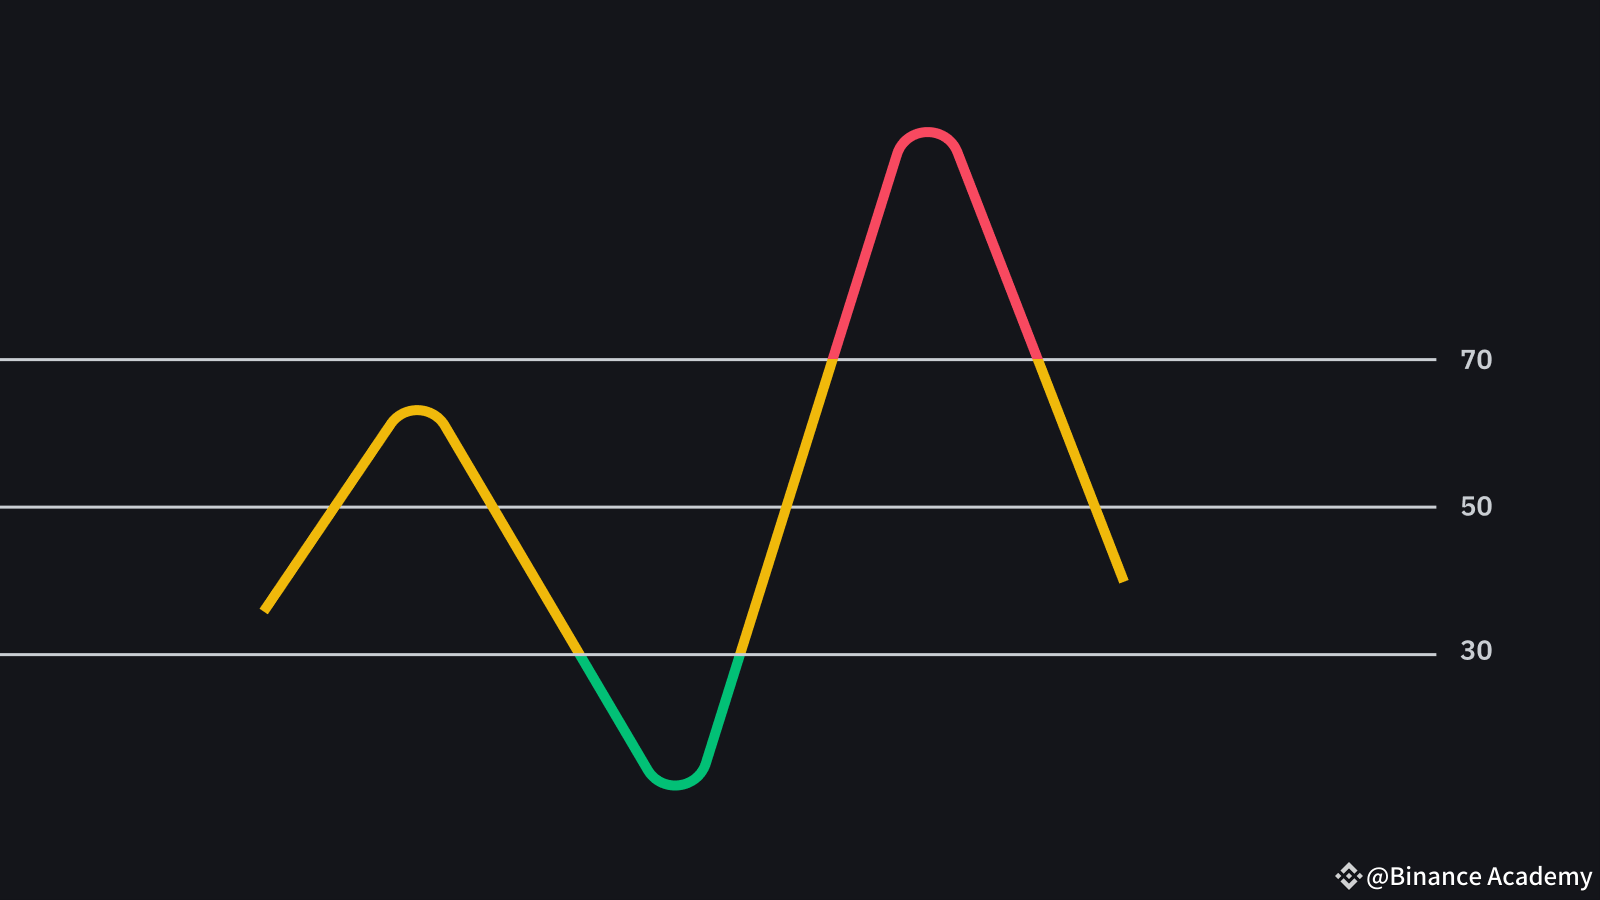
The RSI is also a swing indicator that makes it easier for traders to detect overbought or oversold market conditions. Evaluates the price of the asset on a scale that goes from 0 to 100, taking into account the 14 periods. While a level of 30 or less on the RSI suggests that the asset is likely near its bottom (oversold), a measurement above 70 suggests that the asset's price is near its ceiling (overbought) for that time period. and most likely will fall.
Although the default RSI setting is 14 periods, traders can modify it to increase the sensitivity (fewer periods) or decrease the sensitivity (more periods). That is, a 7-day RSI will be more sensitive to price movements than the one that considers 21 days. Additionally, short-term trading setups can adjust the RSI indicator to consider 20 as oversold and 80 as overbought (instead of 30 and 70), making it less likely to fall for false signals.
RSI Divergences
Aside from the 30 and 70 RSI levels - which can suggest potentially oversold or overbought market conditions - traders also use the RSI to attempt to predict trend changes or detect support and resistance levels, using callouts. bullish (bullish) or bearish (bearish) divergences.
A bullish divergence is a condition where the price of an asset moves in one direction and the RSI indicators move in the opposite direction. Thus, the RSI level rises generating higher lows, while the price falls generating lower lows. This is called a bullish divergence and indicates that momentum is strengthening despite the price decline.
On the contrary, bearish divergences can indicate that, despite the rise in price, the market is losing momentum. Therefore, the RSI level falls and generates lower highs, while the asset price increases generating higher highs.
It should be kept in mind, however, that RSI divergences are not as reliable during strong market trends. This means that a downtrend can have many bullish divergences before reaching its true bottom. Because of this, RSI divergences work best in less volatile markets (with lateral movements or subtle trends).
How is RSI used?
There are several important factors to consider when using the Relative Strength Index indicator, such as setups, levels (30 and 70), and bullish/bearish divergences. However, one should always keep in mind that no technical indicator is 100% effective - especially if used alone. Therefore, traders should consider using the RSI indicator along with other indicators to avoid false signals.