Today we will understand pinbar from several perspectives:
(1) Why is pinbar effective in structural positions?
(2) Why is it sometimes ineffective?
(3) What is the relationship between Pinbar and liquidity?
(4) Where is the first entry point for Pinbar?
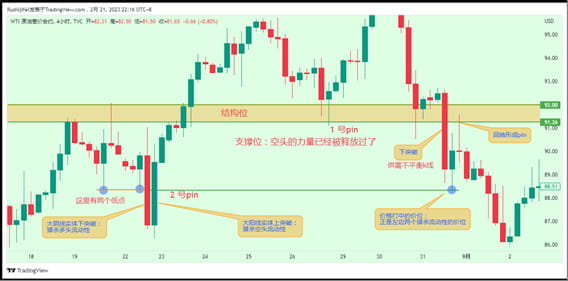
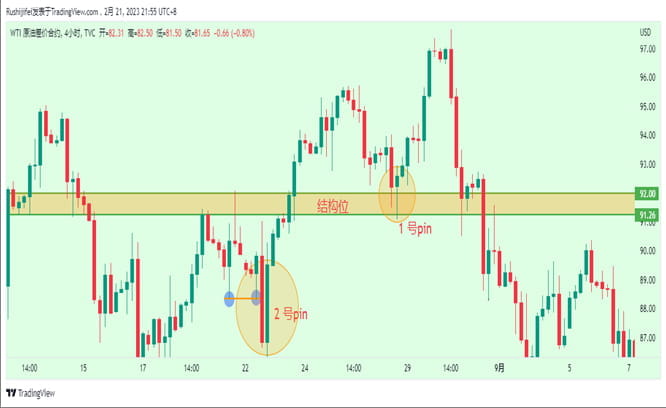
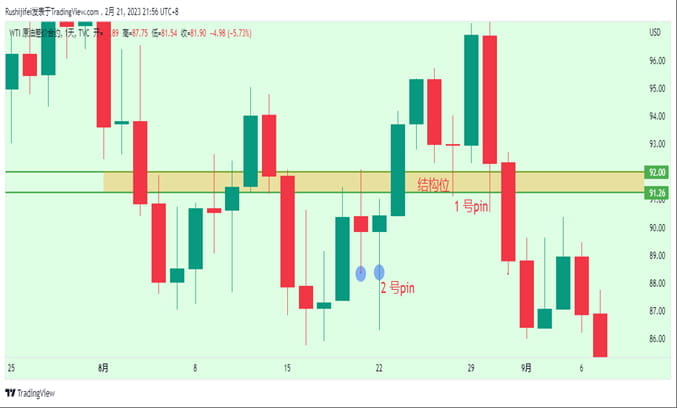
This topic comes from a question from a friend. Let's take a look at the chart he gave: There are two pinbars in the chart, marked as 1 and 2 (position 2 is a pinbar in the daily chart). His question is: Why is there no buy order at the two positions I marked?
Question (me): Why do you think there will be buy orders? Answer: First of all, there is an obvious pinbar at the upper position, so there should be buy orders. There is also a long positive line at the lower position, so there should also be buy orders.
I personally think this friend's question is quite good, and it is also a common problem. Therefore, let's answer the opening four questions from the perspective of liquidity (or order):
Let’s answer the second question first:
Question: "If a long positive candle is drawn at the next position, there should be a buy order."
Answer: When the bullish candlestick reverses, there is a buy order, but we need to see the specific entry position of the buy order. How to confirm it?
Thinking: Why is the pinbar sometimes effective? Sometimes ineffective? How to make a clearer judgment from other angles? Let's look at the process of the pin pattern No. 2: (1H chart analysis)
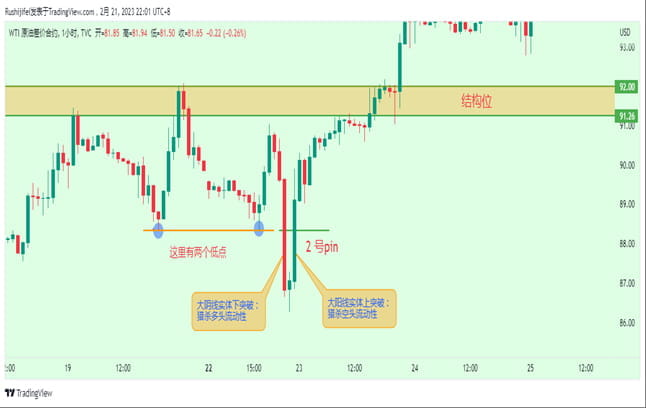
Question (me): How to verify, or how to prove whether there is a purchase order?
Answer: Let’s look at another picture: The price hit: It is exactly the two prices on the left that hunt liquidity.
This is one of the ways to determine whether a pin is effective from a liquidity (order) perspective.
Let’s answer the first question:
Question: "There is an obvious pinbar at the position above and there should be a buy order to enter."
Answer: Pin does not necessarily represent a buy order, it can also be the release of short-selling power in the previous period, resulting in the formation of a pin in the Kline. (This understanding is very important) It can be seen that Pin No. 1 was just at a structural position, and the subsequent price tested this structural position again and fell below it. Why?
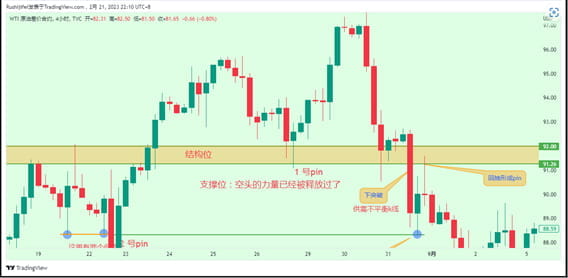
Pin No. 1 and the "pin formed by retracement" in the figure are the result of the release of liquidity orders by one of the long and short forces after the liquidity imbalance of a certain structural position, that is, the conversion between long and short.
The release of liquidity by short positions forms pin No. 1; the release of liquidity by long positions forms a "retracement pin".
It is equivalent to the buy order position being at the lowest point of the pin (the sell order entry position is at the highest point), that is, the first entry position starts from the lowest point (highest point) of the pin, which is different from our traditional pin entry point (breakthrough entry: entry at the highest/lowest point of pinbar; entry at the current price after closing; entry at 0.5-0.618 retracement).
This is why the supply and demand entry can capture the extreme point, while the PA entry cost is slightly lower. This is also why you can use the supply and demand imbalance to enter the market directly without the need for PA secondary confirmation.
Furthermore: If pin 1 is the release of short liquidity orders from the previous period, then it tells us that the power of the trapped shorts in this structural area is decreasing or even zero. And what is the resistance to the downward price? It is the shorts that have entered the market in the previous period. If the short power that has entered the market is released to the point of even zero, then it is normal for the price to test this structural position again in the later period and be directly broken through. This is why the pins on the structural position are sometimes effective and sometimes ineffective. Entry position? Profit space?