
Anyone who often trades knows that there are many false breakthroughs and banker's flops, and the only thing that can't fool people is the relationship between volume and price. Today, I will focus on the winning signal of entering the market based on volume and price.
1. What is trading volume:
Trading volume in the digital currency market (VOLUME): refers to the number of transactions in a certain period of time, which is reflected in the form of volume energy columns. You sell one Bitcoin, I buy one Bitcoin, and we close the deal. Then the trading volume is 1. 2. How to set the trading volume: as shown in the figure
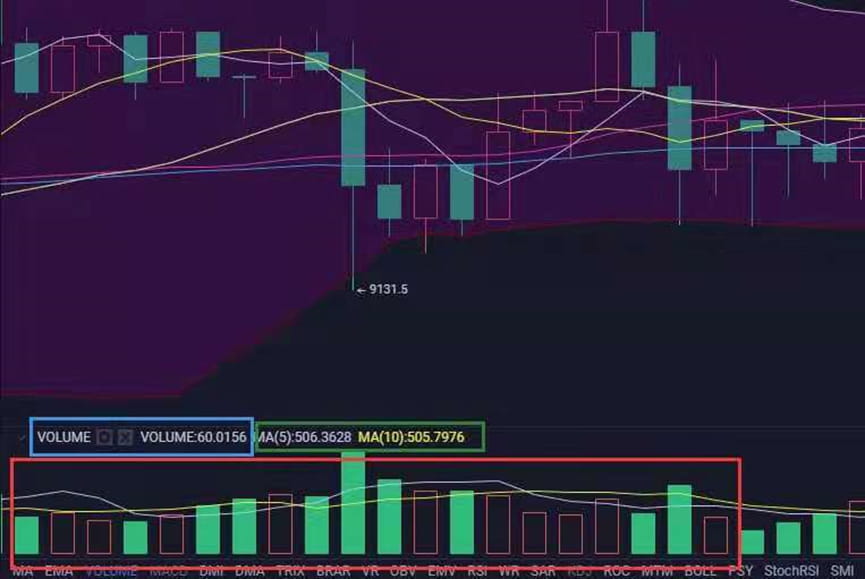
1. 2. As shown in the figure: the red rectangular box is the display area of Bitcoin trading volume on AIcoin.
2. Consists of red and green bars, which represent the trading volume in a certain time period.
3. The higher the bar, the greater the trading volume, and the shorter the bar, the lower the trading volume. The red column represents that the price has increased during this period, and the green column represents that the price has decreased during this period.
4.1. If it is a daily chart, then a bar represents the trading volume of that day, and the hourly chart represents the trading volume of one hour. The higher the trading volume, the higher the bar. 2. 3. In the blue box: parameters can be set, the default is 5, 10. The periods representing trading volume are MA5 and MA10 in the green box. For example, if one day is used as a cycle, that is the average number of transactions within 5 days and 10 days. A single bar is the graphic representation of daily trading volume. 3. 4. Inside the green box: The position of VOLUME. If viewed on a daily basis, it represents the number of Bitcoin transactions in one day at this moment. The picture shows: 48,475.9755 {number is for reference only} 4.5. Huobi’s trading volume display: VOL represents trading volume: the internationally accepted saying is 1K=1000, 1M=1 million, 1B=1 billion
2. The performance significance of trading volume:
1. The size of the trading volume reflects the degree of recognition of the current price by both the long and short parties in the market: large trading volume means that the differences between the long and short parties are large; small trading volume means that the differences between the long and short parties are small. The red pillar represents stronger buying, and the green pillar represents stronger selling, which corresponds to the Yin line and Yang line above.
2. Trading volume also reflects the trading activity of a certain currency in the market: If the trading volume in the market is very small, it means that no one is buying or selling, and the market is inactive. Only when the trading volume becomes more and more enthusiastic At that time, the entire market was relatively dynamic, and prices rose and fell at a relatively large rate.
If the market enters a shrinking state, it means that the market is currently in a market environment with a very strong wait-and-see atmosphere. It means that the market is consolidating, sorting out the market, there is not much market movement, and the price is at a horizontal level.
3. It is impossible to judge the market direction from trading volume alone. It needs to be combined with K-line trend, currency price, time, news, other technical indicators and other comprehensive analysis to draw a relatively correct and accurate conclusion.
4. When we judge whether a currency is active, we can look at its average trading volume. No matter when the market is rising or falling, the volume will continue to increase and the activity will continue to increase.
4. Several common forms of trading volume:
1. Increasing volume, 2. Shrinking volume, 3. Heaping volume, 4. Sky volume, 5. Land volume.
1. Increase the volume:
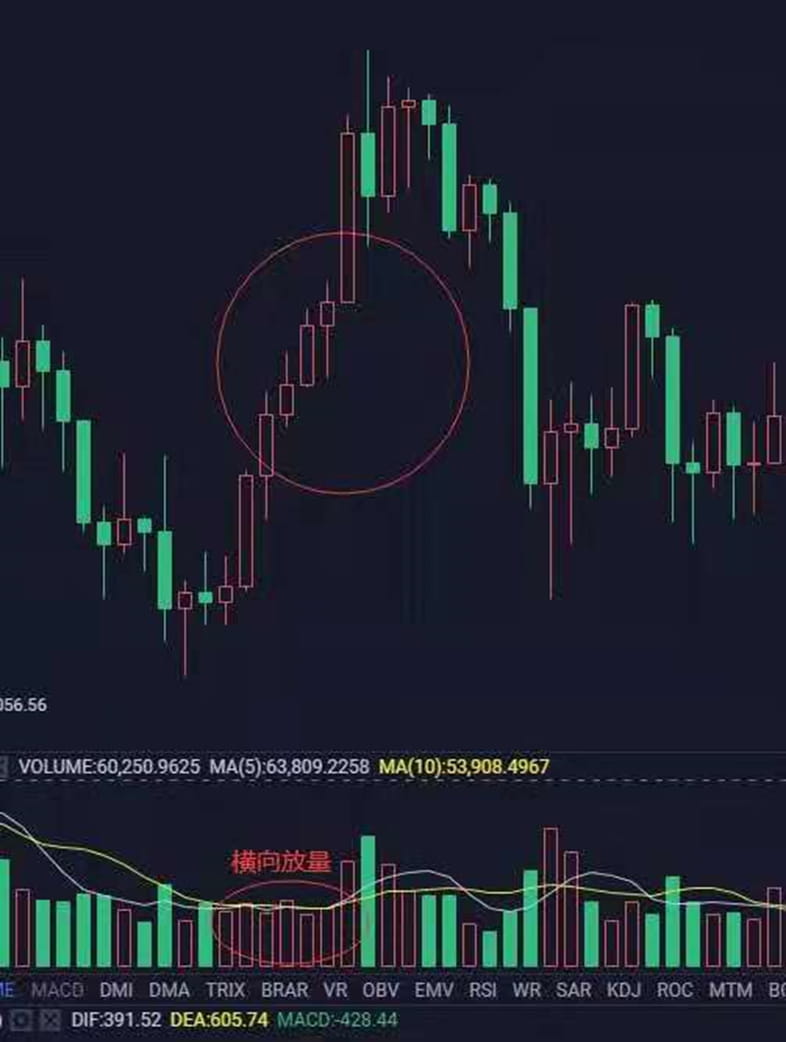
Refers to the phenomenon that trading volume has increased significantly compared with the previous period. Divided into horizontal volume and vertical volume.
Horizontal volume increase: refers to the process of increasing the current trading volume relative to the previous adjacent trading volume, and is the result of comparing the trading volume in the previous period. Also called relative volume or regional volume.
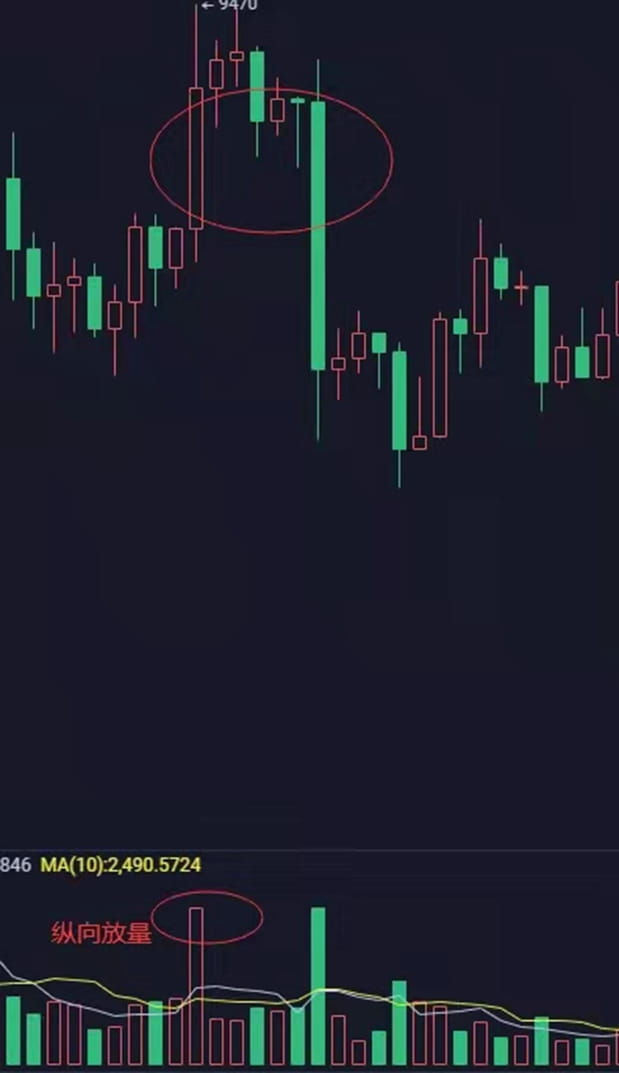
Vertical volume increase: refers to the continuous increase in volume on the same day. In addition to indicating active trading on the day, it also indicates the increase in turnover rate.
If the trading volume is abnormal, the volume suddenly increases and the volume is uneven, it rises or falls sharply, you should pay more attention to it.
2. Shrinkage:
It refers to the phenomenon that the trading volume of a certain currency has significantly reduced compared with the previous period. Most investors have gradually converged on the future trend of the market, and the trading volume is extremely light.
Shrinkage generally occurs in the middle of the trend. The rise and fall of shrinkage are not true rises and falls. It is usually called cheating, deceiving more, and luring more, which means that this trend cannot be continued.
3. Shrinking increase: refers to the phenomenon that during the price increase of a certain currency, the trading volume shrinks significantly compared with before. This phenomenon shows that only the buying orders of on-site funds are transacted, and the entry of off-site funds is not active. Investors can buy in moderation and sell when the price is weak and large amounts are released.
4. Shrinking decline: refers to that when the price of a certain currency falls, the trading volume drops significantly compared to before. Investors can wait until the trading volume shrinks to a certain extent, and then choose to buy appropriately when the volume begins to rise. Neither the rise in volume nor the sharp decline in volume is a true rise or fall. It is usually called cheating, deceiving more, and luring more, which means that this trend cannot be continued. The slowdown in volume is real.
5. Heap volume:
It means that the trading volume shows a shape similar to a mound, the trading volume increases moderately, and the pile volume reflects a healthy rising pattern.
Three common ways to form the amount of sky
1. Under the guidance of the main force, a large number of retail investors entered the market, causing the trading volume to continue to increase.
At this time, two situations will occur: first, when the main force has accumulated enough funds at the bottom, in order to attract retail investors to come in and take orders, it will then quickly pull up and wait for retail investors to enter the market before starting to ship. Second, at the end of the market decline, in order to create panic, the main force guides retail investors to sell while they themselves absorb chips. 2. The main player switches his chips from left to right and eats up his own orders. This will create a large trading volume, but the banker will not lose much in cost. The purpose of doing this is to create an illusion and make everyone feel that the market is very active. .
2. The main player switches his chips from left to right and eats up his own orders. This will create a large trading volume, but the banker will not lose much in cost. The purpose of doing this is to create an illusion and make everyone feel that the market is very active. .
Land volume:
It represents a pattern in which trading volume shrinks to the extreme within a certain area. The amount of land appears more when the market is light.
Land volume is usually at the early stage of a bull market, so you can carefully observe and choose the right time to buy. Combined with market trends, land volume may not necessarily rise. It depends on trends, real-time, and market popularity. Sky Quantity and Earth Quantity, these two phenomena are relatively extreme, there are risks, but there are more opportunities.
3. Let’s share the relationship between trading volume and price.
Among the four major technical analysis elements of volume, price, time and space, price is the external manifestation of quantity, and the combination of volume and price reflects directionality. The relationship between volume and price is the basis of all technical analysis.
Volume: refers to the trading volume of a certain currency over a period of time.
Price: refers to the price of a certain currency.
The so-called volume-price relationship refers to the synchronization or divergence between trading volume and price. It can be roughly divided into four forms:
Volume and price are in the same direction:
That is, the currency price and trading volume change in the same direction. 1. The currency price rises and the trading volume increases: The synchronization of volume and price is a sign that the market continues to be optimistic; but it may also mean that there are large differences between the long and short sides.
2. The currency price fell and the trading volume became smaller: This shows that the seller is optimistic about the market outlook and is reluctant to sell, and there is still hope for a rebound.
Divergence between volume and price:
That is, the currency price and trading volume show opposite trends. 3. The currency price rises and the trading volume decreases: It means that the currency price rise is not supported by the trading volume, and the rise is weak. This upward trend is difficult to maintain; but it may also mean that the selling pressure is small and the bulls have the upper hand.
4. The currency price falls and the trading volume increases: This is a precursor to the market downturn, indicating that investors are selling out of the market for fear of disaster. There are big differences between the long and short sides.
Volume-price divergence can be divided into three types:
1. Trend direction: divided into upward divergence and downward divergence.
2. Regarding the relationship between volume and price: it is divided into positive deviations: price rises and volume shrinks. Negative divergence: price decreases and volume increases.
3. In terms of time zone; it is divided into single-day volume and price divergence and regional divergence.
Increase in volume and decrease in price:
A type of volume-price coordination in which currency prices fall when trading volume increases, falling on heavy volume. It means that the opinions of the bulls and the bears are greatly divided, and the bears have the upper hand.
Generally appears in the descending channel and the main shipping stage. A drop in volume is often a sign that the short side continues to exert its strength, resulting in the buying force of the long side not being as strong as the selling force of the short side. Therefore, there is a phenomenon of increasing volume and falling prices. There are more selling chips, which means that the selling is very heavy. This state has short-term risks. Very big.
The increase in the low-price area indicates that there are funds to take over, indicating that a bottom or rebound is expected to occur in the later period, so it is appropriate to pay attention. Sometimes if a trend reversal occurs in the early stages of a downtrend, then positions should be cleared decisively.
3. Volume shrinks and price rises (volume shrinks and price rises):
This is the phenomenon of volume-price divergence that we often see, which means that the currency price is on the high side and investors are not willing to follow up. Both bulls and bears agree on their expectations for a later rise.
It mostly appears at the end of a rising market, and occasionally appears during the rebound of a falling market. 1. In the continuous rising market, moderate volume reduction and price increase indicate that the main force has a high degree of control, and a large number of circulating chips are locked by the main force. But after all, shrinking volume and rising prices show a trend of divergence between volume and price. Therefore, if the trading volume increases again during the subsequent rise, it may mean that the main force is shipping at a high level. At this time, future transactions must be carried out. Observe quantitative changes.
2. Top divergence, the trading volume remains shrinking, and the currency price is stagnant at a high level, lacking market sentiment. At this time, you should pay attention to market risks to avoid being stuck at high levels; no matter which of the above situations occurs, it is not safe in the short term.
4. Volume shrinks and price falls (volume shrinks and price falls):
It is generally a washout form. It means that there is no disagreement between the bulls and the bears, and they are unanimously bearish, that is, there are very few takers.
Generally, there are two types of wash patterns: one is the short-term wash pattern in the ascending channel;
The second is the midline adjustment and washout in the downward channel. The shrinkage and decline in the falling market indicate that investors will no longer cover after shipments, and the price will continue to fall. Investors should mainly hold the currency and wait and see.
5. Volume parity and price increase:
Trading volume remains at the same level, and the currency price continues to rise. In the case of shrinkage, the currency price continues to rise, showing that the main force has strong ability to control the market.
6. Quantity parity and price fall:
A type of bottom divergence often results in a rapid decline in currency prices. Generally appears in the downward channel, the trading volume is no longer large, but the currency price is constantly falling, which means that the decline in currency price will no longer cause panic in the market and sell more chips.
8. Volume reduction and price reduction:
The trading volume shrank significantly, while the currency price did not fall or rise, remaining sideways. A signal to warn of shipments.
If the currency price is in an upward channel and the volume shrinks, it is often a wash. This is called a shrinking sideways wash. It is more powerful than shrinking and falling. If the currency price is at a high level and in an obvious shock channel, and the transactions gradually shrink, this is often the main shipping pattern. Once it falls below the box, it is the beginning of a plunge.
3. Use the volume-price relationship to express the cyclical cycles of sideways trading, fund-raising, rising, shipping, and falling respectively:
Volume is parity and price is parity (sideways shock) - volume is increasing and price is parity (market makers enter the market) - volume is increasing and price is rising (pull up) - volume is parity and price is rising (control market is pulling up) - volume is decreasing and price is rising (pull up is not expected) )--volume parity and price parity (pallet shipments)--volume reduction and price parity (completed shipment)--volume reduction and price fall (early decline)--volume parity and price fall (mid-term decline)--volume increase and price fall (not in the next issue) Expect)
1. Sideways shock at the bottom: accumulation stage
Volume is parity and price is parity (sideways shock)
The volume increases and the price remains flat (the market maker enters the market and accumulates funds to build a bottom). The transactions at the bottom are enlarged and the prices fluctuate back and forth to attract funds.
2. Rise: pull-up stage
The increase in volume and price (acquisition of funds, early stage of increase) steadily pushes up the price, and the trading volume gradually increases.
Volume parity rises (equal volume rise, mid-term rise), and funds are collected again during the rise.
The quantity is reduced and the price rises (locking up the position, pulling up but not yet). At this time, there are fewer floating chips, so there is no need to increase the amount of money to increase the price. At the same time, the action of pulling and shipping will also be carried out, and many retail investors will enter the market at a high position to take orders.
3. High sideways shock: shipment stage
Volume reduction and price leveling (completed shipments) during this period, the dealers shipped goods at high levels through shocks.
4. Fall: Suppress shipment stage
When the volume decreases and the price falls (the volume shrinks and the price falls, in the early stage of the decline), the market makers no longer protect the market and buy, and the price falls slowly and slightly.
Volume-parity price decline (equal volume decline, mid-term decline) due to the increased amplitude of the decline, and the panic market gradually cannot bear to cut off the market and leave the market, causing the volume to increase a little.
4. Practical application:
1. The price rises and the volume increases and the price falls and the volume shrinks: This is a normal phenomenon. If the volume and price cooperate, the market outlook will continue with the original trend.
2. The price reaches a new high, but the trading volume fails to break through: a potential reversal signal.
Example: The price rises with the increasing trading volume, breaks through the previous high point to form a new high, and continues to rise. However, the trading volume at this time is lower than the trading volume level in the previous area, so the rising trend will be difficult to sustain. At the same time, It is also a signal of potential trend reversal.
3. The price rebounded, but the trading volume shrank: a potential reversal signal.
Example: The price rises as the trading volume decreases. The price rises but the trading volume gradually shrinks. Trading volume is the driving force for rising prices, and insufficient driving force signals a potential reversal of the price trend.
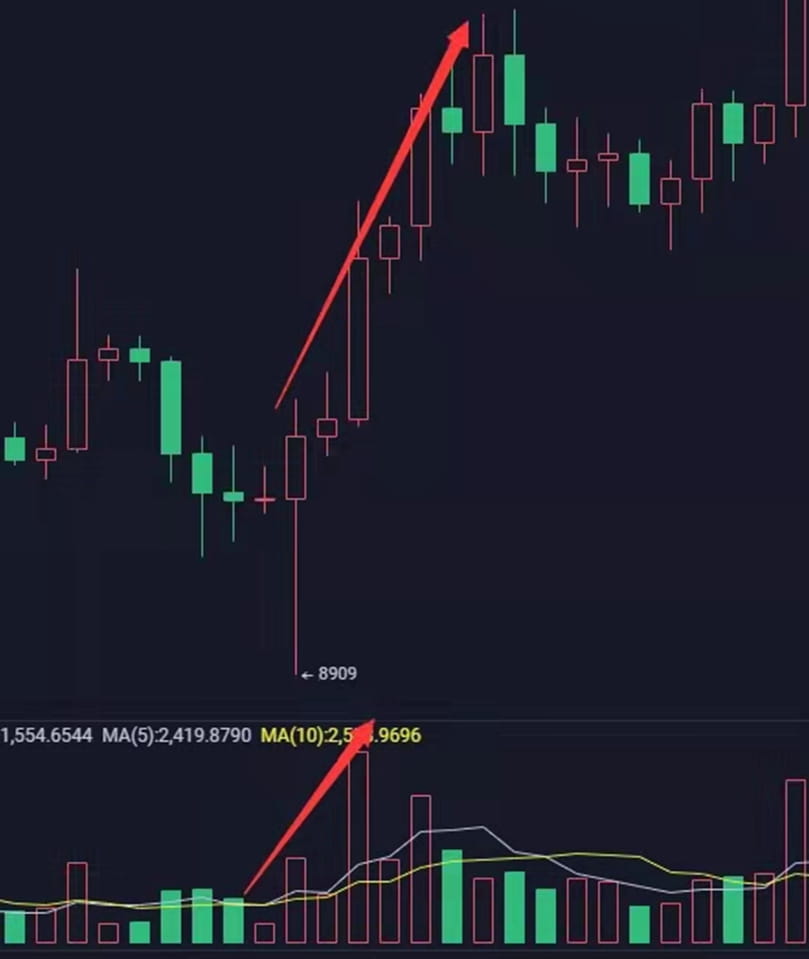
4. After the price rises and the volume increases, the volume suddenly increases sharply, and then shrinks and the volume plummets: a sign of reversal.
Example: After a period of incremental increase, the market suddenly rises vertically and the trading volume increases sharply. Following this trend, the trading volume shrinks sharply and the price drops sharply. This phenomenon indicates that the rising trend has ended. At the end of the period, the rise was weak and showed signs of reversal.
5. After a long-term decline, a panic-driven decline occurs: This is often the end of the short market.
For example: After a long-term downward trend, a large amount of panic selling occurs again, resulting in a heavy volume decline. At this time, a large amount of floating chips have been washed out, and there will not be a large amount of selling pressure in the future rise. Therefore, after large amounts of panic selling, there may be It means the end of the short market.
6. When the support level is broken downward with huge trading volume: a clear signal of decline.
7. The market is at a high level, but the volume is increasing but not rising: it is a sign of decline. High volume at low level but not falling: a sign of rising prices.
Example: When the market continues to rise for several months, there is a sharp increase in trading volume but the price is unable to rise and cannot rise sharply again. If the selling pressure is heavy at this time and the rise encounters strong resistance, it may be a precursor to a fall. After the stock price fell continuously, the trading volume increased in the low area, but the price did not fall further. There was only a small fluctuation, which may indicate an increase in buying and a possible rise in the later period.
8. The application of combination between quantity and price. "Compare price with the same quantity, compare quantity with the same price"
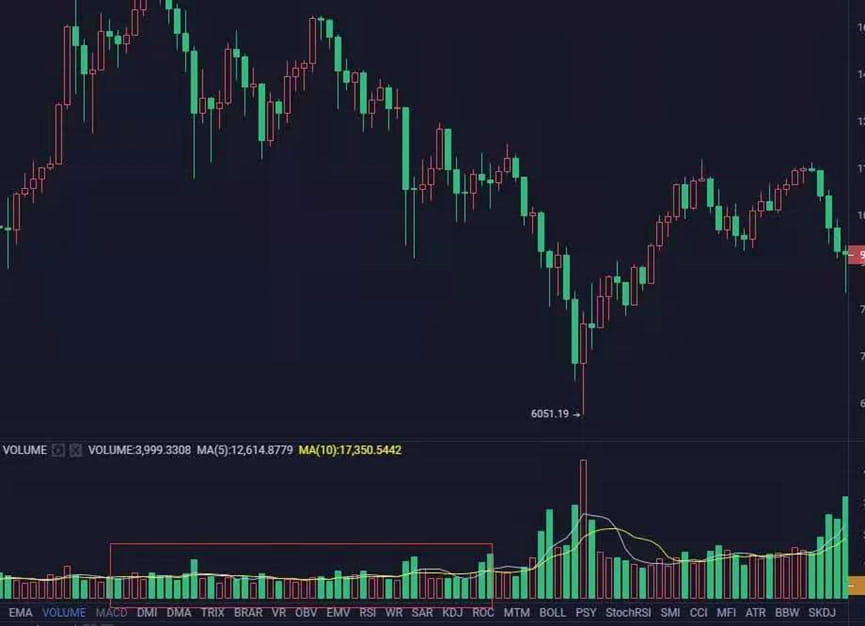
Price comparison for the same quantity:
As shown in the figure, each of the price platforms is basically in a shrinking state, but the price of each platform is higher than the other, but the trading volume is roughly the same, indicating that the concentration of chips for the continuous rise in currency prices is still stable, that is, the market makers on each platform There was no shipment, and then there was a sharp increase. This is the application of price comparison by volume. However, this logic does not hold true for those intermediate rising bands with particularly large amplitudes and particularly long running time spans.
5. There are three views on the relationship between trading volume and price in the market
1. Price is the first priority, and trading volume is secondary.
2. Trading volume leads price movement
3. Trading volume verifies price pattern
There is no right or wrong in these three views, they are just different perspectives. There is no strict distinction. In the currency market, some people will start from their own perspective, some people will start from the financial perspective, and some people will start from the news perspective, but after all, there is one thing, no matter any angle or factor, it will ultimately be reflected in the operating behavior superior. The operating behavior will definitely cause changes in the market or the price and indicators of a certain currency. So it can be said to be well-founded.
6. Precautions
1. When talking about an increase in trading volume, it usually refers to a continuous increase.
2. If the price breaks through an important pressure level and the trading volume is only temporarily enlarged, this situation is often a false breakthrough.
3. When the price falls, it does not necessarily require the cooperation of trading volume, and it is easy to occur without volume. If the price falls below the support level and there is heavy volume at the same time, the downward trend will be difficult to end in a short period of time, so do not buy the bottom prematurely.
4. Trading volume increases during a downward price trend, which often occurs when a rebound is about to end, so do not buy here. Buying at a high point carries greater risks.
5. If the price suddenly appears at the high level of an upward trend, and the trading volume is much higher than the trading volume in other periods of history, this is likely to be a stage high point, or even the top of a bull market.
7. What is the relationship between capital inflow and outflow and trading volume?
Many people have a wrong misunderstanding about inflow and outflow. Many people say that there is more capital outflow and less capital inflow. If the inflow is large, it will rise. This is wrong. The price will only be reflected when there are transactions in the market. The real market trading volume is equal! There are as many people buying as there are people selling.