
Introduce
There are a range of technical analysis (TA) tools and indicators that traders can use to try and predict future price action. These tools and indicators can include complete market analysis frameworks, such as the Wyckoff Method, Elliott Wave Theory or Dow Theory. They can also be indicators, like Moving Averages, Relative Strength Index (RSI), Stochastic RSI, Bollinger Bands, Ichimoku Clouds, Parabolic SAR or MACD.
The Fibonacci Retracement Tool is a popular indicator used by thousands of traders in the stock, forex and cryptocurrency markets. Interestingly, this tool is based on the Fibonacci sequence discovered more than 700 years ago.
This article will introduce the Fibonacci retracement tool and how to use it to find important levels on the chart.
What is Fibonacci Retracement?
Fibonacci retracement (or Fib retracement) is a tool used by technical analysts and traders to predict special price ranges on the chart. They do this by using the Fibonacci ratio as a percentage. The Fib retracement tool has its origins in a series of numbers identified by mathematician Leonardo Fibonacci in the 13th century. This series is called the Fibonacci sequence. Certain mathematical relationships between numbers in this series create ratios that are then graphed. These ratios are:
0%
23,6%
38,2%
61,8%
78,6%
100%
Although 50% is not technically a Fibonacci ratio, some traders still consider this ratio to have a certain significance, as it represents the midpoint of a price range. Additionally, Fibonacci ratios outside the 0-100% range can also be used, such as 161.8%, 261.8% or 423.6%.
We will learn about how traders use these percentages, but the important point is that the levels they plot can be correlated to significant levels in the market. When drawing price charts, Fibonacci levels can be used to identify special price zones, such as support zones, resistance zones, regression zones, entry points, exit targets, and stop loss levels.
How to calculate Fibonacci retracement levels
Since these percentages are the same in every Fibonacci retracement tool, you don't need to calculate anything manually. However, the way to get these percentages is to start with the Fibonacci numbers.
We will create a series of numbers starting with zero and one, then continue adding the sum of the previous two numbers to the current number. If we continue to add more and more, we will get a series of numbers called the Fibonacci sequence.
0, 1, 1, 2, 3, 5, 8, 13, 21, 34, 55, 89, 144, 233, 377, 610, 987, etc.Of course, these numbers don't directly plot the price chart. But the levels used in the Fibonacci retracement tool are all derived from these numbers in some way.
Except for the first few numbers, if you divide a number by the number that comes after it, you will always get a ratio close to 0.618. For example, if you divide 21 by 34, you will get a result of 0.6176. If you divide a number by the number two places after it, you will get a ratio close to 0.382. For example, if you divide 21 by 55, you will get a result of 0.3818. All ratios (except 50%) in the Fibonacci retracement tool are based on some calculations related to this method.
Fibonacci Sequence and Golden Ratio
As mentioned above, the Fibonacci sequence was identified by mathematician Leonardo Fibonacci in the 13th century. The Golden Ratio (0.618% or 1.618%) is a mathematical ratio derived from these numbers. But why is this ratio so important?
The Golden Ratio describes the proportions of a surprisingly long list of phenomena in the universe and can be found everywhere in nature. Think about atoms, stars, galaxy formation, seashells, even honeybees – everything from the smallest to the largest scales has this ratio.
Furthermore, this ratio has been used by artists, engineers and designers for centuries to create highly aesthetic works. From the pyramid to the Mona Lisa and the Twitter logo, many famous works of art and design use the Golden Ratio in some way. As it turns out, this ratio can also have a certain significance in the financial markets.
How to use the Fibonacci regression tool
So we know what the Fibonacci retracement tool is and how it works. Now let's see how to apply the tool to the financial markets.
Typically, the instrument is located between two important price levels, such as a low high and a low. This region is then used as a basis for further analysis. Typically, this tool is used to chart levels that are within a price range, but it can also provide insight into important price levels that are outside the range.
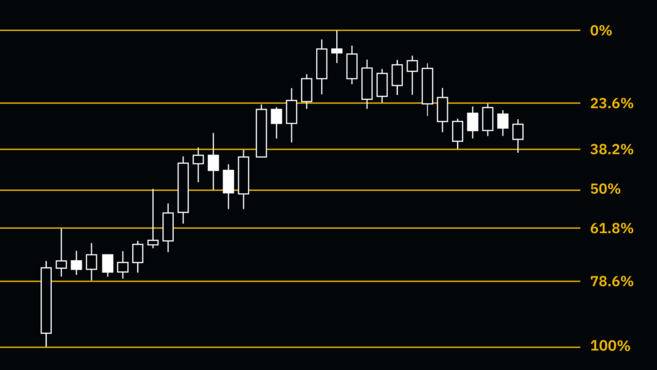
Usually, this zone is drawn according to the basic trend. So, in an uptrend, the lowest price will be 1 (or 100%), while the highest price will be 0 (0%). By drawing Fib retracement lines across an uptrend, traders can see potential, testable support levels in case the market begins to retrace – which is why it is called retracement. regulation.
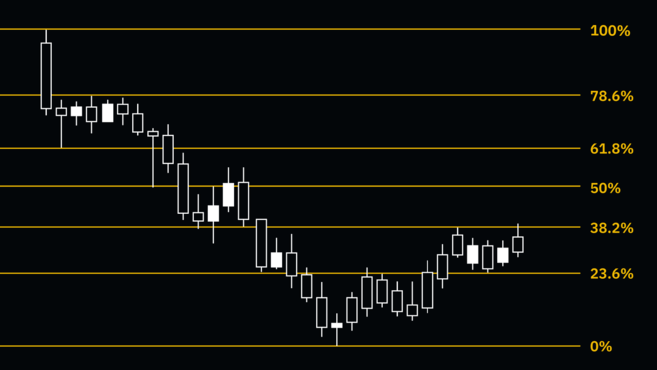
Conversely, in a downtrend, the lowest price will be 0 (0%), and the highest price will be 1 (100%). Note that the price is in a downtrend. So the regression mechanism, in this case, refers to the move from the bottom (bounce). In this case, the Fibonacci retracement tool can provide insight into potential resistance levels if the market begins to move up.
Want to get started with cryptocurrency? Buy Bitcoin on Binance today!
What do Fibonacci levels tell traders?
Traders can use Fibonacci levels to identify potential entry zones, price targets, or stop-loss points. This point can vary significantly depending on the individual's setup, strategy and trading style.
Some strategies involve taking profits in the area between two specific Fibonacci levels. For example, let's look at an uptrend followed by a regression. Buying at the 38.2% retracement, then selling at the 23.6% level could be an interesting strategy. Of course, this depends largely on personal strategy and many other technical factors.
Fibonacci levels are also often combined with Elliott Wave Theory to find correlations between wave structure and potential price zones. This can be an effective strategy for predicting the degree of regression in different waves of a particular market structure.
As with other techniques, the Fibonacci retracement tool is most effective when used in combination with other technical analysis indicators. A signal that may not be a buy or sell signal can turn into one if recognized by other indicators. Therefore, if the price hits a particular Fibonacci level, it may or may not reverse. Therefore, it is important that you manage your risk, while considering market conditions and other factors.
Fibonacci extension levels
As mentioned above, Fibonacci levels can be used to evaluate retracement or bounce zones (number 1 in the animation below). However, the Fibonacci sequence can also be used to evaluate potentially important levels outside the current price range. This is called the expansion level (see number 2).
Fibonacci extension levels can be considered as potential trading targets. Each trader can choose a different extension level as a target (or multiple targets). The first expansion levels are 138.6%, 150% and 161.8% – followed by 261.8% and 423.6%. Fibonacci extension levels can indicate areas where further price movements may end.
summary
Fibonacci sequences are found everywhere in nature and many traders believe they are relevant when charting financial markets.
However, like all other technical indicators, the relationship between price action, chart patterns and indicators is not based on any scientific principles or physical laws. Therefore, the usefulness of the Fibonacci retracement tool may be related to the number of market participants paying attention to it. So, even if not necessarily correlated to anything tangible, Fibonacci retracements can still be a tool to try and predict special price zones.