
Introduce
Without the right trading tools, you will not be able to perform technical analysis effectively. A sound trading strategy will help you avoid common mistakes, improve your risk management effectiveness, and enhance your ability to identify and take advantage of opportunities.
For many people, TradingView is a comprehensive charting platform. With a range of technical analysis tools, this powerful HTML5 web application is used by millions to track movements in the Forex, cryptocurrency and traditional stock markets.
TradingView has many useful features: it allows users to track assets across multiple trading platforms and publicize trading ideas in TradingView's social network. In this article, we will focus on the customization capabilities of this platform. We will use Pine Script, TradingView's own scripting language, which gives us detailed control over chart layout.
Let's get started!
What is Pine Script?
Pine Script is a scripting language that can be used to modify charts on TradingView. The platform already equips you with many features to do this, but Pine Script lets you go a step further. Whether you want to change the color of candles or backtest a new strategy, Pine Editor allows you to customize your charts in real time as you see fit.
The code itself is impeccably designed, so be sure to check out the manual for more information. Our goal in this guide is to discuss some of the basics and introduce indicators that can be useful when trading cryptocurrencies.
Establish
You can get started easily with Pine Script. Every code we write runs on TradingView's servers, so you can access the editor and develop your scripts from the browser – without downloads or additional configuration.
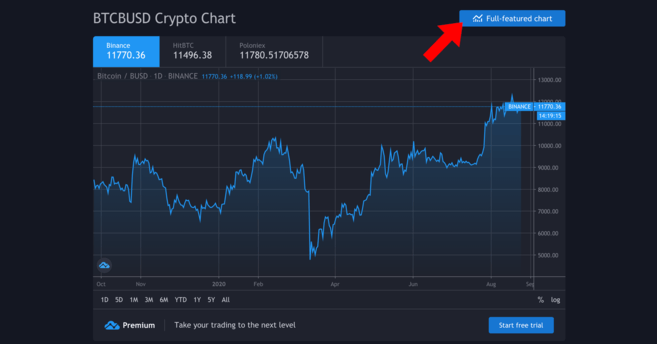
In this guide, we will chart the Bitcoin/Binance USD (BTCBUSD) currency pair. If you don't have one, create a free account (there's also a pro subscription, but not necessary for this tutorial).
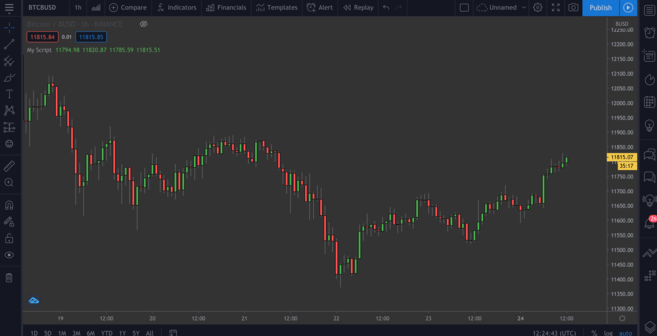
Click this link and you will see a chart like the one below:
Your chart may be newer than ours.
Here, we'll use the full-featured chart – click the button to access. This chart gives us much more detailed information, drawing tools, and options to draw trendlines, etc.
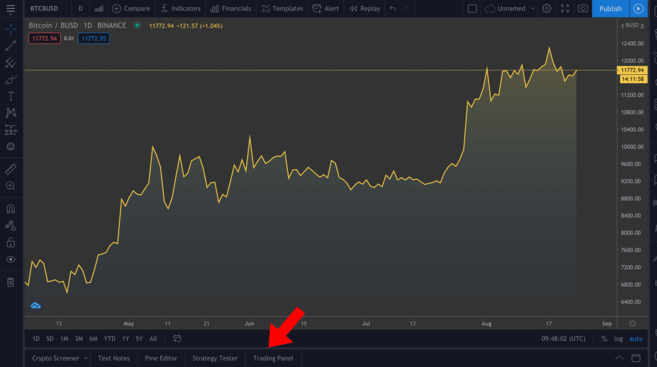
Full featured charts. You can adjust the time frame by clicking on the view above the highlighted tab.
We won't discuss how to use the tools available, but if you want to do serious technical analysis, you should learn about these tools. In the bottom left (shown in the image) you will see a few different tabs – click Pine Editor.
Pine Editor
This editor is really helpful. We'll state what we want to do, then click Add to chart to see our legend appear above. Please note that things can get messy if we include a lot of annotations at once, so we will remove the annotations in the examples (right click on the chart > Remove Indicators).
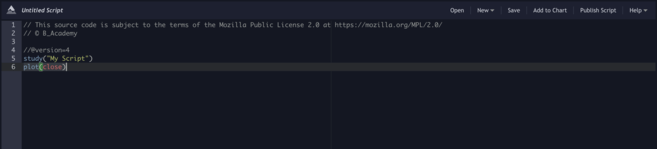
You can see we've got a few lines of code there. Click Add to Chart to see what happens.
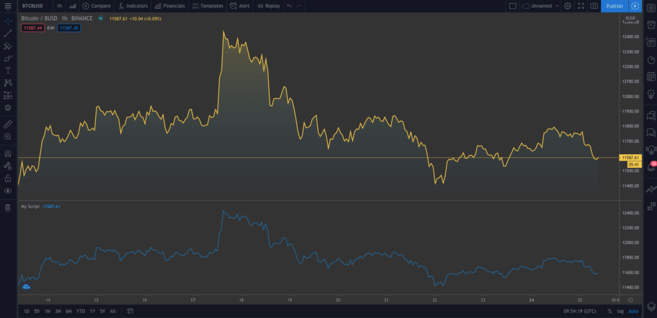
A second chart is added below the original. The new chart represents the same data. Hover over My Script and click the slash to delete. Now, we will dive into the code.
study("My Script")This first line is just creating a comment. This line only asks you to give the indicator the name you want (in this case "My Script"), but also has some (optional) parameters you can add. One of them is an overlay, which tells TradingView to place the indicator on the existing chart (instead of in a new segment). As you can see in the first example, the system default is false. Although we won't see the overlay visible now, overlay=true will add the indicator to the existing chart.
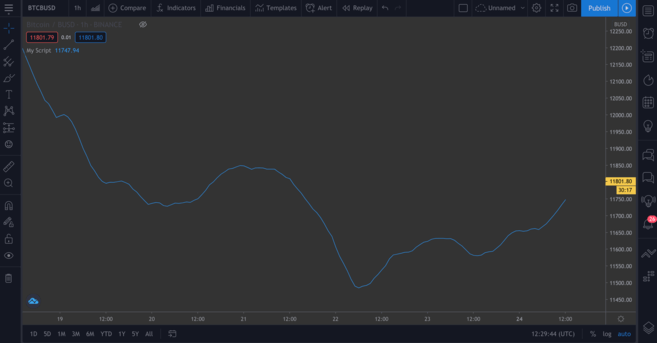
plot(close)This line is an indicator for drawing the closing price of Bitcoin. plot simply gives us a line chart, but we can also display candlestick and bar charts, as you'll see shortly.
Now, let's try the following line of code:
//@version=4 study("My Script", overlay=true) plot(open, color=color.purple)After adding this line of code, you will see a second chart (which looks like the original chart shifted to the right). Instead, all we did was plot the opening price, and since the current day's open price is the previous day's close, that means they have an identical shape.
Alright! Let's delete the existing annotations (remember, we do that by right-clicking and pressing Remove Indicators). Hover over Bitcoin/BUSD and click the Hide button to clear the current chart as well.
Many traders like candlestick charts because they provide more information than a simple chart like the one we just made. Next, we will add the following line of code.
//@version=4 study("My Script", overlay=true) plotcandle(open, high, low, close)The start is good, but the lack of color makes the chart a bit bland. Ideally, we should use red candles when the opening price is higher than the closing price in the given time frame and green candles if the closing price is higher than the opening price. We will add a line of code above the plotcandle() function:
//@version=4 study("My Script", overlay=true) colors = open >= close ? color.red : color.green plotcandle(open, high, low, close)This chart will look at every candlestick and check if the opening price is greater than or equal to the closing price. If so, it means the price has decreased during this period, so the candle will be colored red. If the opposite is true, the candle will be colored green. Modify the plotcandle() function to include this color rule:
//@version=4 study("My Script", overlay=true) colors = open >= close ? color.red : color.green plotcandle(open, high, low, close, color=colors)Delete the existing indicators if you haven't already and add the indicator to the chart. Now we will have a regular candlestick chart.
Great!
Drawing a moving average (MA)
We've got some baselines. Let's move on to our first custom indicator – the exponential moving average, or EMA. This is a valuable tool as it allows us to filter out any market noise and smooth out price action.
The EMA is slightly different from the simple moving average (SMA) in that the EMA focuses on the most recent data. EMAs tend to be more reactive to sudden fluctuations and are often used for short-term trading (e.g., day trading).
Simple moving average (SMA)
We can also plot the SMA, so we can compare the two later. Add this line of code to your script:
plot(sma(close, 10))This line of code plots the average of the previous ten days. Adjust the numbers in parentheses to see how the curve changes when considering different lengths.
SMA, based on the previous ten days.
Exponential moving average (EMA)
EMA will be a little more confusing, but don't worry. First, let's break down the formula:
EMA = (Closing price - previous day's EMA) * Multiplier - previous day's EMASo what does this formula tell us? Every day, we calculate a new moving average based on the previous day's moving average. The multiplier “weights” the most recent period and is calculated according to the following formula:
Multiplier = 2 / (Length of EMA + 1)For a simple moving average, we need to determine the length of the EMA. Syntactically, the EMA plot function is similar to the SMA plot function. We plot the EMA alongside the SMA so you can compare the two:
//@version=4 study("My Script", overlay=true) plot(sma(close, 10)) plot(ema(close,10))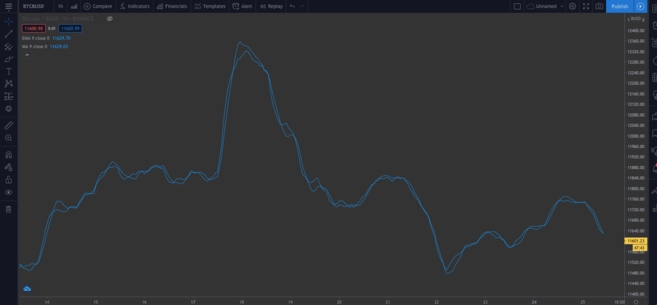
You can see slight differences in the two types of MA.
➠ Want to start your journey with cryptocurrency? Buy Bitcoin on Binance!
Preset script
So far, we've written the code manually so you can understand it clearly. But we'll cover another way to save you time, especially if you're writing more complex scripts and don't want to start from scratch.
In the upper right of the editor, click New. You will see a drop-down menu displaying all types of technical indicators. Click on Moving Average Exponential to view the open source code of the EMA indicator.
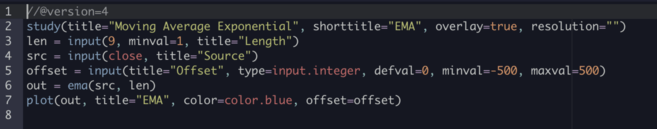
Go ahead and add this line of code to the chart.
This line of code is different from ours – you will notice the input() function. This is a useful function from a usability perspective because you can click this box…
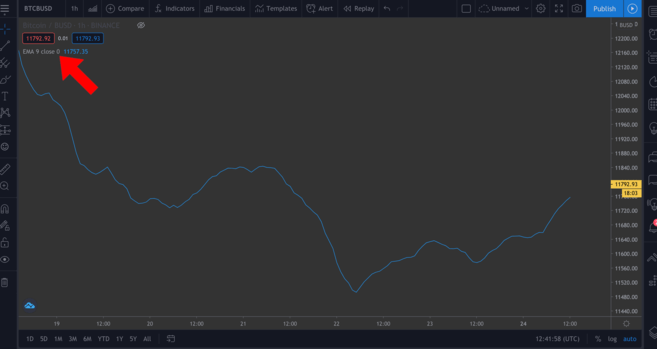
...and easily change some values in the pop-up window by clicking the Settings icon.
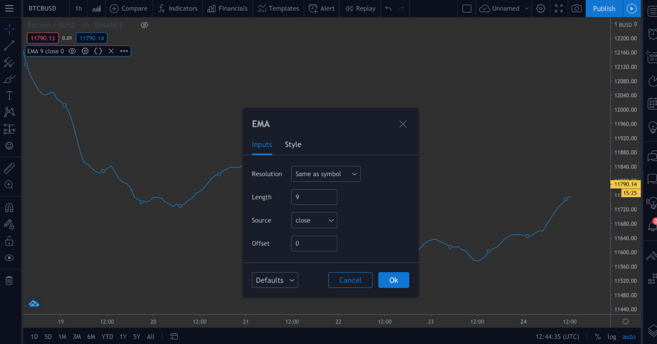
We'll add some input() functions in the next script to demonstrate this.
Drawing the Relative Strength Index (RSI) indicator
The relative strength index (RSI) is another essential indicator in technical analysis. Known as the momentum indicator, this indicator measures the rate at which assets are bought and sold. With a scale of 0 to 100, the RSI score tells investors whether an asset is overbought or oversold. Typically, an asset can be considered oversold if the score is less than or equal to 30 and considered overbought if the score is greater than or equal to 70.
If you go to New > RSI Strategy, you can see this. RSI is typically measured on a 14-hour period (i.e. 14 hours or 14 days), but you can feel free to adjust that setting to suit your strategy.
Add this indicator to the chart. You should see a few arrows displayed now (defined by the strategy.entry() function in the code). RsiLE indicates a potential opportunity to go long an asset when the asset may be oversold. RsiSE highlights points where you can short the asset when it is overbought. Please note that, as with all indicators, you cannot necessarily rely on these signals to be sure that the price will decrease/increase.
Review
There is a way for you to test custom indicators. While past performance does not guarantee future results, backtesting scripts can tell you how effective they are at gathering signals.
We will give an example of a simple script below. We will create a simple strategy to enter a long position when the BTC price falls below $11,000 and exit the position when the price exceeds $11,300. You can then see how profitable this strategy has been in the past.
//@version=4 strategy("ToDaMoon", overlay=true) enter = input(11000) exit = input(11300) price = close if (price <= enter) strategy.entry("BuyTheDip", strategy.long, comment="BuyTheDip") if (price >= exit) strategy.close_all(comment="SellTheNews")Here, we define entry and exit as variables – both are inputs, meaning we can change them on the chart later. We also set the variable price, which takes the closing price of each time period. Then we use some logic in the form of an if statement. If the part in brackets is true, then the indented block below will run. Otherwise, it will be ignored.
So, if the price is less than or equal to our desired entry price, the first expression will evaluate to true and we will open a long position. When the price equals or exceeds the desired exit price, the second block will be triggered, closing all open positions.
We will annotate the chart with arrows indicating entry/exit points, so we have specified the labels we will attach to these points using the comment parameter (in this example “BuyTheDip” and “SellTheNews ”). Copy the code and add it to the chart.
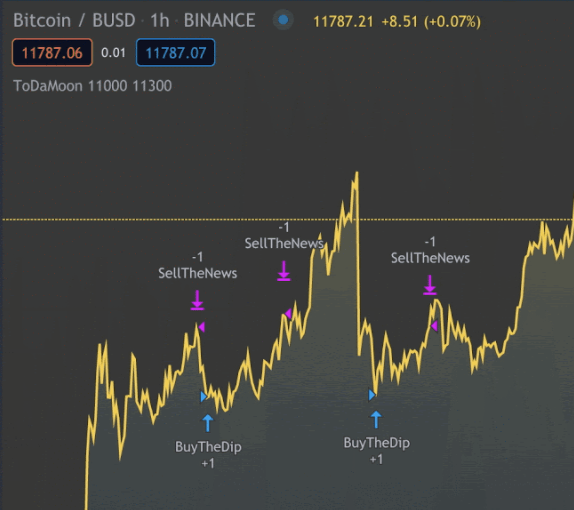
You can now see the indicators on the chart. You should shrink the chart.
TradingView will automatically apply rules to historical data. You will also notice TradingView moves from the Pine Editor to the Strategy Tester tab. This allows you to see an overview of your potential profits, your list of trades, and the performance of each trade.
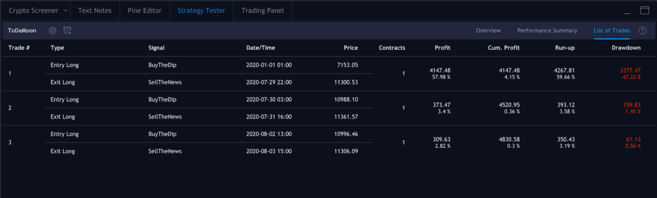
The positions we entered and exited.
Link
It's time to write your own script using some of the concepts from the beginning so far. We will combine the EMA and RSI and use their values to color the candles, providing insights that we can easily visualize.
This content should not be construed as financial advice – there is no objectively correct way to use this indicator. Like any other indicator, you should use this indicator with other tools to develop your own strategy.
Now we will work on the new script. Let's remove all indicators from the chart and hide the Bitcoin/BUSD chart too so we have a completely new framework.
Let's start by defining our research. You can name it whatever you want, just remember to set overlay=true.
study(title="Binance Academy Script", overlay=true)Remember our EMA formula from the previous section. We need to provide a multiplier with the length of the EMA. Make it an input that requires an integer (so, no decimal places). We will also set a minimum value, which can be (minval) and a default value (defval).
study(title="Binance Academy Script", overlay=true) emaLength = input(title="EMA Length", type=input.integer, defval=25, minval=0)Using this new variable, we can calculate the EMA value for each candle in the chart:
study(title="Binance Academy Script", overlay=true) emaLength = input(title="EMA Length", type=input.integer, defval=25, minval=0) emaVal = ema(close, emaLength)Great. Go to RSI. We will give the length to RSI in a similar way:
study(title="Binance Academy Script", overlay=true) emaLength = input(title="EMA Length", type=input.integer, defval=25, minval=0) emaVal = ema(close, emaLength) rsiLength = input(title="RSI Length", type=input.integer, defval=25, minval=0)Now we can calculate the value:
study(title="Binance Academy Script", overlay=true) emaLength = input(title="EMA Length", type=input.integer, defval=25, minval=0) emaVal = ema(close, emaLength) rsiLength = input(title="RSI Length", type=input.integer, defval=25, minval=0) rsiVal = rsi(close, rsiLength)In this stage, we will combine the logic of coloring the candles depending on the EMA and RSI values. Let's assume a situation when (a) the candle's closing price exceeds the EMA and (b) when the RSI is above 50.
Why? You may decide to use a combination of these indicators to know when to buy or sell Bitcoin. For example, you might think that meeting both of these conditions means it's the right time to enter a long position. Or conversely, you can use this indicator to know when not to short, even if other indicators say otherwise.
Therefore, the next line of code will look like this:
study(title="Binance Academy Script", overlay=true) emaLength = input(title="EMA Length", type=input.integer, defval=25, minval=0) emaVal = ema(close, emaLength) rsiLength = input(title="RSI Length", type=input.integer, defval=25, minval=0) rsiVal = rsi(close, rsiLength) colors = close > emaVal and rsiVal > 50 ? color.green : color.redIf we translate this line of code, it simply means that if the EMA value exceeds the closing price and the RSI score exceeds 50, the candle will be colored green. If the opposite is true, the candle will be colored red.
Next, draw the EMA:
study(title="Binance Academy Script", overlay=true) emaLength = input(title="EMA Length", type=input.integer, defval=25, minval=0) emaVal = ema(close, emaLength) rsiLength = input(title="RSI Length", type=input.integer, defval=25, minval=0) rsiVal = rsi(close, rsiLength) colors = close > emaVal and rsiVal > 50 ? color.green : color.red plot(emaVal, "EMA")Finally, draw the candles, remember to include the color parameter:
study(title="Binance Academy Script", overlay=true) emaLength = input(title="EMA Length", type=input.integer, defval=25, minval=0) emaVal = ema(close, emaLength) rsiLength = input(title="RSI Length", type=input.integer, defval=25, minval=0) rsiVal = rsi(close, rsiLength) colors = close > emaVal and rsiVal > 50 ? color.green : color.red plot(emaVal, "EMA") plotcandle(open, high, low, close, color=colors)That's the script! Let's add this script to the chart to see what it will look like.
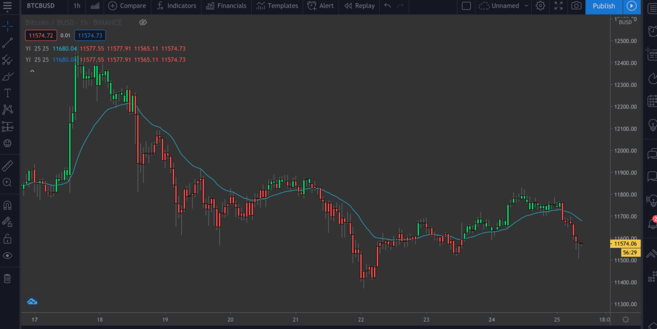
BTC/BUSD chart with EMA/RSI indicator.
summary
In this article, we showed you some basic examples of what you can do with the Pine Editor on TradingView. Now you can confidently create simple annotations for price charts to gain more insights from your own indicators.
We're only interested in a few indicators here, but you can easily create more complex indicators – by choosing a built-in script from the New section or writing one yourself.
Are you lacking ideas? The following articles may give you some ideas for your next project:
A Brief Guide to the Parabolic SAR Indicator
Instructions for using the Fibonacci Retracement Indicator
Explain Fast Indicator and Slow Indicator
MACD Indicator Explained