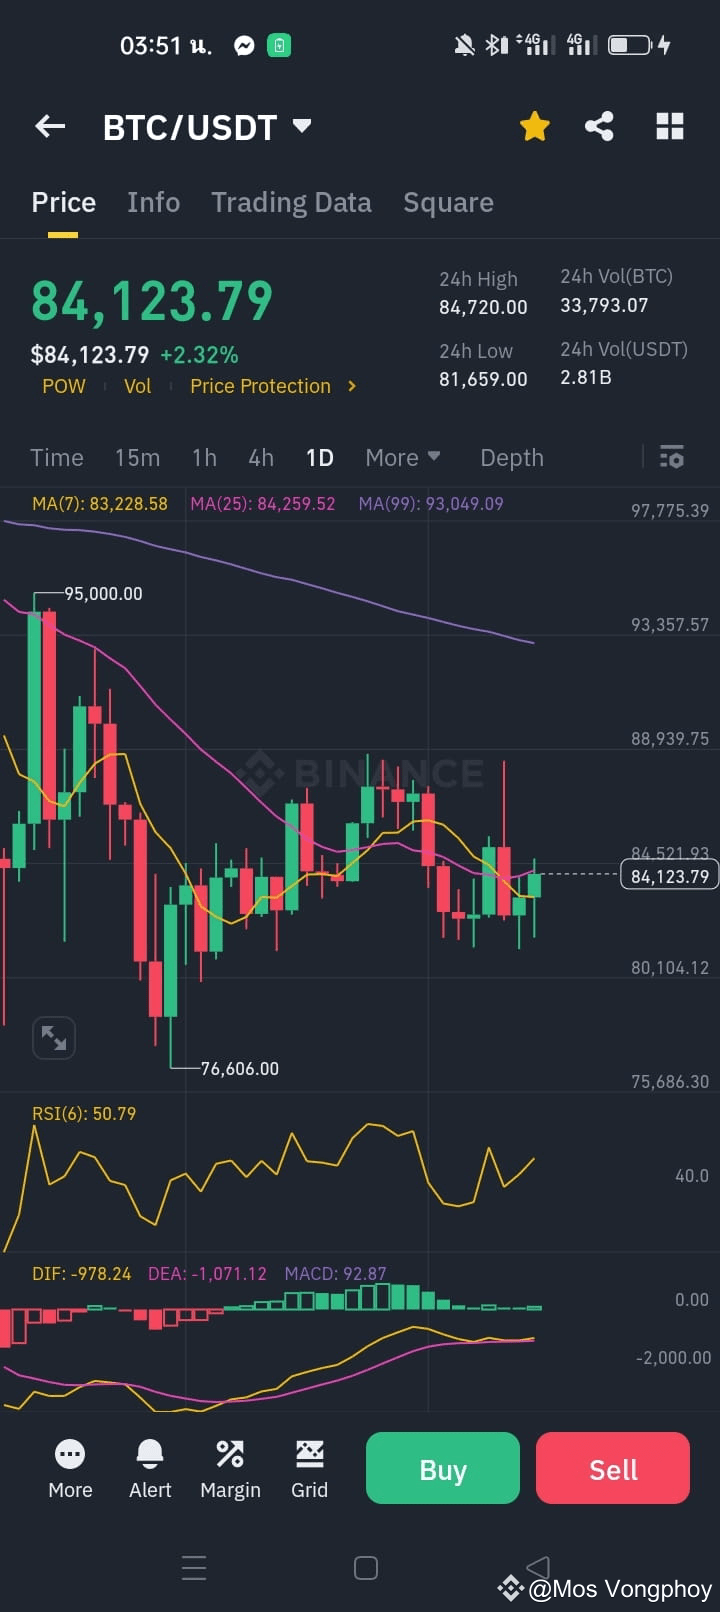
Based on the current chart for BTC/USDT, here’s an analysis to help you decide whether to BUY or SELL:
Key Observations:
1. Current Price: $84,123.79
24h High: $84,720
24h Low: $81,659
Price is near a short-term resistance level.
2. Moving Averages:
MA(7) (Short-Term): $83,228.58 (Price is above this, showing slight bullish momentum)
MA(25) (Mid-Term): $84,259.52 (Price is just below this, indicating resistance)
MA(99) (Long-Term): $93,049.09 (Far above current price, meaning the long-term trend is still bearish)
3. RSI (6): 50.79
RSI is neutral, meaning no clear overbought or oversold signal.
4. MACD Indicator:
MACD is slightly positive (92.87), showing that buying pressure is increasing, but still uncertain.
Decision Guide:
BUY if:
BTC breaks above $84,720 resistance with strong volume.
MACD continues upward and RSI moves above 60 (indicating strong bullish momentum).
BTC maintains price above MA(25) ($84,259) for confirmation.
SELL if:
BTC drops below $81,659, indicating a bearish breakdown.
RSI falls below 40 (showing increasing selling pressure).
MACD crosses downward, showing trend reversal to bearish.
Recommendation:
Short-term traders: Wait for BTC to confirm a breakout above $84,720 before buying.
Long-term investors: If BTC drops near $81,659 - $80,000, it might be a better buying opportunity.
If you already hold BTC: Consider taking partial profit if it struggles to break $84,720.
Key Observations:
1. Current Price: $84,123.79
24h High: $84,720
24h Low: $81,659
Price is near a short-term resistance level.
2. Moving Averages:
MA(7) (Short-Term): $83,228.58 (Price is above this, showing slight bullish momentum)
MA(25) (Mid-Term): $84,259.52 (Price is just below this, indicating resistance)
MA(99) (Long-Term): $93,049.09 (Far above current price, meaning the long-term trend is still bearish)
3. RSI (6): 50.79
RSI is neutral, meaning no clear overbought or oversold signal.
4. MACD Indicator:
MACD is slightly positive (92.87), showing that buying pressure is increasing, but still uncertain.
Decision Guide:
BUY if:
BTC breaks above $84,720 resistance with strong volume.
MACD continues upward and RSI moves above 60 (indicating strong bullish momentum).
BTC maintains price above MA(25) ($84,259) for confirmation.
SELL if:
BTC drops below $81,659, indicating a bearish breakdown.
RSI falls below 40 (showing increasing selling pressure).
MACD crosses downward, showing trend reversal to bearish.
Recommendation:
Short-term traders: Wait for BTC to confirm a breakout above $84,720 before buying.
Long-term investors: If BTC drops near $81,659 - $80,000, it might be a better buying opportunity.
If you already hold BTC: Consider taking partial profit if it struggles to break $84,720.