

This series of articles does not have a fixed theme. It aims to use my own knowledge to respond to questions about technical analysis from my friends in the Square.
Previously, a friend left a message on my message asking about how to read the MA moving average. Regarding this technical indicator, I have some personal opinions, hoping to help you build your own trading system.
01丨MA moving average📈
In fact, the moving average is an indicator that almost every technical analysis trader or investor will use or basically master. Let me briefly explain the principle of the moving average: Take MA5 as an example. If it is placed on the daily chart, it is the average price calculation of five days (including today), and if it is placed on the hourly chart, it is the average price calculation of five hours (including this hour).
The principle is not complicated. It is just the average value. The period used is the average value of the previous period. The price of each K-line is deduced forward to calculate the average price and arrange them into an average line.
Many people use moving averages as support or resistance levels, but I personally never use it that way. If you often pay attention to the market analysis sheets I post on the Square, you can see that I almost only use one moving average.
To me, the moving average is just a directional trajectory. It is not impossible to use it as a support line, but the use of different periods requires more detailed adjustments, which is far less convenient than the golden ratio ruler.
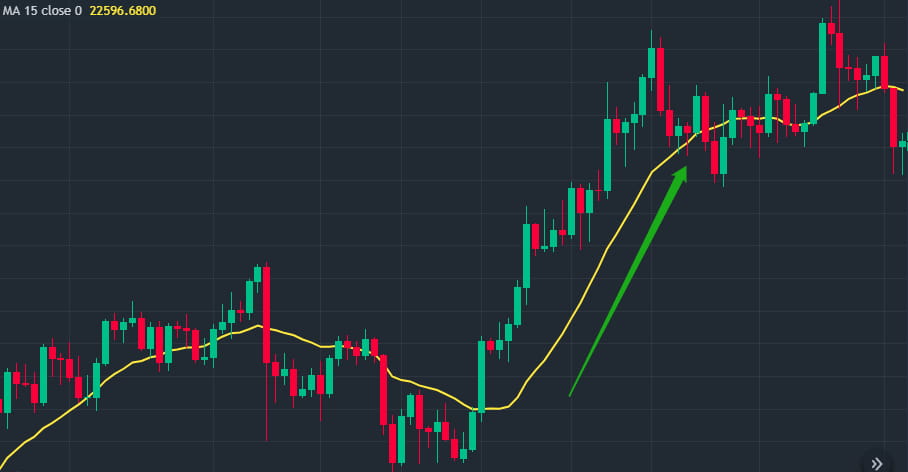
The above picture shows a short-term moving average Ma15 placed in the daily cycle chart, which reflects the average price line of 15 days. I often use it as a direction judgment. If there is no damage in this aspect, I will not make a counter-trend order. In addition, the setting values of different cycles are different.
If K-line is the indicator that best reflects market prices, then moving average is the indicator that best reflects trends. The average calculation of moving average makes the market prices arranged from disorder to order, which is much more convenient than drawing trend lines by yourself.
02丨Numerical setting⚖️
In addition, we should talk about the basic principles of setting the numbers behind MA: sensitivity and accuracy. The smaller the value, the higher the sensitivity, that is, the shorter the average value reflected, the more likely it is to be destroyed by short-term events; and the larger the value, the easier it is to represent a trend, and the larger the average value is, the less likely it is to be destroyed by short-term events.
Sensitivity and accuracy cannot exist simultaneously in one moving average indicator and can only be verified through the coordination of multiple indicators. This is why usually at least two or more moving averages are used at the same time.
03丨"Golden Cross" and "Dead Cross"✖️
Let’s also talk about the “golden fork” and “death fork” patterns of multiple moving averages (the same applies to the MACD indicator)
Generally, multiple moving average combinations are divided into short-term moving averages, medium-term moving averages, and long-term moving averages. I will not preset the values here in advance, but will help you understand the "golden cross" and "death cross" from the perspective of the long and short positions on the market;
When the short-term moving average crosses the medium-term or long-term moving average, the moving average pattern at this time is called a golden cross. Many people only know that they should go long when a golden cross appears and go short when a dead cross appears, but they don’t know the principles behind it.
When the short-term moving average crosses the medium-term moving average to form a golden cross, it means that the short-term bullish intention is stronger than the medium-term bullish intention. The strong bullish intention will drive the short-term market upward.
When the medium-term moving average crosses the long-term moving average to form a golden cross, it means that the medium-term bullish buying and selling intention is stronger than the long-term bullish players. At this time, the golden cross often means the turning point of the medium-term trend appears;
The same is true for the death cross, which means that the shorts are more willing than the longs. There are only two forces in the market: the longs and the shorts. The market will go in the direction of whichever side is stronger. If the two sides are evenly matched and fight back and forth, the market will tend to go sideways.

The essence behind the golden cross and death cross is the strength of the competition between the long and short sides. The above figure lists three simple short, medium and long-term moving averages, corresponding to MA6, MA15 and MA35. The circled areas are the golden cross patterns of the corresponding moving averages of different periods. They all represent the strong bullish intention in the short and medium term.
04丨The game between long and short ⚔️
Understanding this game between the long and short intentions actually covers the essence of technical analysis, including the entanglement theory, trend theory, wave theory and other theories, which are actually all about the game between the long and short intentions.
If you know how to play chess, it should be easier for you to understand what I mean by the intention of long and short positions: the side with the better strategy will capture more pieces, and the corresponding side is the sideways game range; but only by capturing the "general" or "king" in the end can we know the final victory or defeat, thus driving the trend. I don't know if you can understand the content of this article. This is the first time I write such a technical analysis article. If you can understand it, I will output it in this style in the future. If you don't understand it, thank you for your suggestions in the background or I will improve it if there is anything you don't understand.