
Contributor: Ye Wang@THUBA Research Core
Reviewed by: Yofu@DAOrayaki
Video link: https://www.bilibili.com/video/BV1k14y1c79j/?spm_id_from=333.999.0.0
Summary
Key Takeaway
Currently, most mainstream on-chain data analysis tools are in the transition stage from Web2 to Web3. In the future, data analysis services for DeFi must be rooted in the native data characteristics of Web3. In particular, data insight capabilities based on smart contract code logic will become the most important moat of on-chain data analysis platforms.
Currently, there are two differentiated development scenarios for data products: one is to focus on the construction of developer and user communities, mainly for developers and technicians, by incentivizing community contributions and encouraging users to independently publish data insights, thereby establishing a positive feedback loop for products, such as Dune. The other is based on the powerful analytical capabilities of its own products, mainly providing exclusive customized data insight services to professional institutional investors, such as Nansen and Glassnode. After establishing a mature developer community, through product iteration and community feedback, community-driven data tools can also produce relatively high-quality insights, so the combination of the two models will be the mainstream in the future.
From Web2 to Web3: Overview of on-chain data
As the name implies, on-chain data refers to "data recorded on the blockchain". Because the blockchain is an open, decentralized distributed ledger, all transactions stored and verified cannot be changed or deleted, and anyone can access it. Therefore, on-chain data has the characteristics of openness, transparency, immutability, and security. These characteristics mean that people can publicly view all transactions recorded on the blockchain and extract various raw data, including the number and time of tokens sent, wallet addresses, fees paid to miners, and on-chain transaction volume.
With the development of smart contracts, decentralized applications (Dapps) have overturned the architecture of traditional Web2 applications. The backend of Web2 applications has been replaced by smart contracts, and all data generated by smart contract interactions are published on the blockchain. Anyone can access it, so it becomes a public product, including asset information, transaction data, and contract code. In theory, as long as the blockchain block space is large enough, any data can be stored on the blockchain, and some projects are even trying to use the blockchain as a database to store data. The large-scale use of Dapps has greatly enriched the on-chain data, and all kinds of activity data that interact with the chain in the entire blockchain ecosystem are also included.
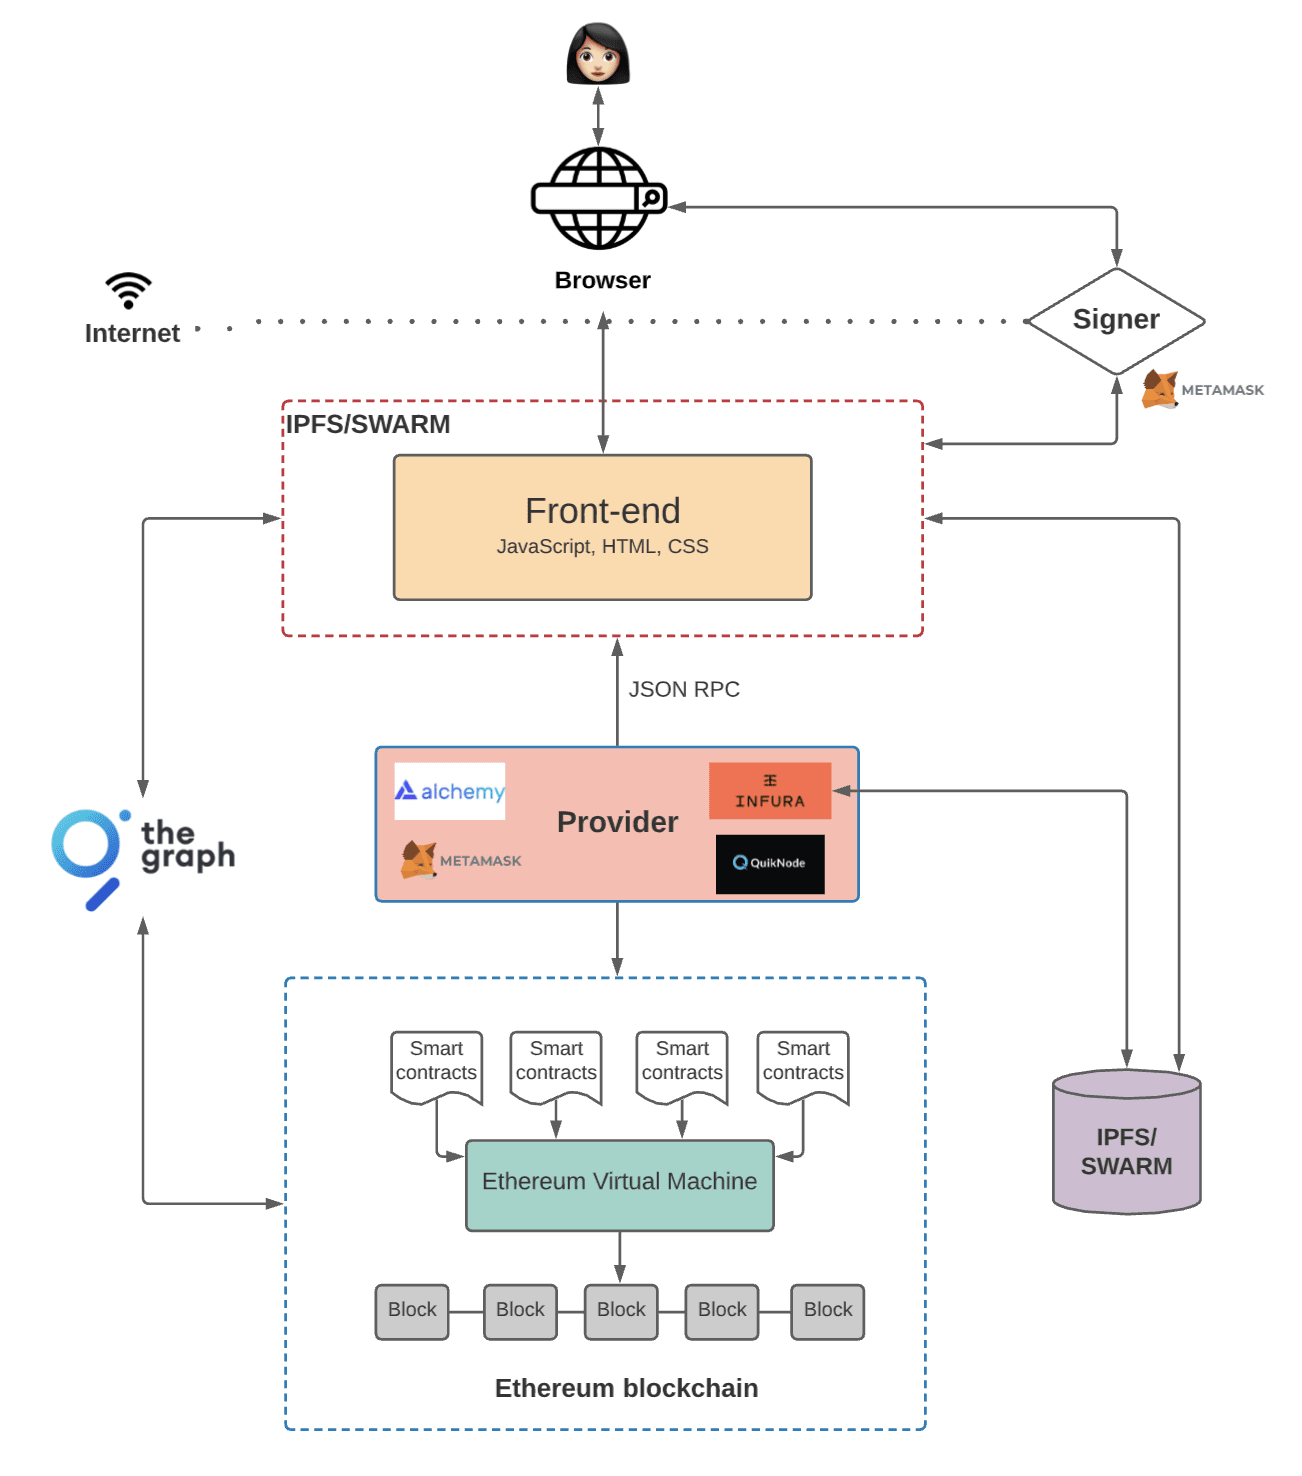
Web3 Application Architecture
Image source: Preethi Kasireddy, The Architecture of a Web 3.0 application
If we classify the on-chain data, it can be roughly divided into the following three categories:
Transaction data: data containing transaction information, such as transfer funds, sending and receiving addresses, handling fees, etc.; block data: block information data, such as timestamp, validator, included transactions and transaction order, etc.; contract code: code data generated by non-user interaction deployed on the blockchain, that is, pre-defined smart contract code.
*Notice:
The user assets and transaction data of centralized exchanges (CEX) are stored in their internal databases. Each transaction is only settled and recorded in its database, and the transaction data is not on the chain. Therefore, it is necessary to clarify that the transaction data of such CEX is not included in the on-chain data and cannot be queried through the blockchain browser. Data can only be written to the Ethereum blockchain - users can never update existing data.
Taking Ethereum as an example, we can query the information of any on-chain transaction on the blockchain browser Etherscan. The following is a transaction on block#15537394(transaction hash is 0x3af096859a880d9c33718eda59cb96e1504db7390d0e086c7260d91e87139eab), which is a PoS block after Ethereum Merge.
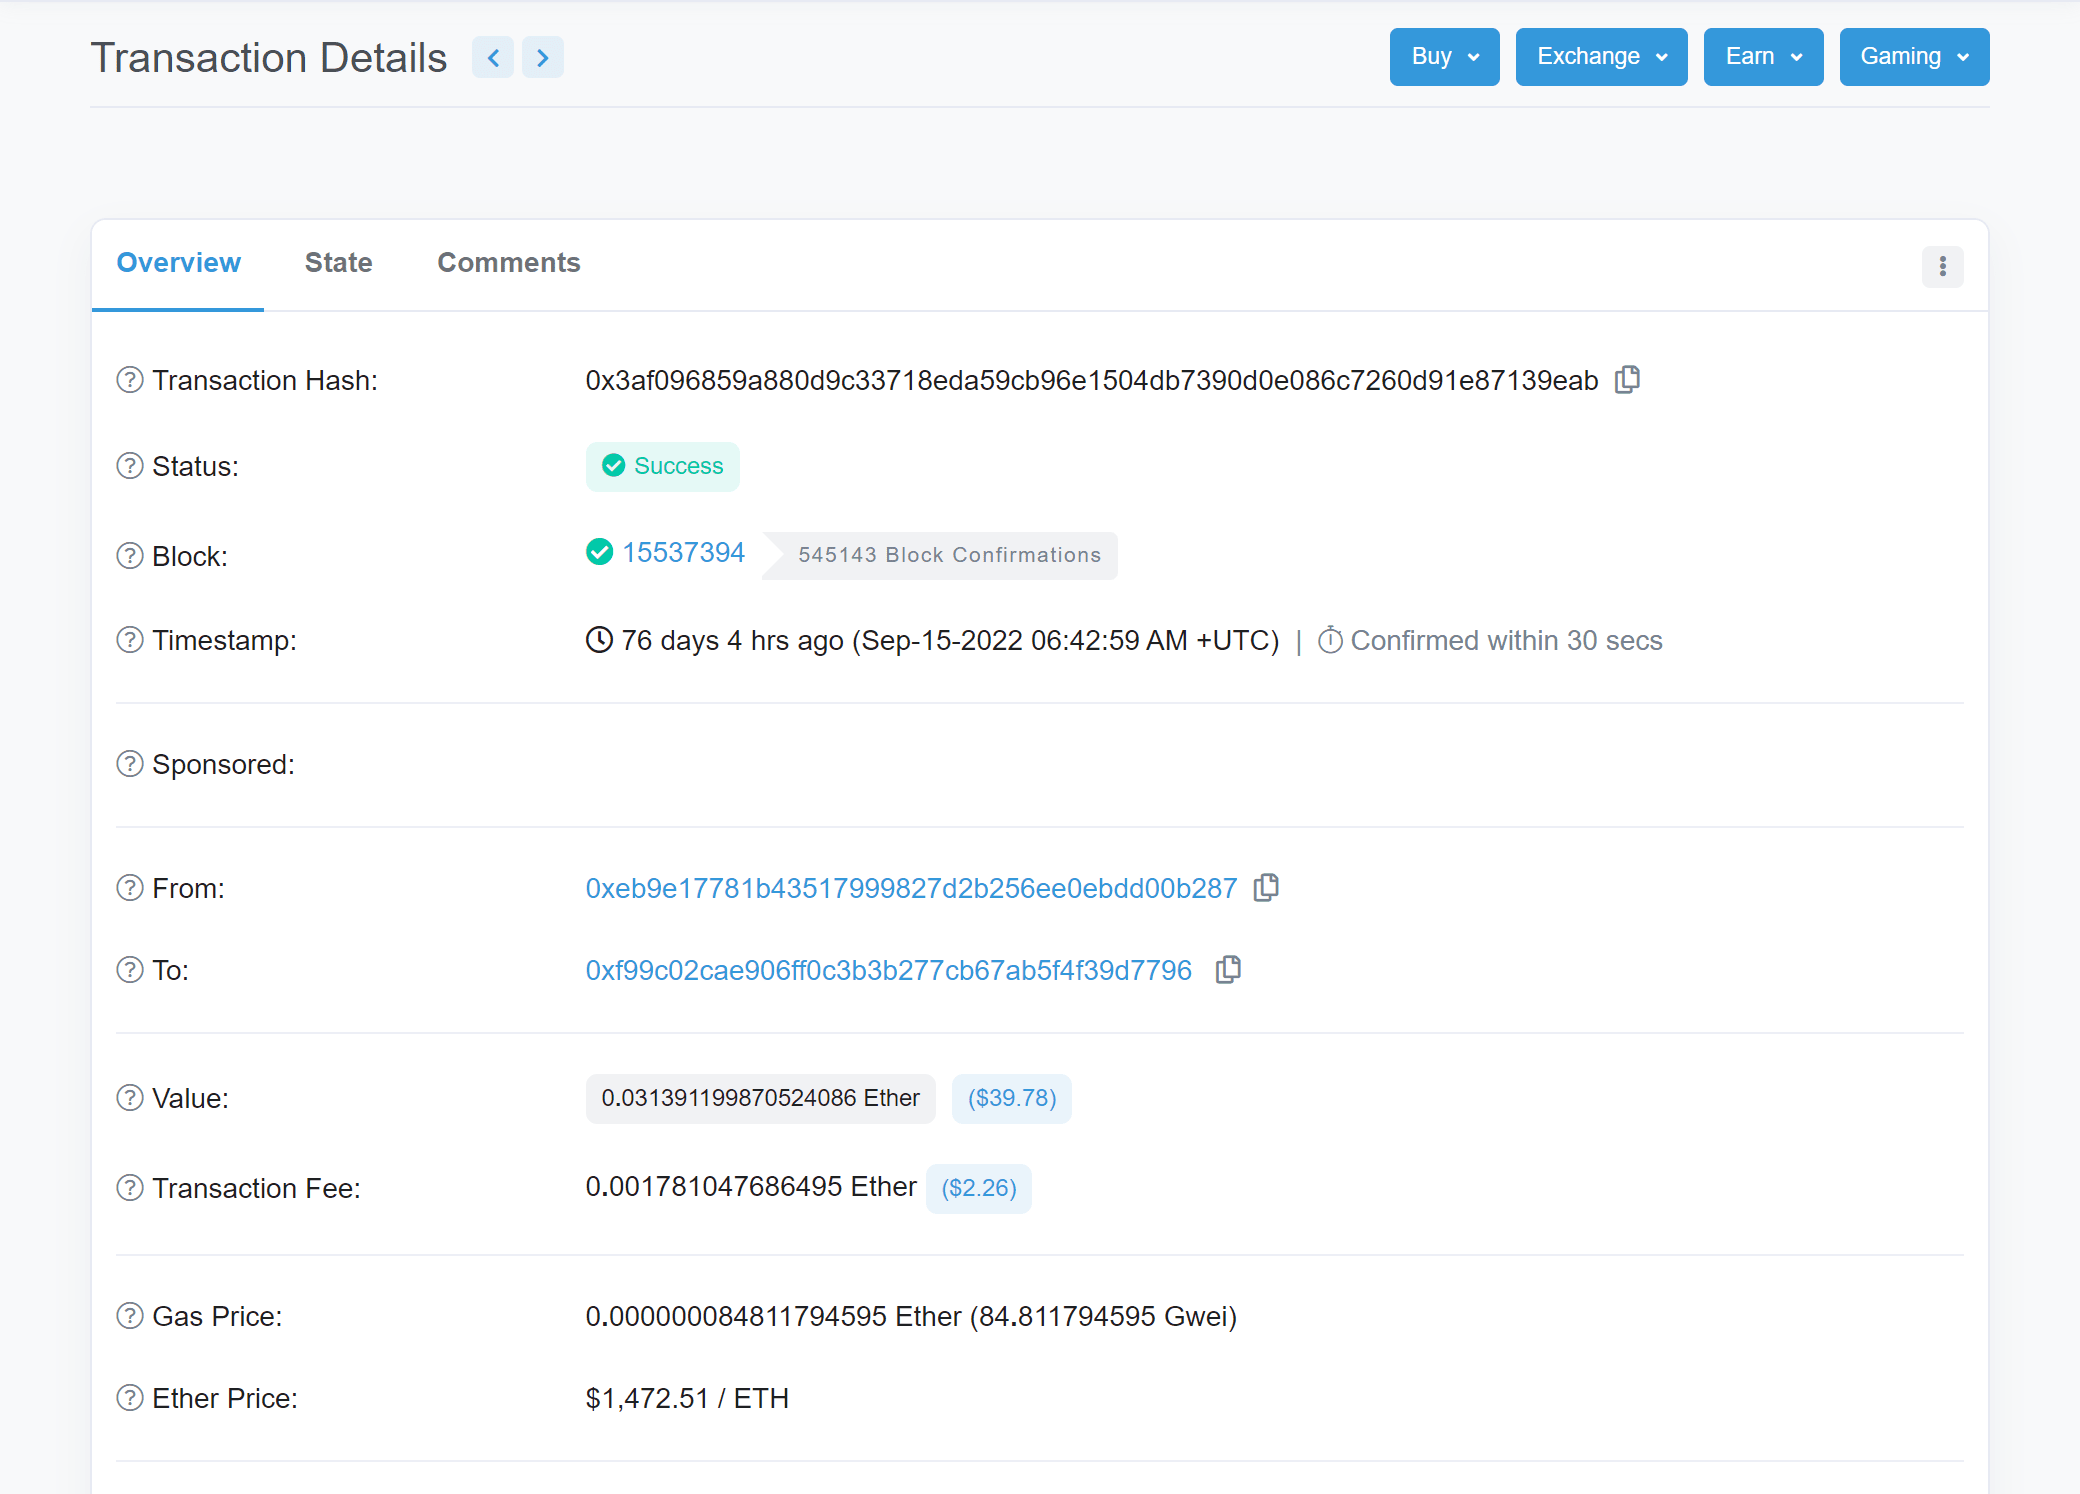
As you can see, the page contains information such as the transaction hash, transaction status, block, timestamp, sender and receiver addresses, the amount of ETH transferred in the transaction, transaction fees, gas fees, etc. This information is the basic composition of the on-chain data.
Track Analysis
Since market prices (especially the cryptocurrency market) are often easily manipulated, various types of market information play an important role in gaining insight into the market. As an on-chain infrastructure, on-chain data analysis can make up for this information gap. Traders can observe all activities occurring in the blockchain ecosystem, understand the flow of funds in the market, and evaluate which activities may predict market price changes and analyze the trend of the cryptocurrency market. For crypto investment, on-chain data is like the public financial and business data of companies in the traditional financial stock market. Investors can make reasonable valuations of different Web3 projects based on on-chain data and improve investment decisions.
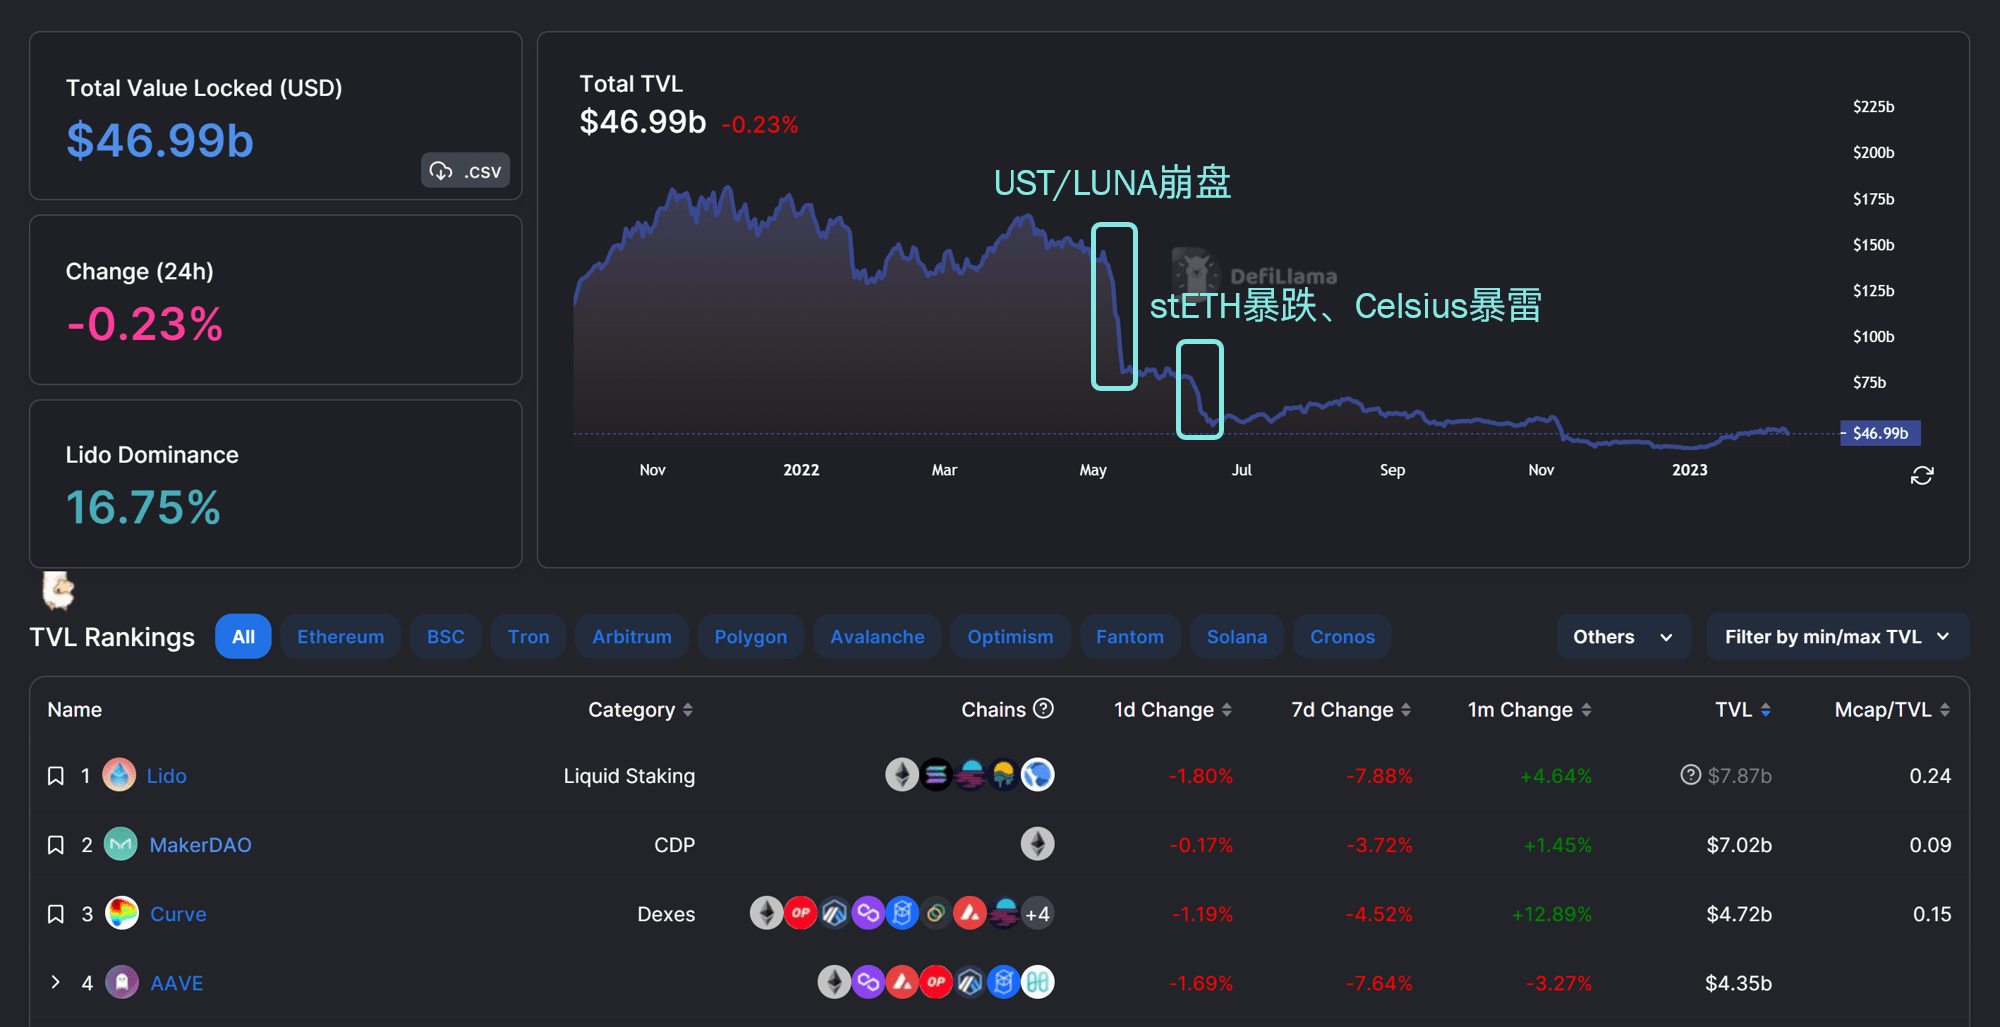
For example, investors can use Defilamma to check the TVL (Total Value Locked) of a DeFi protocol to determine the value of the protocol. TVL describes the total value of all tokens locked in the contract. If a user deposits $100 worth of cryptocurrency into a DeFi lending platform, the platform's TVL increases by $100. If multiple users deposit a total of $1 million, the platform's TVL will be $1 million.
TVL shows the liquidity and potential risks of the protocol, and therefore reflects its popularity and the degree of trust users have in the protocol. For example, since the Ethereum Shanghai upgrade in March will allow staked ETH to be withdrawn, many people believe that more users will be willing to stake their ETH. As the leading project in the Ethereum liquidity staking track, Lido has quickly become a darling of the market. Its TVL has continued to increase since the beginning of the year, surpassing Maker to become the DeFi protocol with the highest TVL.
In contrast, if a protocol’s current TVL is low and has a downward trend, it indicates that current user confidence in the protocol is insufficient, the project may have risk points, and its price may be overvalued.
As can be seen from the figure below, with the decoupling of UST and the collapse of LUNA in May 2022, the total TVL of the DeFi market has shrunk rapidly from about $140B to below $80B. In June, affected by the collapse of crypto lending giant Celsius, the plunge of stETH, and the bankruptcy of a series of crypto companies (such as Voyager and Three Arrows Capital), the total TVL dropped again to about $52B. The entire market has entered a bear market, and the total TVL of the DeFi market currently fluctuates between $40-50B.
On-chain data analysis market size
From the current data services, the overall chain data analysis products generally adopt a subscription model to make profits. TAM = number of customers * average consumption frequency in a period * average customer unit price
Currently, data analysis services can be divided into ToB and ToC. The data services provided can be roughly divided into data API, more granular/customized data tables, and data research reports. Although the on-chain data is open, transparent and can be accessed at will, it can only play its role after effective data analysis. Therefore, on-chain data analysis products have extremely high added value. Many on-chain data products are mainly aimed at professional users, and the average customer price is relatively high ($200/month or more).
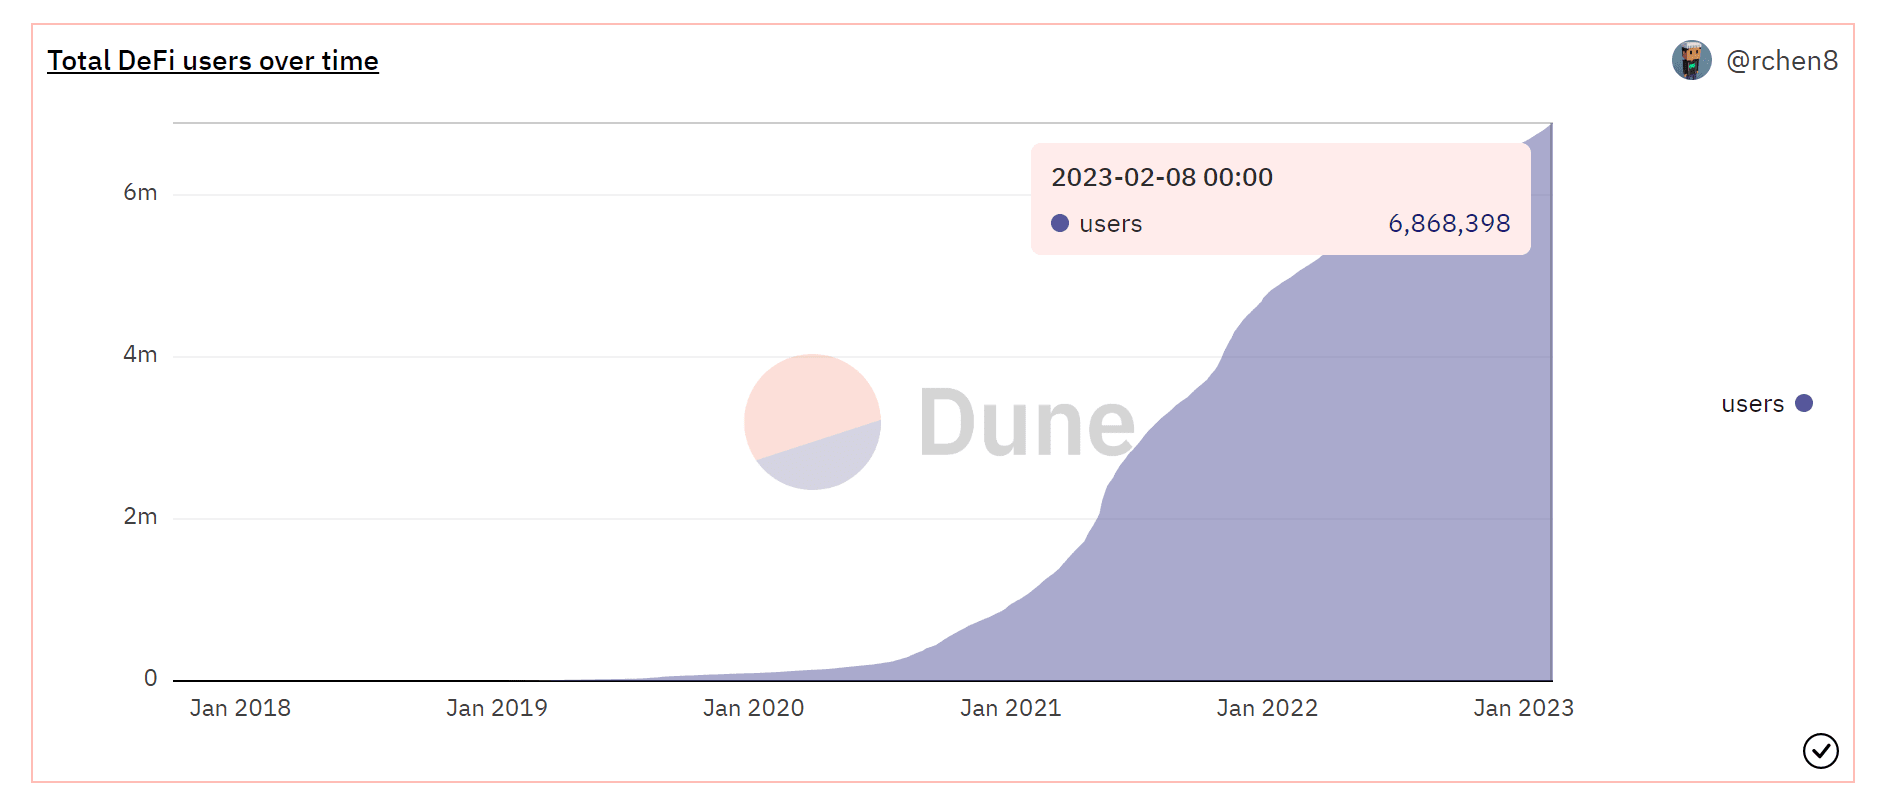
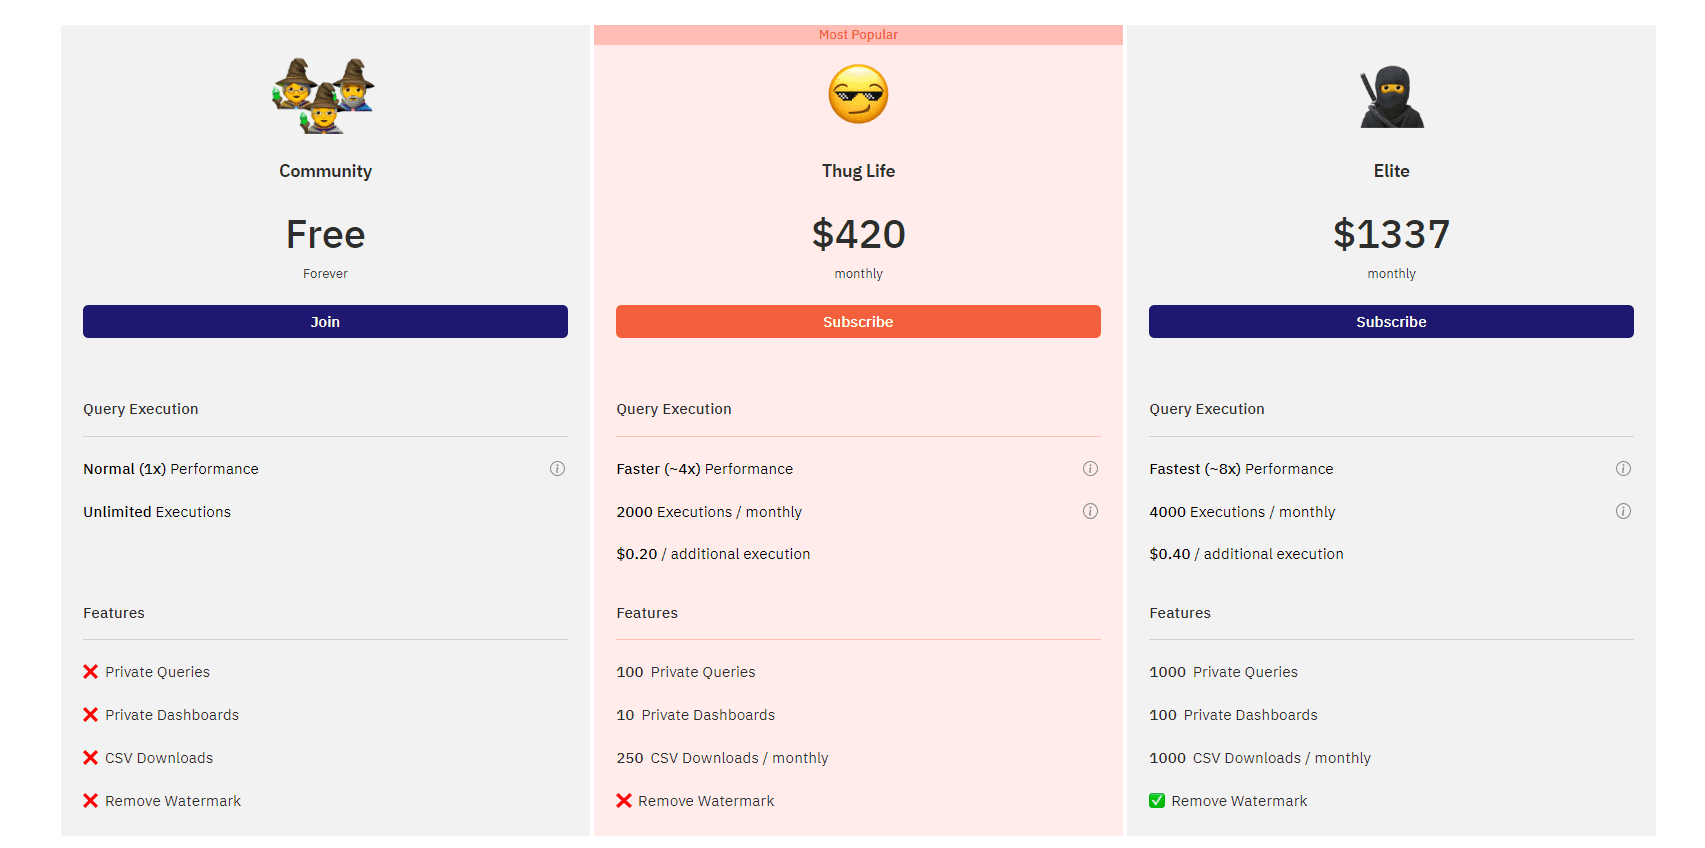
Currently, there are 6.868M unique addresses trading DeFi assets. If 10% of them are interested users, taking Dune’s monthly fee of $420 as an example, then TAM = 6.868M*10%*$420/month*12 months = $3.46 billion/year
However, in fact, due to the huge difference in the tiered price of each application subscription, which can even reach dozens of times, and the significant difference in the willingness and threshold of paying for data services between institutions and individual users, this article believes that relying solely on the TAM formula cannot accurately calculate the chain. Market size of data services. As a reference, you can compare the current global data market size and the valuation of data service giants:
According to data from Statista, the global big data and business analytics (BDA) market value will be approximately $274.3 billion in 2022. The market value of traditional financial data service provider Thomson Reuters is approximately $56.7 billion. Even business intelligence applications such as Tableau have a valuation of $15.7 billion. The benchmark on-chain data analysis platform unicorn Dune has only just reached a valuation of $1 billion.
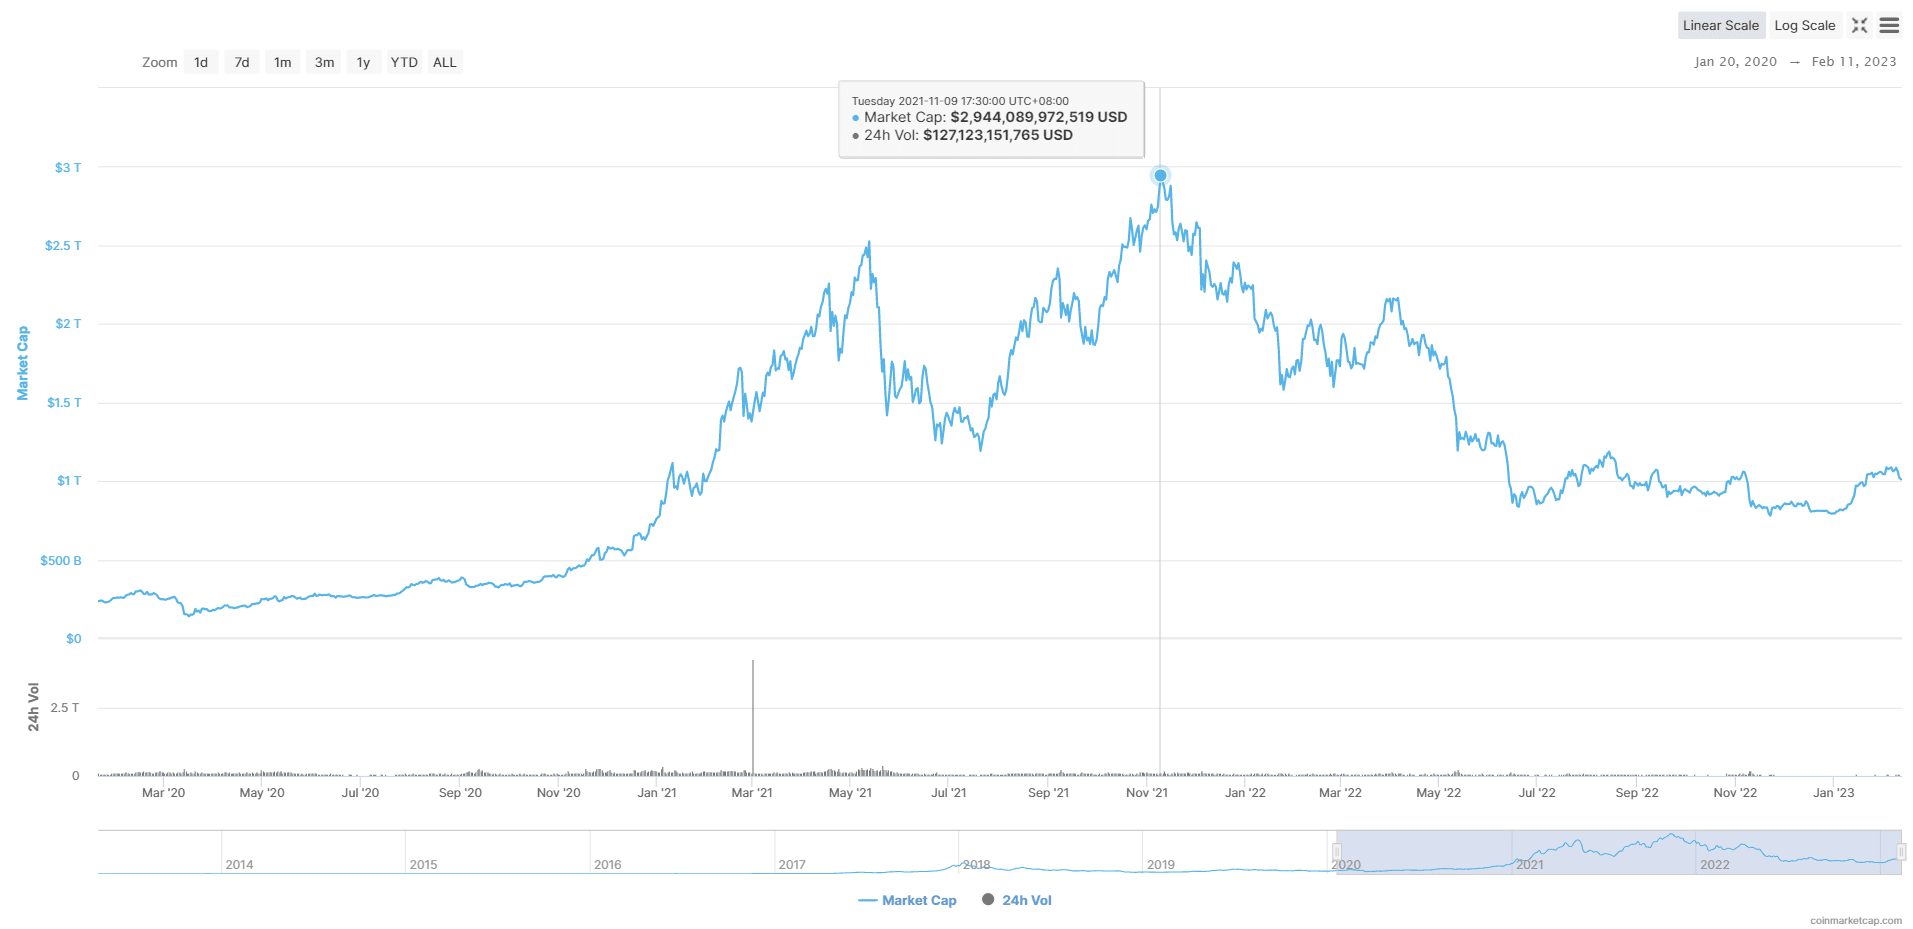
At present, the total market value of the crypto market has just rebounded to more than $1T, and the total TVL of the DeFi market is less than $50B. But during the bull market, the total market value was nearly $3T. In the DeFi field, Defillma data shows that the highest DeFi TVL reached $180B. According to a report released by Grand View, the compound annual growth rate (CAGR) of the global Web3.0 blockchain market size from 2022 to 2030 is 44.9%.
A report from Markets and Markets predicts that the global blockchain venture capital market will reach $67.4 billion by 2026. At present, with the recovery of market confidence, the valuation of the DeFi market will be restored, and on-chain data products still have broad application prospects. According to @0xwayne_z, the on-chain data market should currently be worth tens of billions.
Analysis of the on-chain data analysis product track
We can break down the on-chain data product track from the following three aspects.
From the perspective of the data stack, a complete on-chain data analysis process requires the following steps: data extraction (Extract) → cleaning and transformation (Transform) → loading (Load) into the data warehouse → analyzing data based on different business lines and observation indicators → outputting quantitative results. Blockchain data products can be divided into three categories: data sources, data development tools (Data Dev) and data applications (Data App), and the on-chain data analysis products we discuss in a general sense mainly include the latter two.
From the perspective of data processing mechanism, the data processing mode can be divided into web2-native or web3-native, that is, whether the product has transplanted and improved the processing logic of web2, or developed a unique methodology based on the characteristics of web3 activity data. This perspective mainly focuses on whether the data analysis product can find similar data processing logic in web2.
From the perspective of data application, the major Web3 tracks with relatively mature data analysis applications are DeFi, NFT, and GameFi tracks, because these tracks are large in scale, have a large demand for data-driven insights, and the amount and richness of on-chain interactive data generated are sufficient to support data mining and analysis. This article mainly focuses on on-chain data analysis applications in the DeFi field, including tracking and insight platforms for data in different dimensions such as markets, transactions, wallet addresses, asset portfolios, lending, and arbitrage.
According to @zk7hao's classification, there are already many players in the ecological niche of the on-chain data analysis track. Based on the different users, Dapp can be divided into products for consumers or for enterprises and professional users, while data development tools can be divided into products for the developer community and for enterprises. Based on different vertical fields, there are data products for specific analysis needs such as DEX, NFT, AML, DAO, etc.
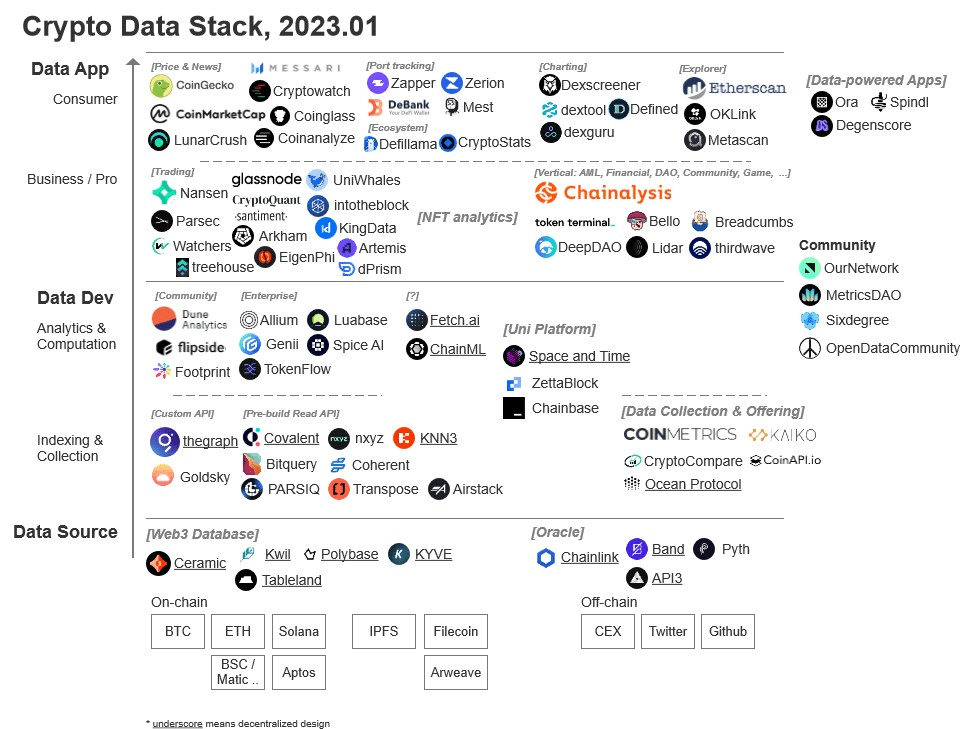
Crypto Data Stack Product Ecosystem Image Source: @zk7hao
DeFi data analysis product competition landscape
As the track with the greatest demand for data analysis at present, this article will focus on interpreting DeFi's data analysis products.
Y-axis - Data processing stage: data development to data insight X-axis - Data processing mechanism: web2 native to web3 native
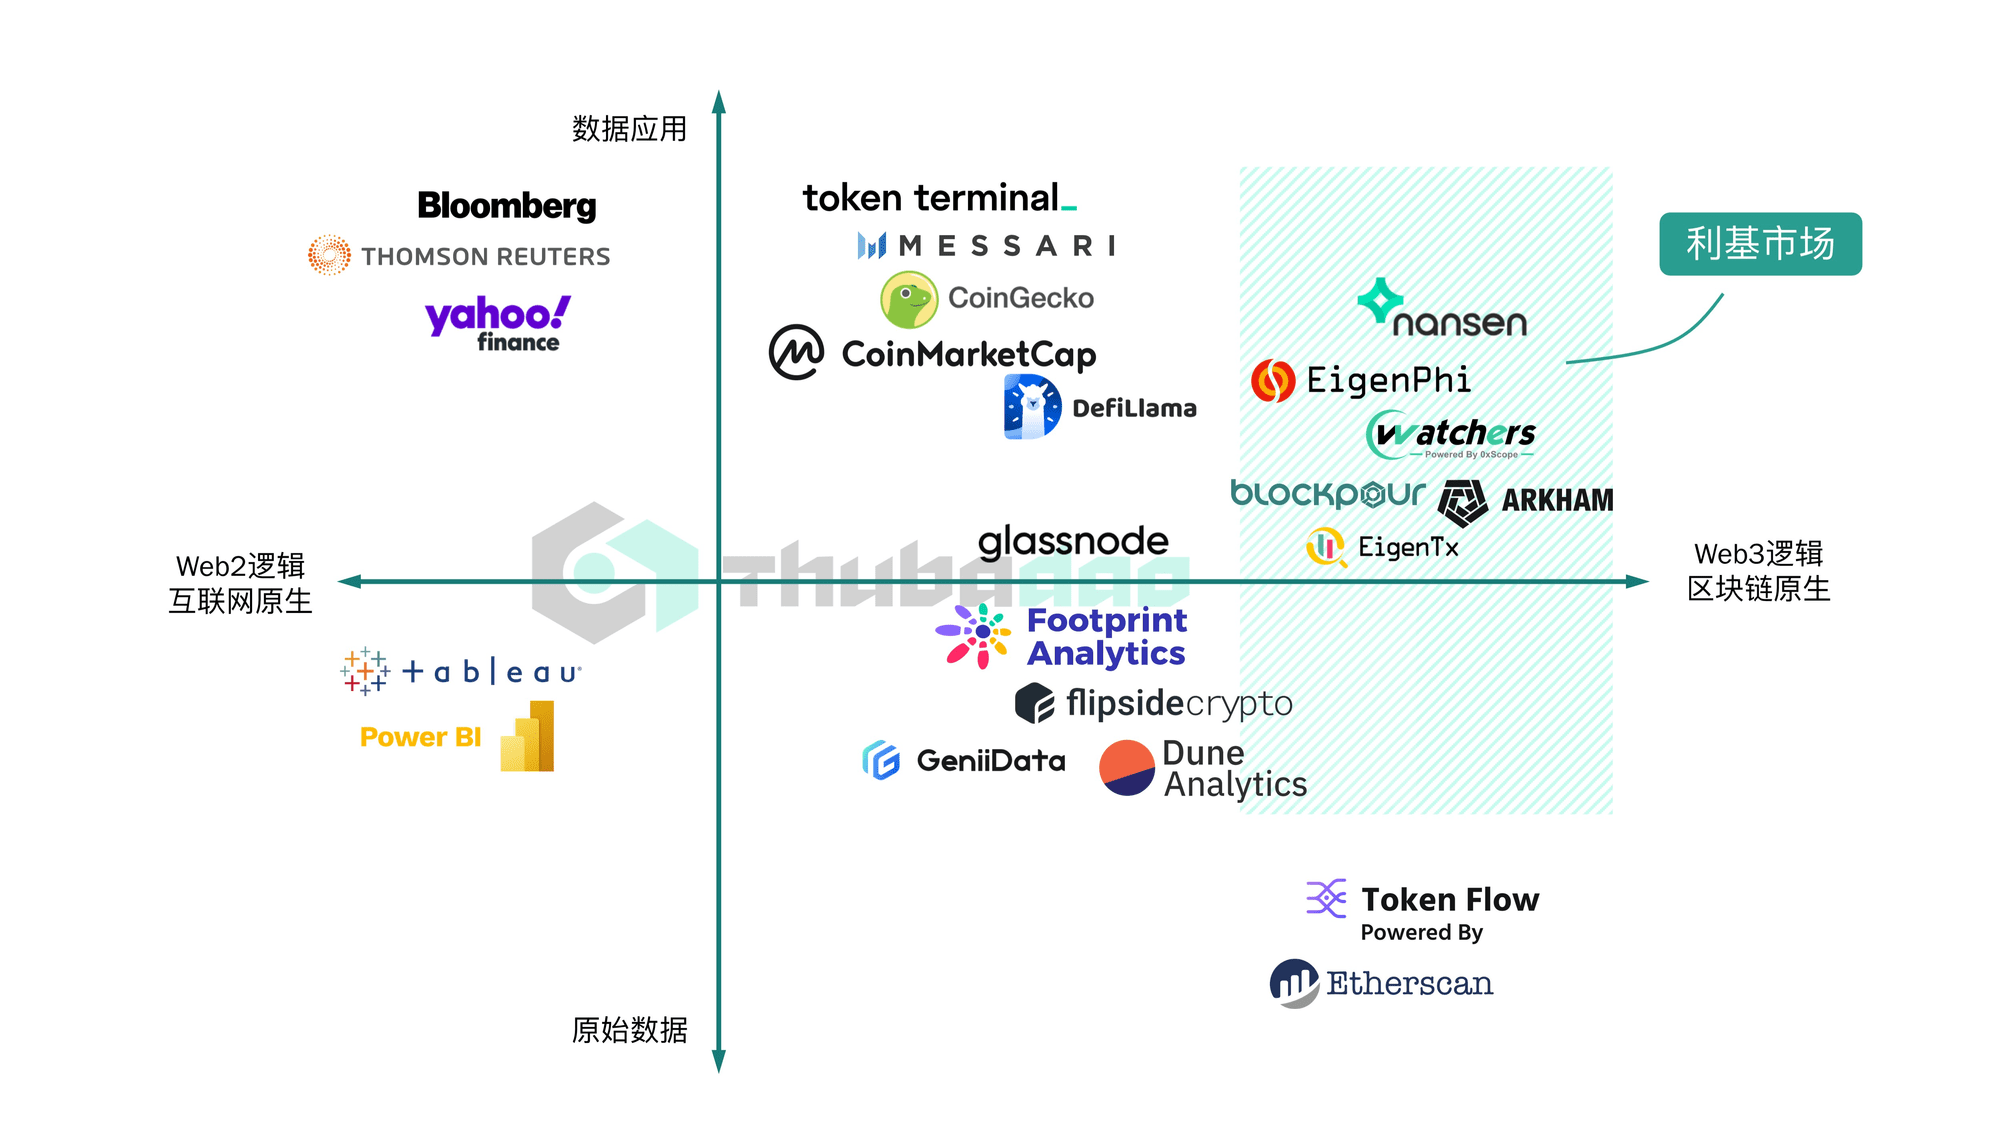
DeFi data analysis product competition landscape
Data analysis development tools are aimed at data analysis developers. They can complete ETL (Extract-Transform-Load) work, parse transaction, status and event log data into a format that can be queried by traditional languages such as SQL or GraphQL, and store it in the database for subsequent queries. It has a high degree of customization, but does not provide data analysis results. Head application: Dune Analytics.
Data analysis and insight tools are aimed at ordinary users, providing directly accessible data content for investors to refer to and make decisions. Results are generally provided in the form of data visualization dashboards, which are easy to read. The degree of free customization is low, and users can only read pre-analyzed data results, and it is difficult to customize the output according to their needs. Head application: Nansen
The on-chain data reproduction logic of Dune, Footprint, etc. is similar to that of MySQL and Tableau in the web2 world. CoinMarketCap and CoinGecko are also similar to the logic of data monitoring platforms in traditional financial markets. Therefore, their data processing logic tends to be web2 native.
Etherscan's scanning information of on-chain transactions and blocks, including sending and receiving addresses, contract logs, transaction order, validator information, etc., as well as Nansen, EigenPhi, 0xScope Watchers, etc., are all based on the interaction of on-chain contracts. This information is either centrally stored or missing in the traditional financial world, so we can assume that the data processing logic of the above product functions is biased towards web3 native.
List of typical on-chain data analysis tools
Data analysis development tools
Dune
——https://dune.com
[Core Function] Based on the PostgreSQL database, Dune stores ETH's on-chain data in a structured form in a relational database, allowing users to use SQL code for customized data analysis and generate their own customized data visualization dashboard for other users to view.
[Business Model] Subscription. As of June 21, 2022, Dune Analytics has accumulated query fees of over US$17 million.
Ordinary users: Free members: $420/month, users can create 2,000 4x high-performance queries, 100 private queries, 10 private dashboards, export 250 query results to CSV per month, and hide watermarks. Elite users: $1,337/month, based on ordinary members, the high-performance query speed is increased by 8 times and the number is increased to 4,000. In addition, users can create 1,000 private queries, 100 private dashboards, and export 1,000 query results to CSV per month.
Footprint
——https://www.footprint.network
[Core Function] Similar to Dune, Footprint allows users to customize their own data analysis charts. It also provides raw and processed data and chart tools for users to customize their own data analysis panels.
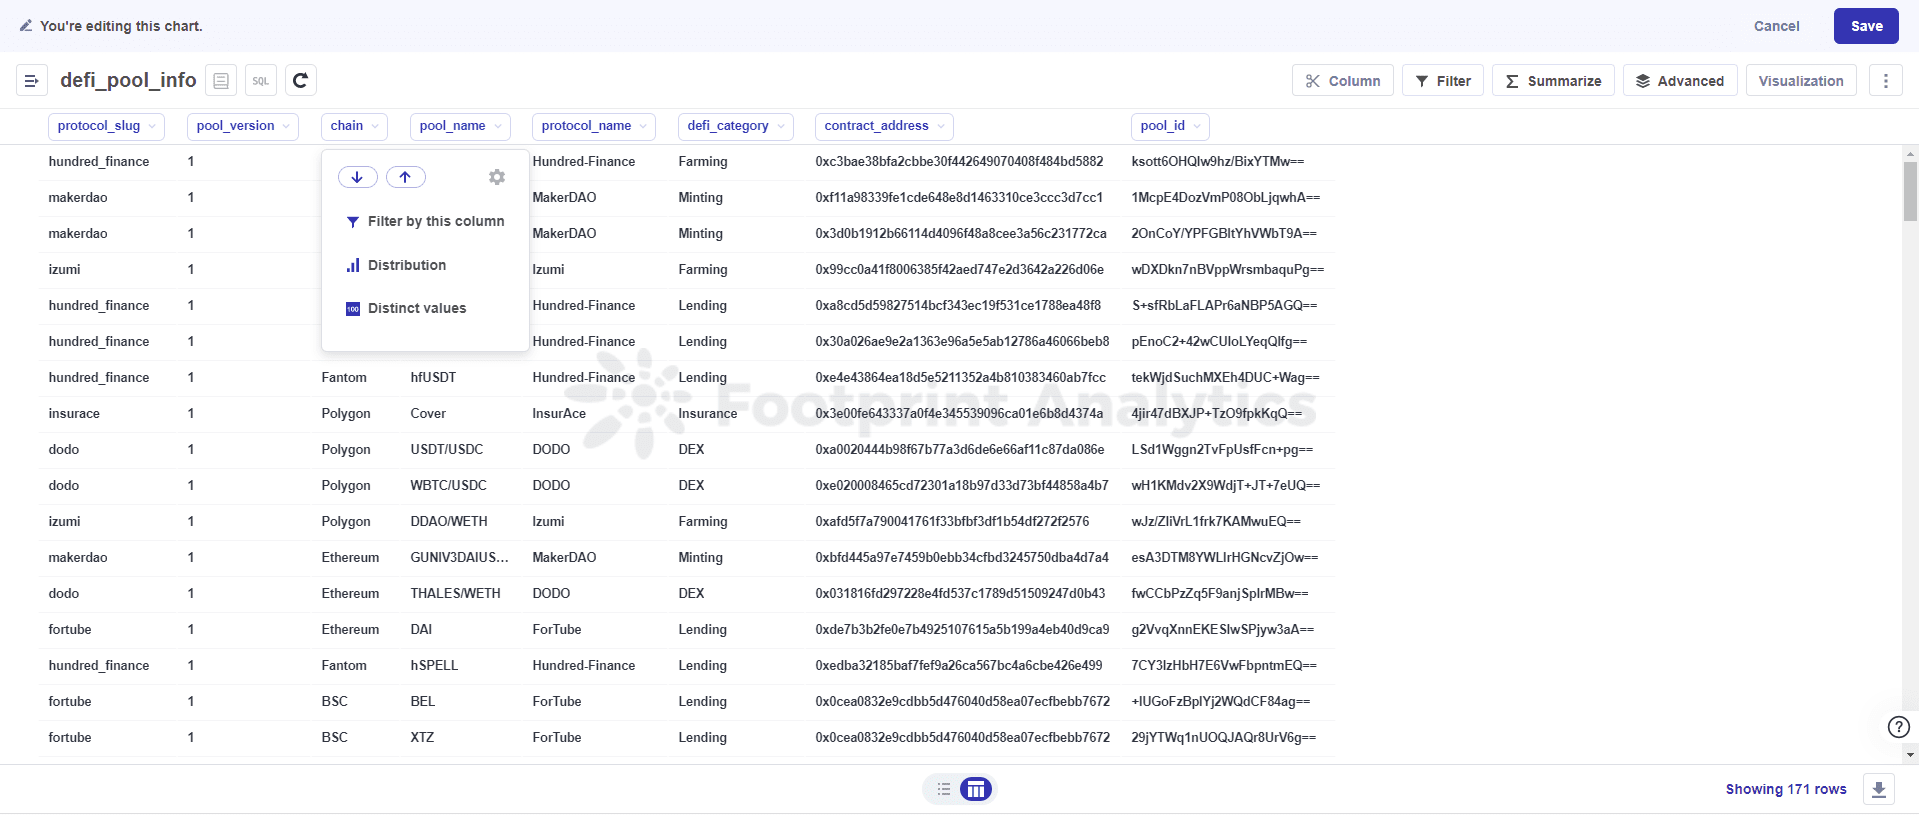
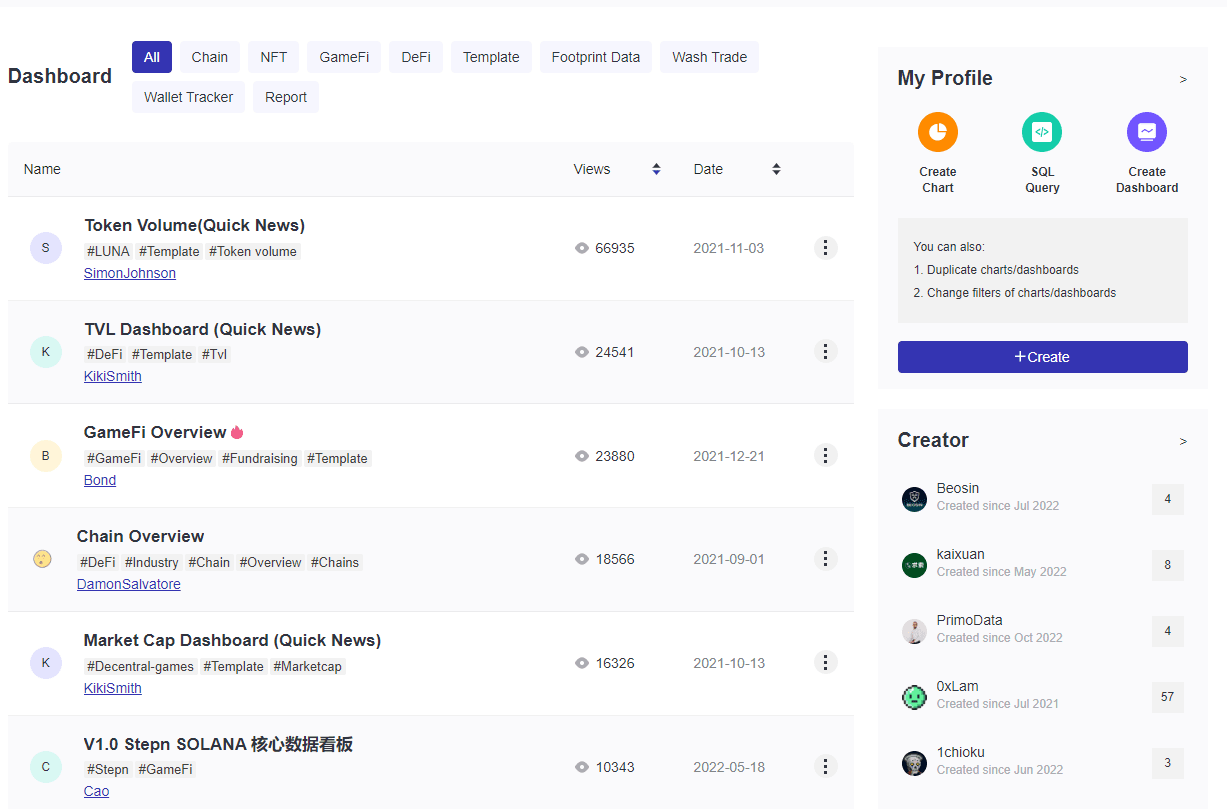
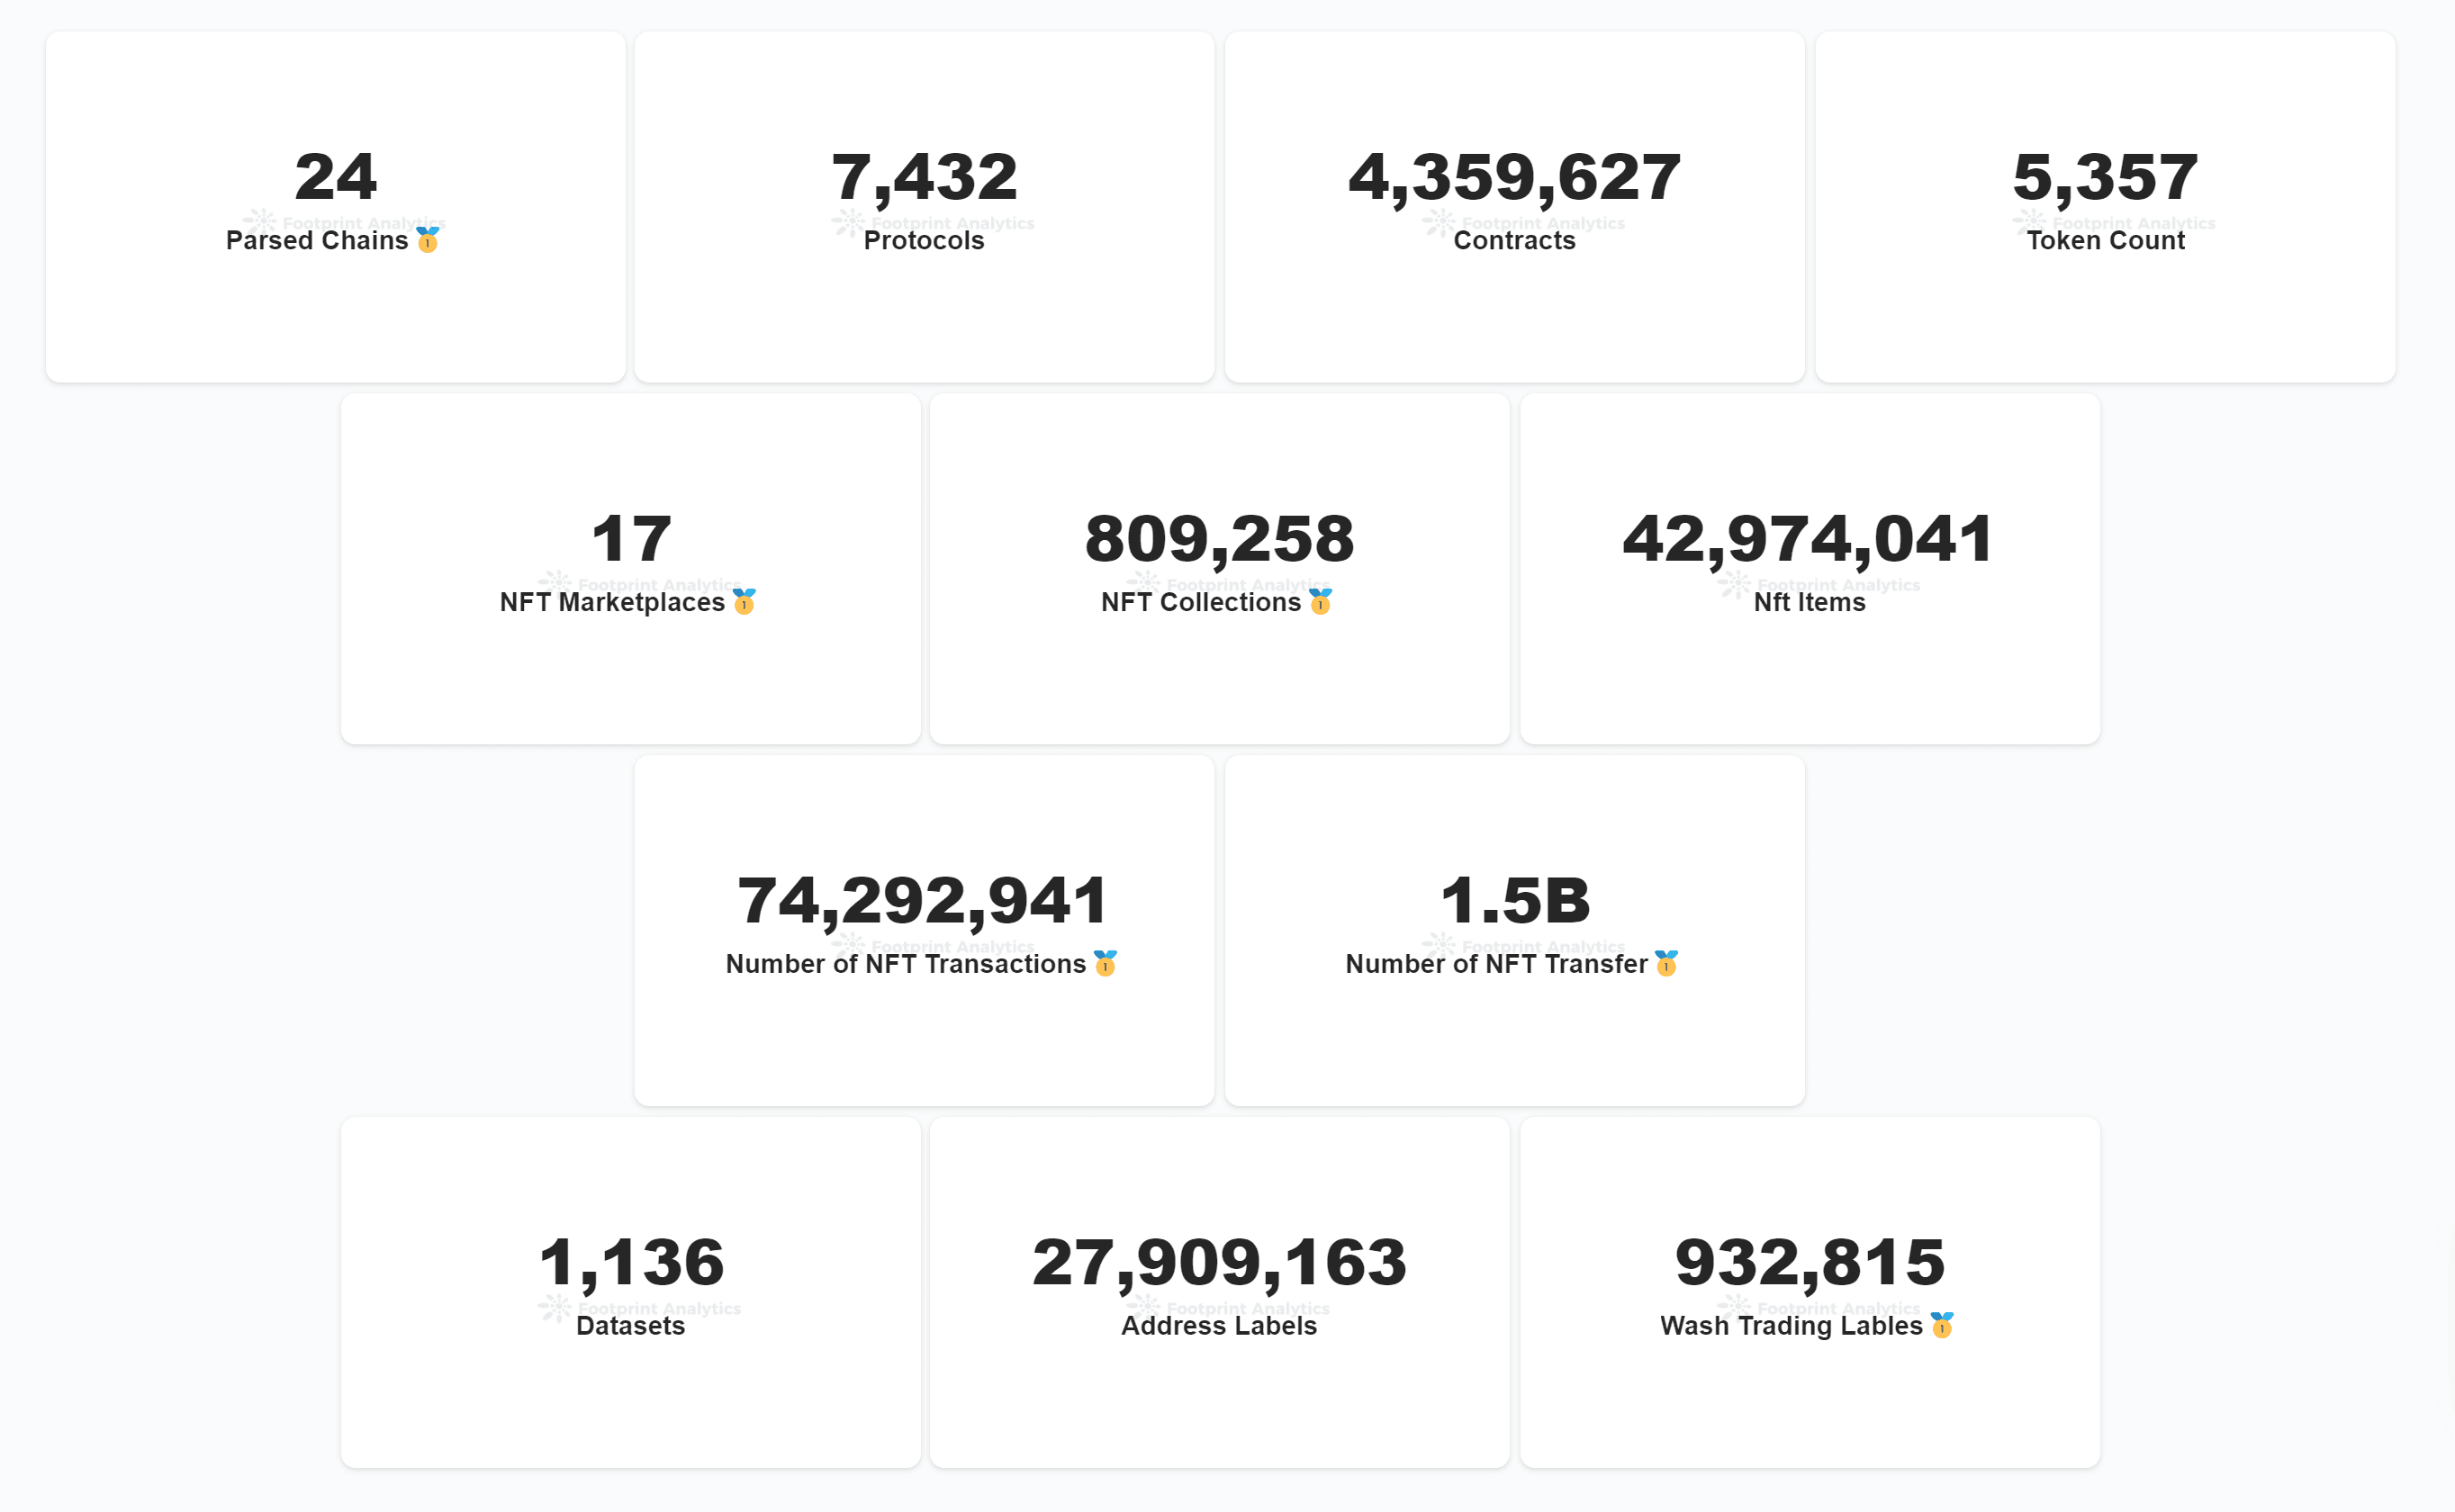
Compared to Dune, Footprint is more friendly to beginners because users do not have to use SQL queries, but can choose to enter the "chart" interface. At this time, the interface is similar to Excel, and you can use the provided menu to complete filtering, sorting, statistics, pivot tables and other analyses, so as to quickly build your own data panel. Footprint also attaches great importance to the developer community. In the search bar, you can search and view public charts and dashboards generated by other users, or copy other users' dashboards to modify them for yourself. Footprint currently supports parsing 24 chains and is the data analysis tool with the widest coverage of public chains. The data it supports parsing now covers 7,432 DeFi protocols, 4.35 million smart contracts, and 4.29 million NFTs.
Footprint divides data into three categories: gold, silver and bronze. Bronze-level data are unprocessed raw on-chain transactions, transfers, activities, logs and other data; silver-level data are NFT, GameFi, and Defi data on multiple chains, with transactions, addresses, etc. extracted and marked; gold-level data are aggregated business-level data, including user portraits, market value, TVL and other data, which can be used directly.
【Business Model】Subscription.
Free version of the analytics service: includes 1G data limit per query, 5 CSV uploads. Business version: $299/month, paid features include access to full historical data, 10G data limit per query, unlimited API uploads, unlimited CSV uploads and downloads. Team version: custom pricing, including custom data, unlimited custom alerts and unlimited custom dashboards. Data API free version: limited to 3,000 calls/month, 100 calls/day, 1 call/second, can save 30 days of historical data. Growth version: $79/month, limited to 300,000 calls/month, 10,000 calls/day, 10 calls/second, can save 6 months of historical data, can return 10 rows of static data, 100 rows of non-static data. Professional Edition: $360/month, limited to 10,000,000 calls/month, 10,000,000 calls/day, 50 calls/second, can save all historical data, can return 10 rows of static data, 100 rows of non-static data, can call SQL API database interface, and give away $299/month commercial version analysis service. Enterprise Edition: customized price, including customizable throughput, customized API and other personalized services.
[Insight] Footprint has its own research column and regularly publishes research reports independently or in collaboration.
GeniiData
——https://studio.geniidata.com/
[Core Function] Similar to Dune, GeniiData is also a cross-chain data analysis platform based on SQL query statements, providing cleaned and reliable data sources. Analysts can create charts and build visual dashboards by writing SQL queries.
The advantage is that it supports some chains that other tools do not support, such as supporting the analysis of popular new chains such as Aptos. Currently, GeniiData also has its own developer community, where users can view the dashboards created and shared by themselves.
【Business Model】Subscription.
Free version: does not allow uploading or exporting csv data. Premium version: currently by invitation only, can upload 10 csv data tables, can export csv data unlimited times.
Data analysis and insight tools
Nansen
——https://pro.nansen.ai/
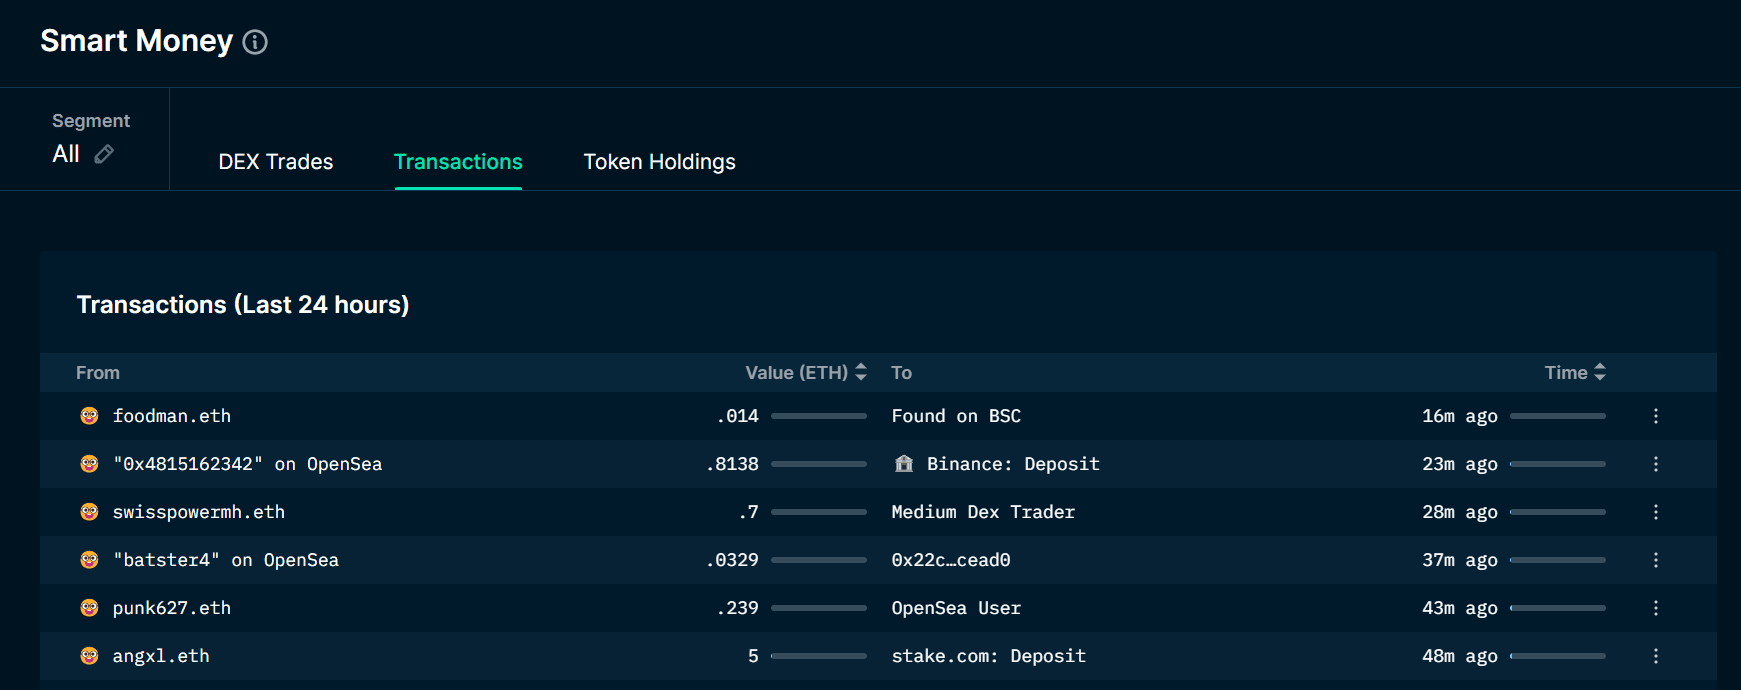
[Core Function] Nansen is famous for its "wallet labels" function. Nansen provides marking and identification of wallet addresses and has the largest wallet address label library. Currently, on the main interface of Nansen, you can query the portfolio of wallet addresses, public chain macro data, stablecoins, DeFi and NFT market data, etc.
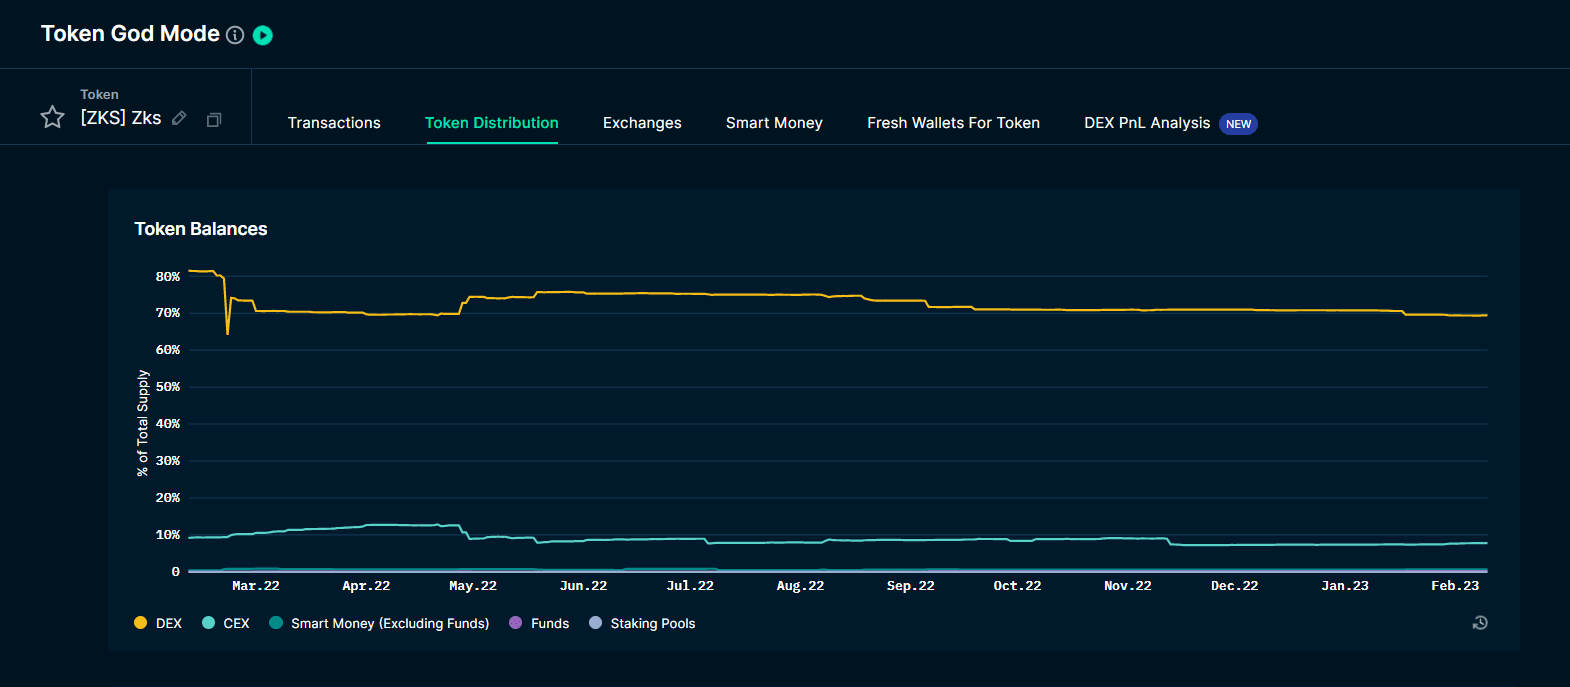
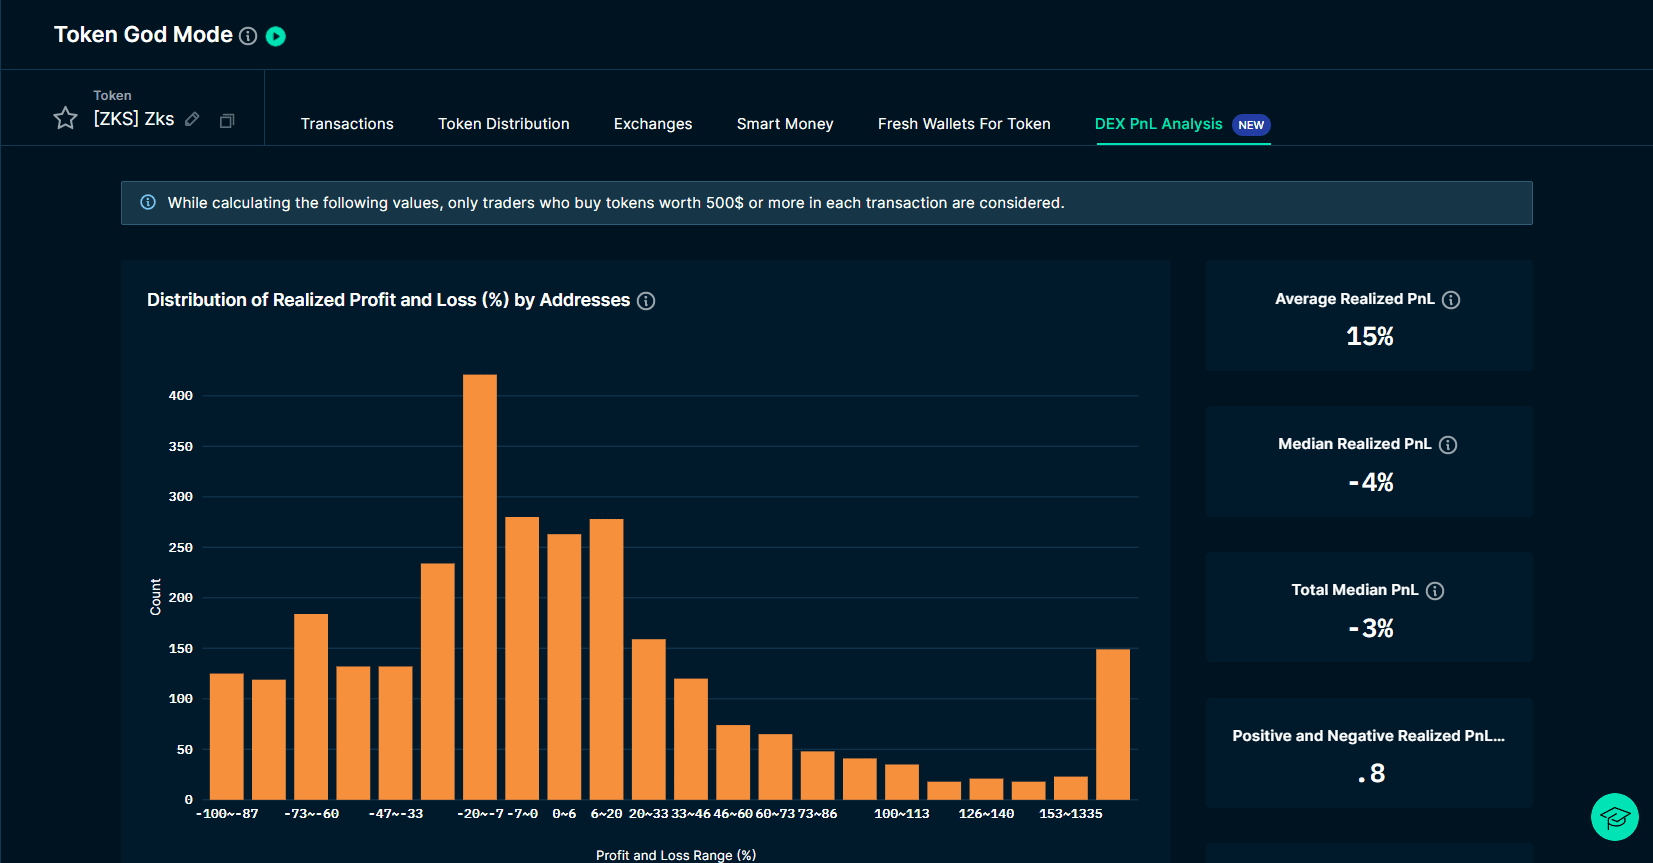
Wallet labels: By classifying wallets, the originally anonymous on-chain addresses will be labeled with multiple labels, such as smart contracts, exchanges, smart currencies, funds, heavy DEX traders, NFT collectors, etc. Users can quickly understand the type of wallet that executes the transaction, facilitate due diligence on contracts, projects, etc., and discover market opportunities from the address activities of whales, funds and other wallets. Smart money: The most famous of Nansen’s wallet labels is "smart money". The wallet addresses of elites in the crypto world have the smart money label, including the addresses of whales, VCs and other users. Tracking the movements of smart money addresses can help users track the real-time movements of whales and heavy DeFi players. Portfolio: Nansen users can use their wallet addresses to log in to their website. After logging in, they can view all assets, transaction records, asset analysis, etc. under the wallet address on the page. NFT: Currently, Nansen has launched services such as NFT Paradise, NFT God Mode, NFT Wallet Profiler and NFT Item Profiler, NFT Leaderboards, and Smart NFT Trader dashboards. On the NFT Paradise page, users can browse macro NFT market dynamics, including real-time updates of floor prices from OpenSea, as well as NFT trends and popular NFT collectibles. NFT whales can be identified through the NFT profit rankings or through NFT God Mode to find the top holders of a specific NFT collection, and then they can use wallet address tracking to monitor their activities in real time and find opportunities. Token: Nansen’s new feature, similar to the NFT dashboard, provides macro issuance and transaction data of tokens. The main dashboard data are Token Paradise and Token God Mode. In Token God Mode, you can see the holding distribution and balance of the token on CEX/DEX/smart money, as well as the profit and loss distribution of transactions, to assist investors in making decisions. Smart alerts: Nansen allows users to subscribe to smart alerts, and they will be notified when the addresses they subscribe to generate trading activities. Watchlist: Users can add wallet addresses they want to monitor to the watchlist to monitor the movements of the address at any time.
【Business Model】Subscription.
Basic Edition: $150/month, you can view Nansen's NFTs, DeFi, Wallets, Smart Money, Wallet and Token Watchlists data and NFT research reports, you can create 10 smart alerts, and use Nansen's portfolio tracking service. VIP Edition: $1,500/month, including all the features of the Basic Edition, the upper limit of the number of smart alerts is increased to 100, and you can enjoy advanced dashboard services, including customized functions such as filtering and csv export. Alpha Edition: $3,000/month, based on the VIP version, it provides more closed communities and private investment consulting services. Enterprise Edition: Customized price, based on the Alpha version, it provides customized services such as Nansen's API.
[Insight] Nansen has its own research column and regularly publishes data insight reports, investment research analysis and other articles.
Glassnode
——https://studio.glassnode.com/
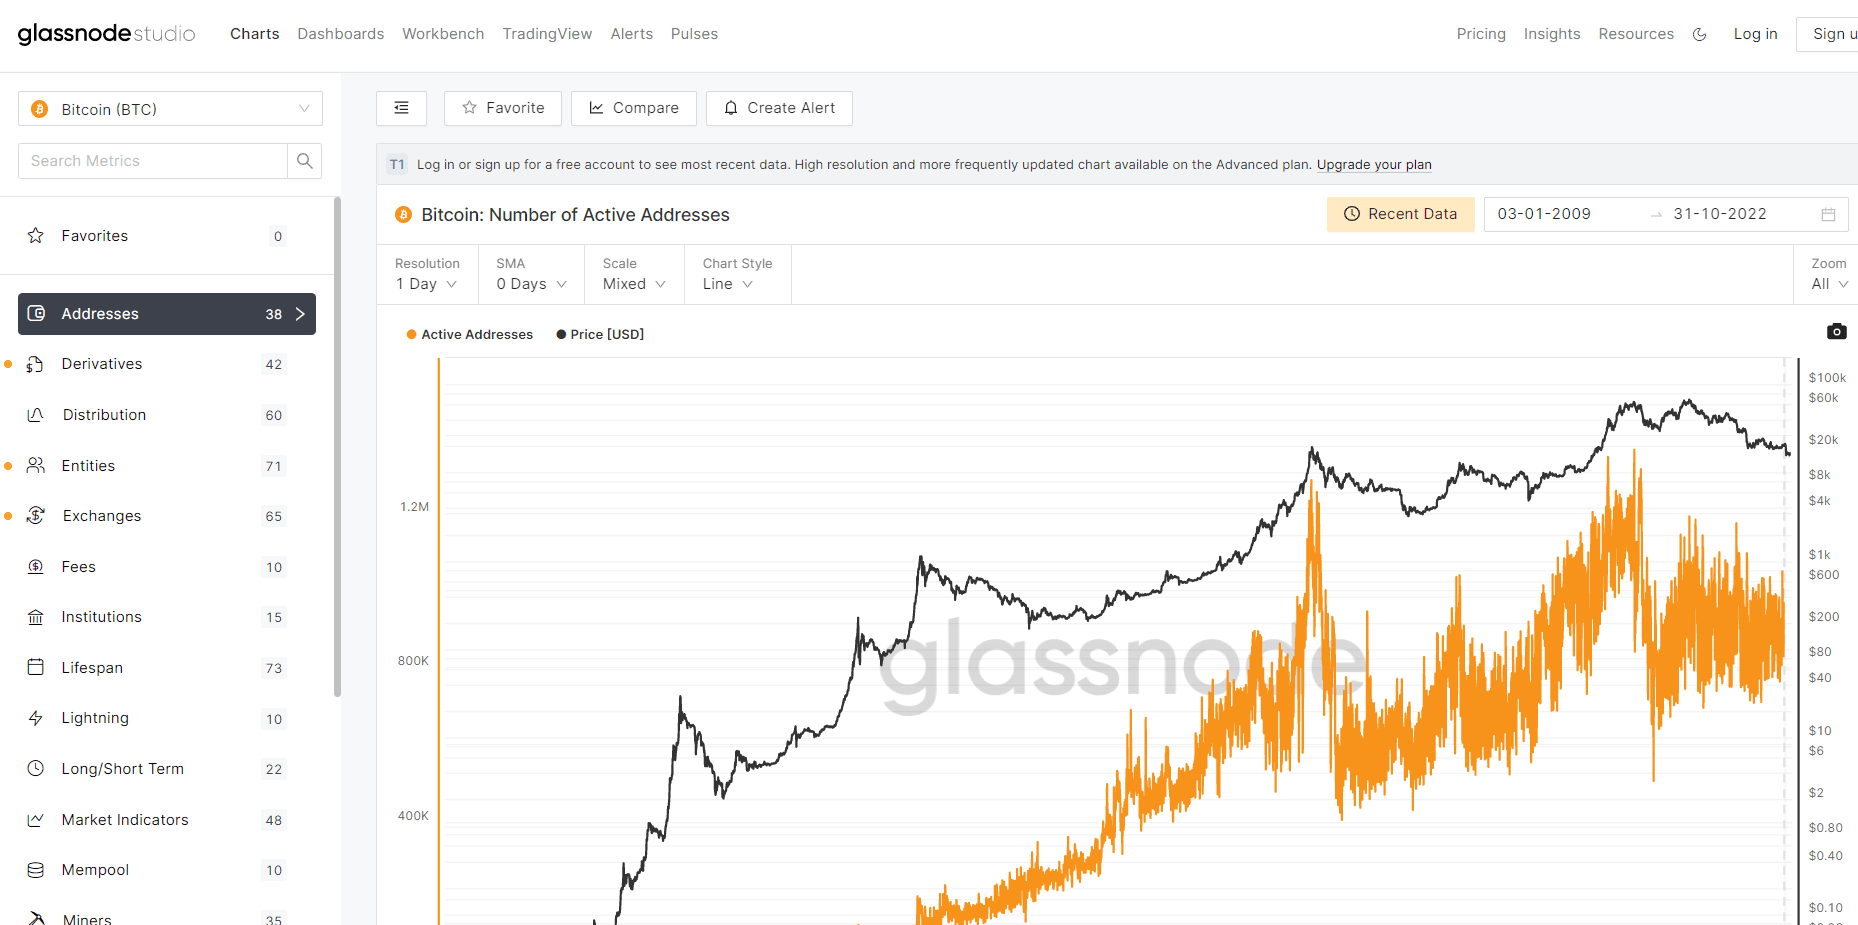
[Core Function] Glassnode mainly provides data on the BTC, ETH and LTC chains, including various modeled major market data indicators, such as addresses, token distribution, coin holders, fees, derivative interest rates and leverage, exchange funds, miners, markets, profits and losses, supplies, number of transactions, etc., to help users comprehensively analyze the positions of the entire market and make trading decisions.
Although most of the data provided by Glassnode are officially modeled analytical data, user customization functions are currently provided in the dashboard and workbench modules. Users can define the indicators they need and generate charts on Glassnode Studio.
【Business Model】Subscription.
Standard version: Free, only the first-layer indicators can be observed, and they are updated at the 24-hour level, limited to 30 API requests/minute. The complete on-chain historical data can be observed, the derivative historical data cannot be observed, and 1 alarm can be created. Advanced version: $29/month, the second-layer indicators can be observed, the first-layer indicators are updated at the 1-hour level, the second-layer indicators are updated at the 24-hour level, limited to 120 API requests/minute, 1 month of derivative historical data can be observed, and 10 alarms can be created. Professional version: $799/month, the third-layer indicators can be observed, the three-layer indicator data are all updated at the 10-minute level, limited to 600 API requests/minute, the complete derivative historical data can be observed, and 50 alarms can be created. Institutional version: customized price, the third-layer indicators can be observed; customized indicators + customized queries.
[Insight] GlassNode has a research column on its official website, which regularly publishes data interpretations and weekly insight reports.
EigenPhi
——https://eigenphi.io/
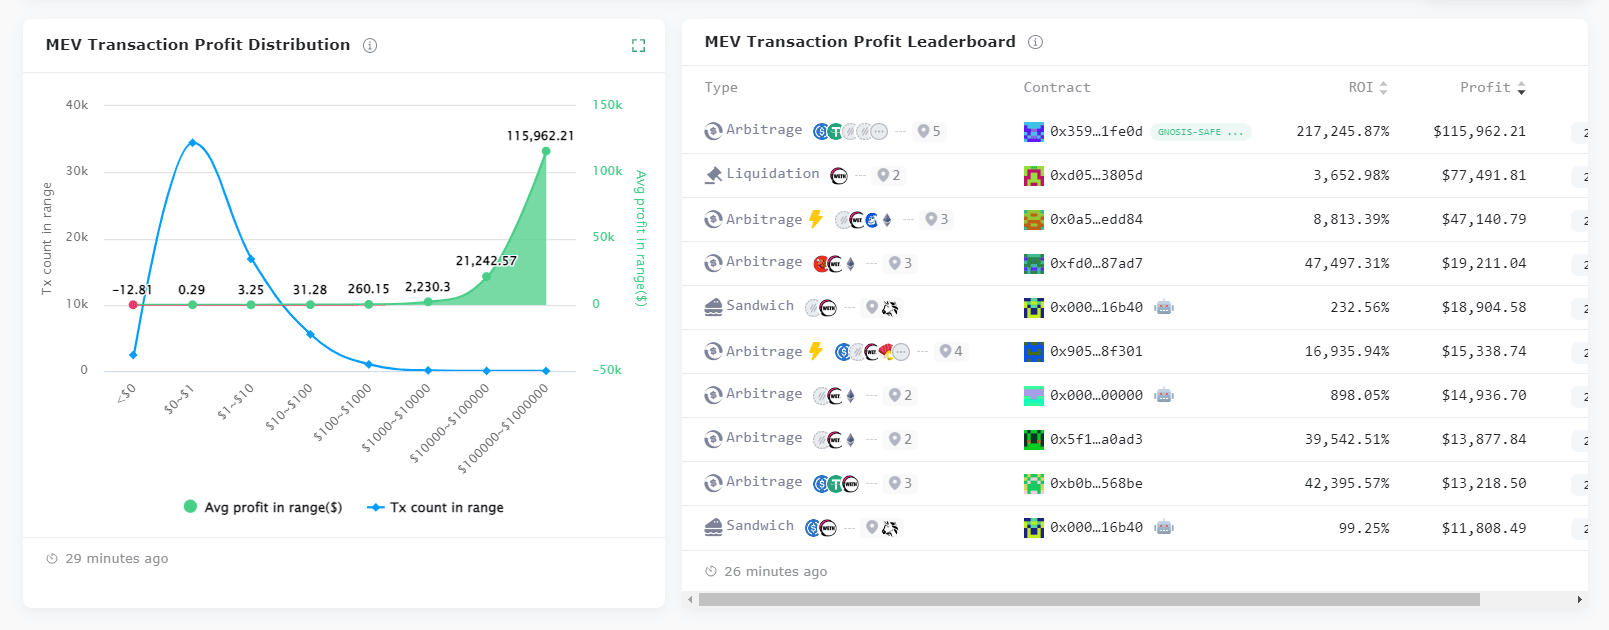
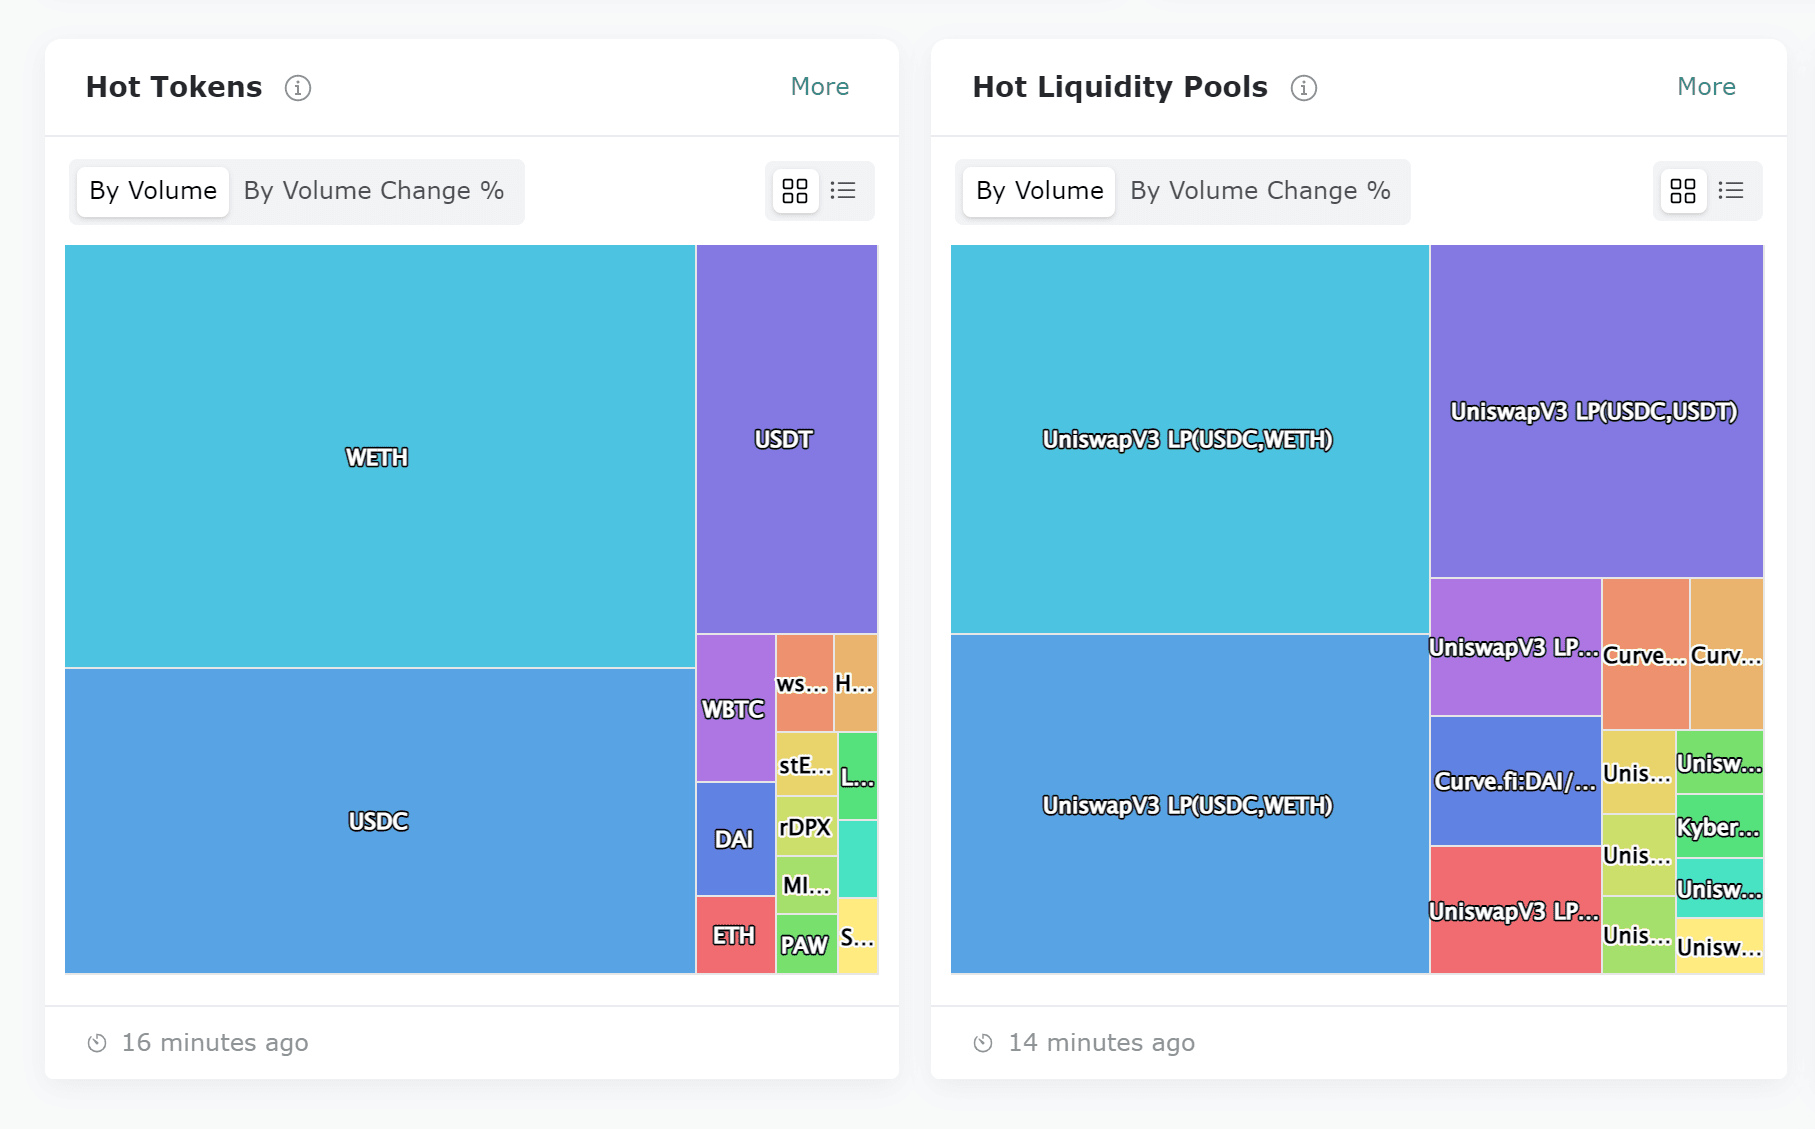
[Core Function] Eigenphi is a liquidity analysis tool for DeFi, focusing on MEV transactions and their correlation analysis. Currently, EigenPhi provides real-time MEV data, including real-time monitoring data of arbitrage, sandwich attacks, liquidation, and flash loan behaviors. It also provides relevant transaction data of the most popular tokens and liquidity pools, as well as identification of malicious tokens (Malicious Token, which may charge transfer fees or transaction fees without notifying users).
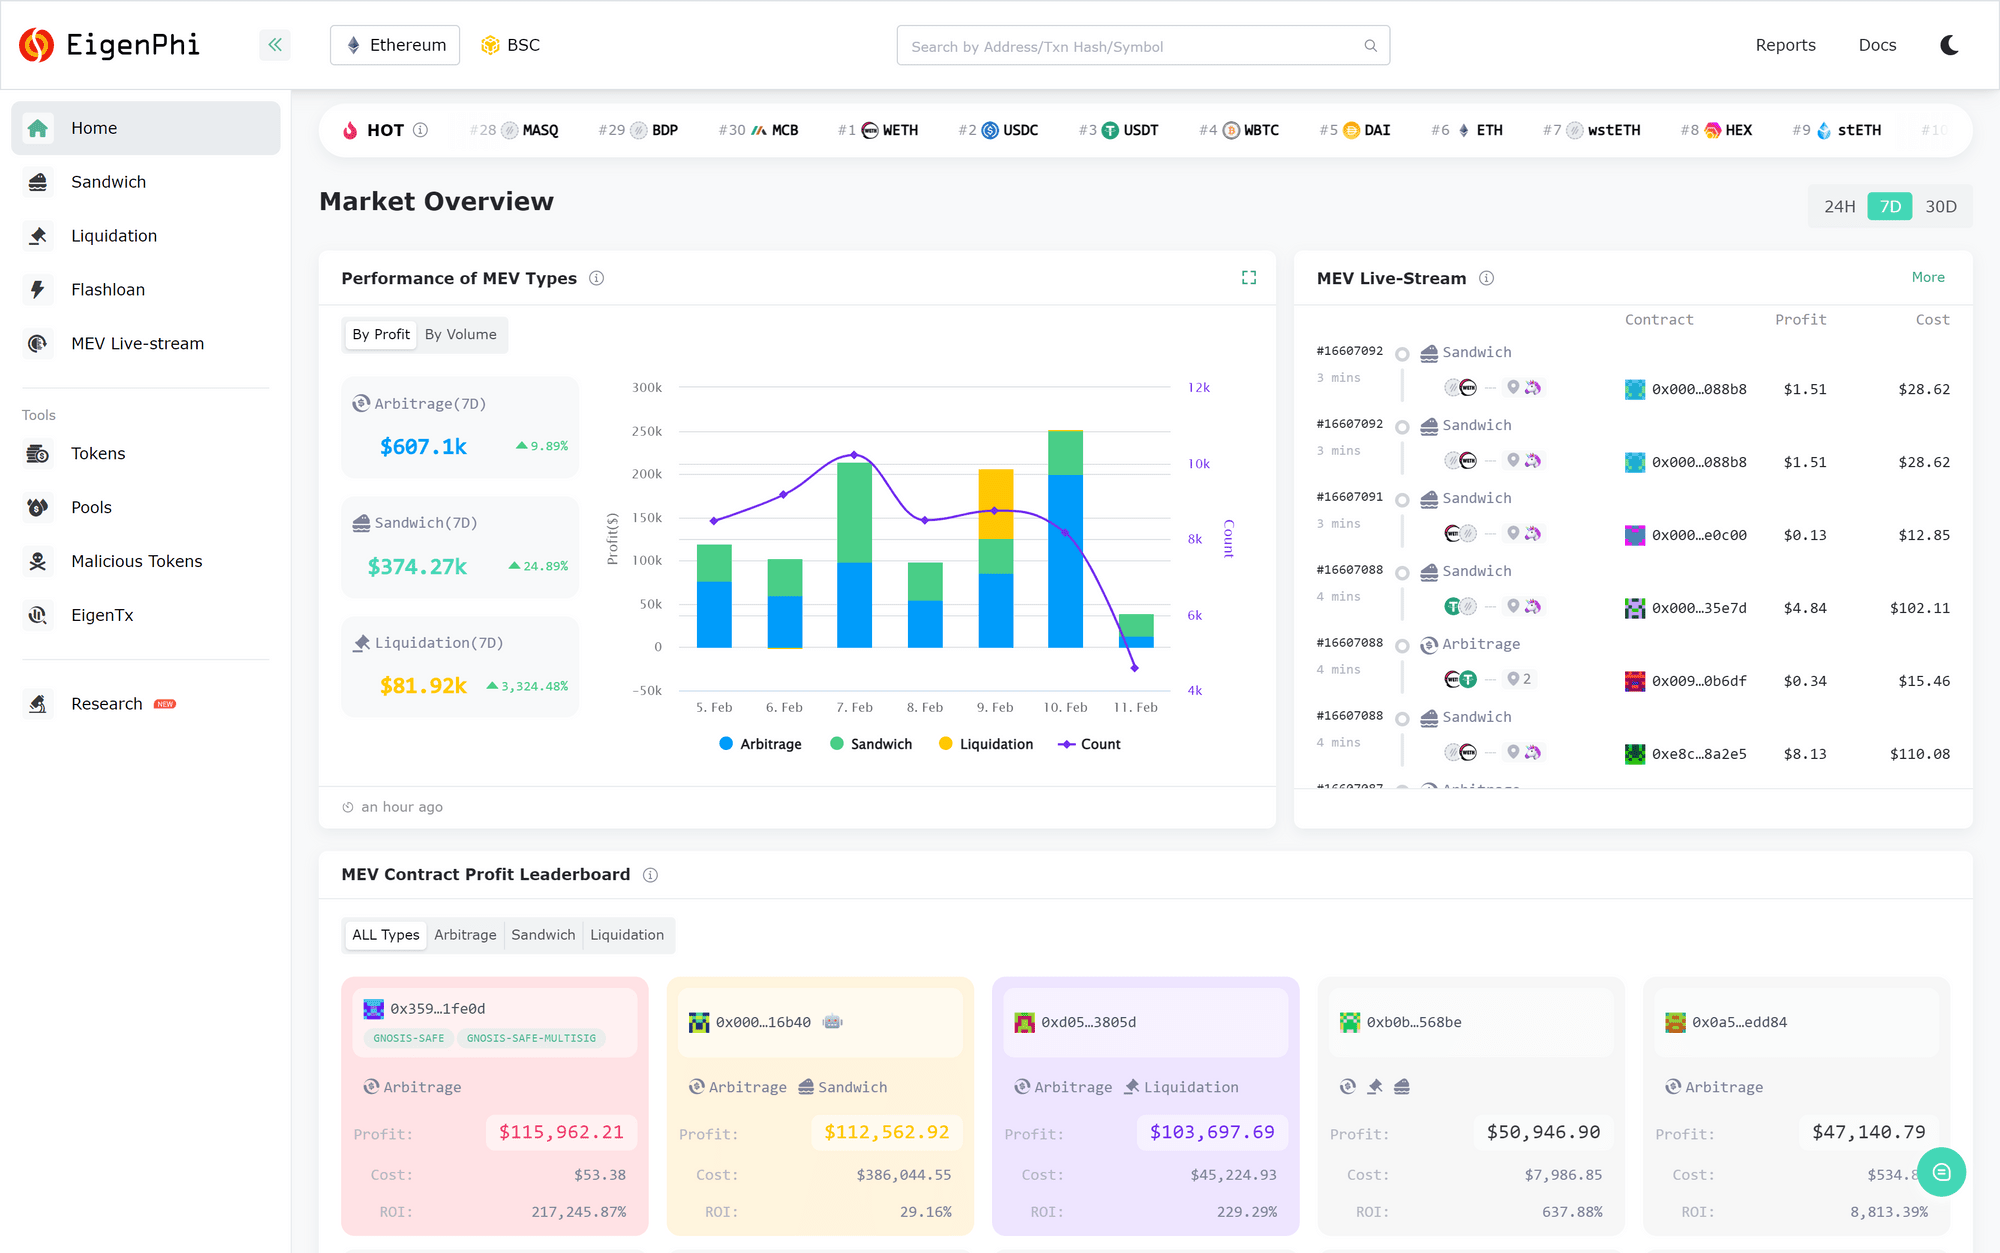
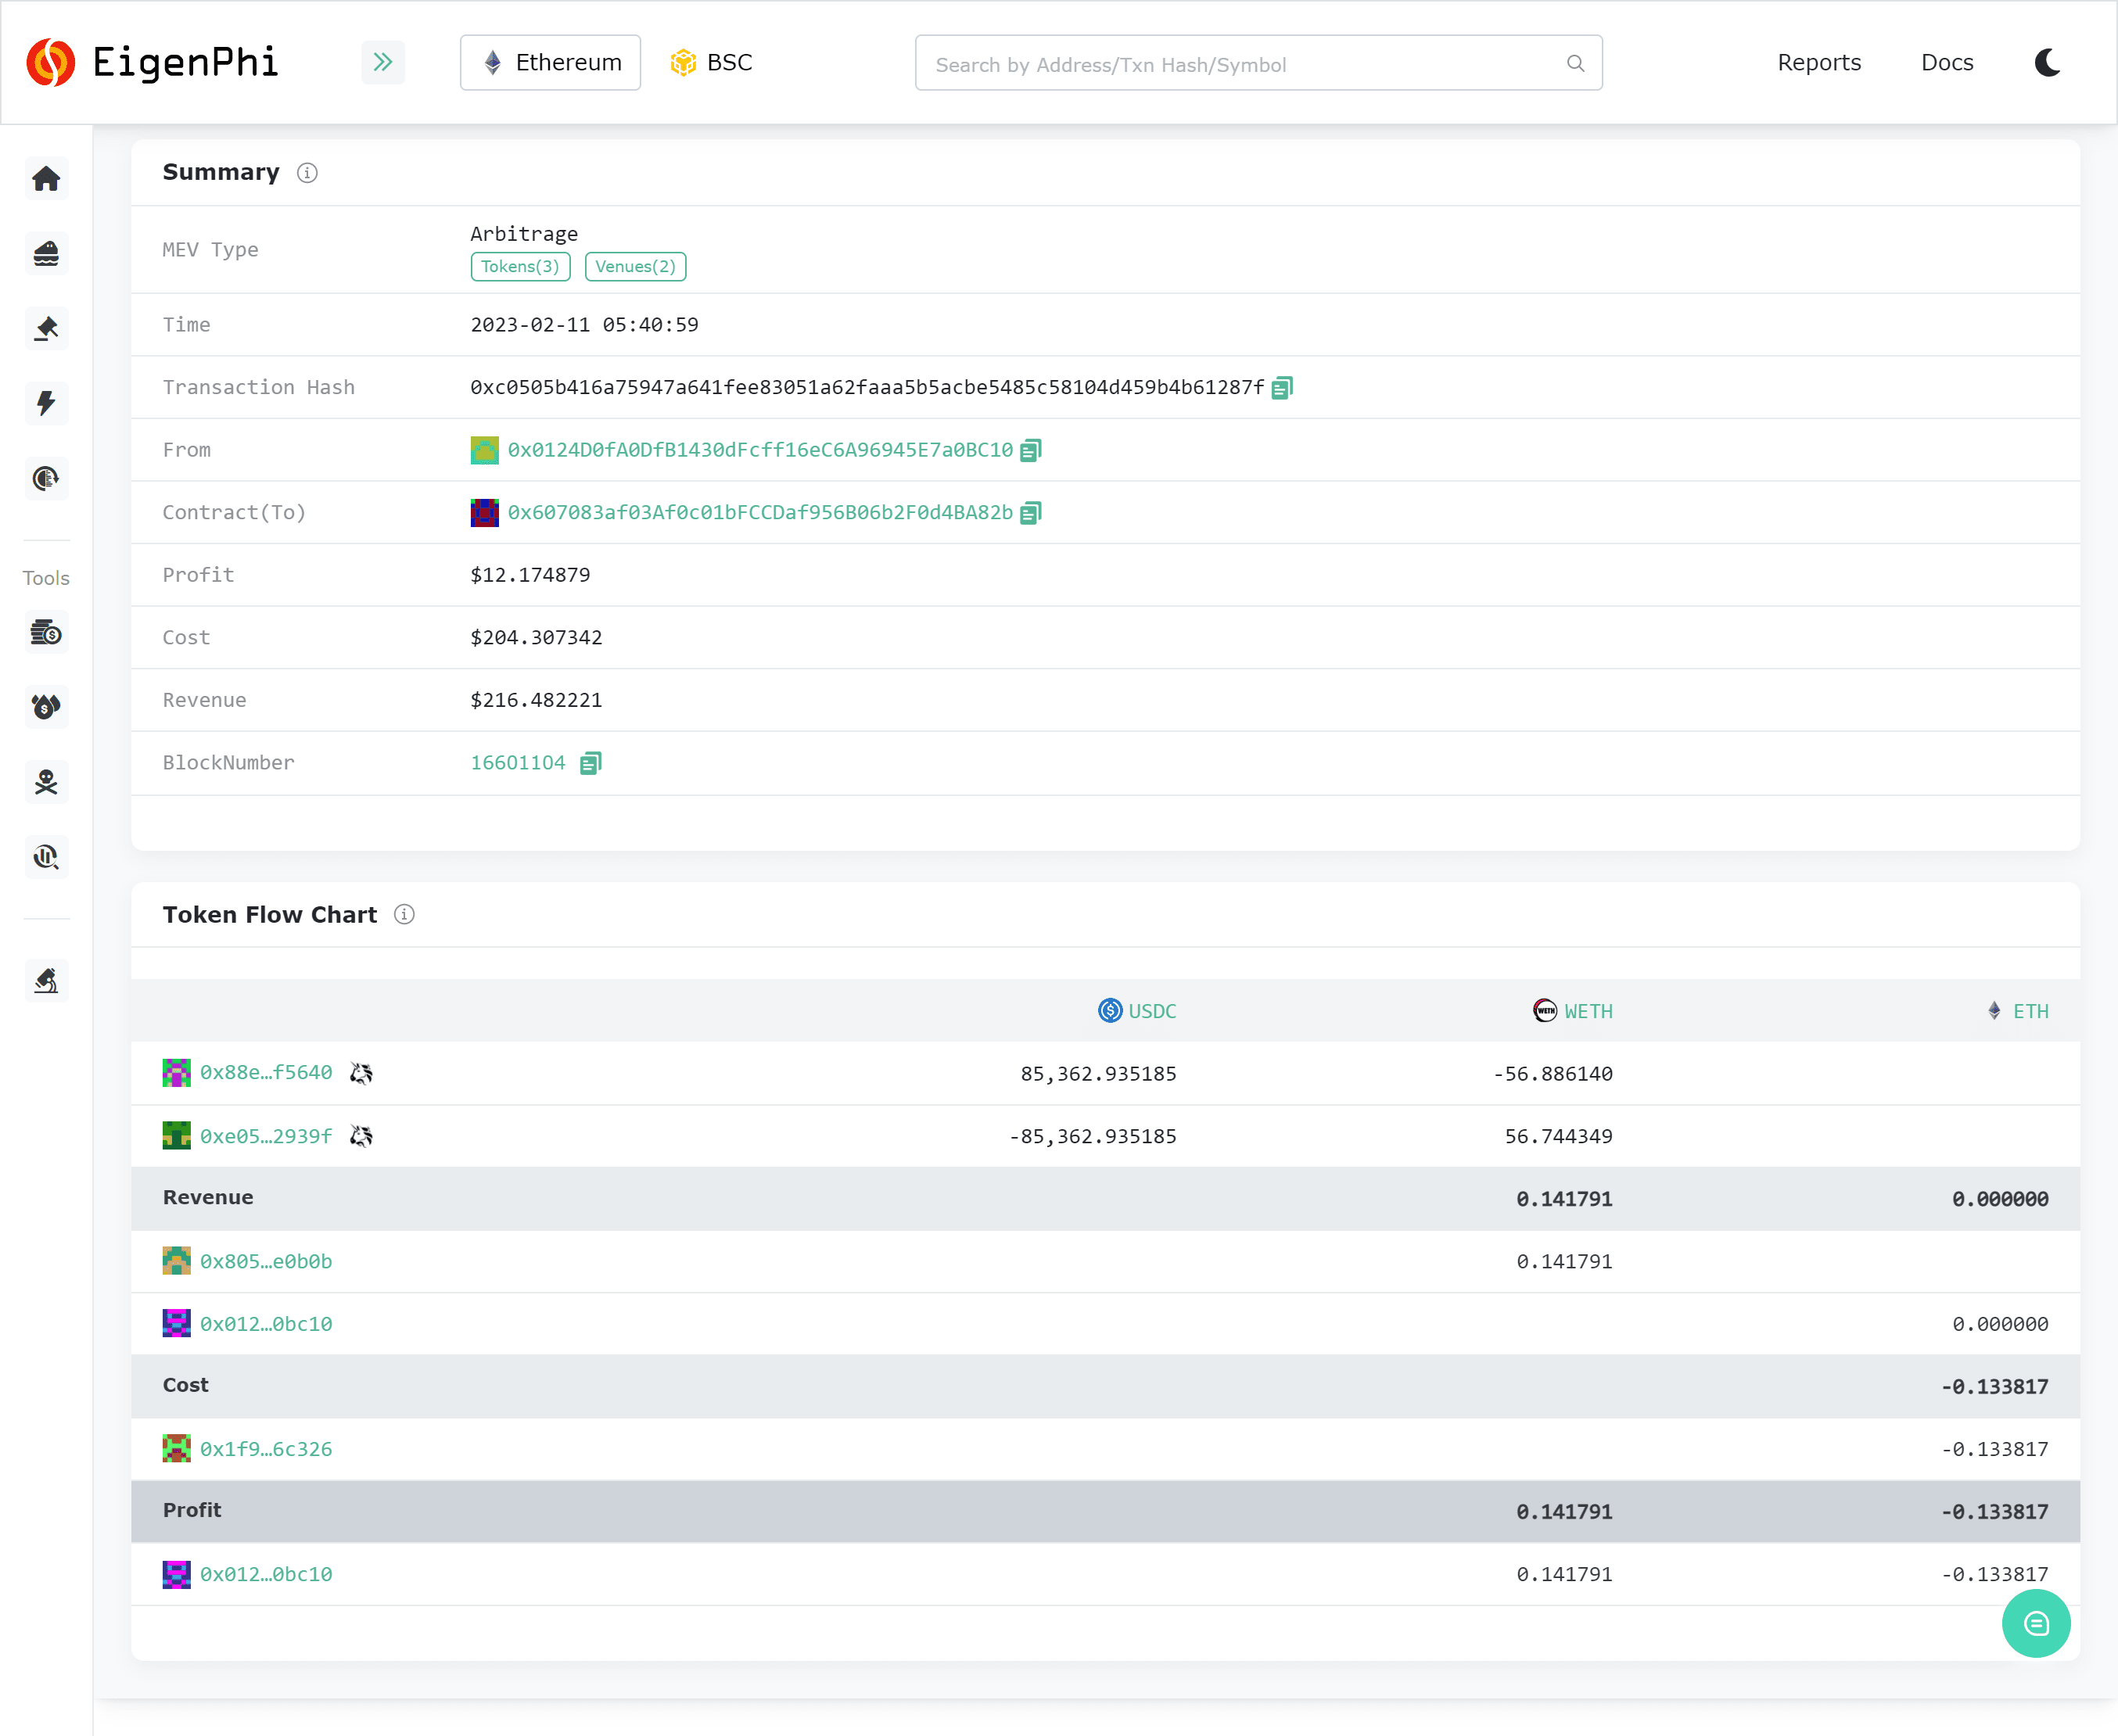
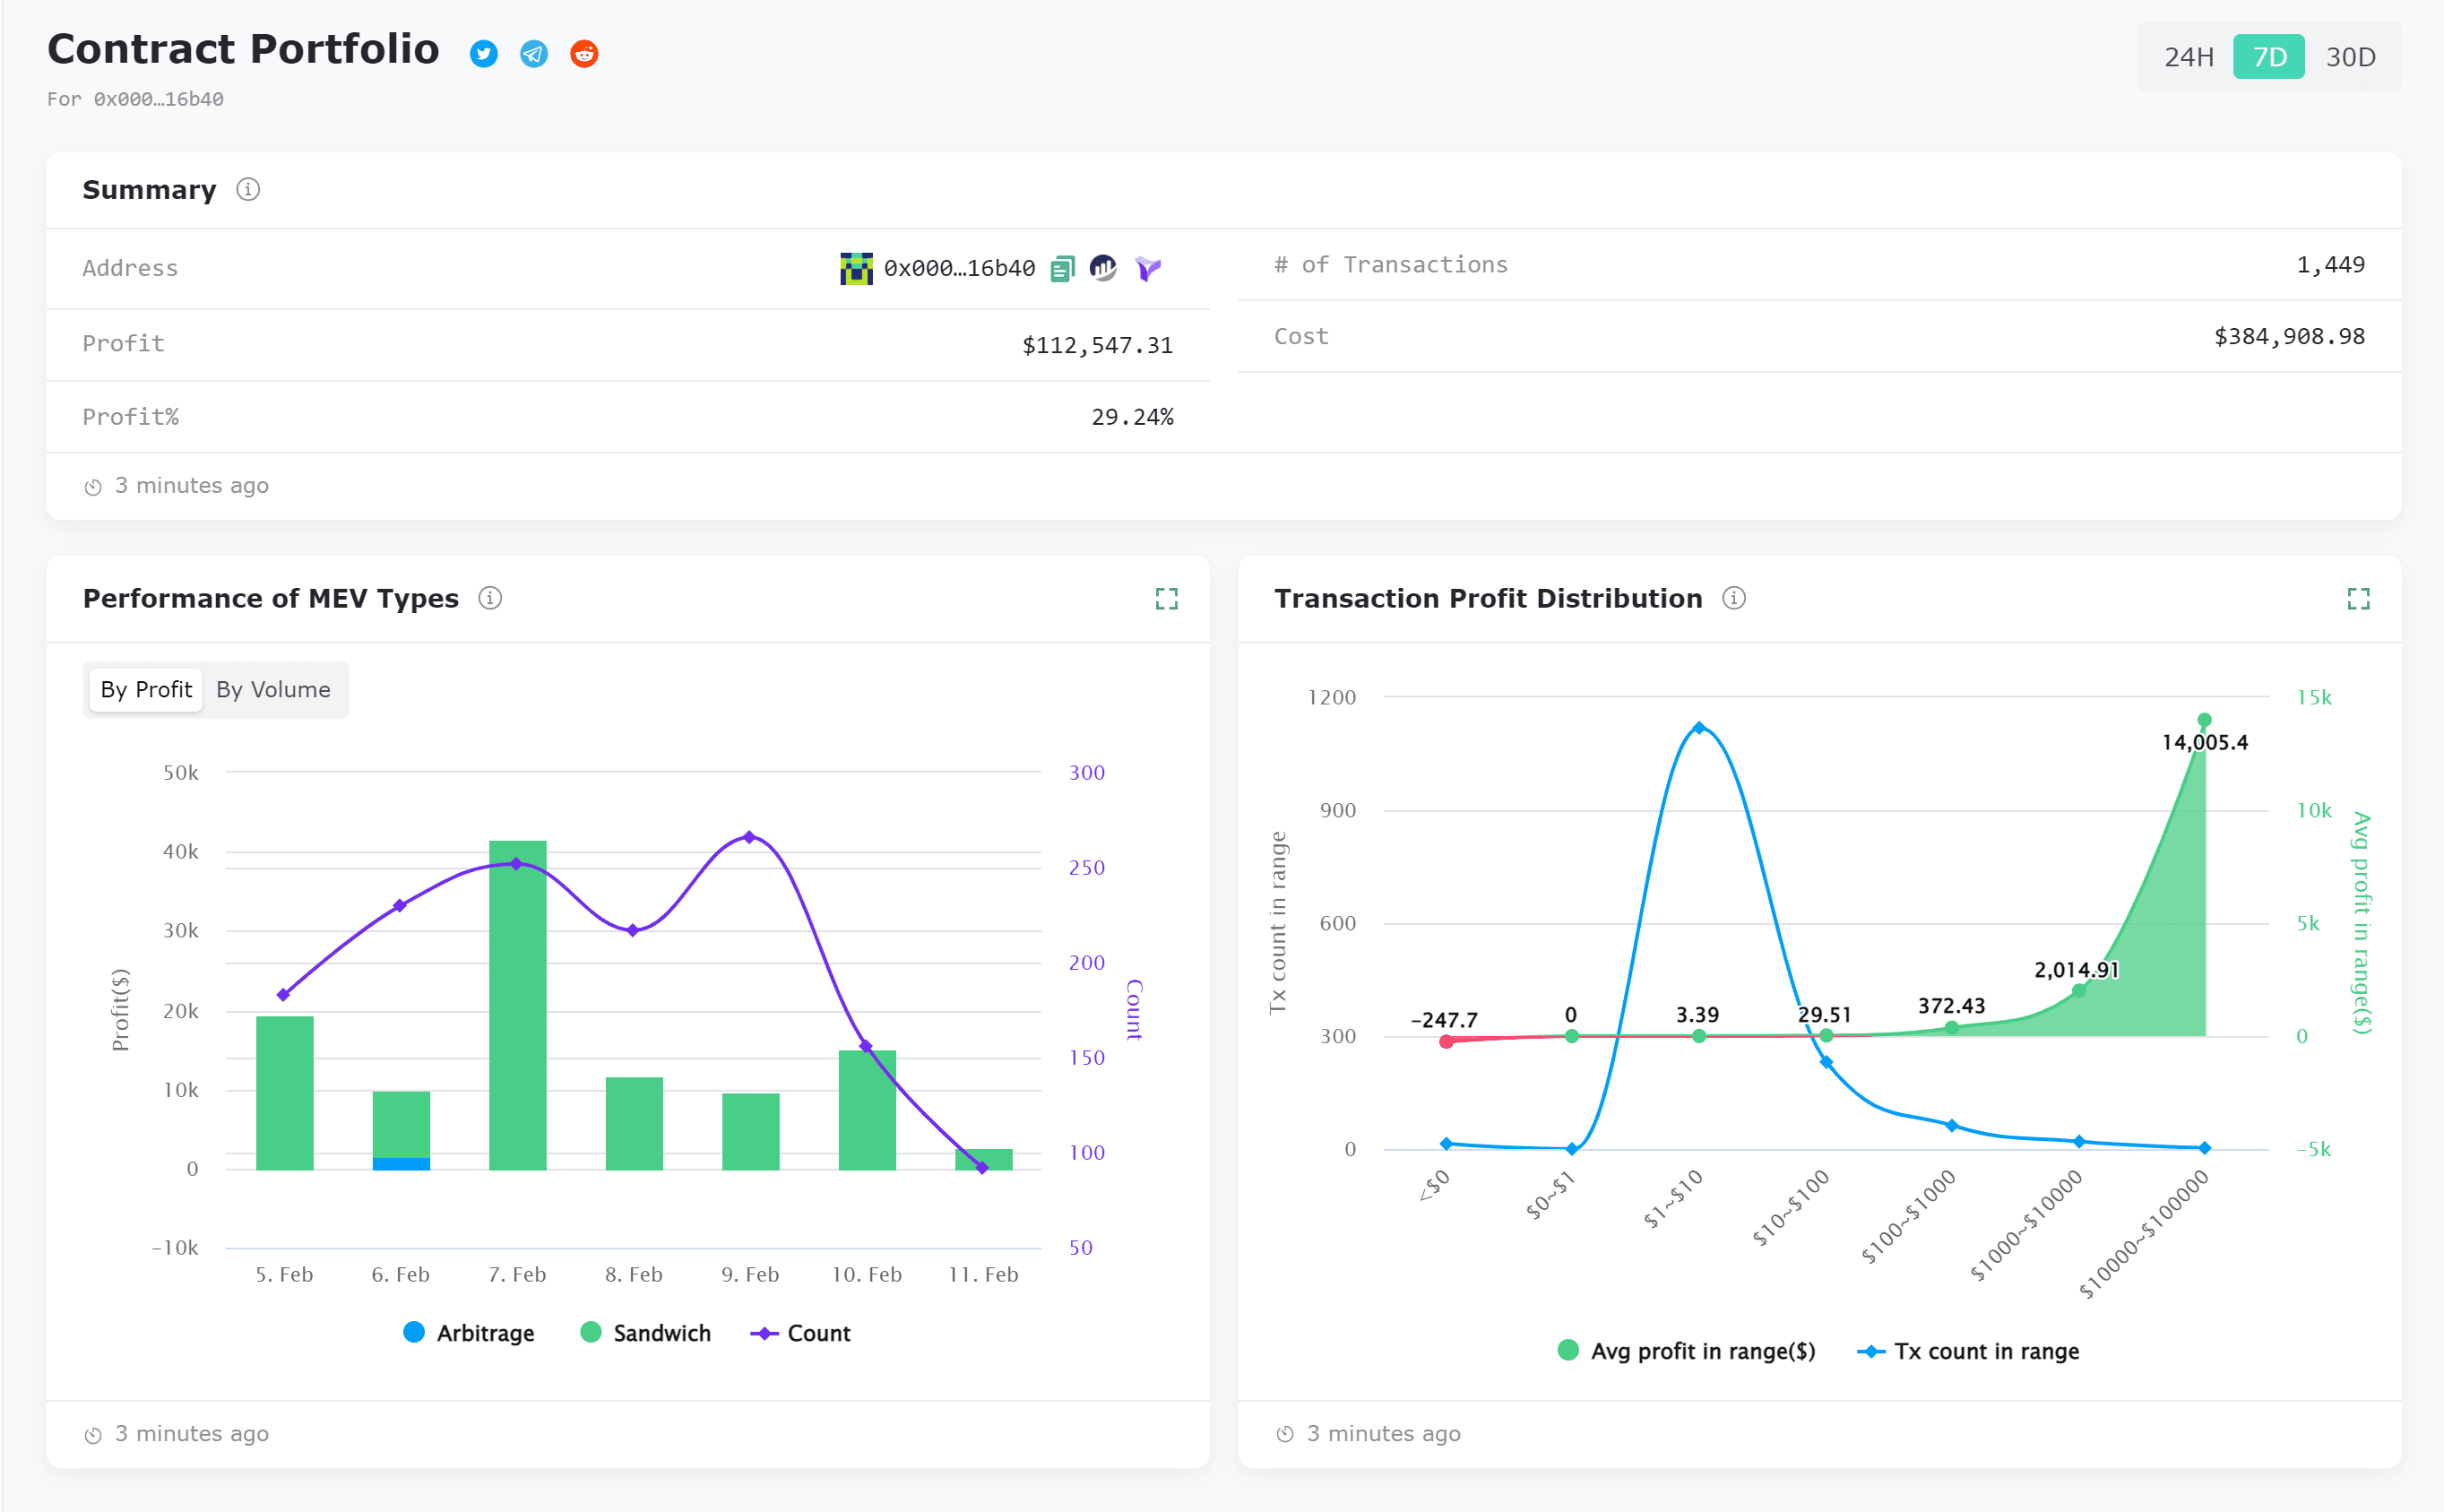
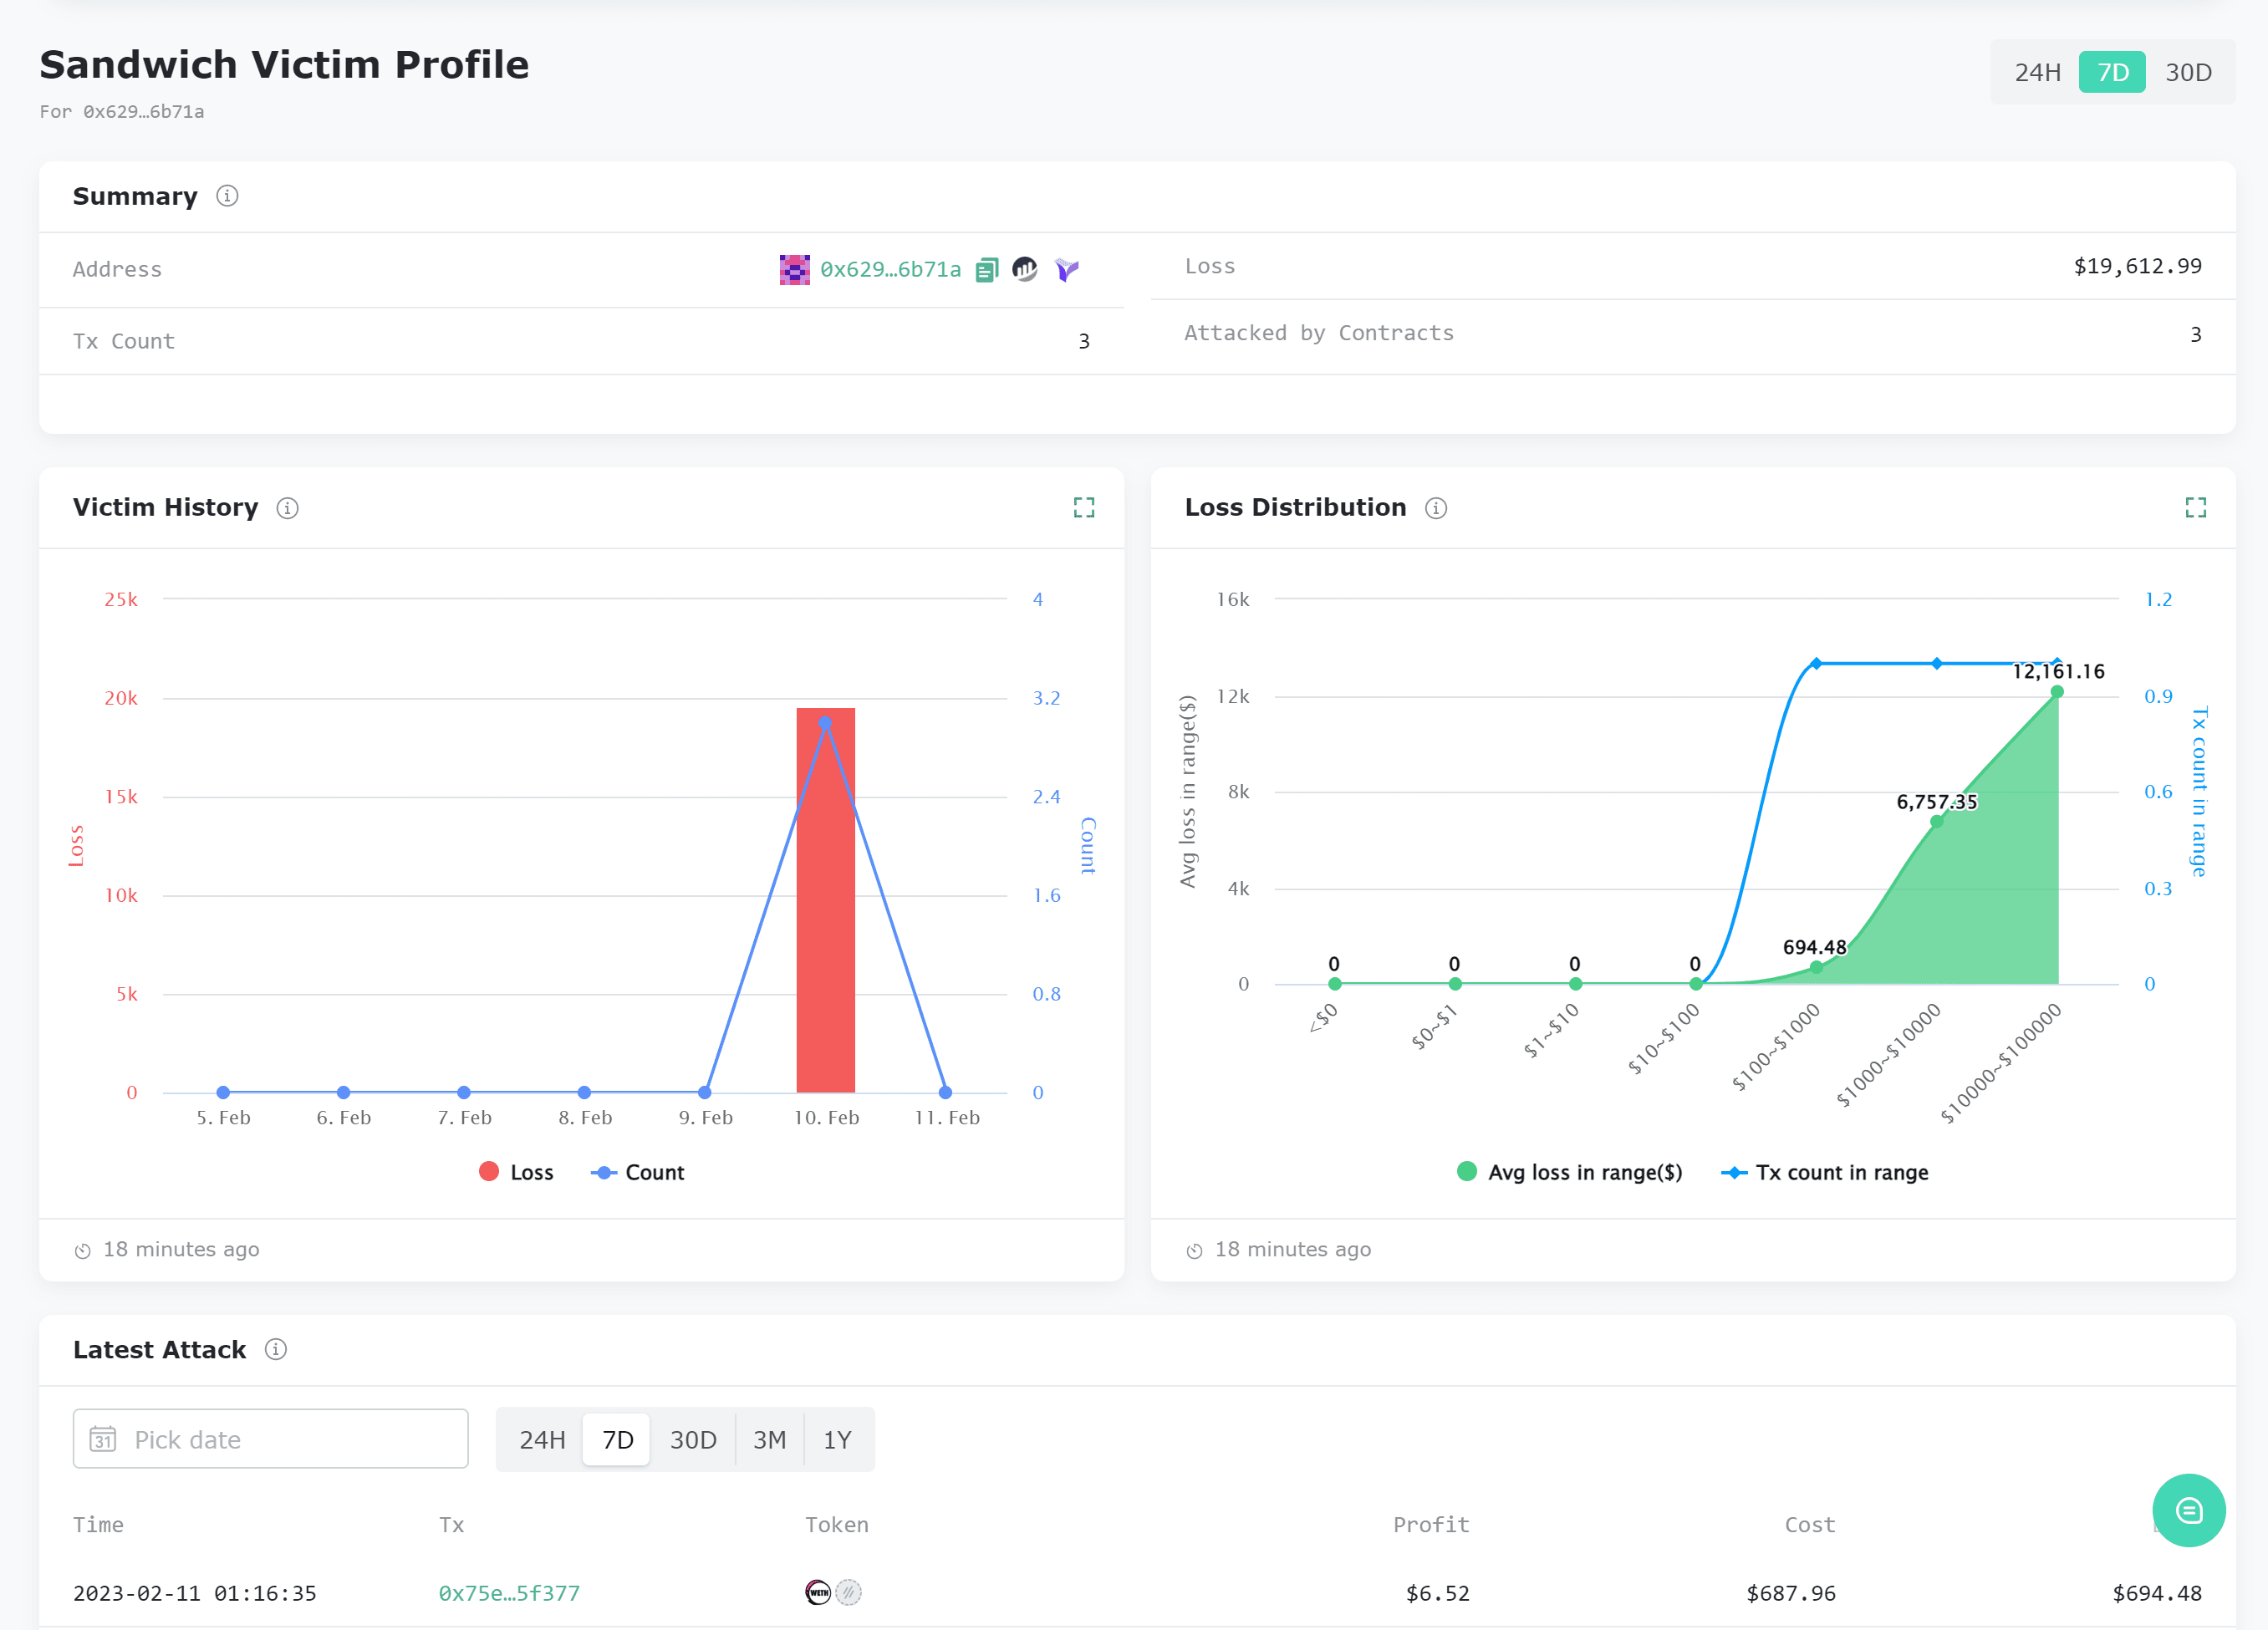
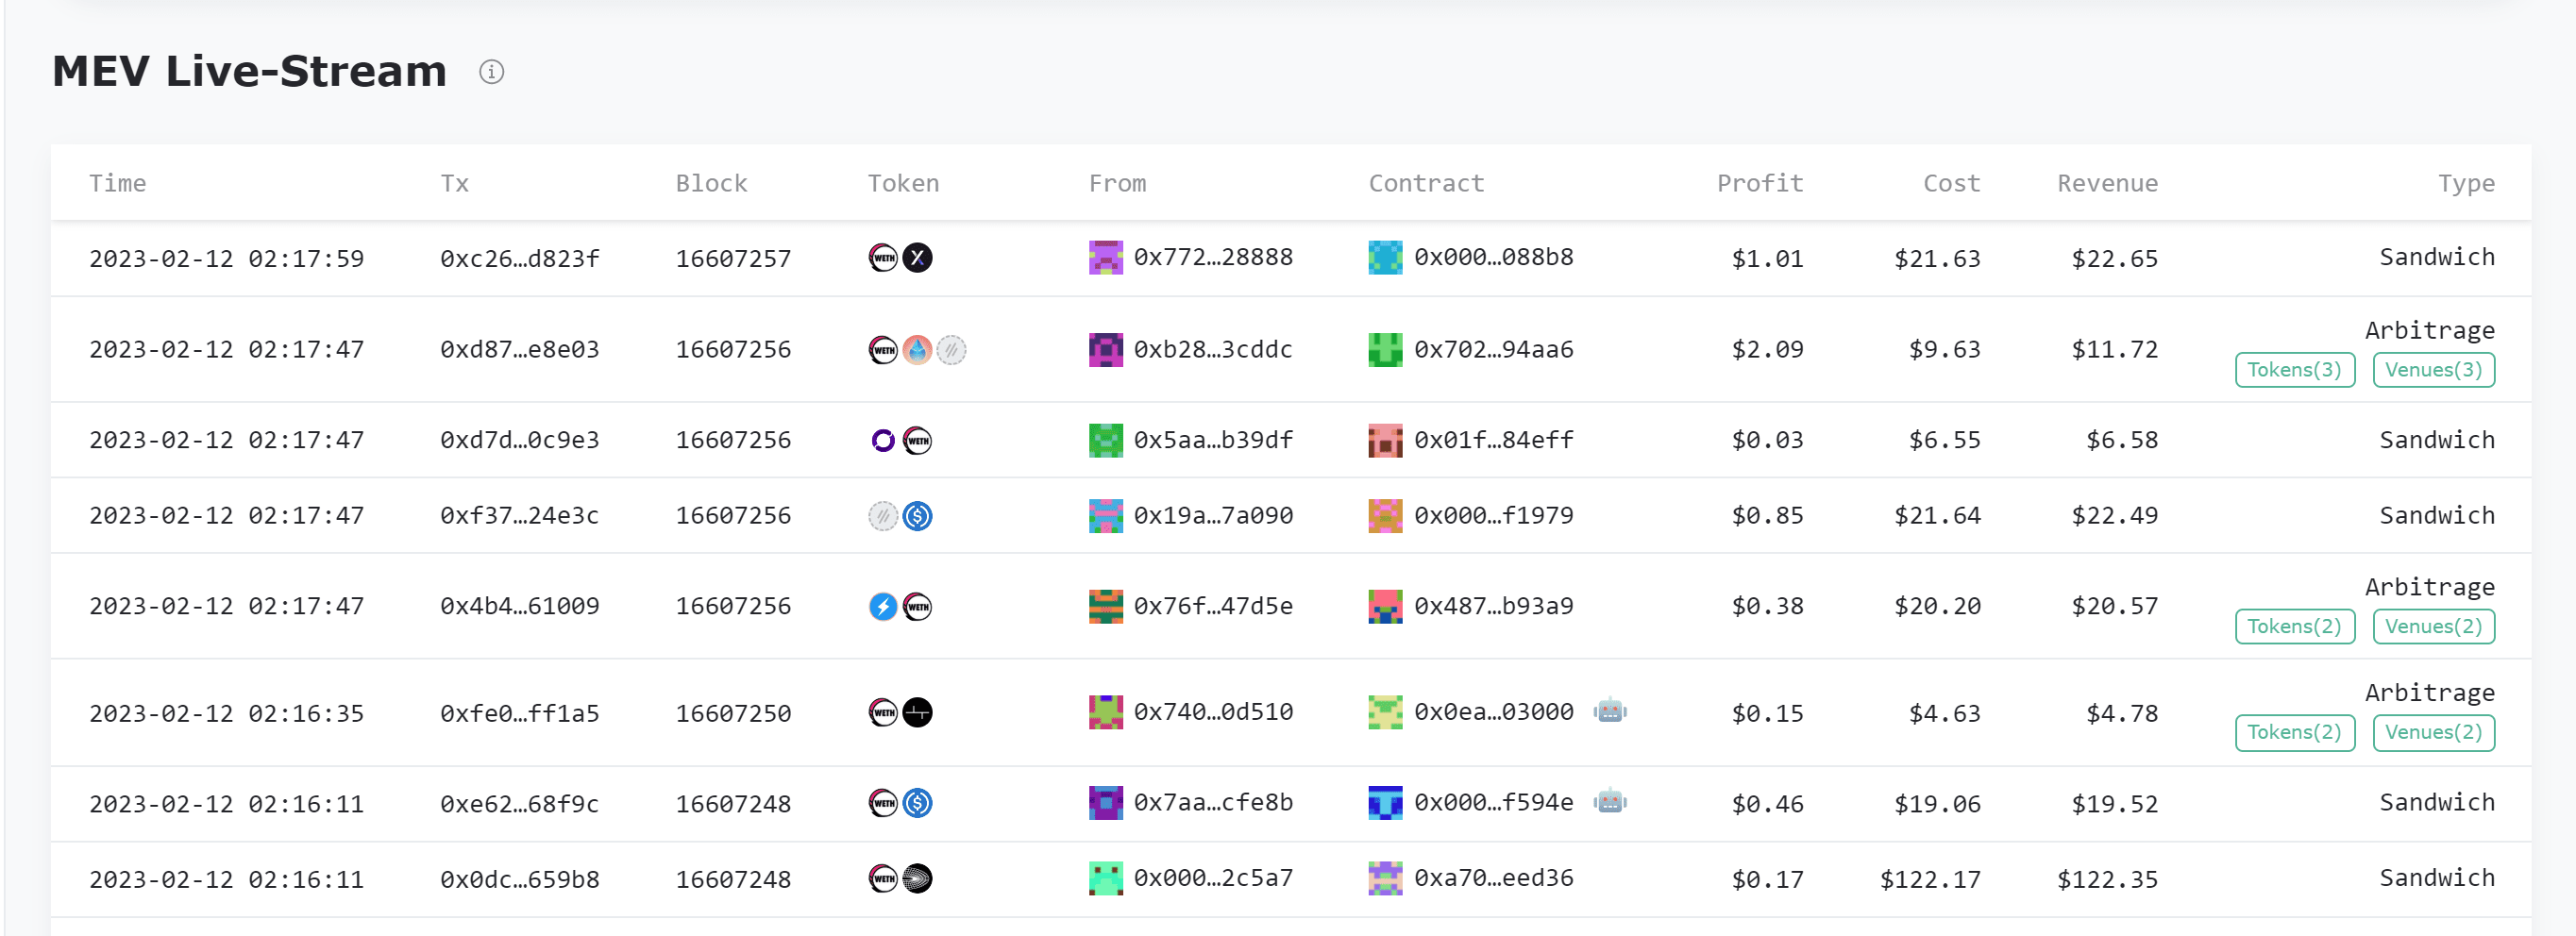
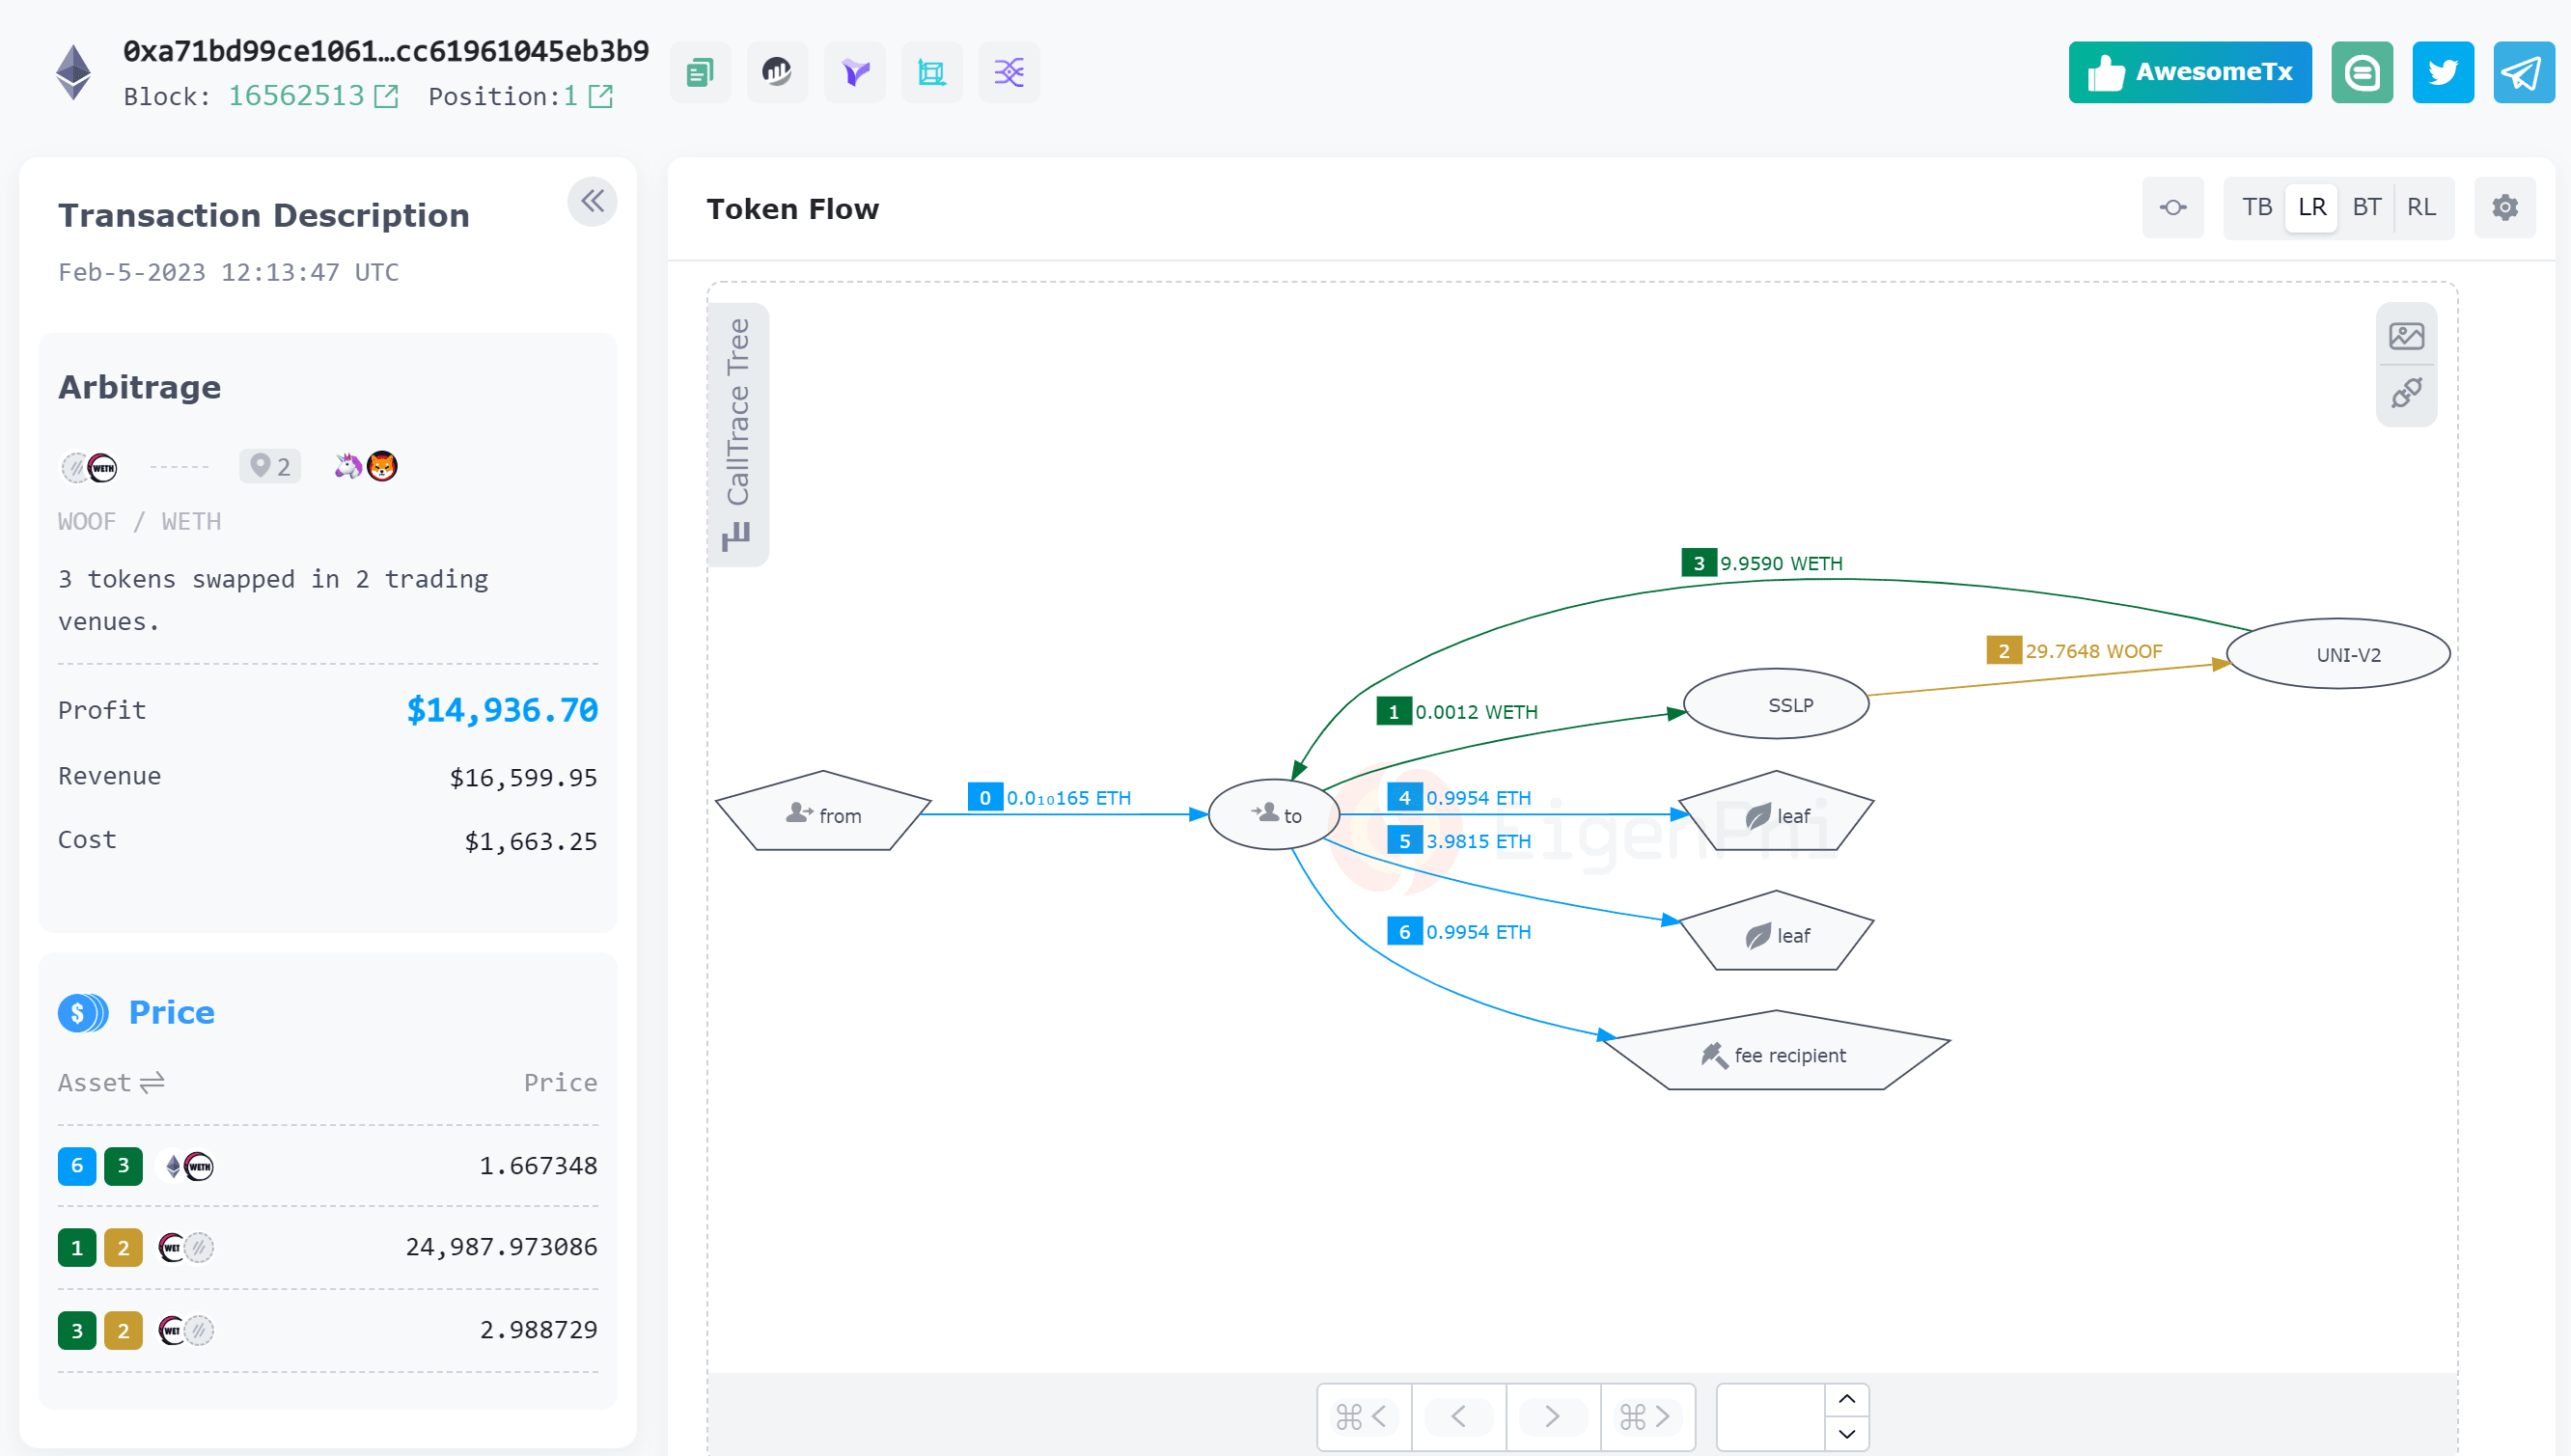
MEV transaction data: the most microscopic data level, including the MEV type of the transaction (arbitrage/sandwich/liquidation, whether flash loans were used), the EOA address of the MEV searcher, the MEV robot contract address, the block in which the transaction is located, the internal token fund flow in the transaction, gas fees and profit and loss calculations. MEV contract/address data: the mesoscopic data level, including the MEV type initiated by the address and the corresponding profit and loss statistics, return on investment, frequently traded tokens, the proportion of miners accepting MEV transactions, and a list of all MEV transactions that the address has participated in recently. If the address is a victim of sandwich transactions, you can also query the number of times it was attacked during the query period, the amount of loss, and the corresponding sandwich transactions and attackers. MEV market data: the macroscopic data level, reflects the activity and profit and loss of the overall market, including the profit and loss distribution and changes of transactions of different MEV types, as well as the ranking of the most profitable MEV transactions, as well as the popular tokens and token pair liquidity pools in MEV transactions. In the Reports menu in the upper right corner of the main function page, EigenPhi also provides daily summaries and rankings for the above data. MEV real-time stream monitoring: The real-time MEV transaction display stream can also facilitate searchers to quickly locate tokens and token pair liquidity pools that are currently experiencing price fluctuations. If the transaction tokens of the MEV real-time stream are all WETH/USDC, then it is very likely that there is a price difference between a certain WETH/USDC liquidity pool and other pools, resulting in a large number of MEV arbitrage opportunities. EigenTx: EigenPhi has developed a visualization tool for the flow of funds within transactions such as arbitrage and sandwich attacks. Use the address: https://eigenphi.io/mev/eigentx to enter the transaction hash, which can provide a flow diagram of all tokens in the transaction, allowing users to identify the trading strategy of the MEV transaction. For example, the following transaction is that the searcher sent WOOF/WETH to the two liquidity pools. There was an exchange price difference, so he first sent 0.01 ETH to the MEV robot contract, and then exchanged ETH for 29.76 WOOF in a Shibaswap liquidity pool (SSLP), and then exchanged this 29.76 WOOF for 9.959 WETH in a Uniswap V2 liquidity pool. This transaction paid the miner 0.9954 ETH as a mining fee, and transferred the rest of the money to two external addresses.
[Business Model] Free for the public. Provide data API and customized research cooperation services to institutions.
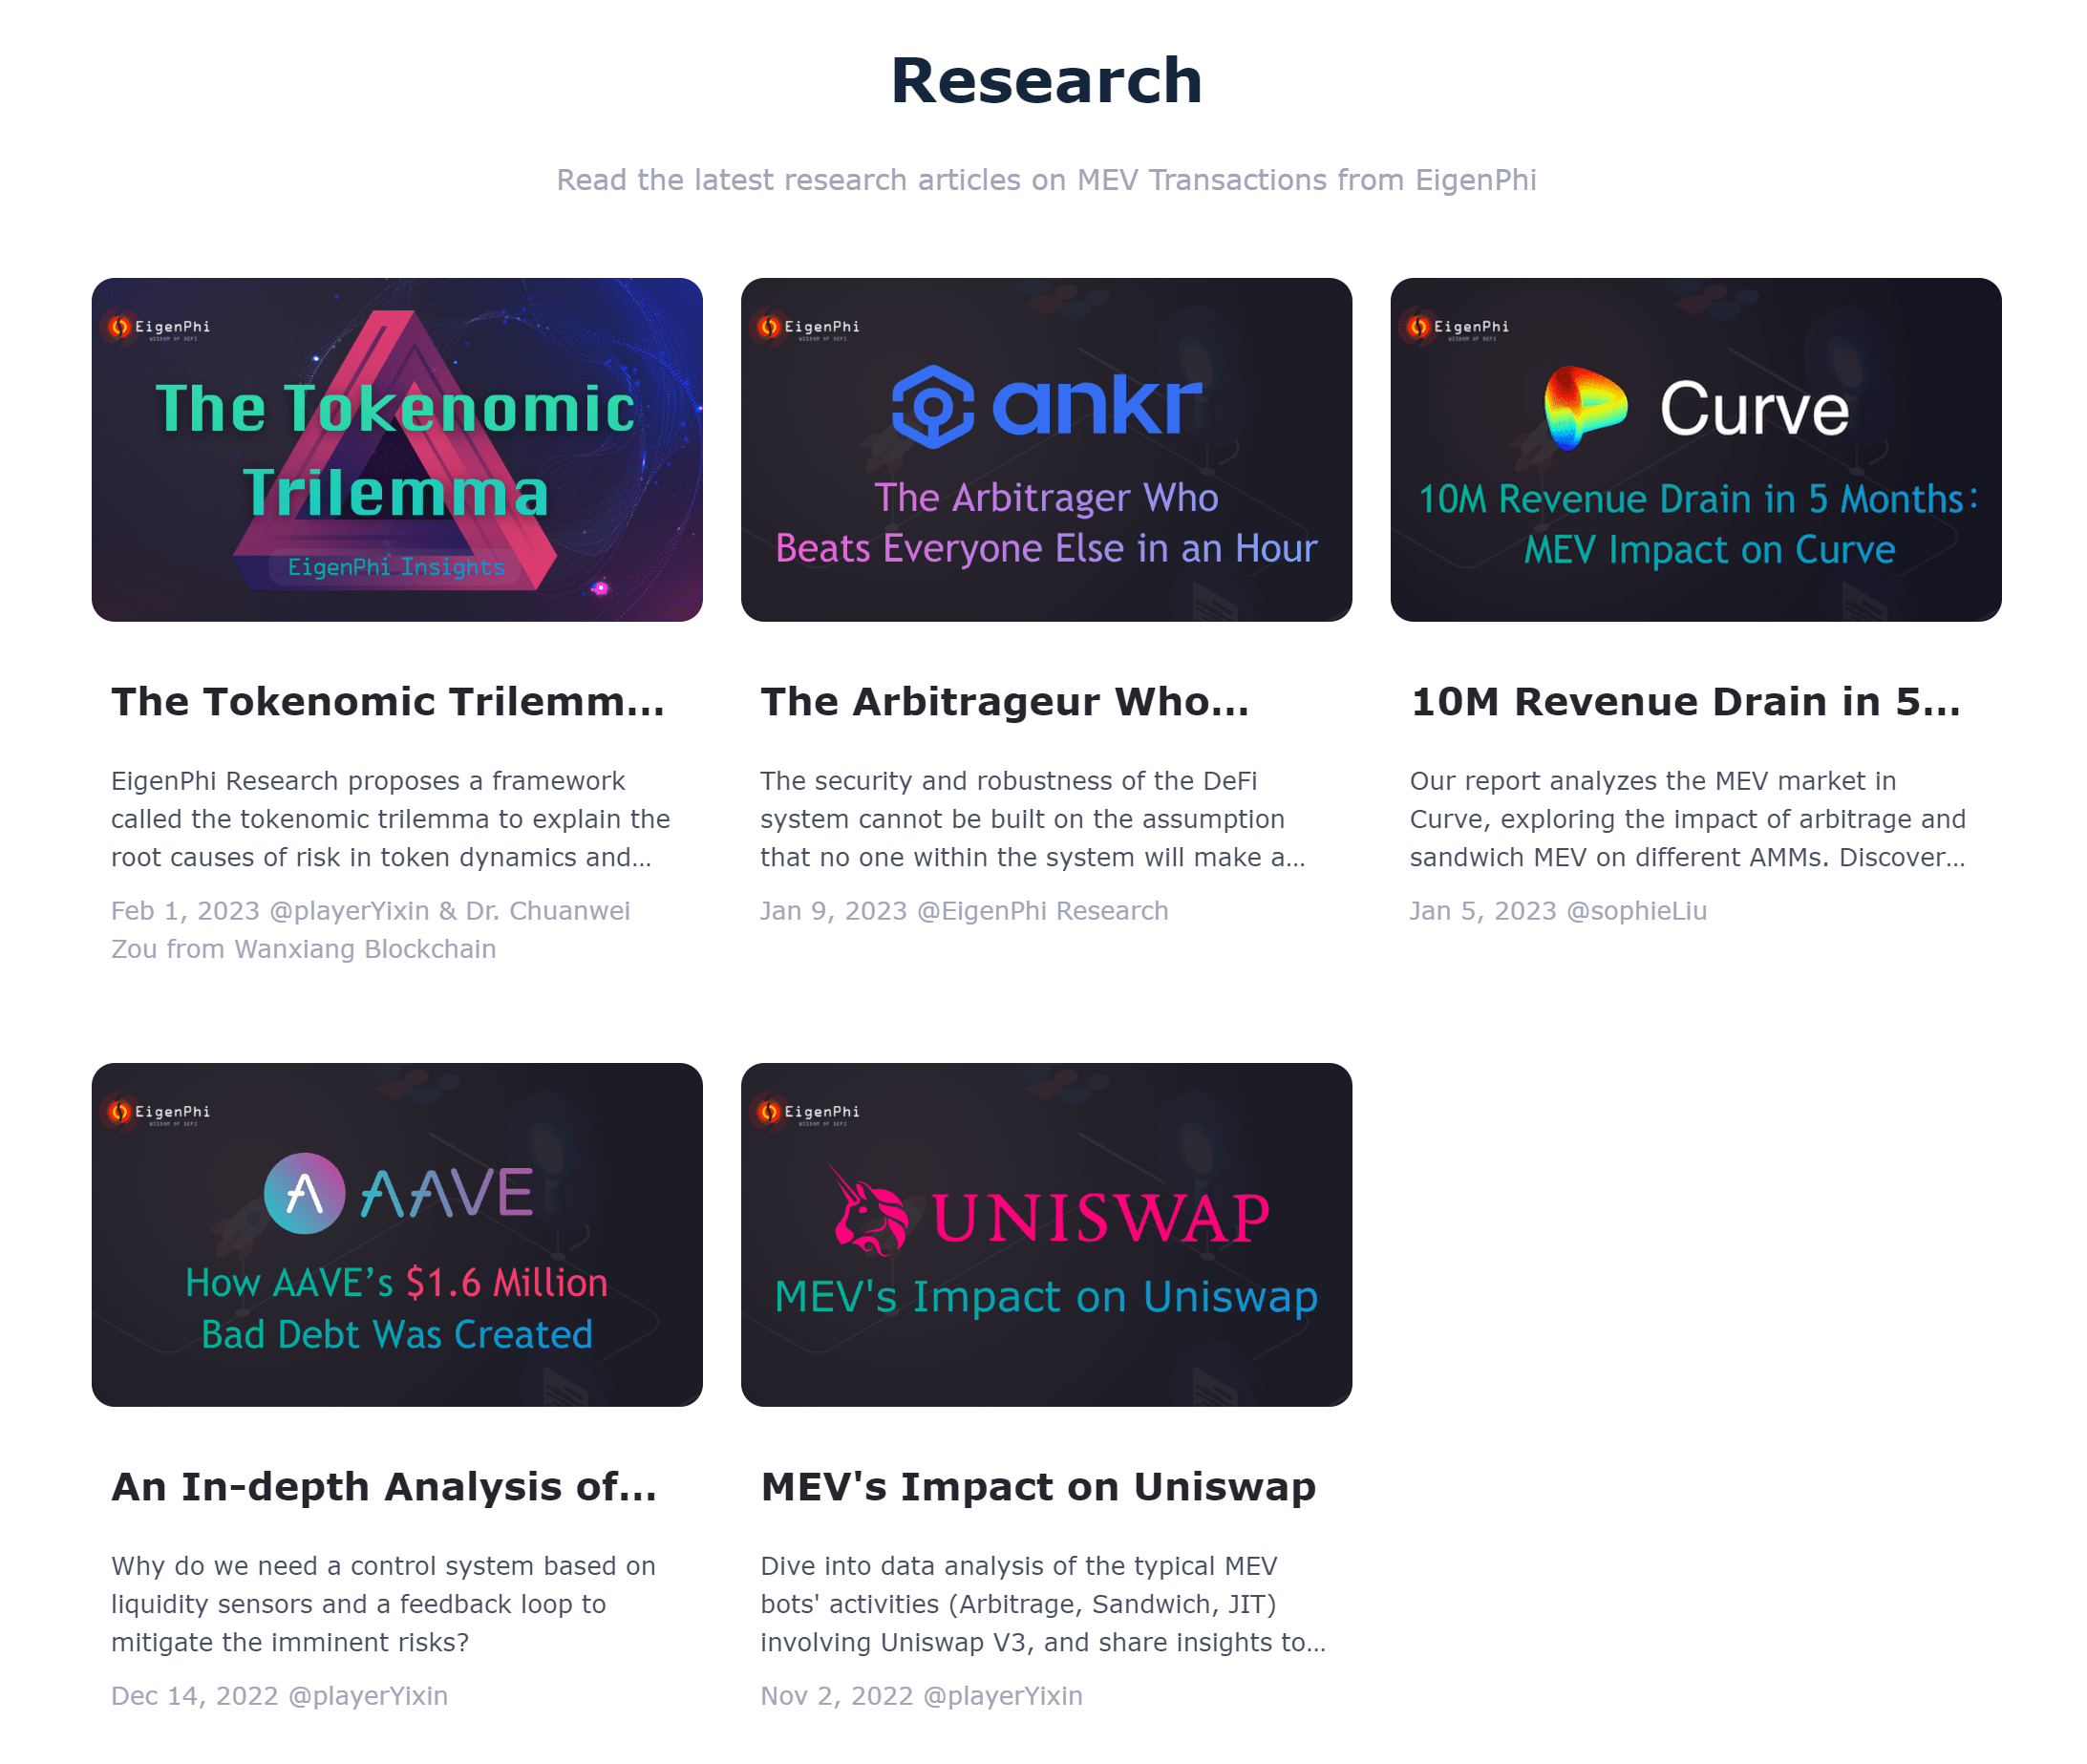
[Insight] EigenPhi has a research column on its official website, which provides data analysis research reports on MEV arbitrage, liquidity, and security incidents in the DeFi field.
0xScope
——https://0xscope.com/
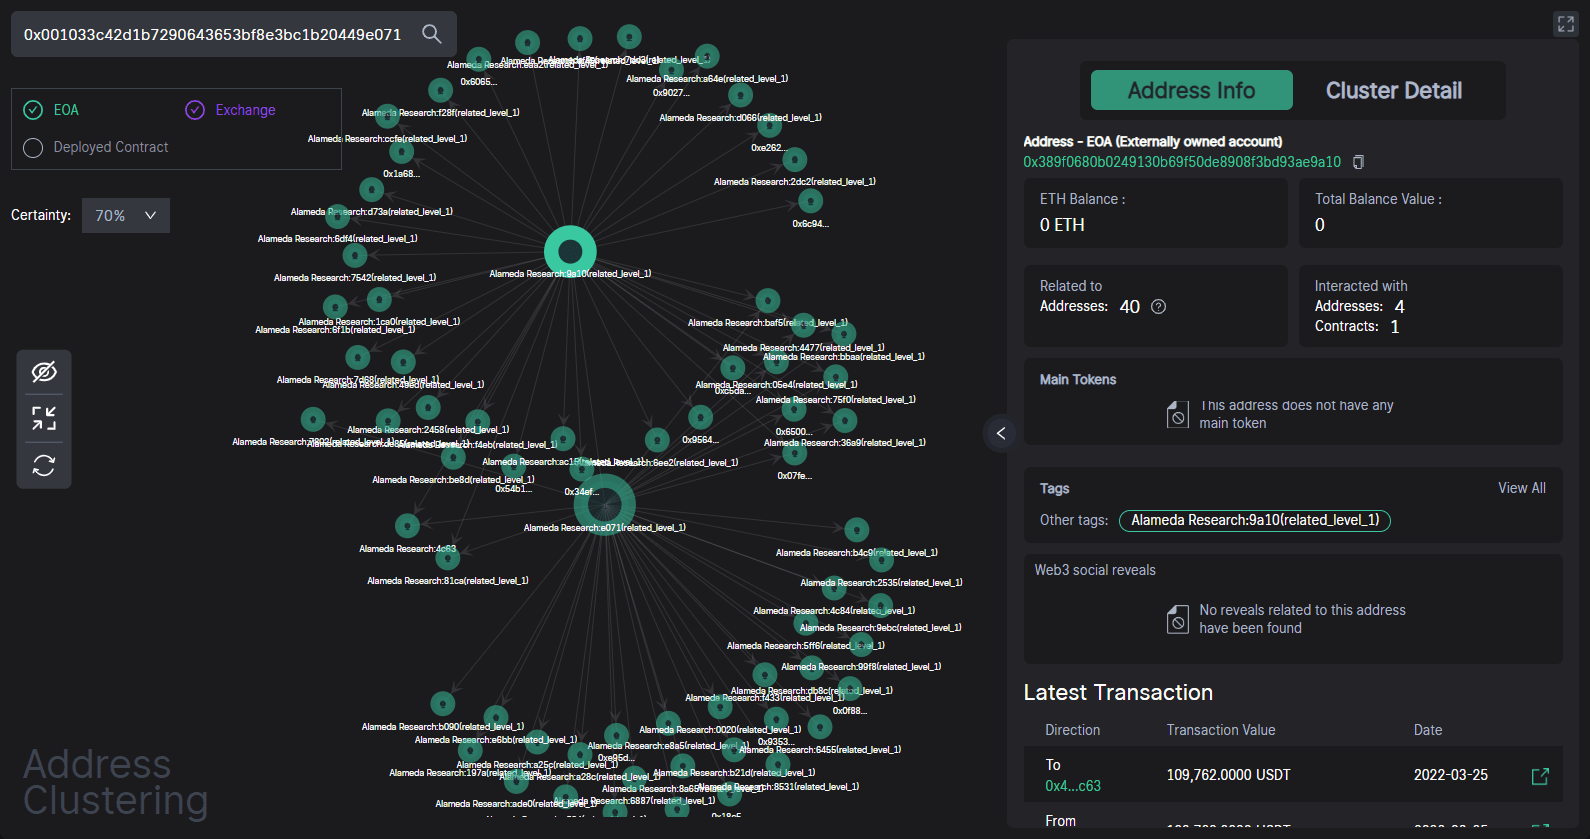
[Core Function] Similar to Nansen, the 0xScope protocol also focuses on address identification, but it emphasizes on the analysis of address association. According to 0xScope officials, the protocol aims to identify the actual controlling entity behind multiple addresses, that is, the "entity", through the address clustering algorithm, and view the transactions between associated addresses. Currently, 0xScope provides two data services, API and data analysis tool Watchers.
API: Developers can call 0xScope's API to query wallets, tokens, contracts and other addresses. API documentation: https://0xscope.readme.io/reference/chains
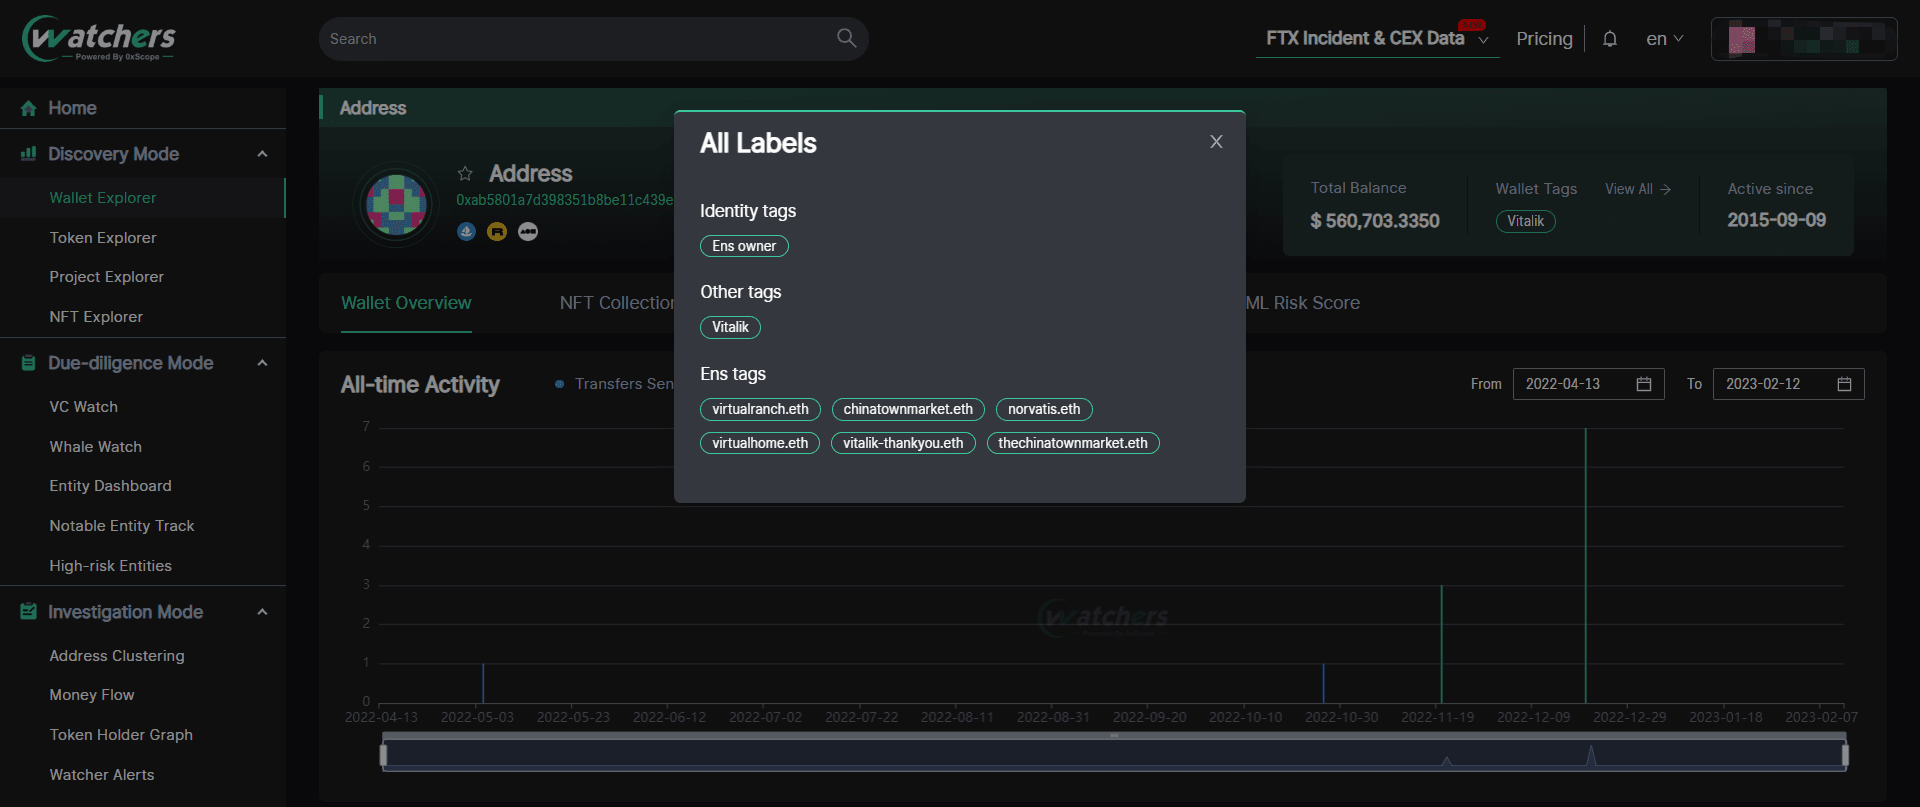
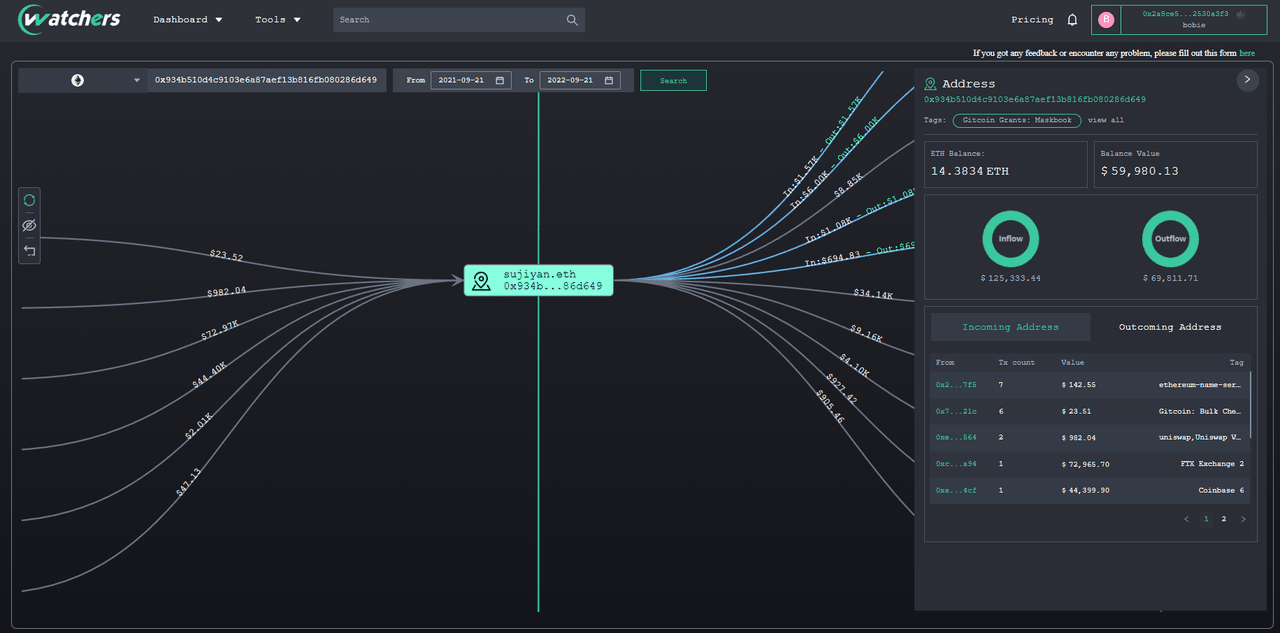
Watchers: A tool developed by 0xScope based on its own protocol. Use the following address: https://www.watchers.pro/. Similar to Nansen, Watchers also provides data such as address tags and recent address transaction activities. The difference is that watchers can also view associated addresses and associated transactions, query the flow of funds between addresses, and identify anti-money laundering (AML) risks for the entity's associated transactions.
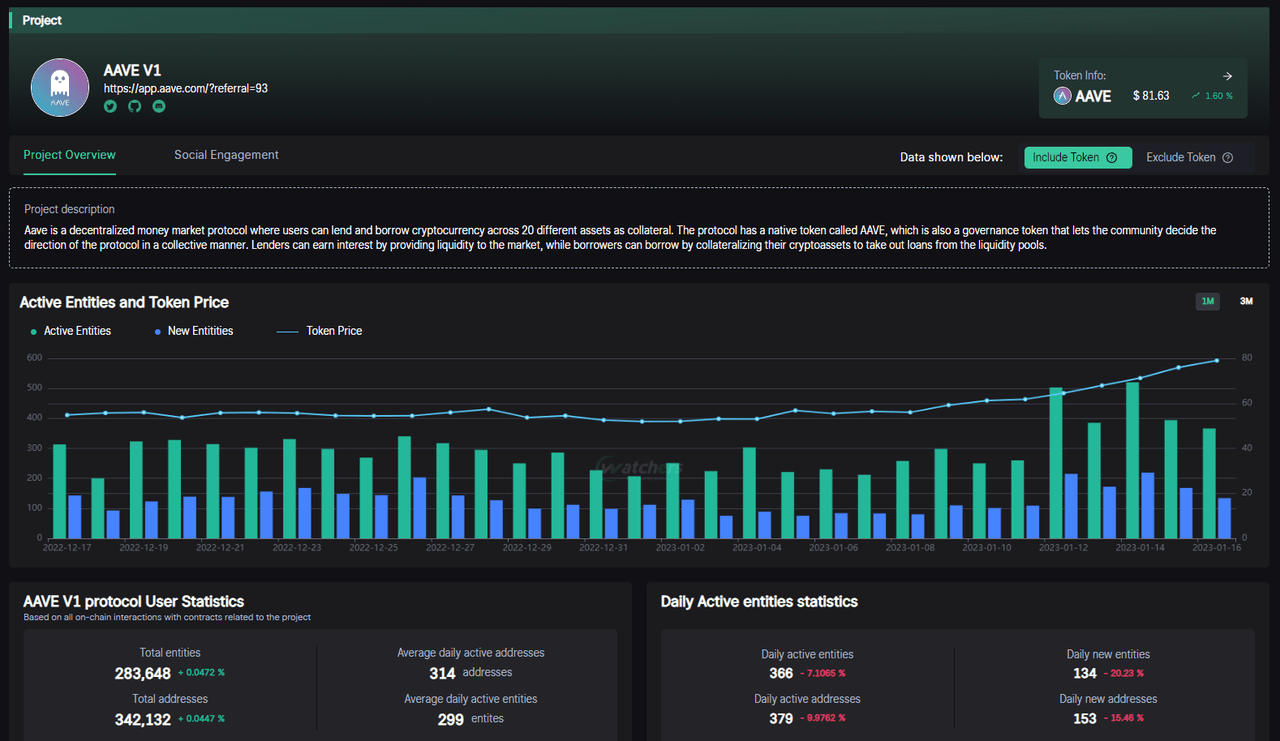
In addition, you can also view the specific situation of wallets, tokens, smart contracts and projects on watchers. For project evaluation, because the address aggregation algorithm used by Watchers can identify the unique entity behind multiple addresses, it is easy to find the real interactive user data after "dehydration", which is very suitable for due diligence. For example, for AAVE, you can query its current number of active entities and token prices. If the number of new addresses of a newly launched project is 100,000, but the corresponding entities are only 10,000, it means that the new users are likely to have brush volume behavior.
【Business Model】Subscription.
API Free Edition: 100,000 credits, limited to 5 calls per second. Access to public endpoints only. Advanced Edition: $180/month, 3 million credits, limited to 5 calls per second, access to API endpoints. Enterprise Edition: Custom pricing, custom API calls, access to all endpoints, and custom endpoints. Watchers Free Edition: The monitoring list tracks up to 5 entities; can only select addresses with a fixed confidence level of 70%; the association analysis of addresses can only view related addresses at the highest level of three; can only set 1 alert, and 50 alerts are pushed per hour. Pro users: $28/month, paid features include unlimited entity monitoring lists and addresses with custom confidence levels; can view related addresses at all levels of the query address collection; can set 10 alerts, and 200 alerts are pushed per hour.
[Insight] Watchers publishes some data dashboards for specific events and entities within the tool, including tracking dashboards for FTX & Alameda Research events and position overviews of major CEXs.
Summarize
1. The high added value of on-chain data analysis determines that the users of its services are highly differentiated, so the business model is mostly subscription-based, and the tiered pricing structure is steep. In terms of expansion path, there are currently two differentiated development scenarios for data products: one is to focus on the construction of developer and user communities, mainly for developers and technicians, and encourage users to independently publish data insights by incentivizing community contributions, thereby establishing a positive feedback loop for products. For example, Dune, the leading company, and rising stars Footprint, 0xScope, EigenPhi, etc. all pay relatively close attention to community building. One is based on the powerful analytical capabilities of its own products, mainly providing exclusive customized data insight services to professional institutional investors, such as Nansen and Glassnode. In my opinion, after establishing a mature developer community, through product iteration and community feedback, community-driven data tools can also produce relatively high-quality insights. For example, Footprint, EigenPhi, and 0xScope have currently released exclusive research reports. I believe that the combination of the two models will be the mainstream in the future.
2. The open and transparent nature of on-chain data means that on-chain data service providers can no longer make profits by selling real-time financial data and information like traditional financial data giants such as Bloomberg and Reuters, and instead turn to finding incremental growth through massive on-chain information. Currently, the data processing logic of leading on-chain data analysis tools is mostly in the transition stage from Web2 to Web3. In the future, data analysis services for DeFi must be rooted in the native data characteristics of Web3, especially the data insight capabilities based on smart contract code logic, which will become the most important moat for data analysis platforms in the Web3 world.
3. From the user's perspective, I also firmly believe that, compared with narrative-driven analysis logic, returning to data-driven analysis logic can better find rational context in the rising market sentiment. As one of the infrastructures for the development of the blockchain industry, the market value of the data analysis track will only continue to increase with the overall development of the industry, and the future prospects are broad.
Reference
[1] IOSG Weekly Brief | Current Status and Outlook of On-Chain Data Analysis Platform#132https://mp.weixin.qq.com/s/o1pO7unj3cUS9sWt4q_gBw
[2] When we talk about Web3 data, what are we talking about? |ZONFF Research https://mp.weixin.qq.com/s/TnVIj93CYchY0wnaazLRTg
[3] The Architecture of a Web 3.0 application
https://www.preethikasireddy.com/post/the-architecture-of-a-web-3-0-application
[4] Become an on-chain data analyst
https://sixdegreelab.gitbook.io/mastering-chain-analytics/00_introductions
[5] Seven Next-Generation Web3 Data Tools
https://mp.weixin.qq.com/s/CvMey3rPKRgdukYUCXw_4Q
[6] Understanding the Unicorns, Game Changers, and Future Stars in the Web3 Data Track in One Article | SevenX Ventures
https://www.panewslab.com/zh/articledetails/7f6b20861yji.html
[7] Inventory of on-chain data analysis tools | IOBC Capital
https://mp.weixin.qq.com/s/Oj2jl0WXoGOz_2DX7G5-lw
[8] Crypto Data Stack Landscape
https://twitter.com/zk7hao/status/1412076712444108805
[9] Data Track Project and Simple Data Analysis | UZ Capital
https://mp.weixin.qq.com/s/Pfq_YmayVXbLS0_XGSPVjw
[10] Data analysis tool Dune Analytics research report
https://foresightnews.pro/article/detail/8869
[11] A&T Family: Why did we invest in Footprint Analytics?
https://mp.weixin.qq.com/s/fAsBuNnKy4tc3c-X0lmJFg
0xScope Protocol: Web3.0 Watchers https://mp.weixin.qq.com/s/ReqafssBIMpKFIV1ARVRZA
[12] Nansen Wallet Labels & Emojis: What Do They Mean?
https://www.nansen.ai/guides/wallet-labels-emojis-what-do-they-mean
[13] Dune Documentation
https://dune.com/docs/
[14] EigenPhi user guide
https://eigenphi-1.gitbook.io/arbitrage-scan-user-guide/
https://docs.google.com/spreadsheets/d/1OZR9LITGc2RMVh65fO_N6TJlD2CYG3VdndTcE7Qs4qY/edit
[15] On-chain Data Analysis — A Crucial Tool to Evaluate the Market and Make Reasonable Investment Decisions
https://medium.com/polkafoundry/on-chain-data-analysis-a-crucial-tool-to-evaluate-the-market-and-make-reasonable-investment-4d17cfcbc3eb
[16] DeFi Statistics [updated in 2023] by Nansen
https://www.nansen.ai/guides/defi-statistics-in-2022
[17] Web 3.0 Blockchain Market Size, Share & Trends Analysis Report
https://www.grandviewresearch.com/industry-analysis/web-3-0-blockchain-market-report
[18] Worldwide Big Data Business Analytics Revenue
https://www.statista.com/statistics/551501/worldwide-big-data-business-analytics-revenue/