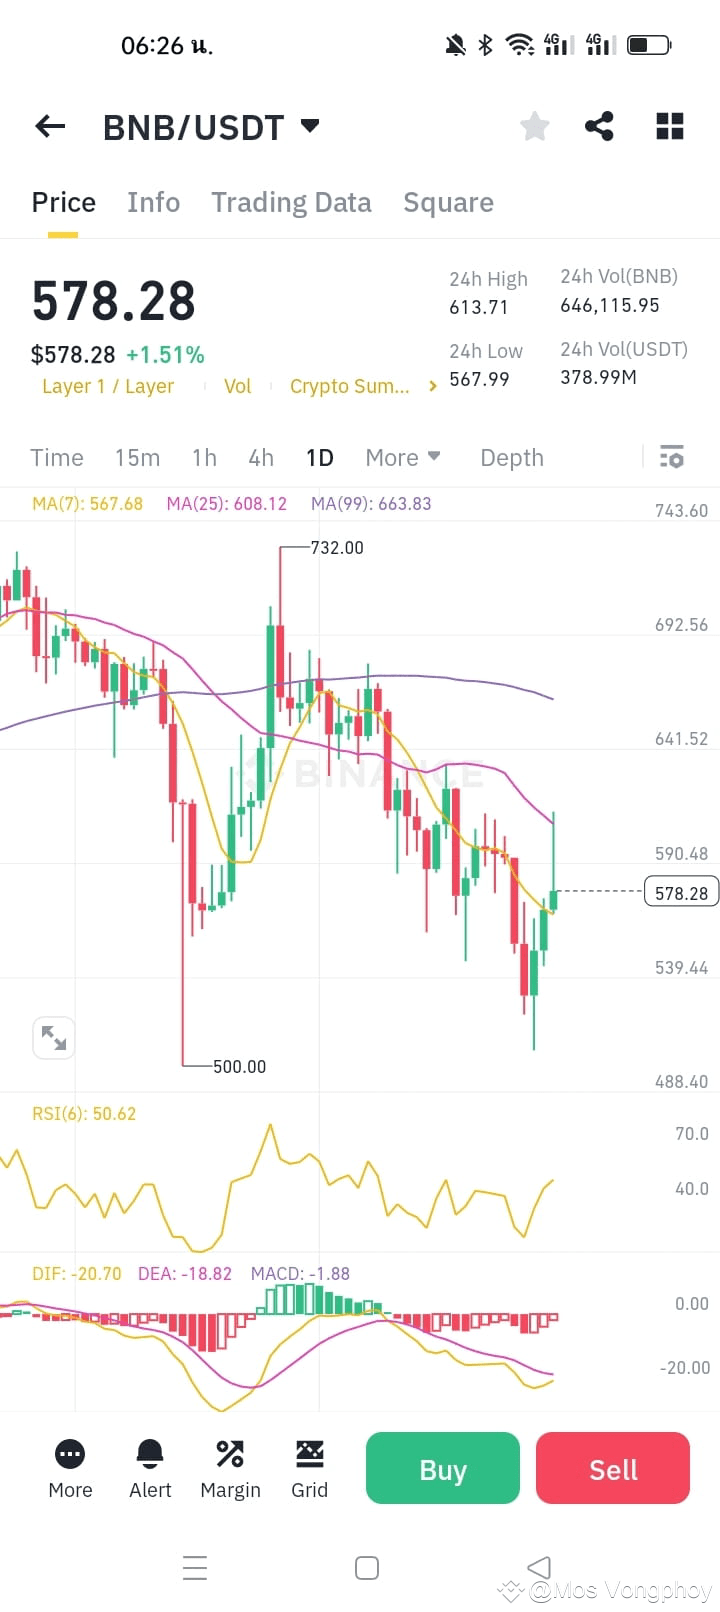
BNB/USDT Price Trend Analysis
Based on the chart and indicators, here are key factors to consider:
Price Trend and Moving Averages (MA)
The current price is 578.28 USDT
The 7-day MA (567.68) is below the price, indicating potential recovery
However, the 25-day MA (608.12) and 99-day MA (663.83) remain higher, suggesting that the downtrend is still intact
Support and Resistance Levels
Support: Around 567.99 USDT
Resistance: First at 590.48 USDT, then at 608.12 USDT
RSI (Relative Strength Index)
RSI(6) is at 50.62, which is neutral, indicating no strong buying or selling momentum
MACD (Moving Average Convergence Divergence)
DIF (-20.70) and DEA (-18.82) are below zero, indicating a long-term downtrend
MACD (-1.88) is starting to turn upward, hinting at a possible short-term recovery
Conclusion
There are signs of a short-term recovery as the price moves above the MA7
However, the long-term trend is still bearish due to higher MAs pointing downward
RSI suggests a neutral market with no strong momentum
If the price breaks above 590.48 USDT and MA25 (608.12 USDT), further upside is possible
If it drops below 567.99 USDT, it may retest support around 500 USDT$BNB
Based on the chart and indicators, here are key factors to consider:
Price Trend and Moving Averages (MA)
The current price is 578.28 USDT
The 7-day MA (567.68) is below the price, indicating potential recovery
However, the 25-day MA (608.12) and 99-day MA (663.83) remain higher, suggesting that the downtrend is still intact
Support and Resistance Levels
Support: Around 567.99 USDT
Resistance: First at 590.48 USDT, then at 608.12 USDT
RSI (Relative Strength Index)
RSI(6) is at 50.62, which is neutral, indicating no strong buying or selling momentum
MACD (Moving Average Convergence Divergence)
DIF (-20.70) and DEA (-18.82) are below zero, indicating a long-term downtrend
MACD (-1.88) is starting to turn upward, hinting at a possible short-term recovery
Conclusion
There are signs of a short-term recovery as the price moves above the MA7
However, the long-term trend is still bearish due to higher MAs pointing downward
RSI suggests a neutral market with no strong momentum
If the price breaks above 590.48 USDT and MA25 (608.12 USDT), further upside is possible
If it drops below 567.99 USDT, it may retest support around 500 USDT$BNB