


**Stock-to-Flow Pattern Analysis and Bitcoin Price Predictions**
Hello everyone, today we will talk about one of the most famous models used to predict the movement of the Bitcoin price, which is the Stock-to-Flow (S2F) model. This model is based on the scarcity of Bitcoin, as it links the current stock to the future production rate, which is greatly affected by halving events that reduce the number of new Bitcoins entering the market.
Current status
According to the model, Bitcoin is currently at the bottom of a new bullish cycle. Historically, this phase is known as the beginning of a parabolic bullish wave or a major bullish wave that repeats with every halving cycle.
Model signals
- Typically, the pattern data shows that historical peaks occur when the indicator turns light green.
- At the same time, the price intersects the red line in the pattern, which is the line that represents the target value based on the supply and demand rate.
What does this mean?
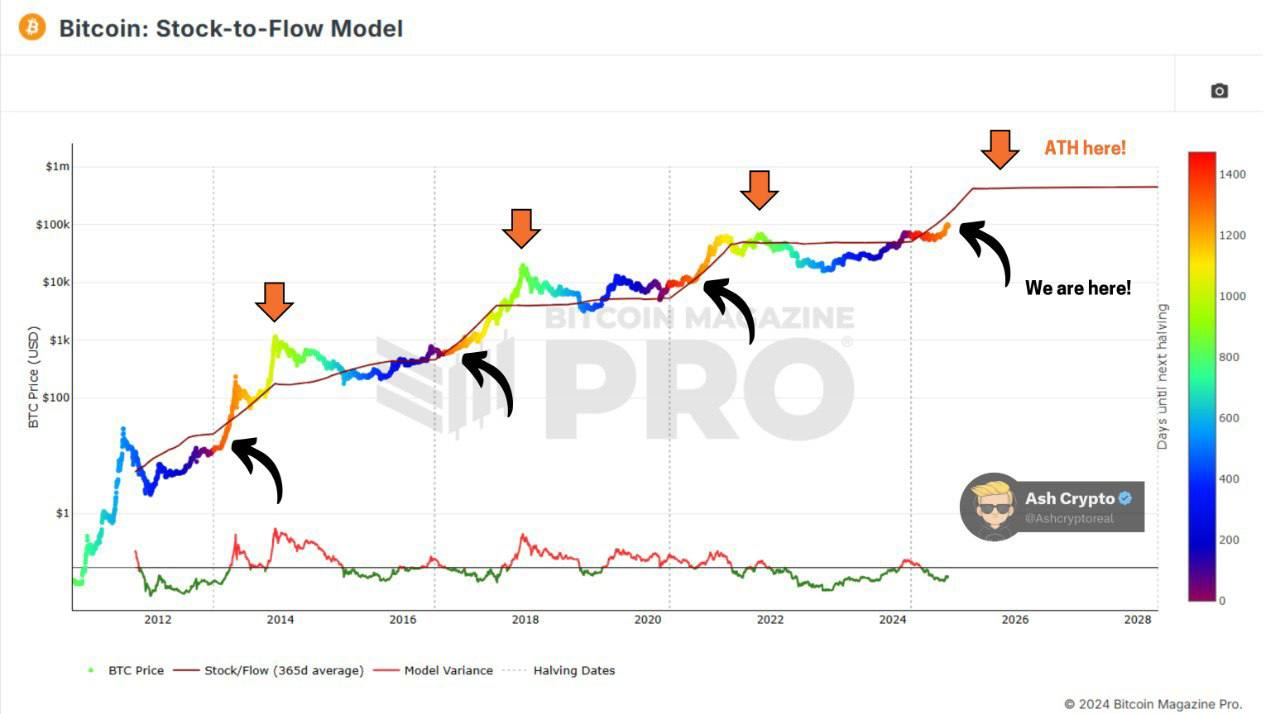
If the market movement continues in line with this pattern as it did in previous cycles:
The big climb has now begun.
- The new historic summit is expected to be between September and October 2025.
- The expected price may reach $400,000 per Bitcoin.
summary
We are at the beginning of an exciting phase that could change the face of the cryptocurrency market. Of course, let's not forget that these analyses are based on historical data, so predictions remain risky.
Follow us for more analysis and share your thoughts on the future of Bitcoin!
#MarketDownturn #BTC☀ #BNB $BTC

