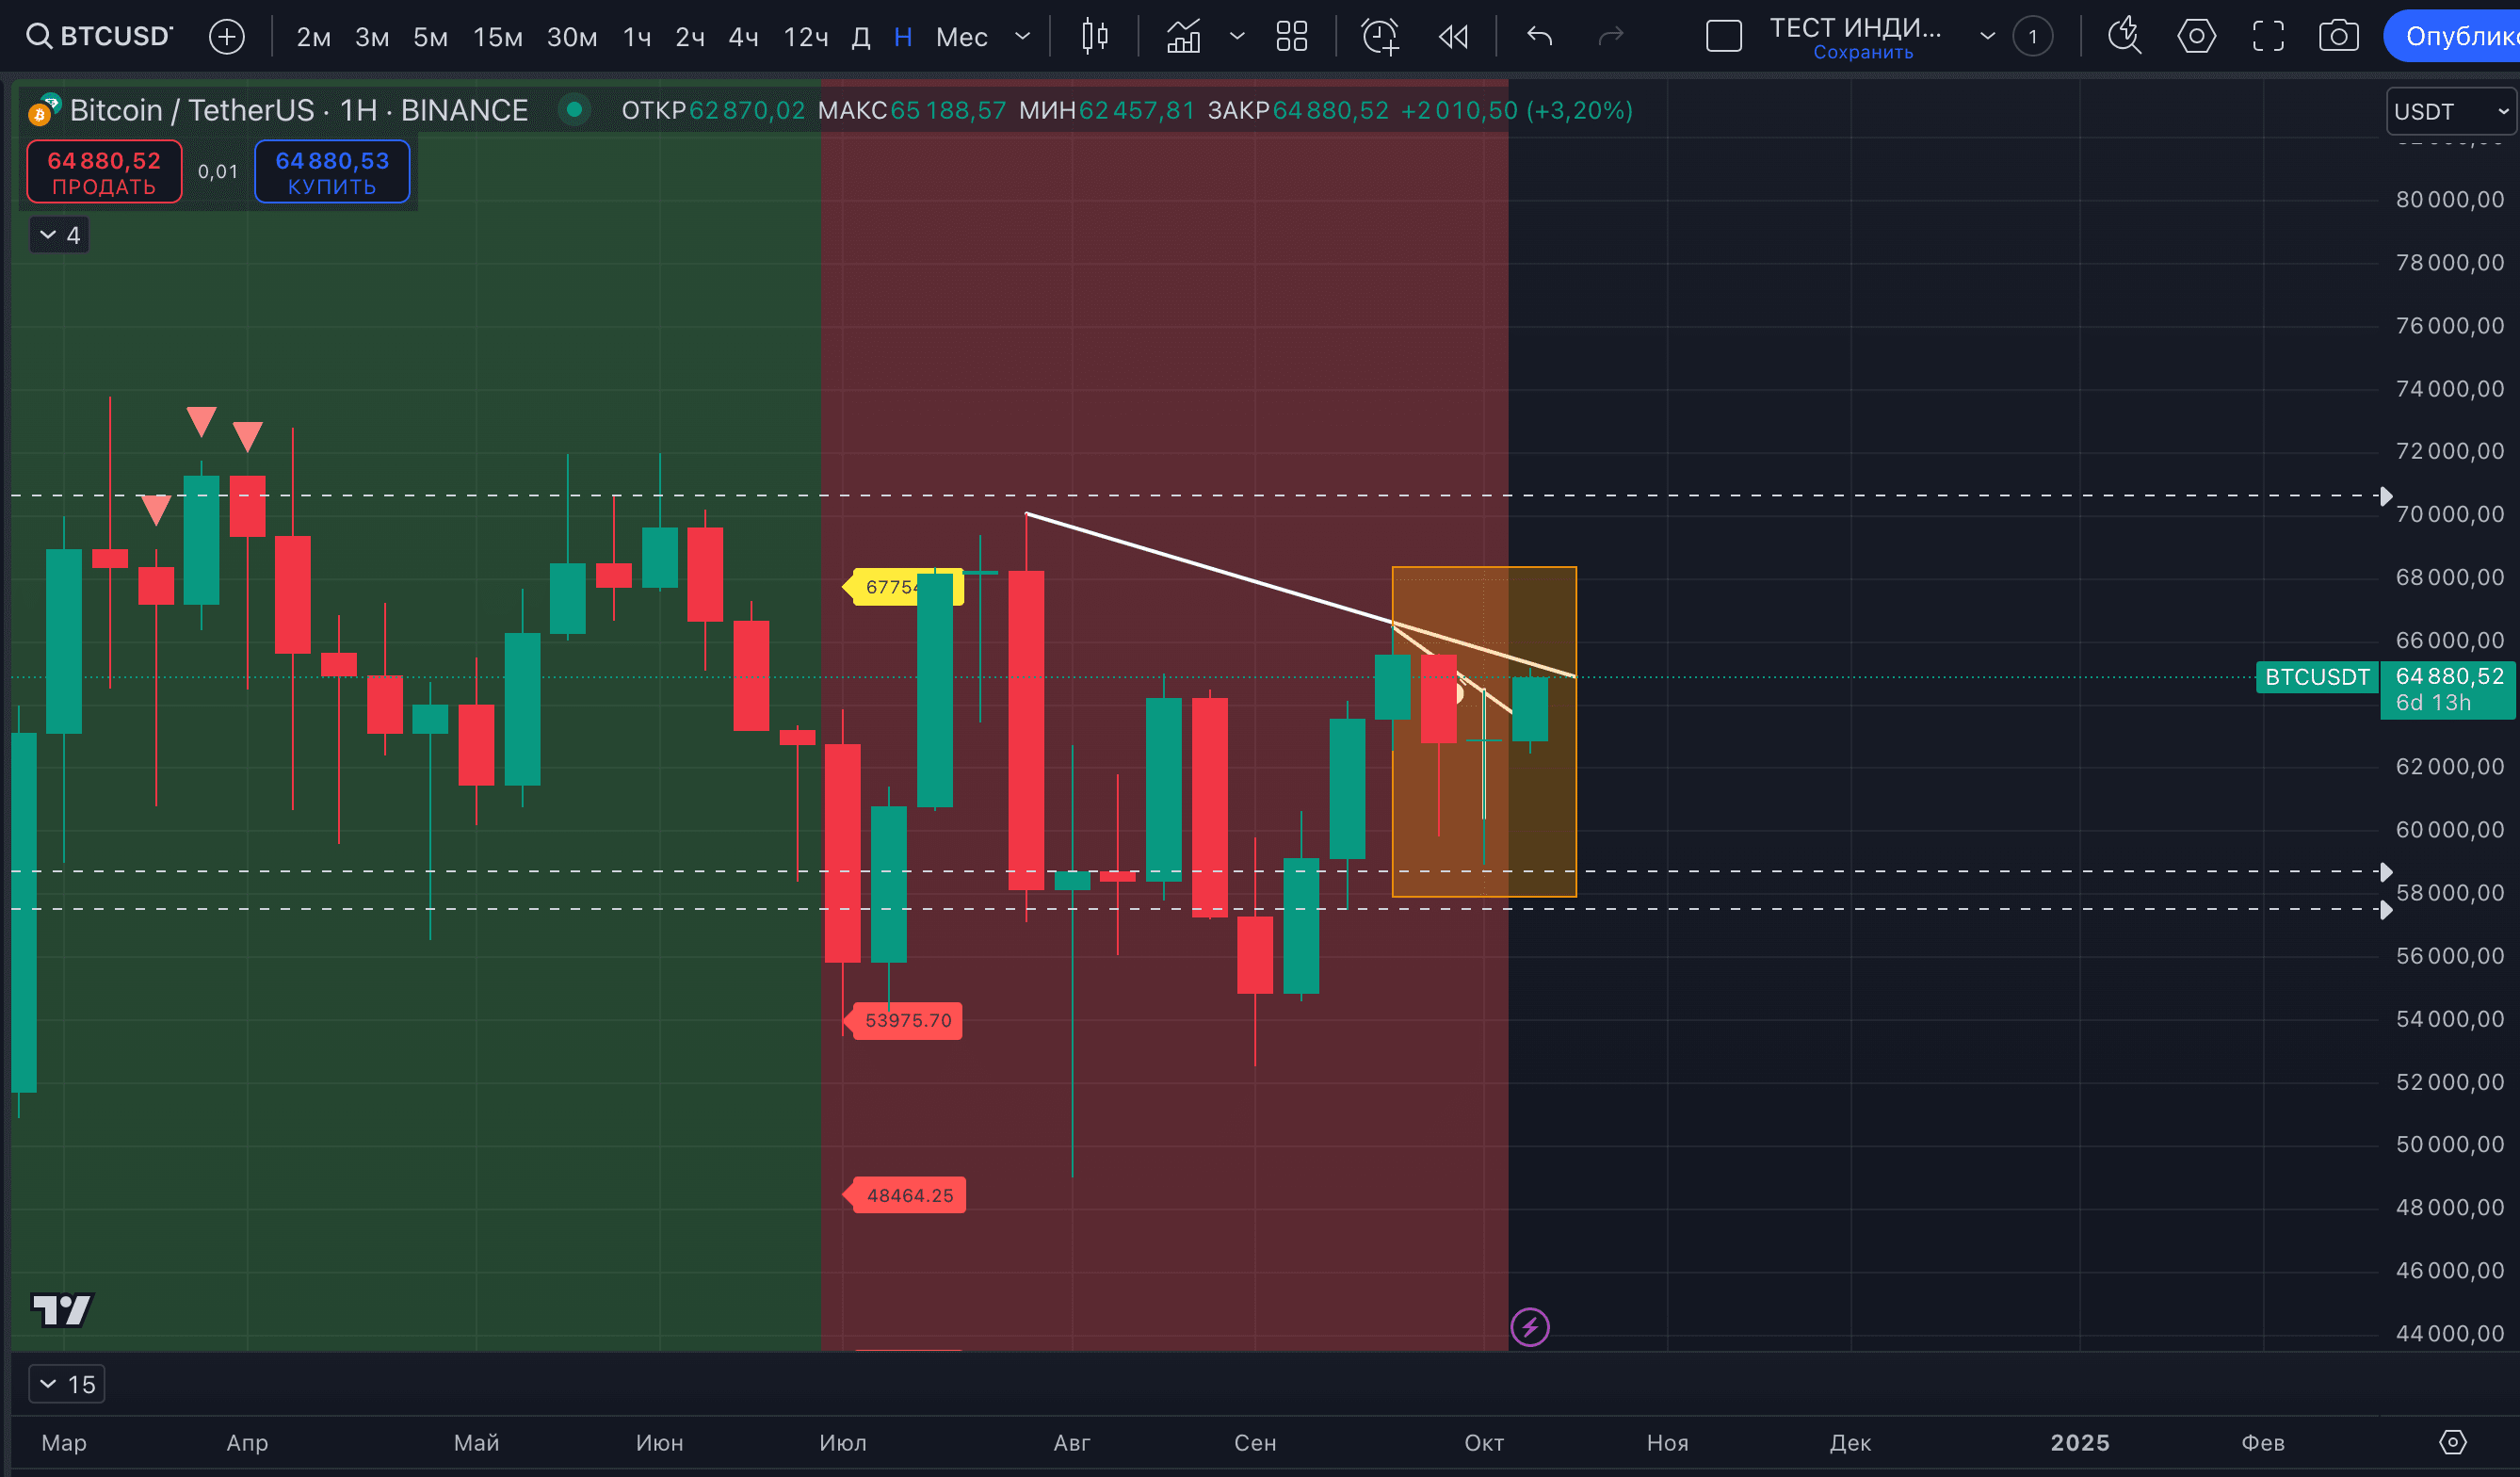
BTC rate tested psychological $65,000.
Our forecast that the indicator suggests a local correction or range remains in force. Taking into account the psychological mark test - often, in the presence of reversal signals, this becomes the trigger. Therefore, for those who use P73 Trend & Target Dynamics and trade younger TFs - it makes sense to follow the signals.
In the meantime, we will show the older TFs that were not in today's first analysis. The last basic target on the two-hour TF has worked. The most interesting for us now is the 12-hour TF.
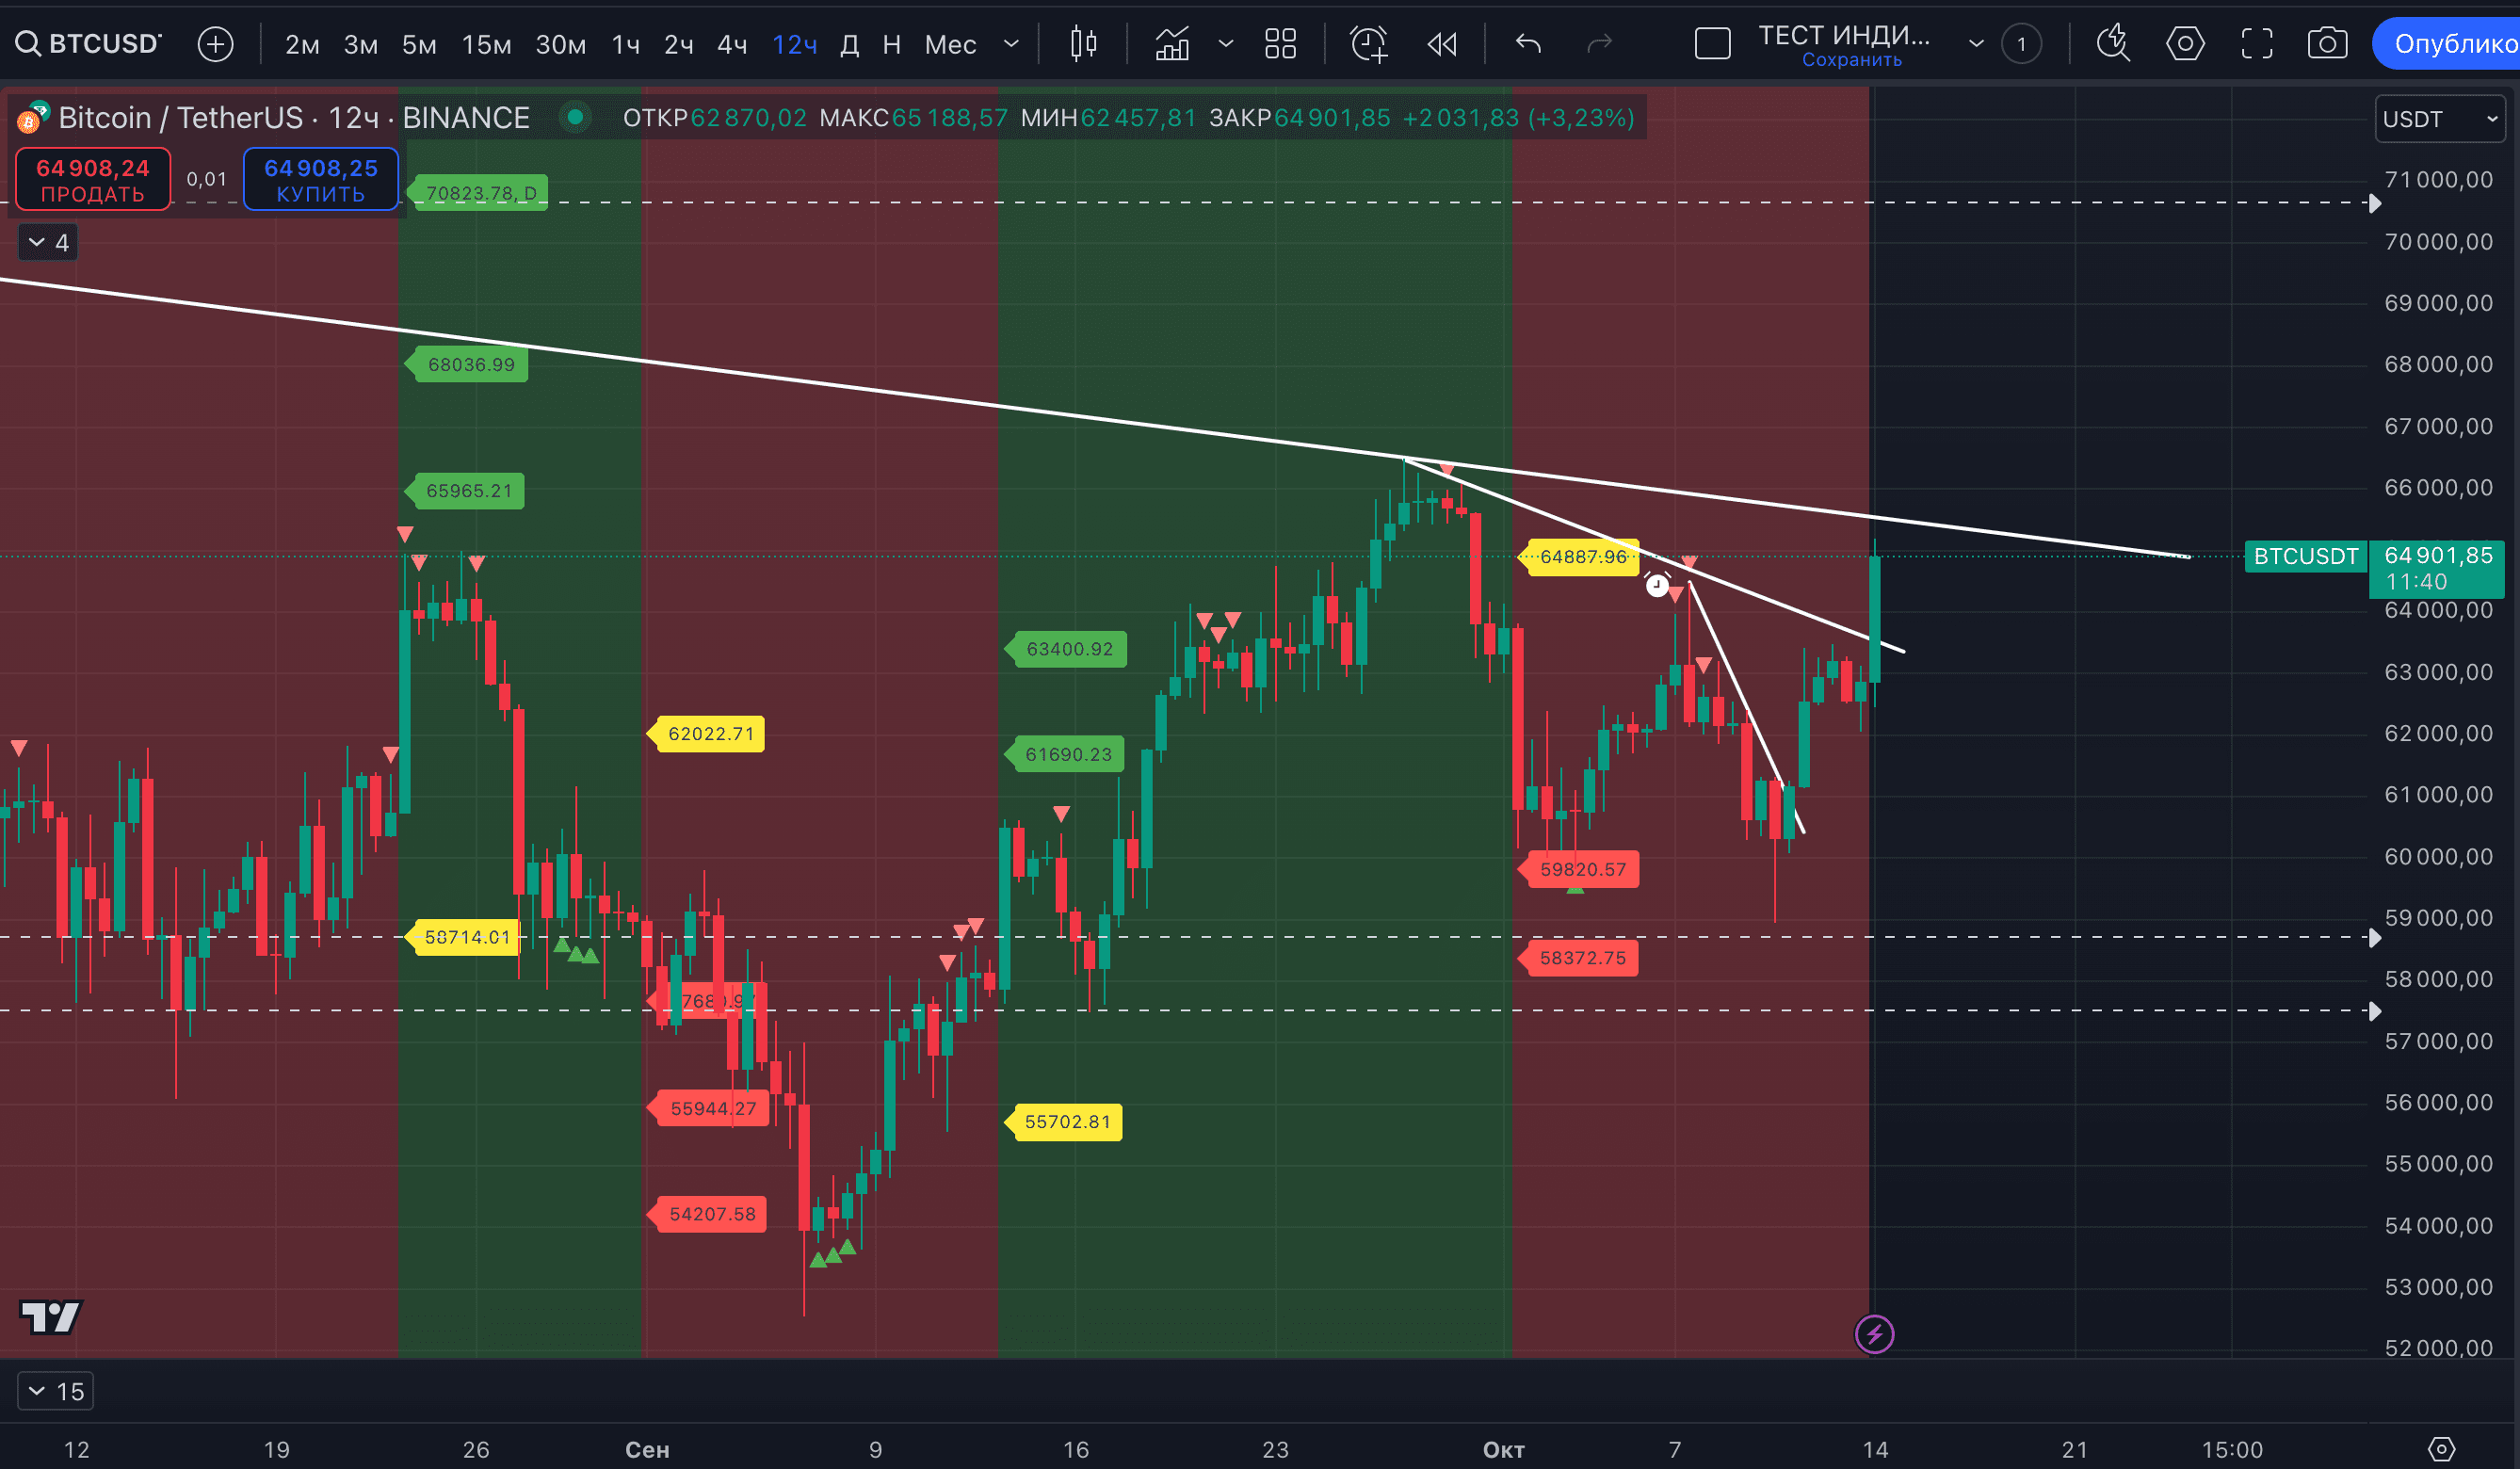
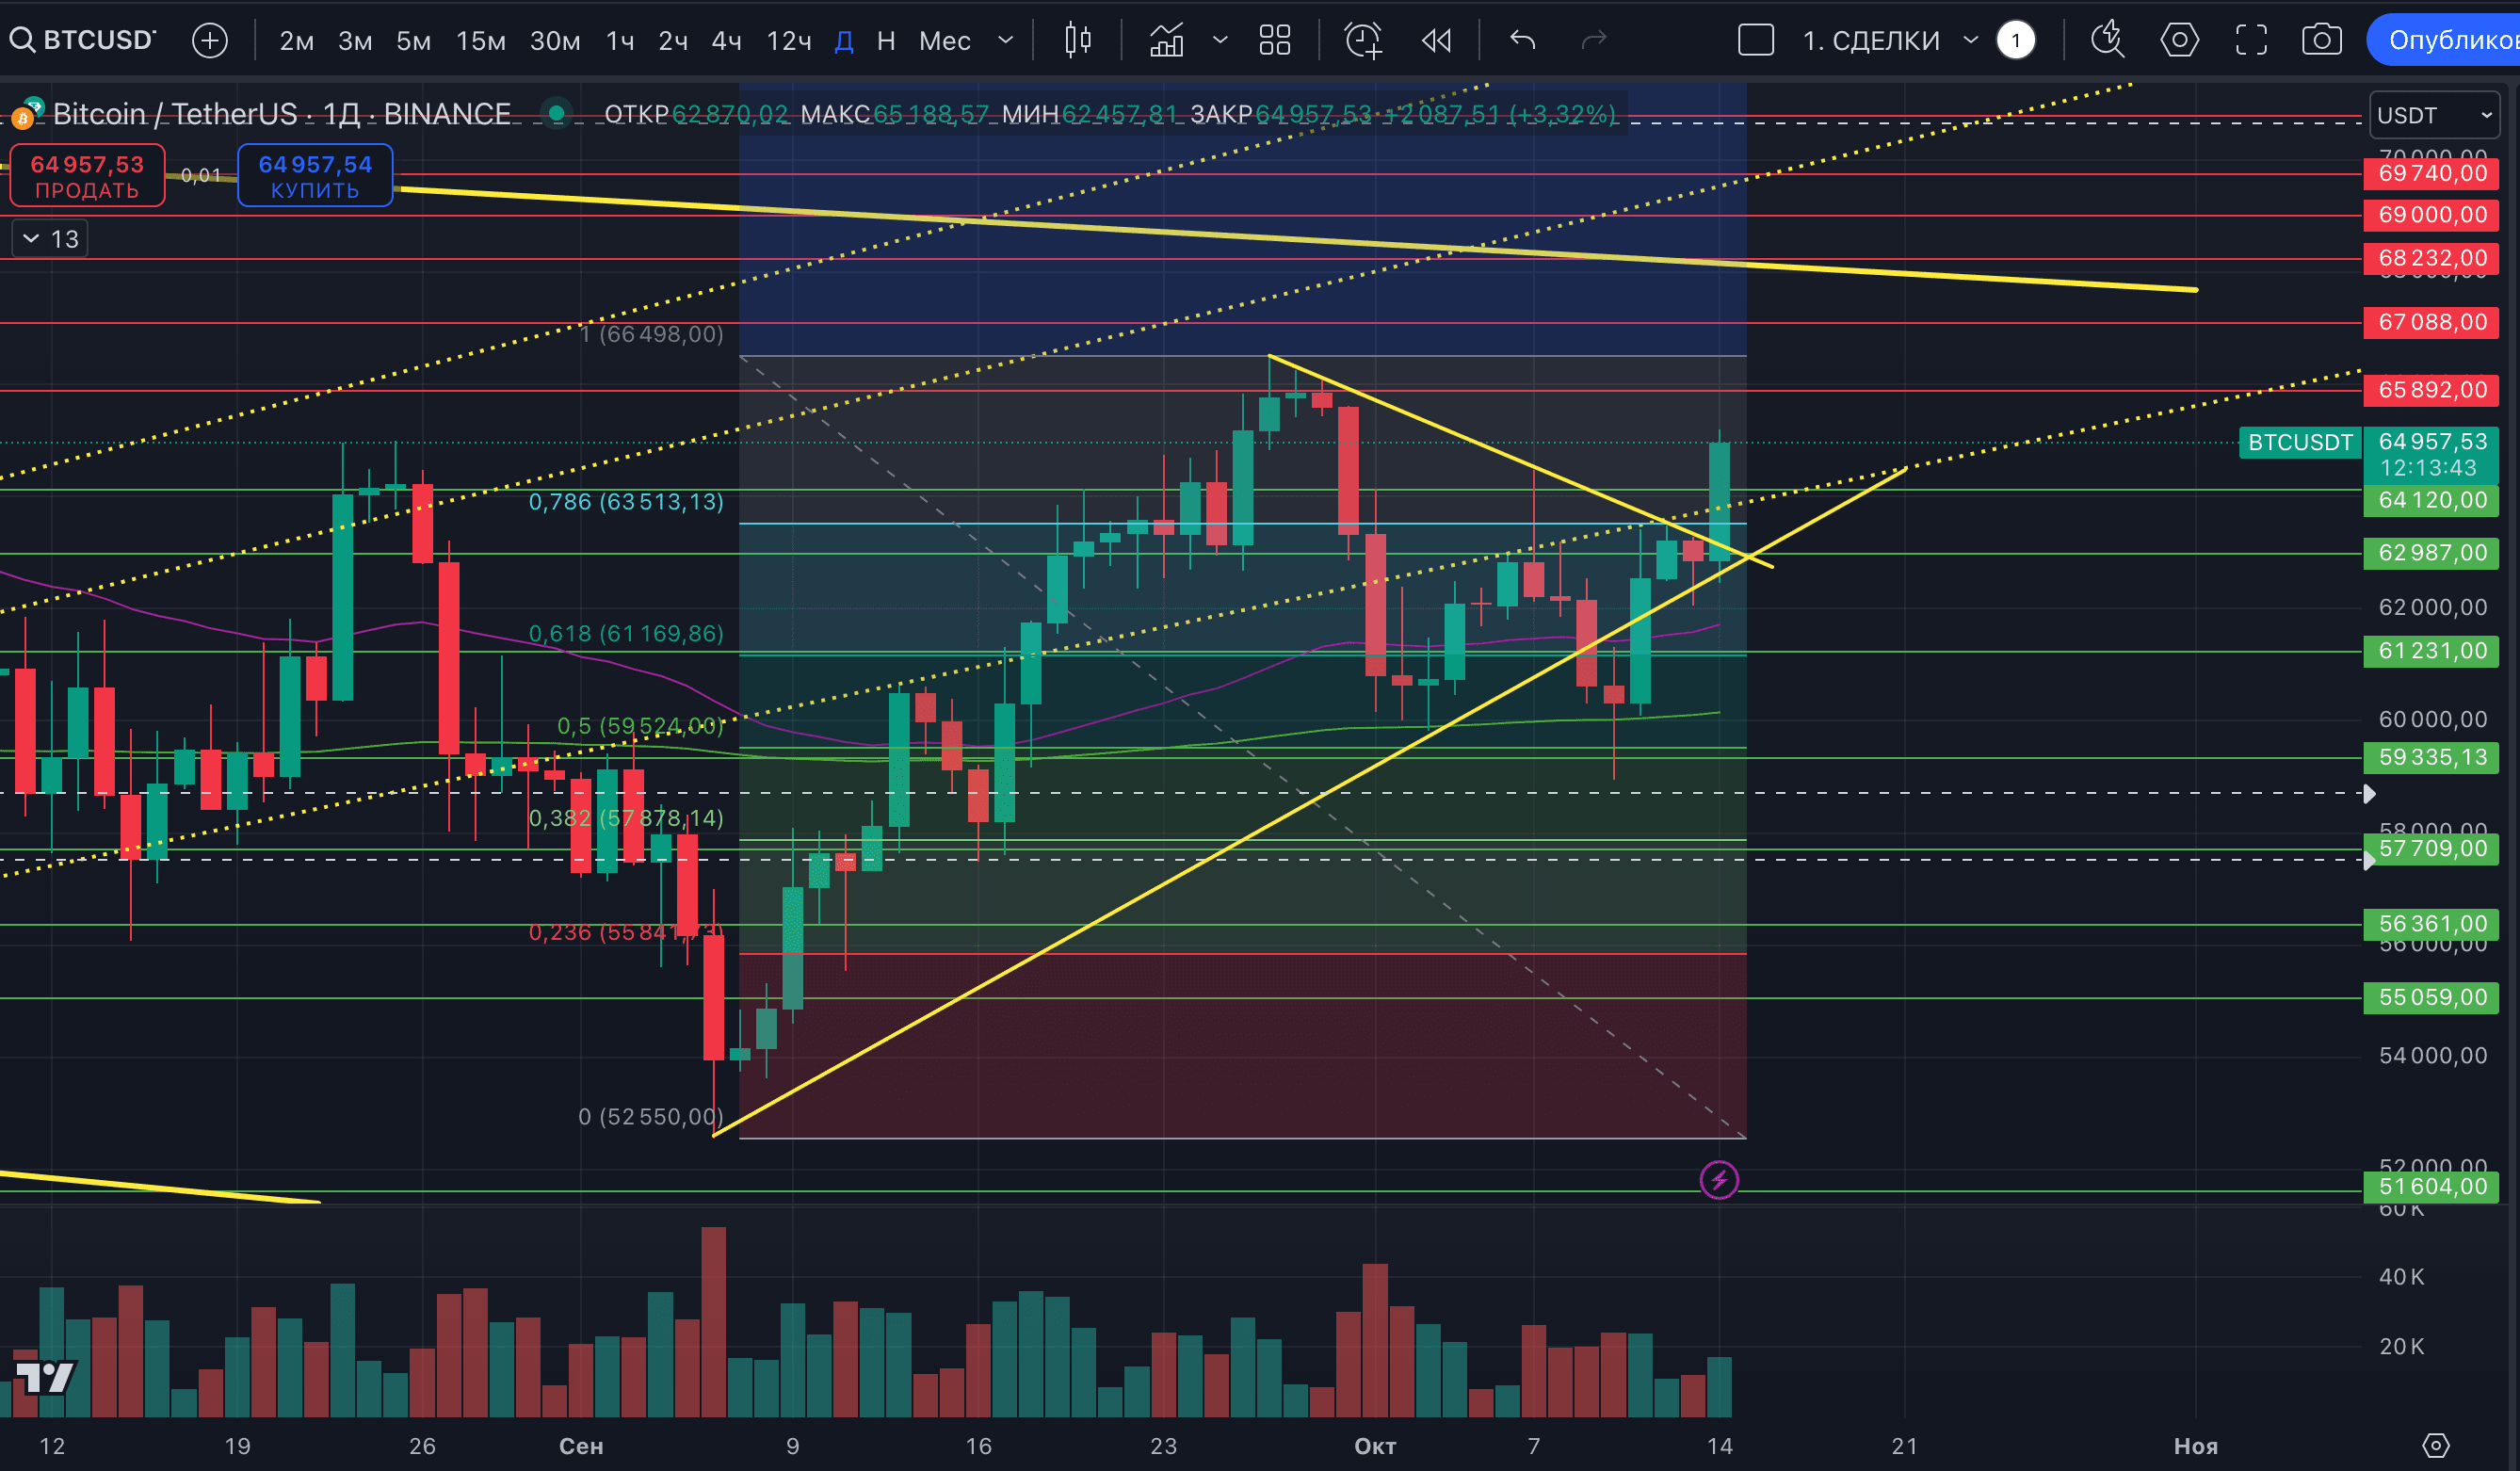
There is a chance (for now only a chance) of transition to a stable uptrend. Let's see how the candle closes, we set an alert. The uptrend is maintained on the daily TF.
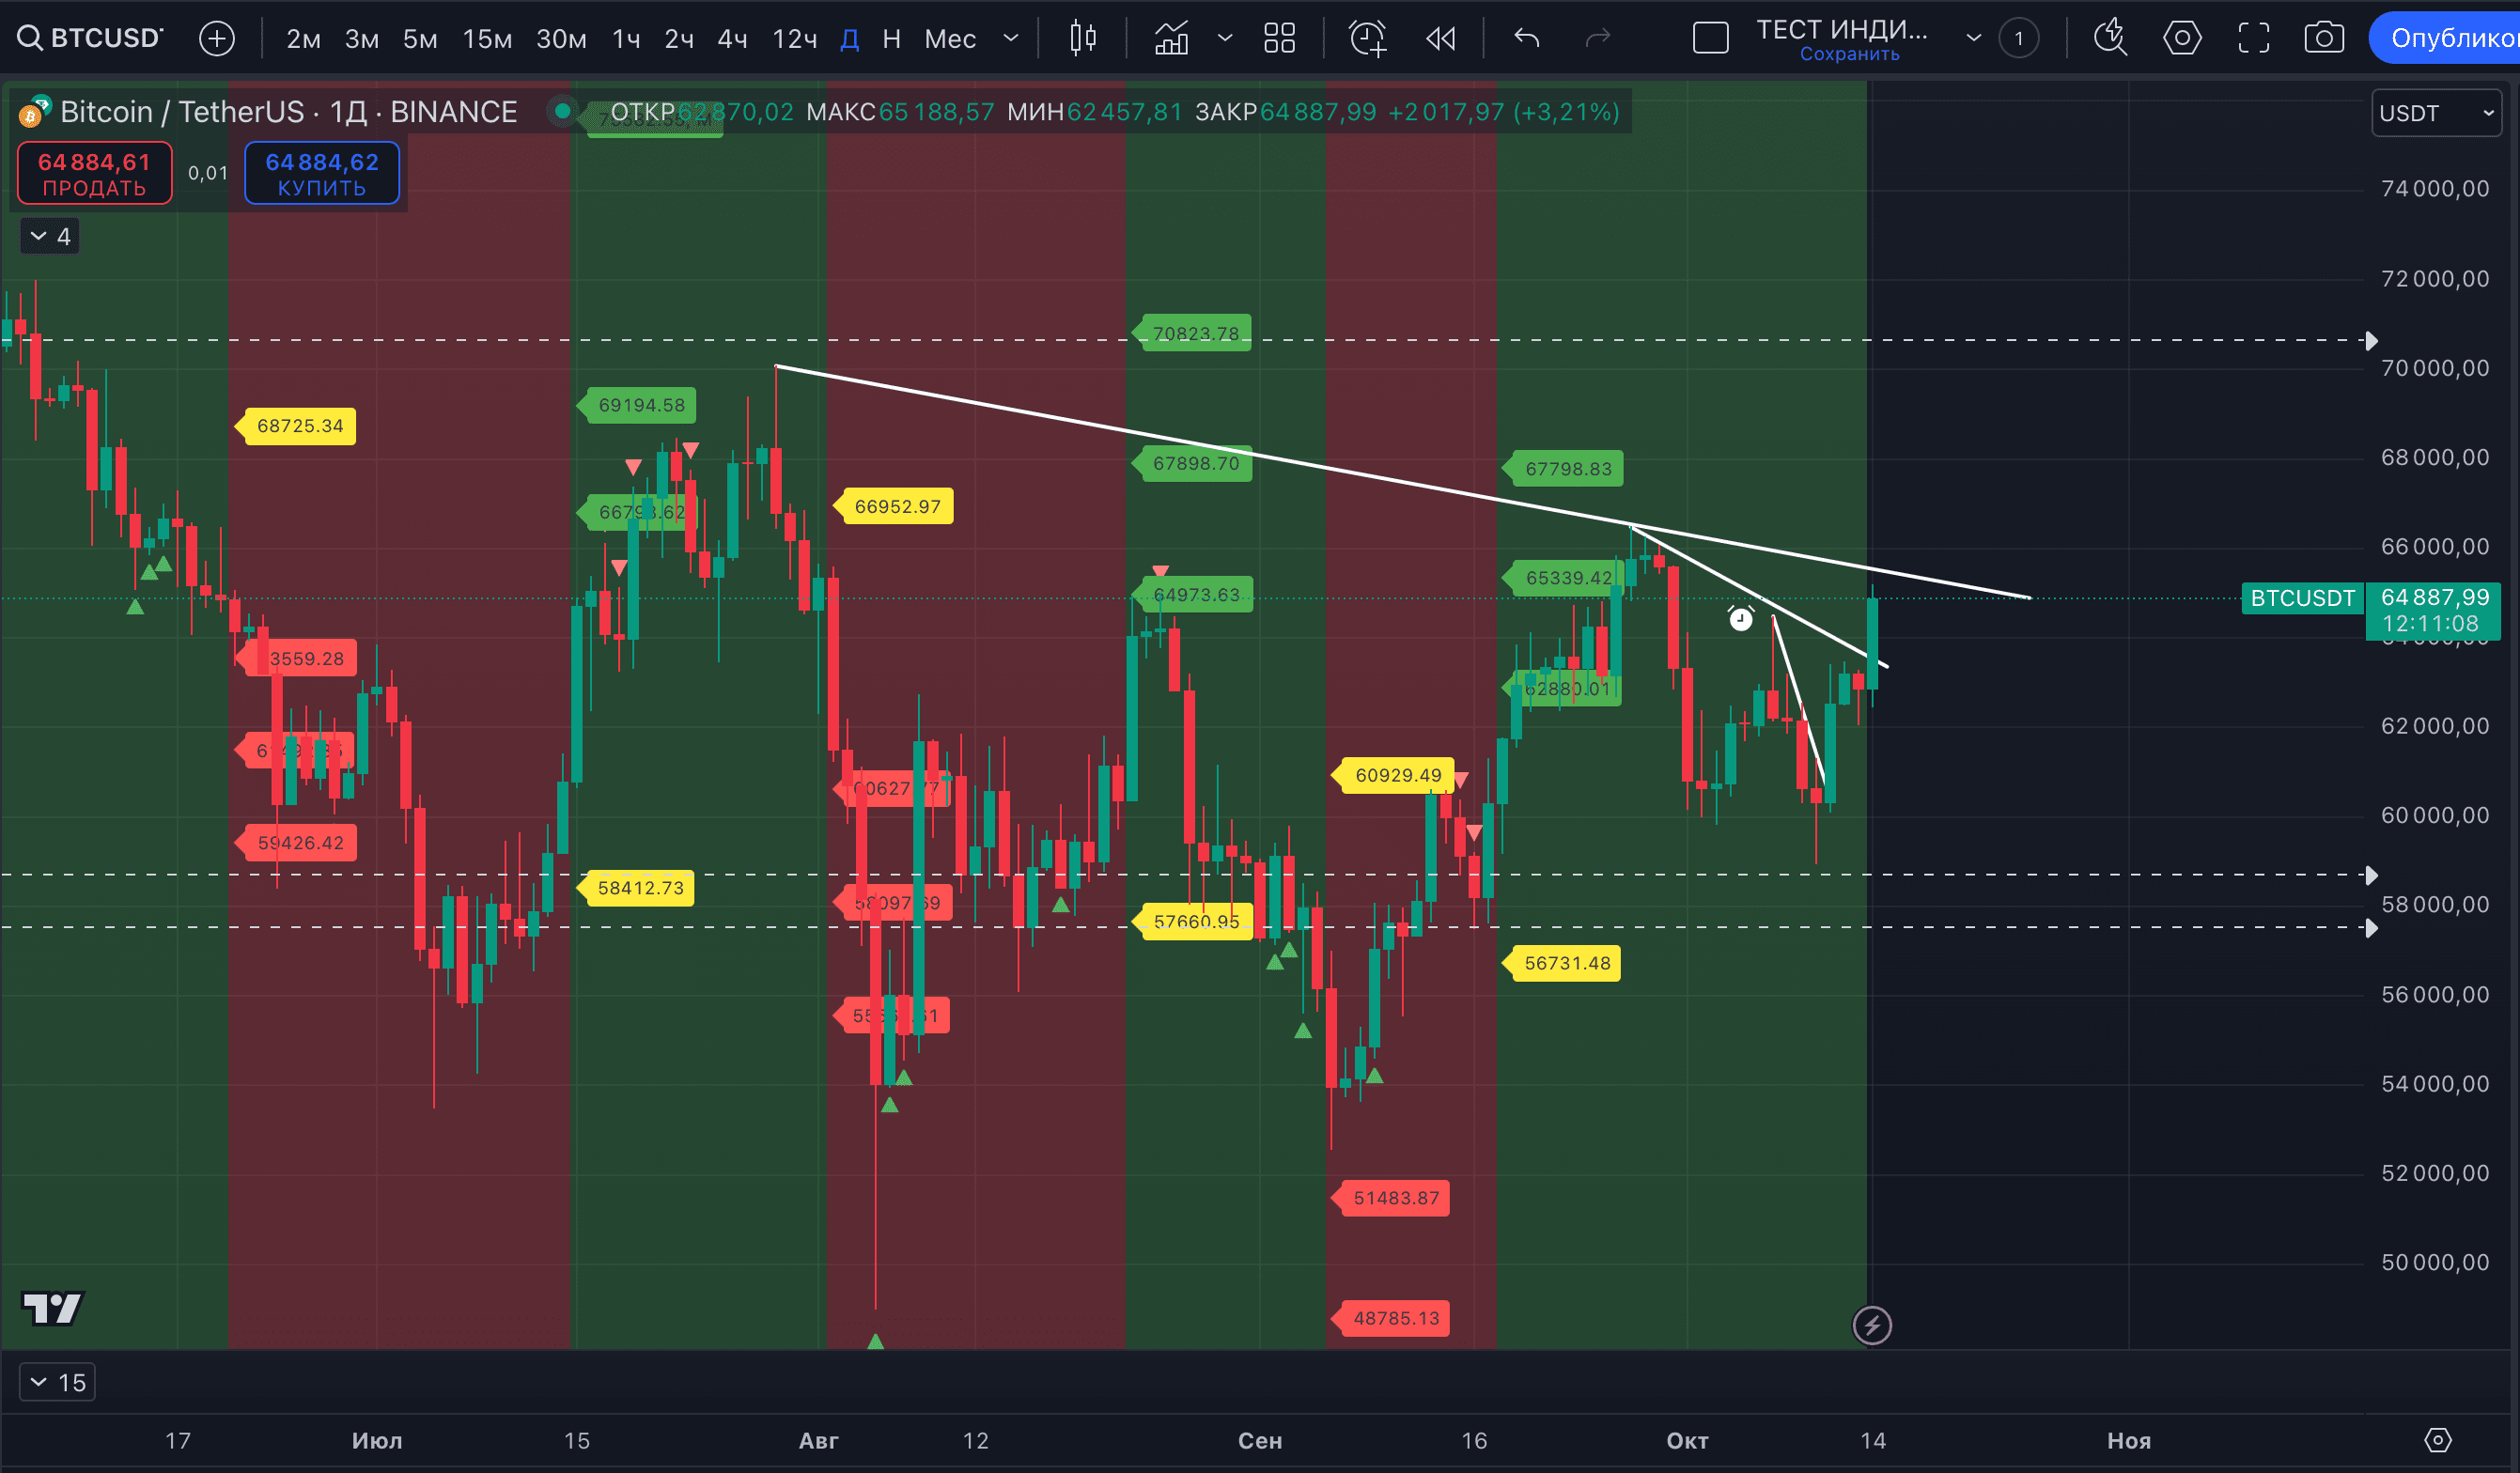
The downtrend remains on the weekly TF and it is too early to say that it has changed. The three extreme weekly candles attract attention. If we close this week above $65,618, this is an announcement of a bullish continuation in October.
The chart clearly shows how important it is to receive a signal of a stable uptrend on a weekly TF from P73 Trend & Target Dynamics.
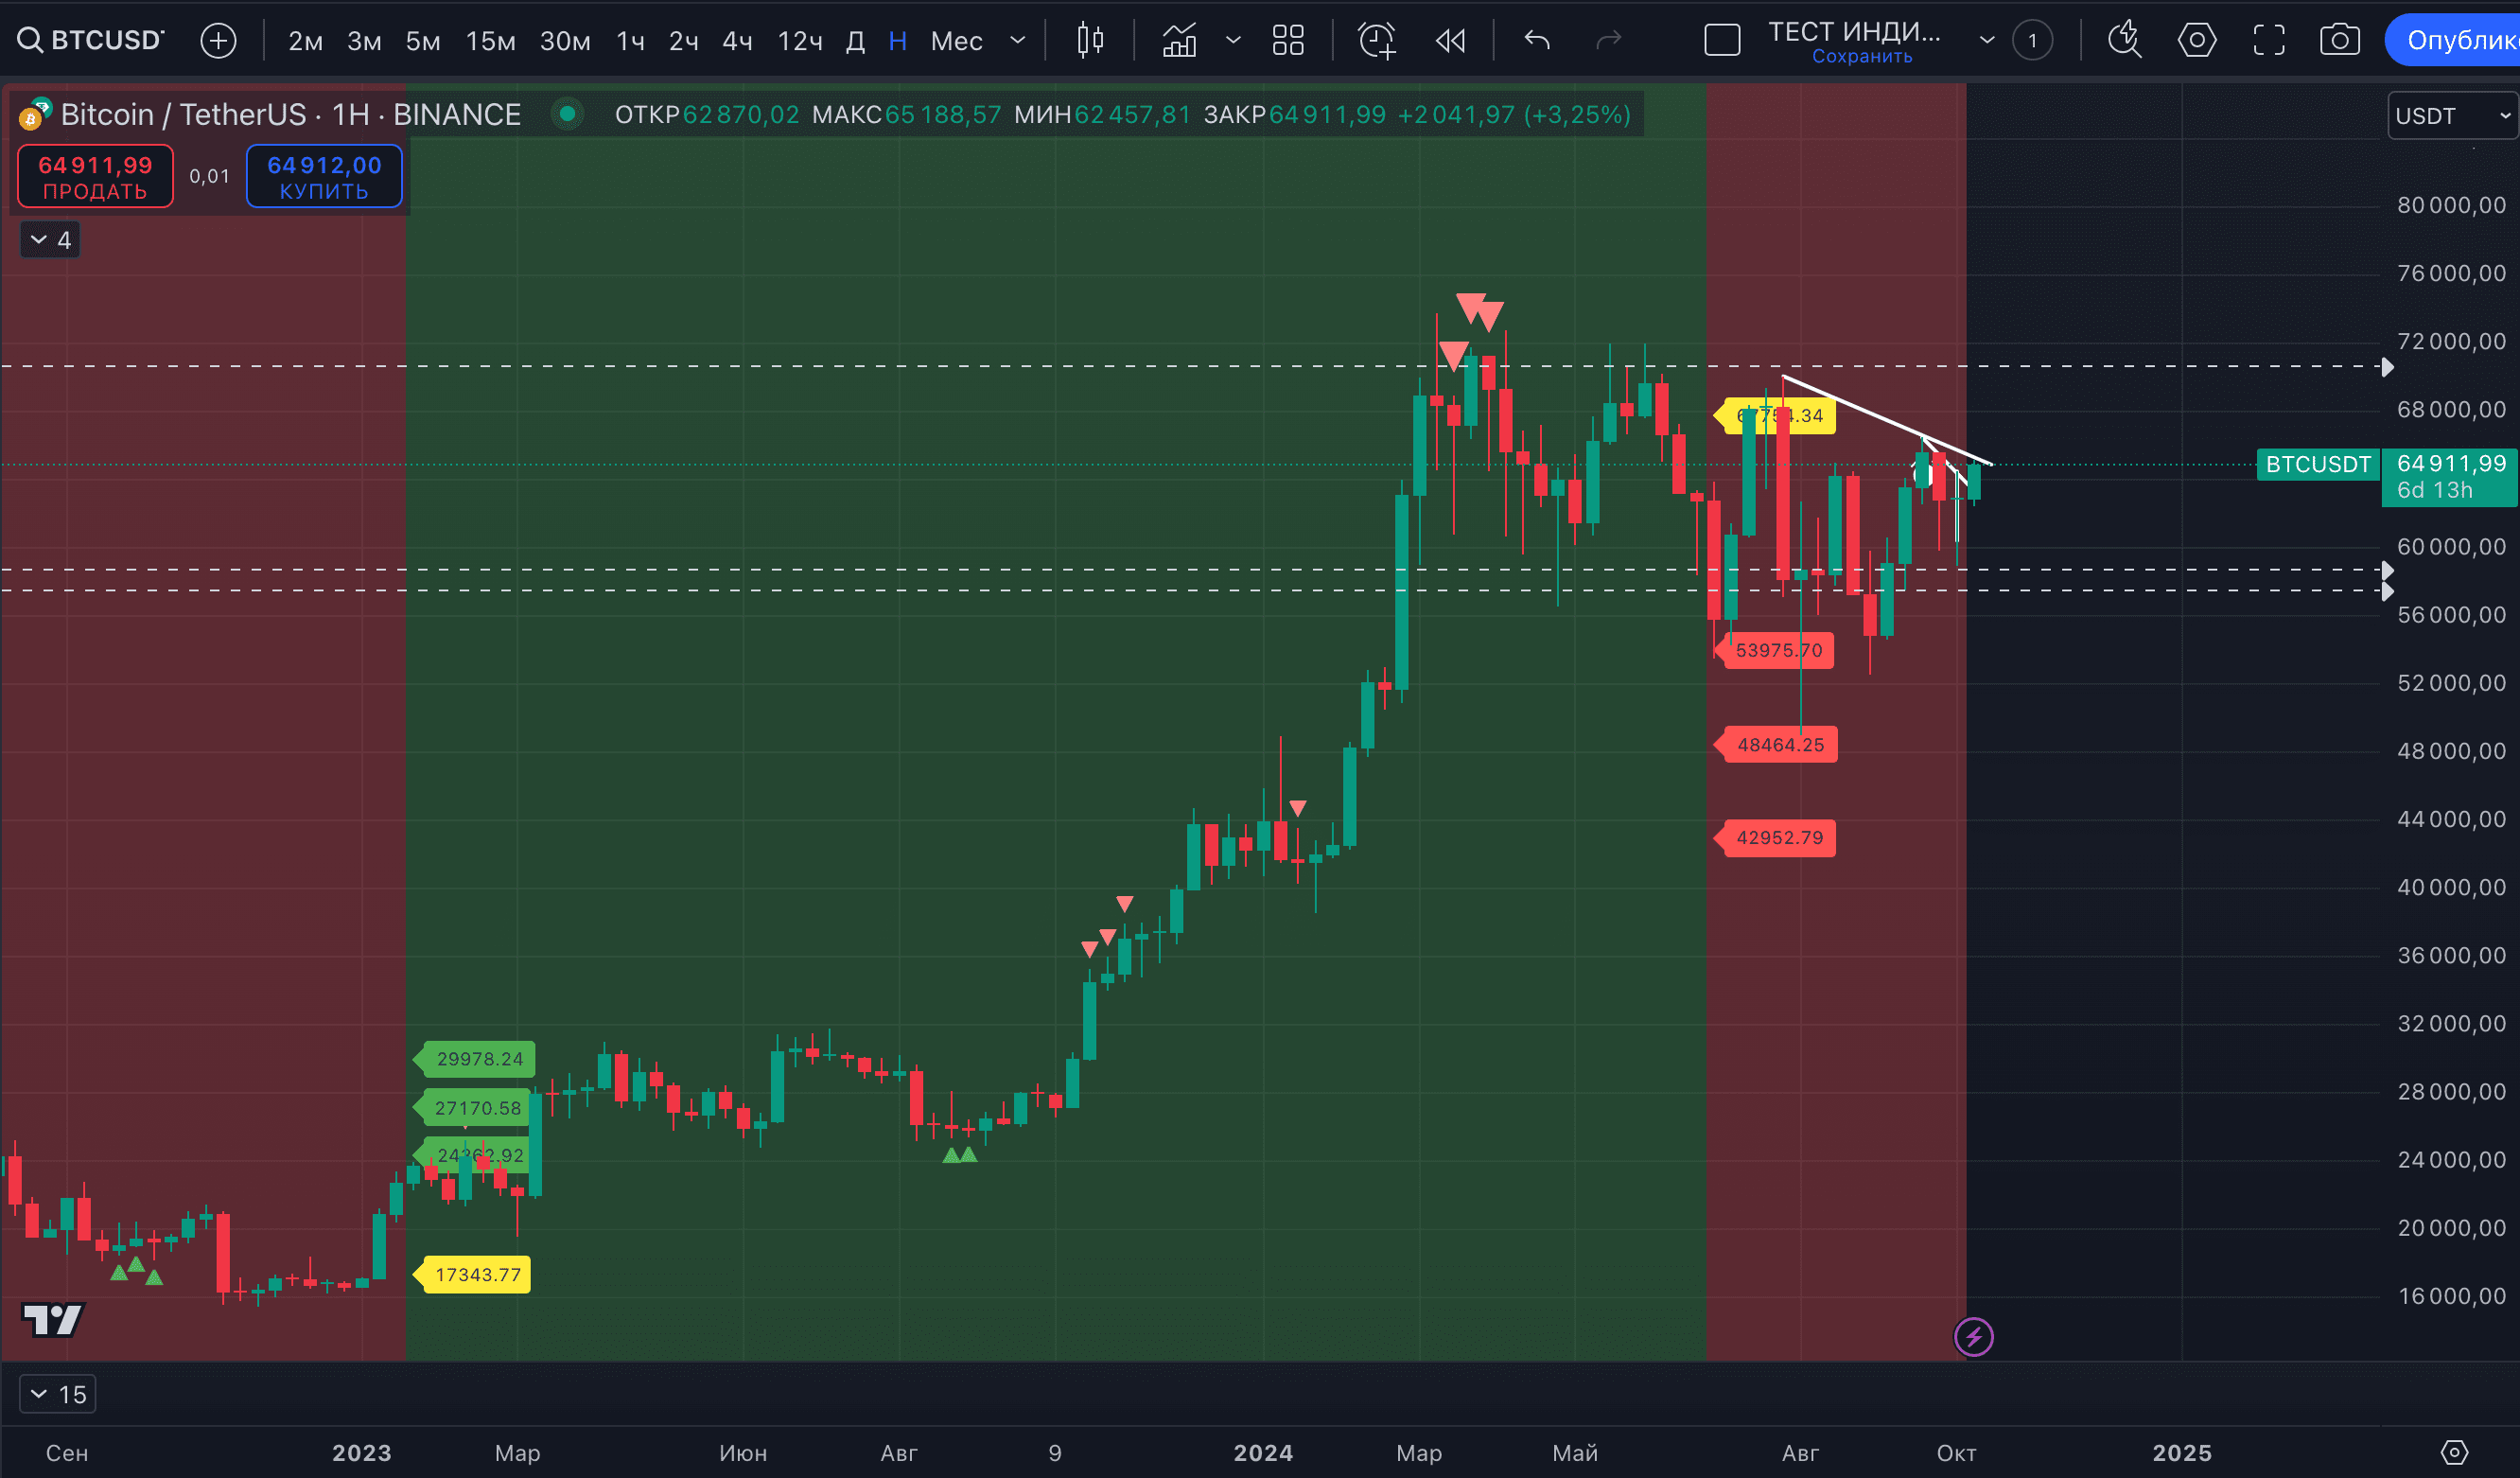
The indicator signal allowed to buy#BTCin investment at $23,960 at the end of January 2023 and sell either at the Strong signal of a potential HIGH at $68,393 in March 2024, or at $55,856 at the signal of a trend change in July 2024.
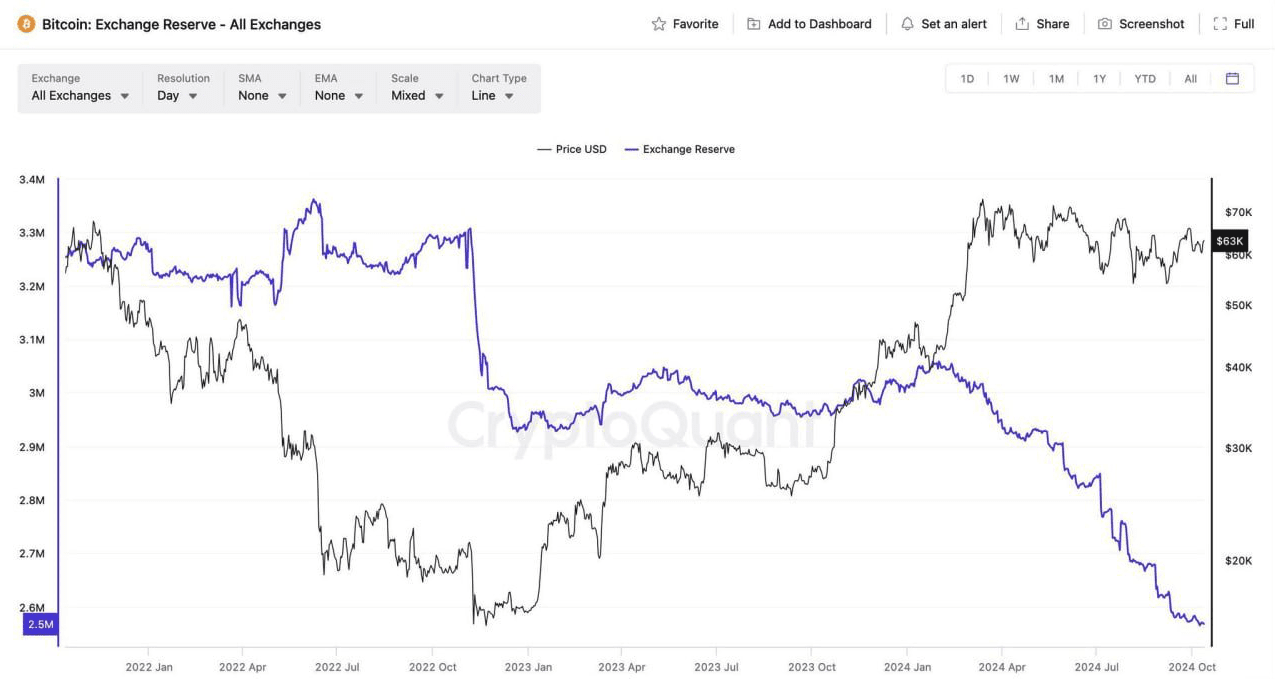
Well, or continue holding until now 👍. Because, as#CryptoQuantrightly reminds,#BTCis updating a 5-year minimum for available coins on CEX crypto exchanges. In this exhausting range, many have forgotten that the prospects of "supply shock" have not gone away.