
More than 70% of the time in the trading market is garbage time. Giving up some specious rising and falling market trends is also to avoid falling into a trapped situation of being passive and helpless with losses, and to reduce useless efforts that cannot be extricated!
No one can control every big or small wave in the ups and downs, nor should they try to catch every wave from beginning to end every day and every round of waves, no matter how big or small. This is not true. It’s not feasible or possible in practice!
The following are some commonly used indicators that I have summarized for your reference!
Volume
The Bitcoin trading volume indicator is an important indicator that reflects the activity and liquidity of the Bitcoin market. It can help investors judge the trend, signal, strength and stability of Bitcoin, and thus formulate reasonable buying and selling strategies.
In my daily interpretation of the Bitcoin market, trading volume indicators are one of my more commonly used indicators. They can work well with MACD, EMA moving averages, and chart patterns to identify potential trend trading opportunities.
The volume indicator is not effective at all times. In most cases, we do not need to judge the volume indicator. I will only judge the volume indicator at the following key time points:
Key point one: the end of the volatile market
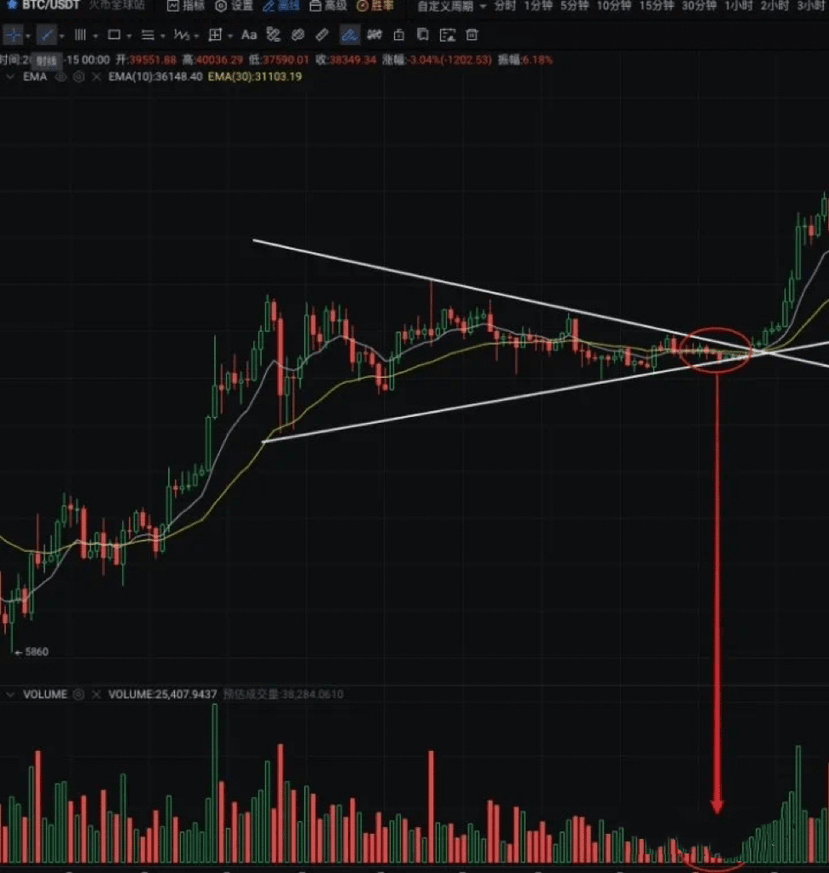
We have found that when the market fluctuates for a long period of time, usually more than a month, and when trading volume shrinks and land volume appears, it is a signal that a market change is about to occur. The key points are:
At the end of the oscillation pattern, the trading volume generally shrinks and the pattern gradually converges, as shown in the following figure:
Key point two: chart pattern breakthrough
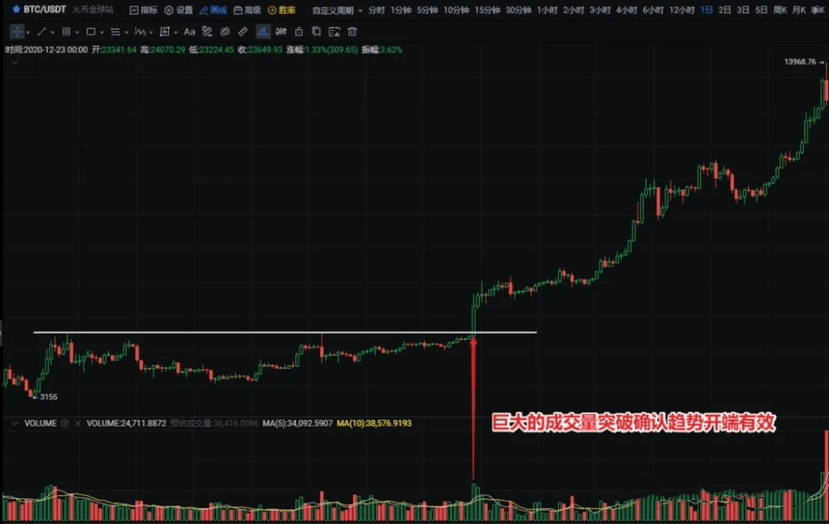
When the chart pattern is broken or supported, or the pressure line is broken, we need to pay attention to whether the trading volume is increased at this time. The comparison method is whether the trading volume of the day is larger than the average trading volume of the past few days or weeks. If the trading volume of the day is larger than the average trading volume of the past few days or weeks, The larger the value, the higher the reliability of the day's breakthrough signal and the greater the probability of a true breakthrough.
The most effective signal to determine the beginning of a trend is a large volume, so you can give priority to some trading products that release huge volumes when breaking through. As shown in the following figure:
Key point 3: Bottom flip or top flip
Bottom-breaking and top-breaking are two indicator forms in technical analysis. They can help investors judge the trend, signal, strength and stability of Bitcoin, so as to formulate reasonable buying and selling strategies.
A bottom break is when the price falls below the support line of the bottom shock pattern, and then quickly breaks through the resistance line (the previous support line). This kind of market reversal after falling below the previous shock pattern is technically called a "bottom break".
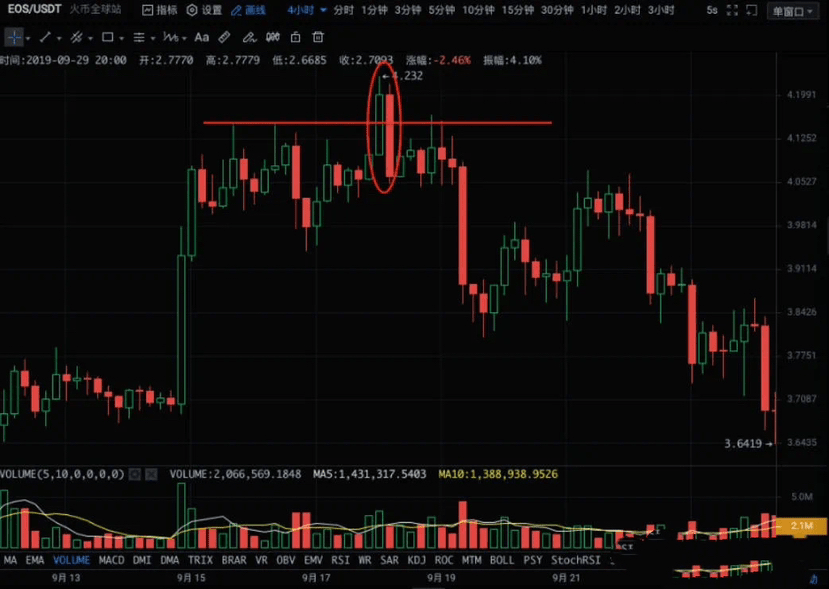
A top-out flip occurs when the price breaks through the pressure line of the top shock pattern, and then quickly falls below the support line (the previous pressure line). This kind of market trend that breaks through the previous shock pattern and then reverses is technically called a "top break".
The operation of breaking the bottom and breaking the top also needs to be combined with the trading volume to judge the strength and effectiveness of the signal. Generally speaking, volume should increase on a breakout of a pattern's support or pressure line. If the trading volume is not large when it breaks through the support or pressure line of the pattern, it means that the top or bottom break may be a false reversal, and you need to operate with caution.
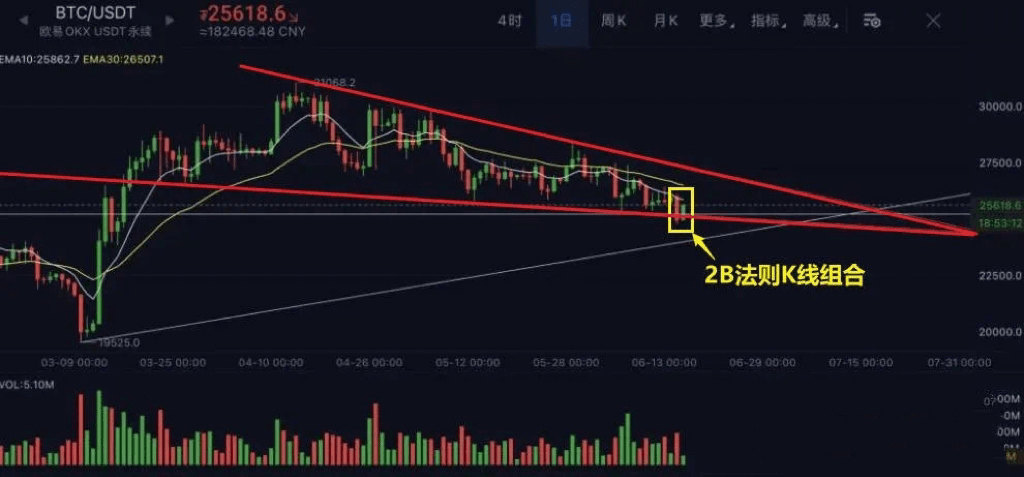
Bottom flips and top flips can be explained by the 2B pattern:
MACD
When I usually interpret the Bitcoin market, the MACD indicator is one of the indicators I use more often. They can be well combined with trading volume, EMA moving average, and chart patterns to identify potential trend trading opportunities.
MACD "Dragonfly's touch of water"
The MACD "quick tip" signal plays a great role in judging the timing of market changes.
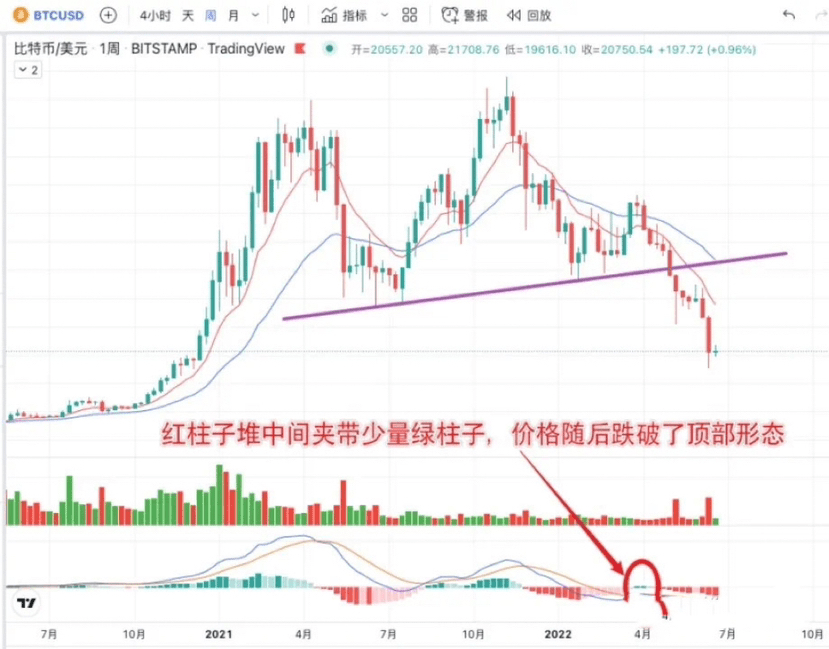
When judging that the market change is in a downtrend, MACD's "little hint" appears as a small number of green pillars in the middle of MACD's red pillar pile. This is an early warning signal of a market change in a downtrend. As shown below:
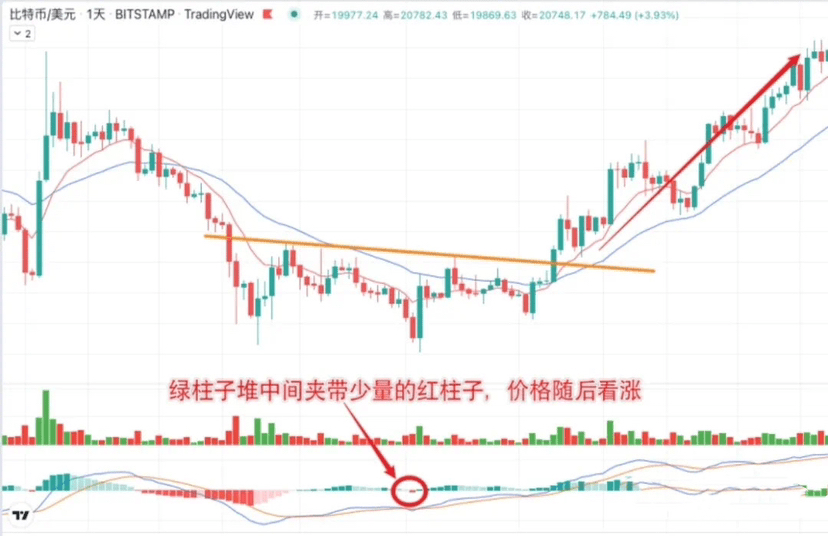
When judging that the market change is an upward trend, MACD's "little hint" is manifested as a small number of red pillars in the middle of the green pillar pile of MACD. This is an early warning signal of a market change and an upward trend. As shown below:
EMA
In my daily interpretation of the Bitcoin market, the 10EMA and 30EMA exponential moving averages are one of my more commonly used indicators. They can work well with MACD, trading volume, and chart patterns to identify potential trend trading opportunities.
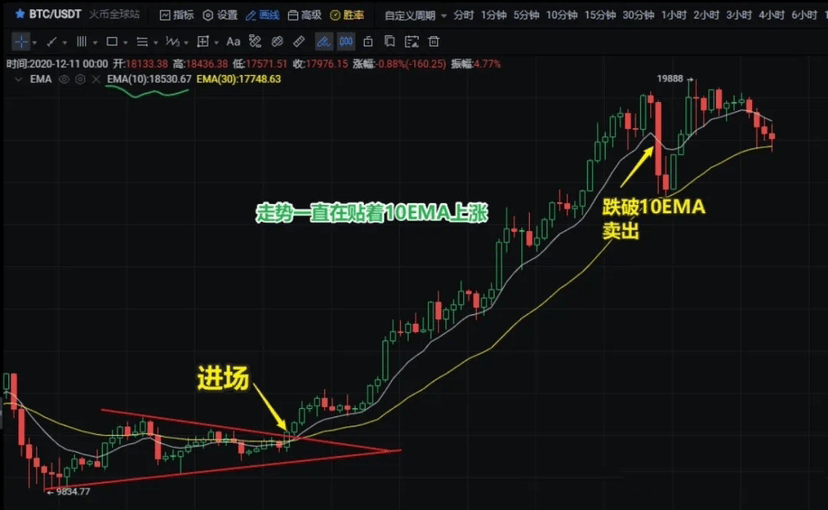
The correct ways to use Bitcoin’s 10EMA and 30EMA moving average are as follows:
The 10EMA and 30EMA are two exponential moving averages that can reflect Bitcoin’s short-term and medium-term trends, as well as support and resistance levels.
The 10EMA and 30EMA can be used to determine long and short signals. When the 10EMA crosses above the 30EMA, a golden cross is formed, indicating an opportunity for long entry; when the 10EMA crosses below the 30EMA, a dead cross is formed, indicating an opportunity for short entry.
The 10EMA and 30EMA can also be used to judge the strength of the trend. When the two moving averages diverge upward, it means the upward trend is strong; when the two moving averages diverge downward, it means the downward trend is strong; when the two moving averages entwine, it means the trend is unclear. Need to wait for breakthrough.
10EMA and 30EMA can also be used to set stop loss and take profit points. When the price is far away from the two moving averages, there may be an opportunity for a callback or rebound. At this time, you can consider appropriately reducing or closing positions; when the price is close to the two moving averages, There may be support or resistance, and you can consider adding or opening a position appropriately at this time; when the price falls below or breaks through the 10EMA or 30EMA, you can close some or all of your positions.
The above are the main technical indicators I use to interpret the Bitcoin market. Of course, the most important thing is to focus on the market, so I won’t elaborate on it here.