
Hello everyone, I am your cat, I got up not too late today...
Written in front:
1. When doing a transaction, don’t be stubborn about taking one side.
2. Once the pattern emerges, if it is bullish, it is bullish, and if it is bearish, it is bearish, whether you like it or not.
3. If nothing special affects the market, this bull market may continue for a while.
4. A breakout turns into a bullish trend, and then a break below that again is also a signal of a return to a bearish trend.
5. To chase the rise, it is best to wait for the opening of the U.S. stock market. Although under normal circumstances, a flash crash will not occur so quickly after the market has just formed a pattern, you still need to pay attention to the possible impact of the Nasdaq.
6. The difficulty has been upgraded again. It can start to rise at a position you can't imagine, or it can directly pull back at a position you can't imagine. I think this inexplicable trend will not make people happy. Instead, they should think about it carefully. No matter how to play in the future, it may become more and more difficult to judge the top and bottom.
7. For the long orders entered halfway up the mountain, don’t be too cautious. Just move the stop loss point a little bit down from the position where the price rebounded early this morning.
Let's start with $BTC
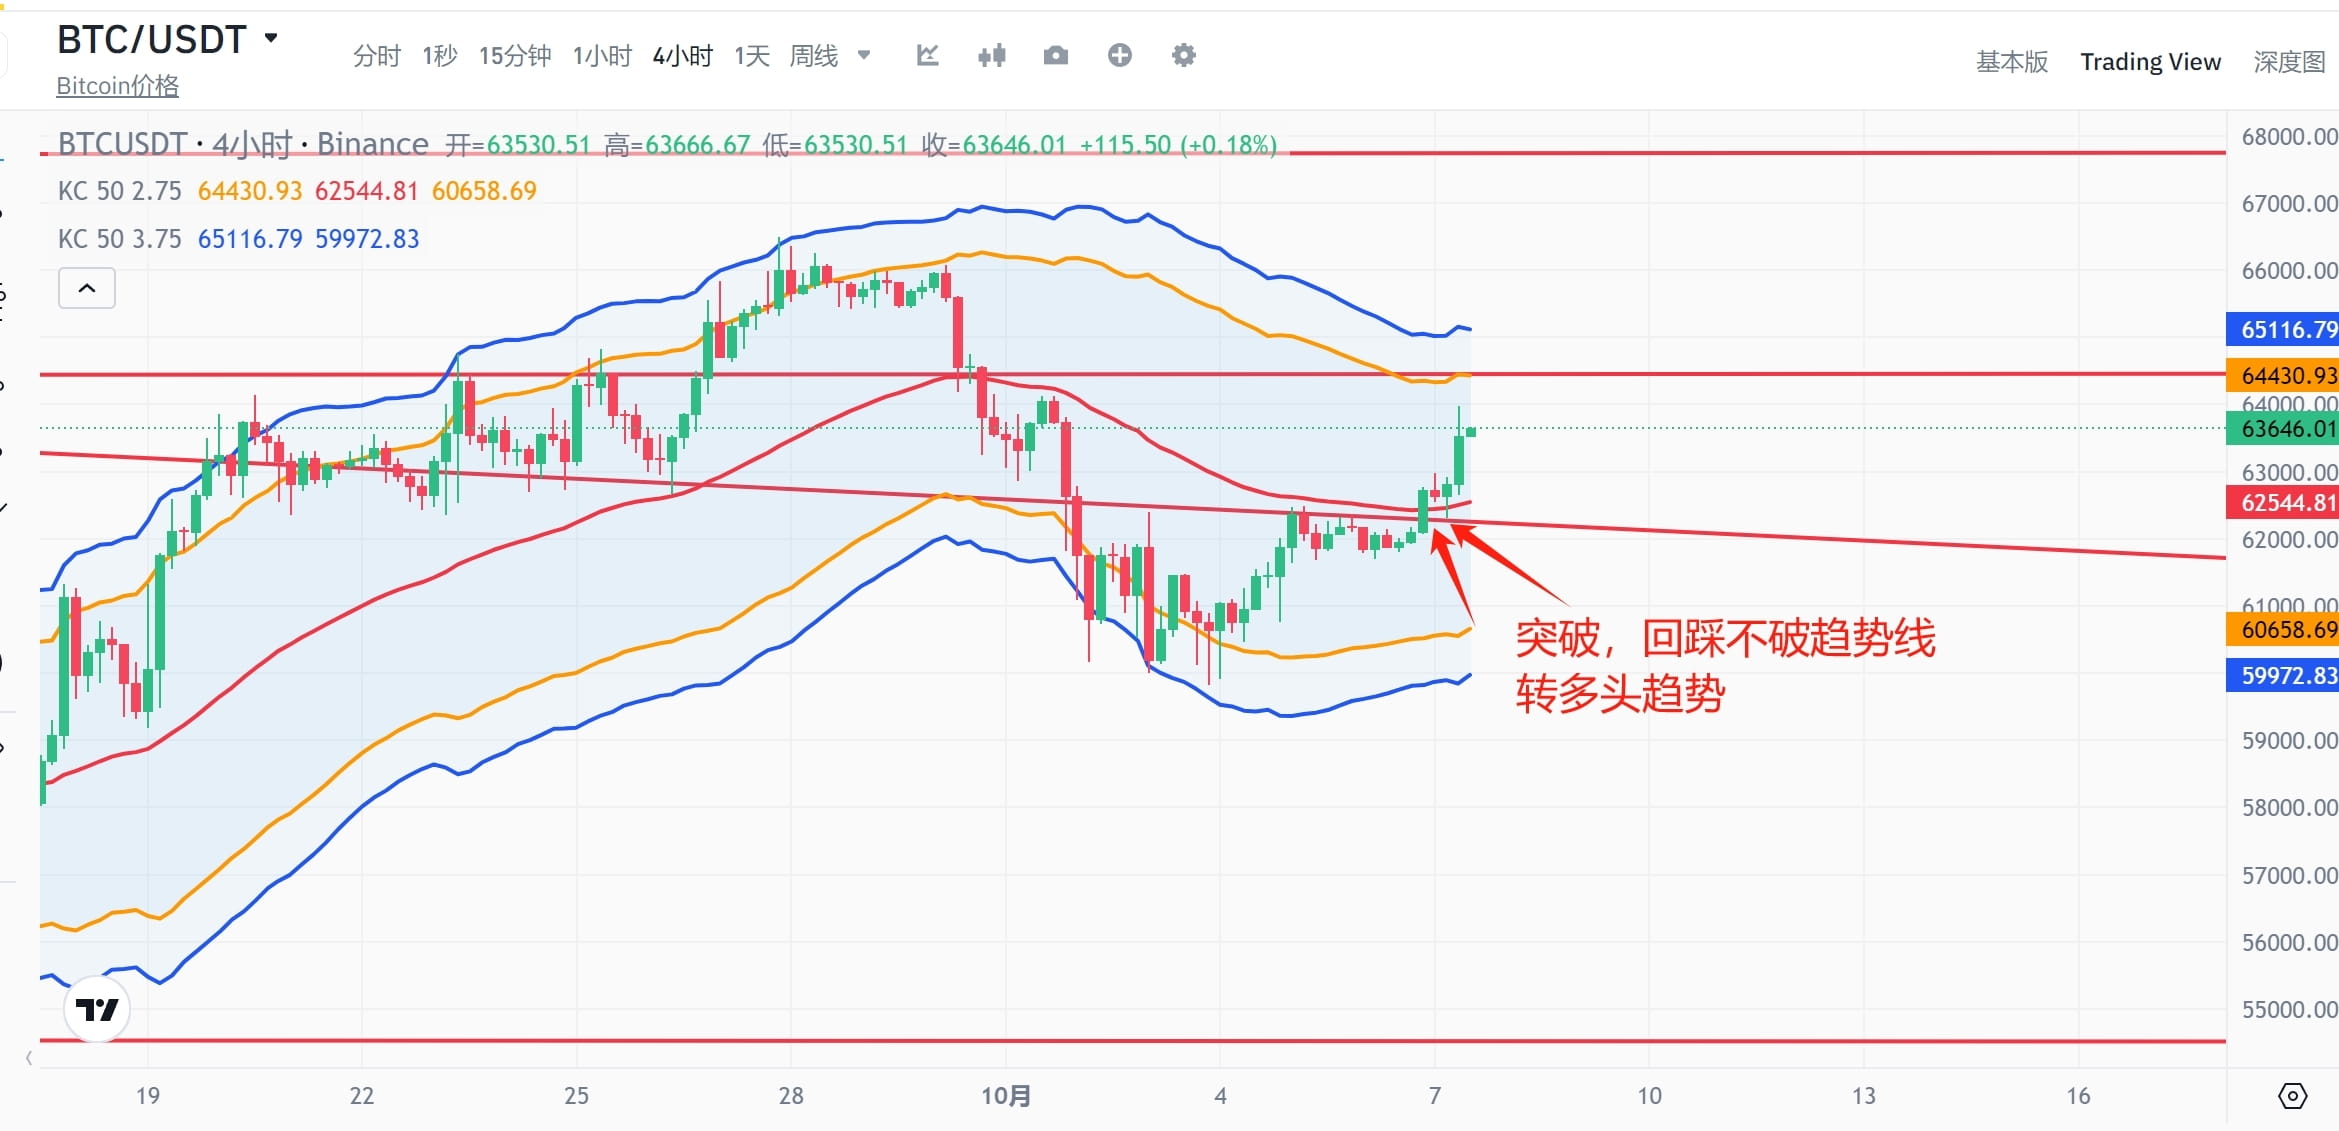
It is quite obvious in the 4-hour chart. The big positive line passed 623, and did not break 623 after falling back. If it did not break, it would go up. This is not based on our will. According to yesterday's logic, the first short position was at 62650, and when it fell back to 623, it was long, and the 300 points lost were recovered. If you have long positions around 623, just hold them if the stop loss is moved up to 628 and cannot be swept away. If the Nasdaq opens in the evening, or falls below 623 again before breaking through 644, then the rebound is over and the correction continues.
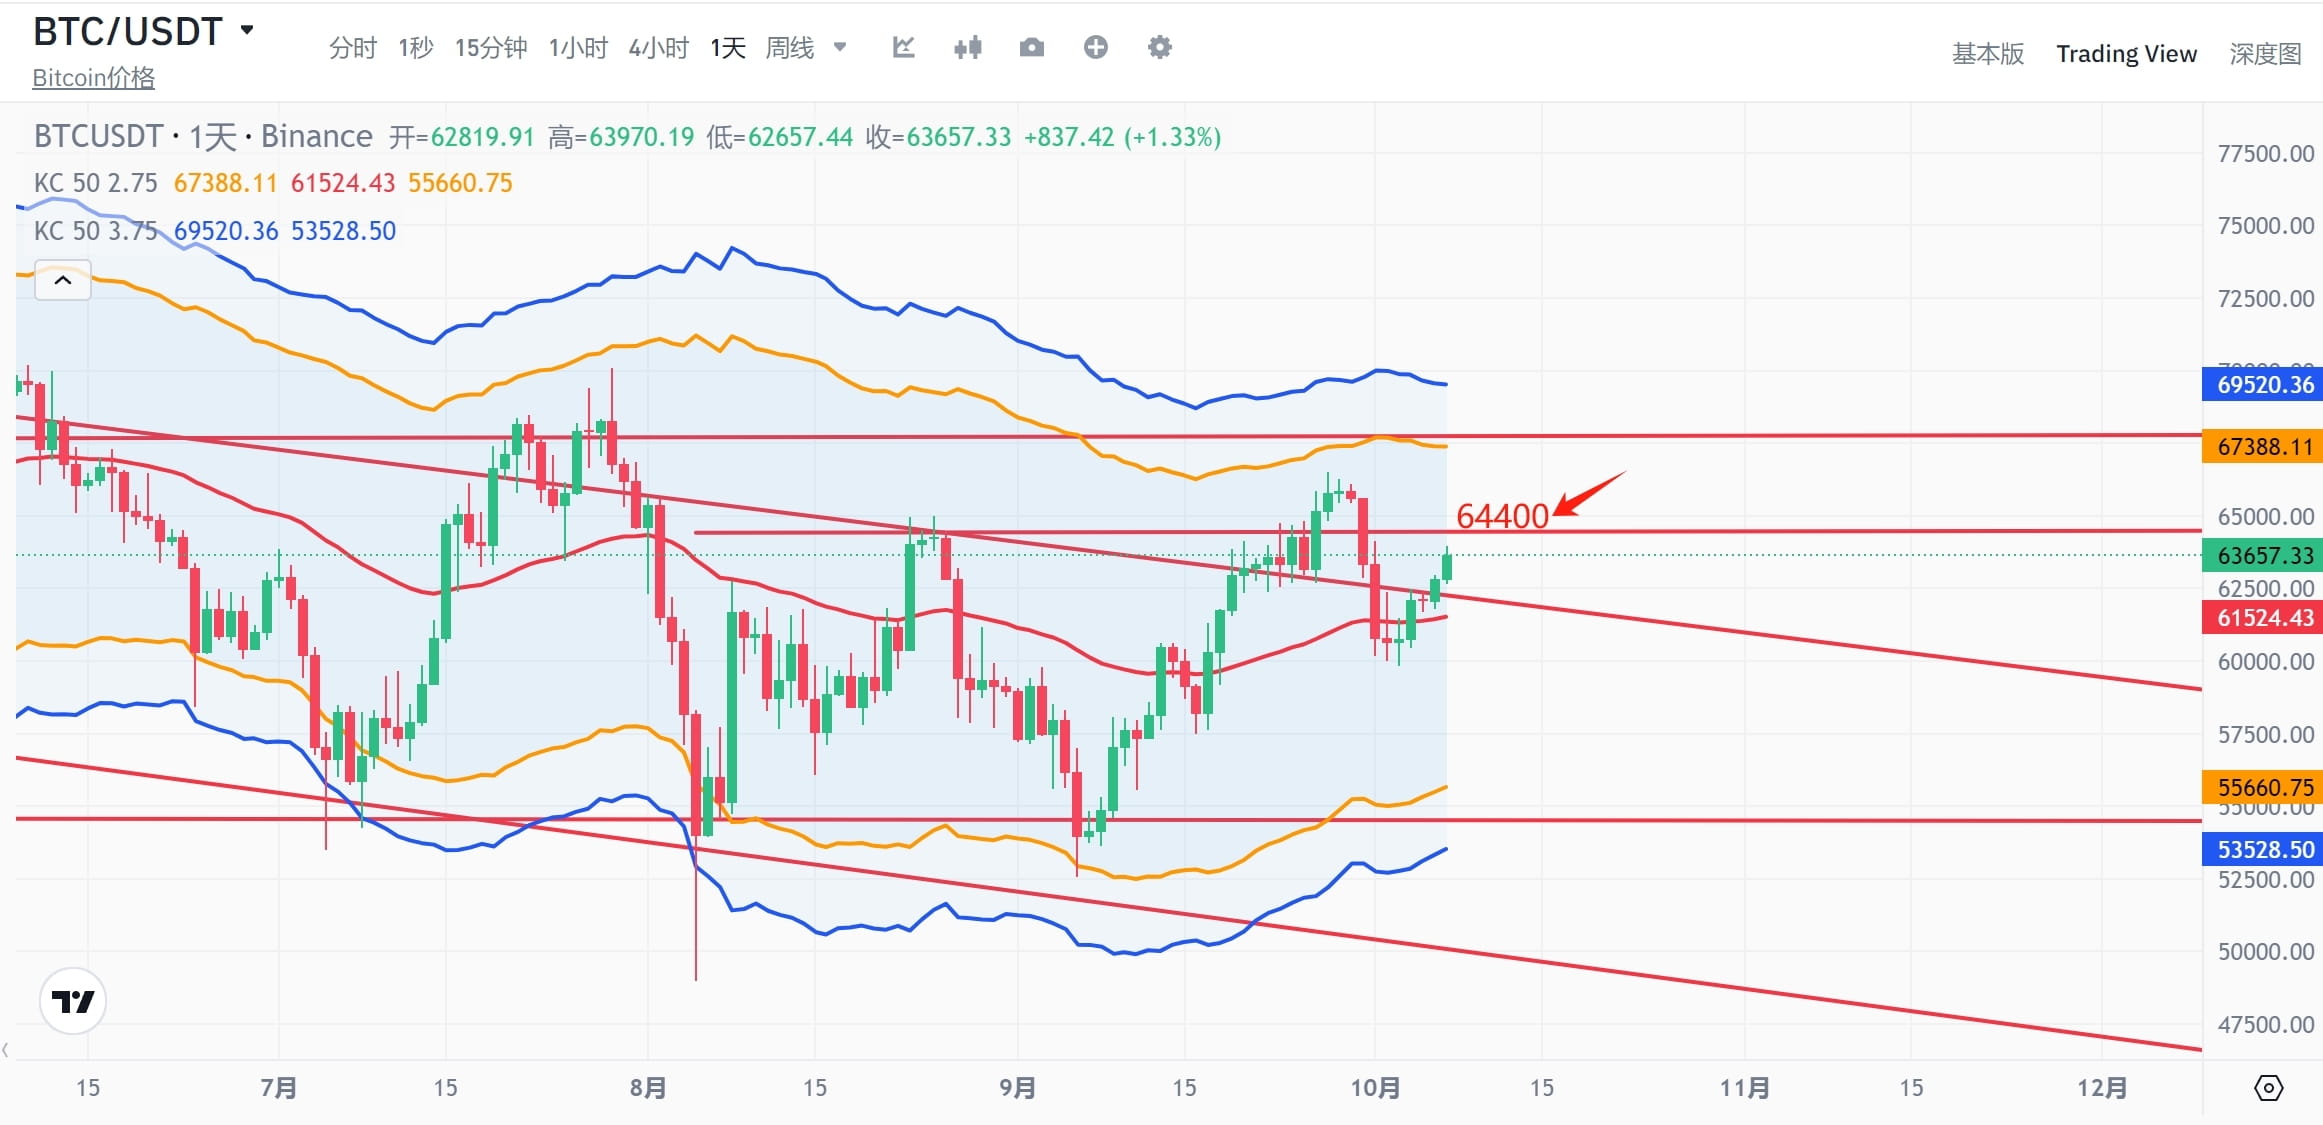
For the daily chart, let’s look at 644 first to see if it breaks through. If it breaks through with a big positive line and does not break 644, then continue to look at the previous high of 666. If it fails to break through, then look at the situation of stepping back on the trend line. If it breaks through, then it will be adjusted again. If it breaks through 644, then it will be a signal to fall below 644 again.
Continue watching $ETH
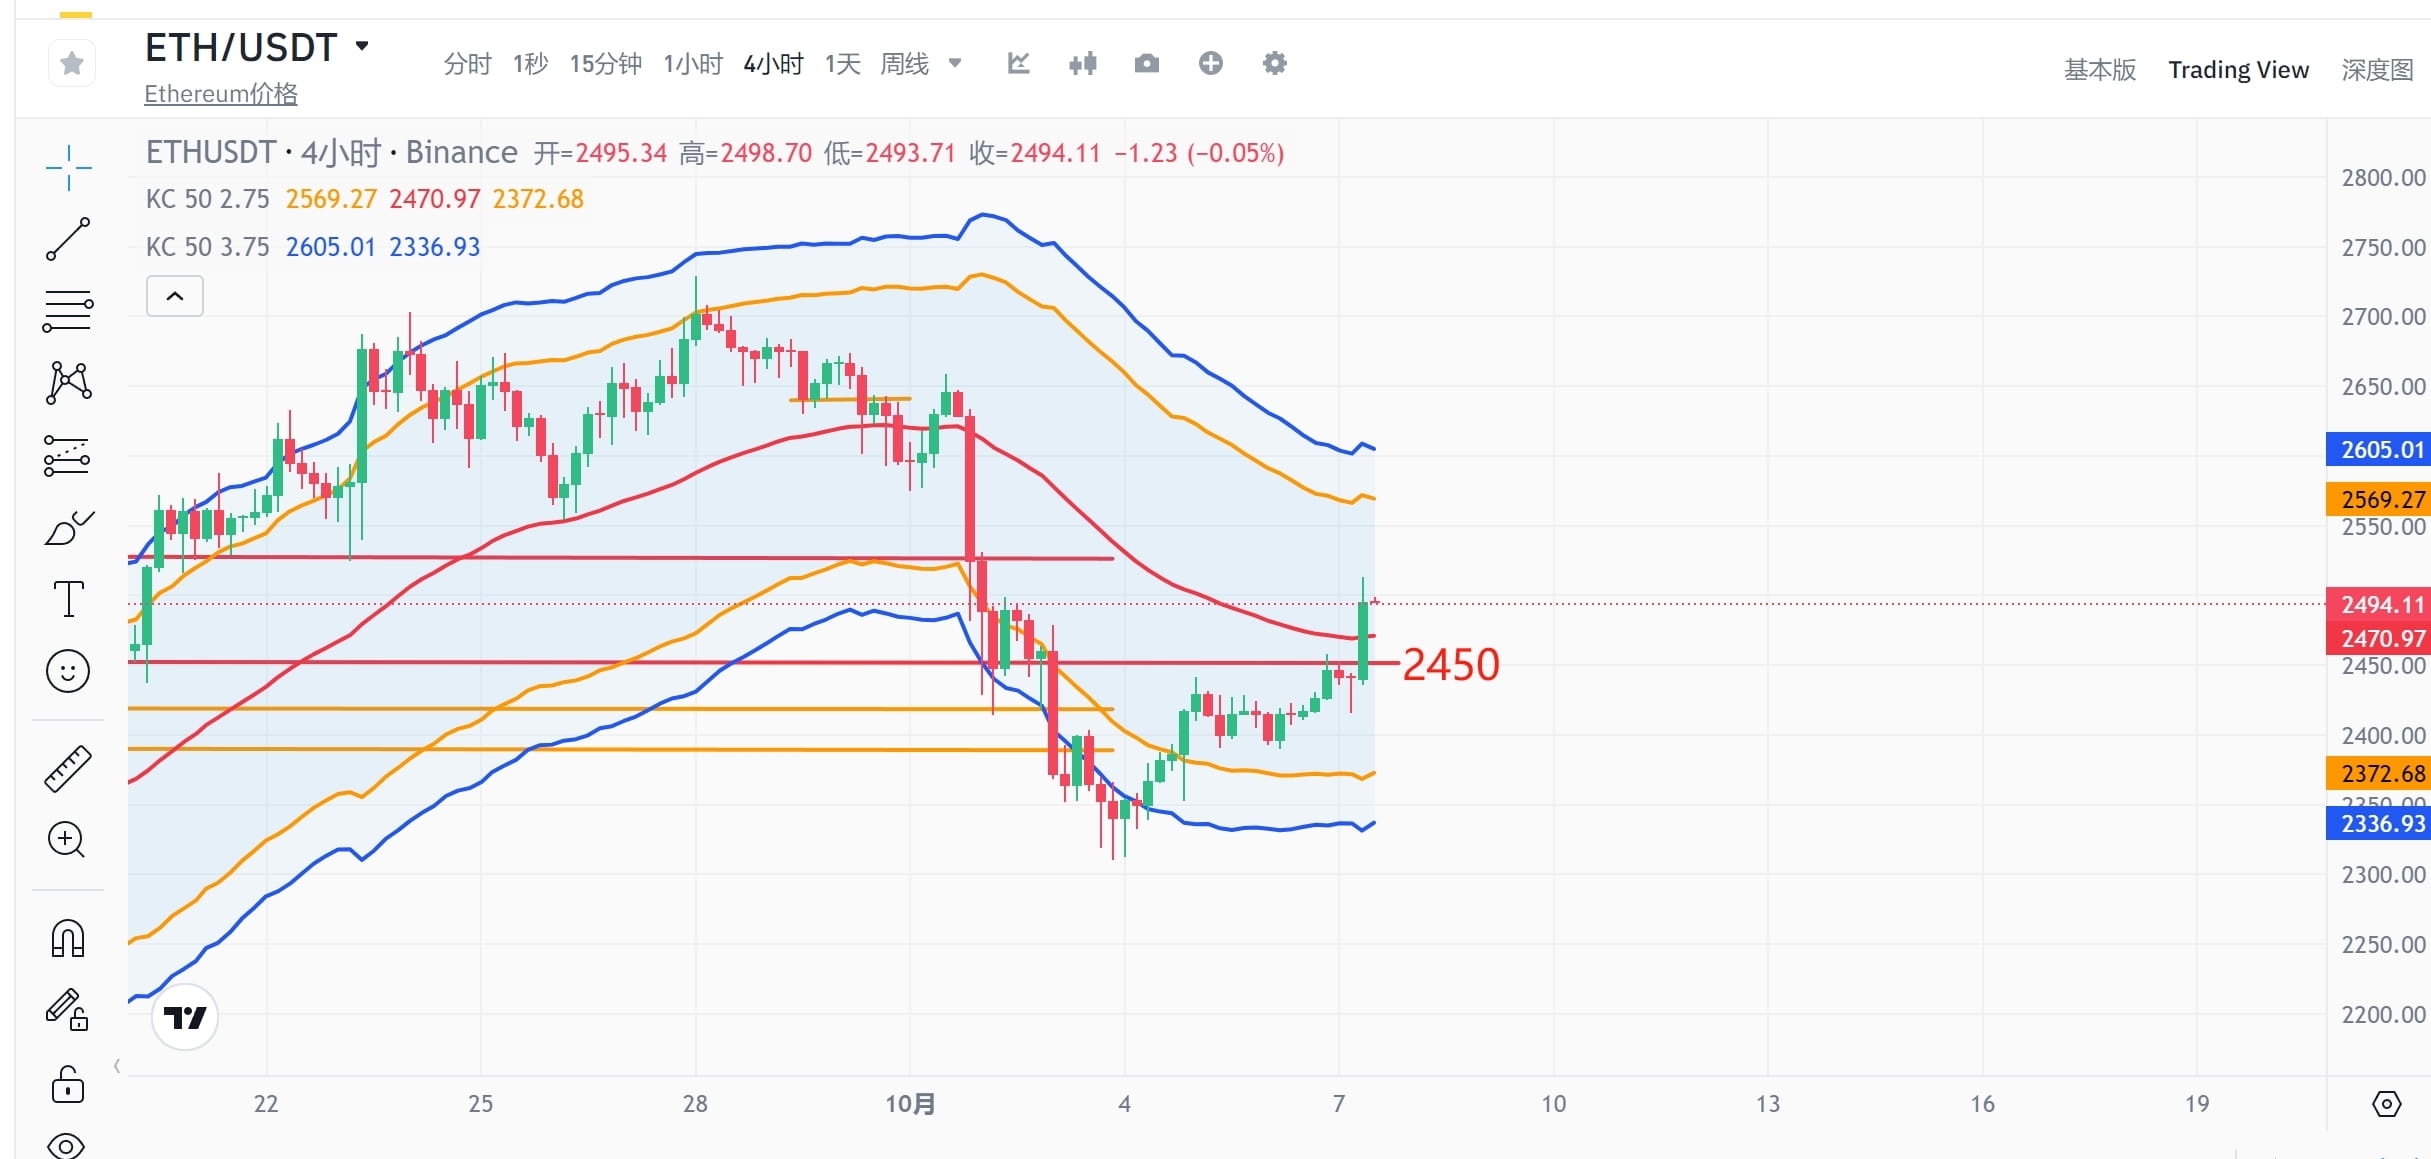
Well, when the big positive line passes 2450, the right side long position starts at that time. If it can stand firm around 2488, it will go up to 2531-2570-2596, and the rest will be discussed later, one step at a time. Here we need to pay attention to 2440. Under the normal bullish trend, this position should not be broken, and if it is broken, you should pay special attention.
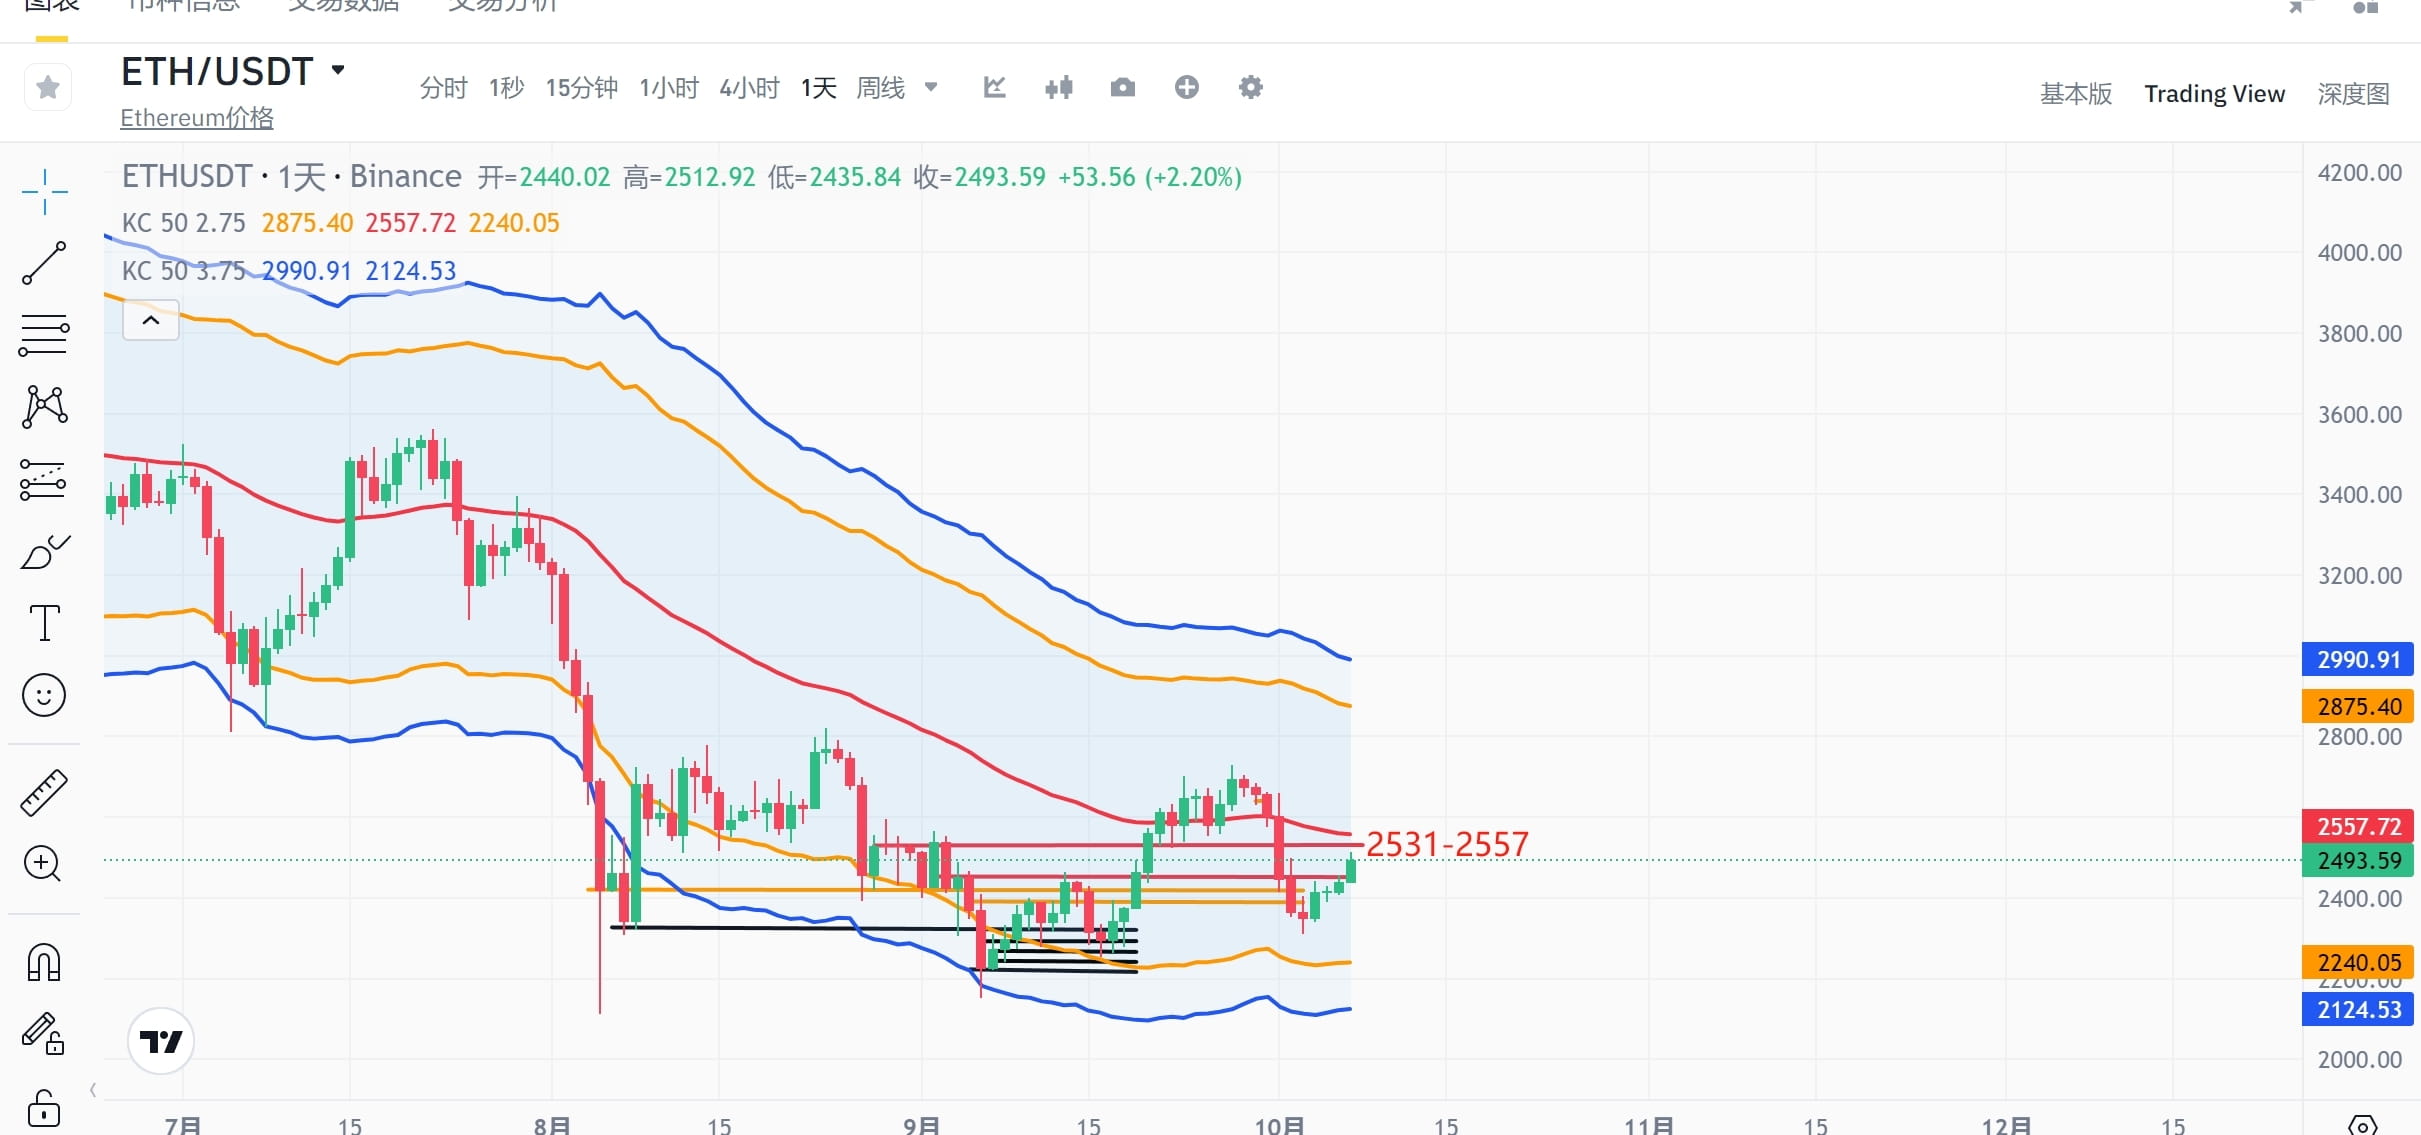
The big positive line passes 2557 and returns to the daily bull level. There is also a resistance level above at 2531. Let's pay attention to the breakthrough situation. Now it's a normal trading day. If Ethereum wants to rise, it also has to consider the factor of Grayscale's shipment.
Continue watching $SOL
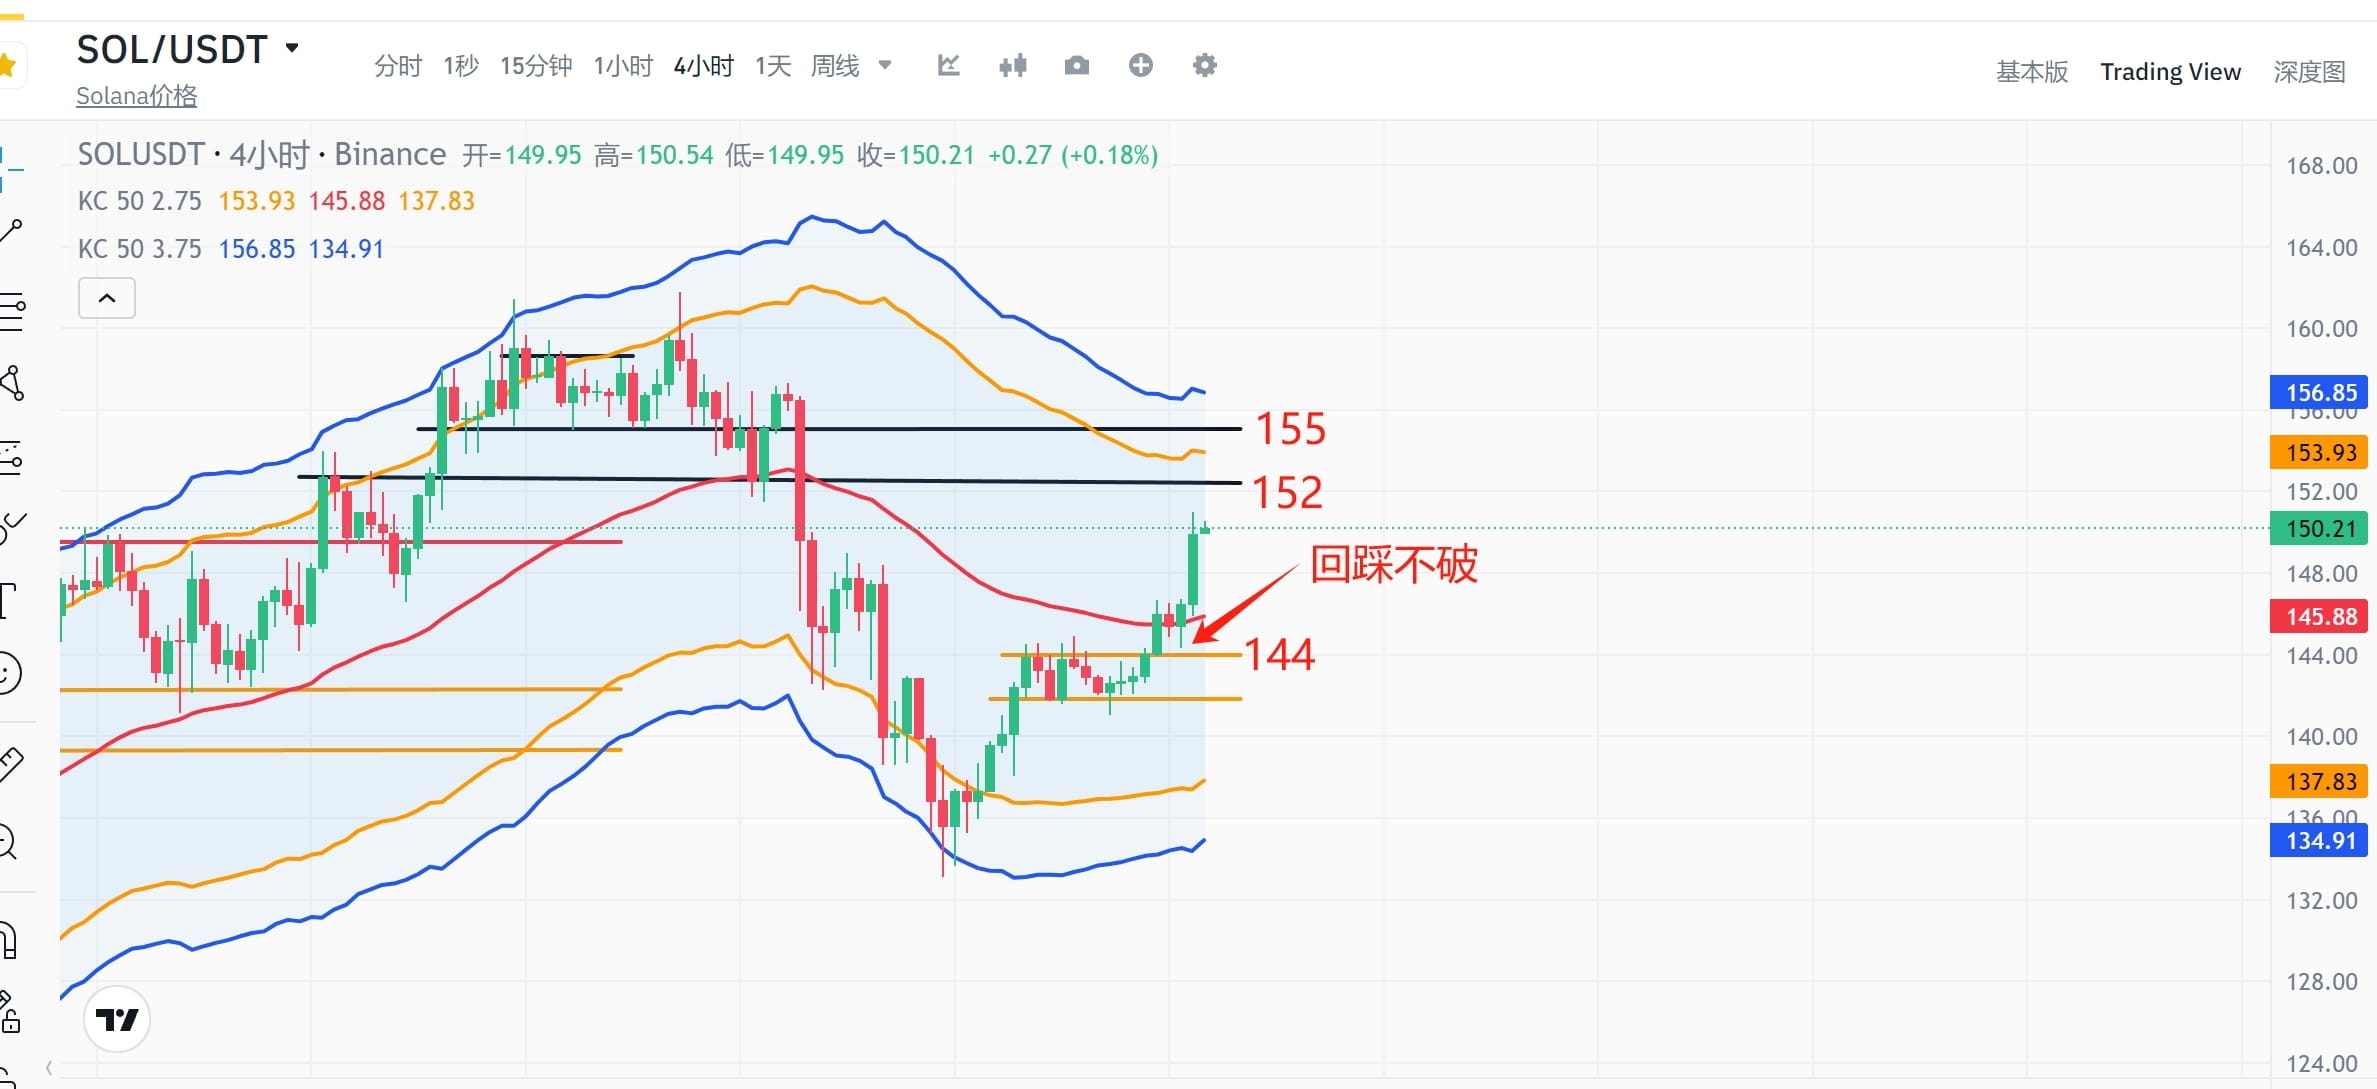
Sol is the same as what I said yesterday, whichever side breaks through, go there. In the 4-hour chart, it is very obvious that if it breaks through 144 and does not break through 144 after a pullback, then the long position will start from this position. First look at 152-155 upwards, and the only further one is the daily triple top of 161.5-163. If it can pass there, Sol is expected to return to 198-200. Here we need to pay attention to 146.5. Under a normal bullish trend, this position should not be broken, and if it is broken, you should pay more attention.
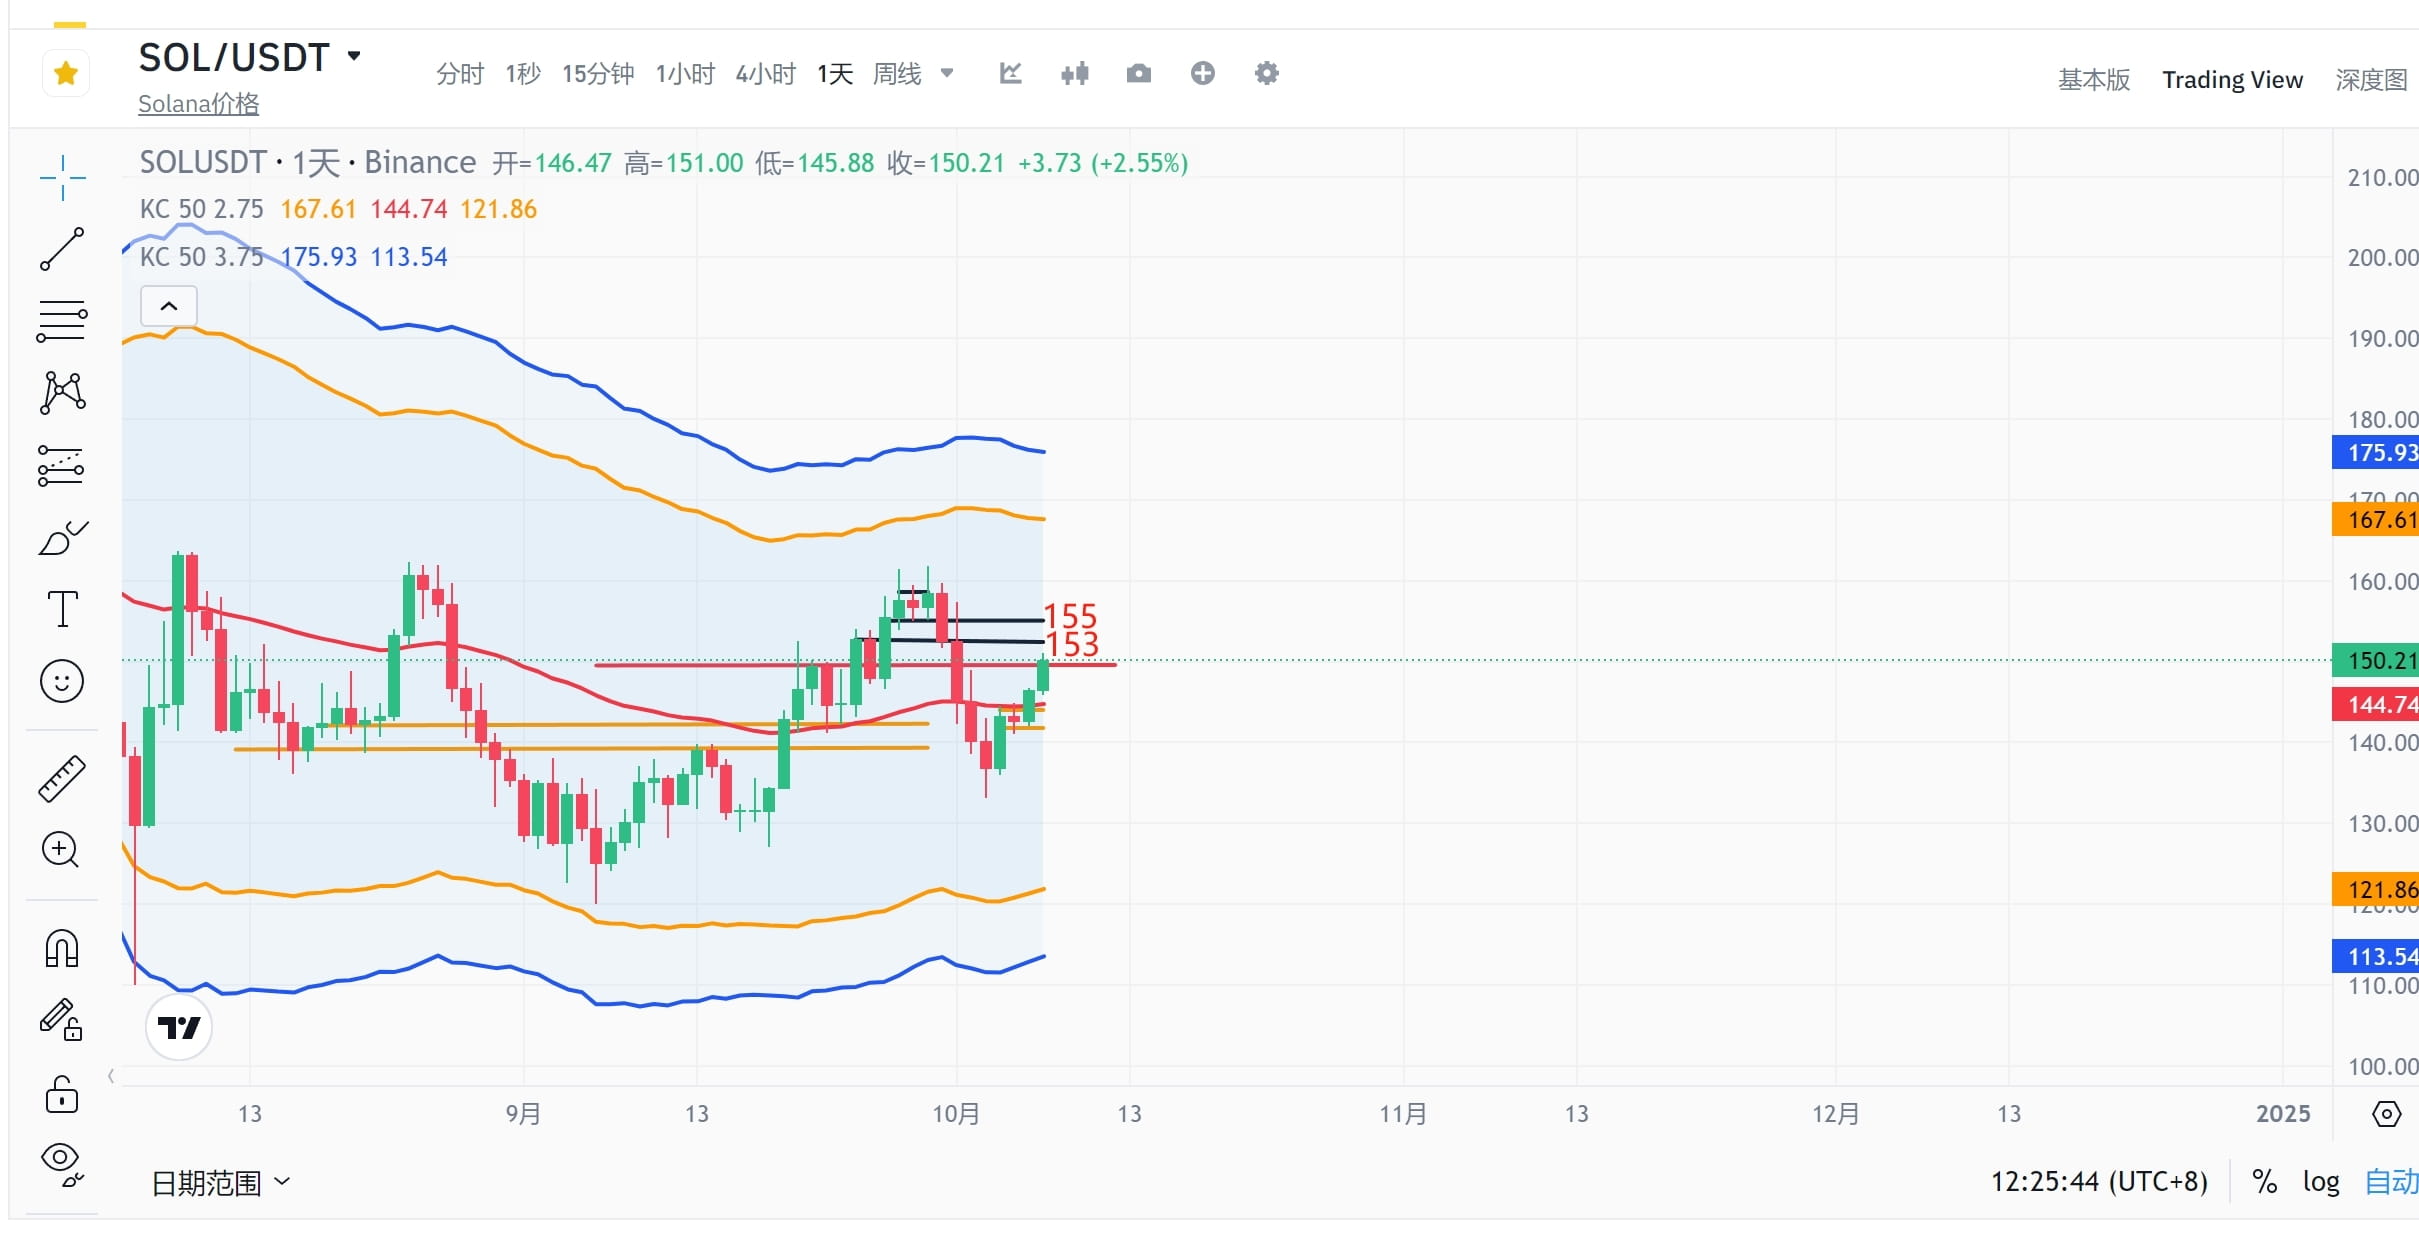
Pay attention to the breakthrough of 153-155 on the daily chart. Sol is relatively easy to judge, but it is hard to say whether it is the strength of wif that brings sol up, or the strength of sol itself that brings wif up. Wif is full of the shadow of the previous not, and dwf is still the same as before. It pulls hard when it is pulled, and smashes hard when it is smashed. After several pulls and smashes, this coin is basically "abandoned". Look at the current not, pepe, and jasmy, and see their previous trends. It is hard to say whether wif is the next one.
Finally, let’s take a look at BNB
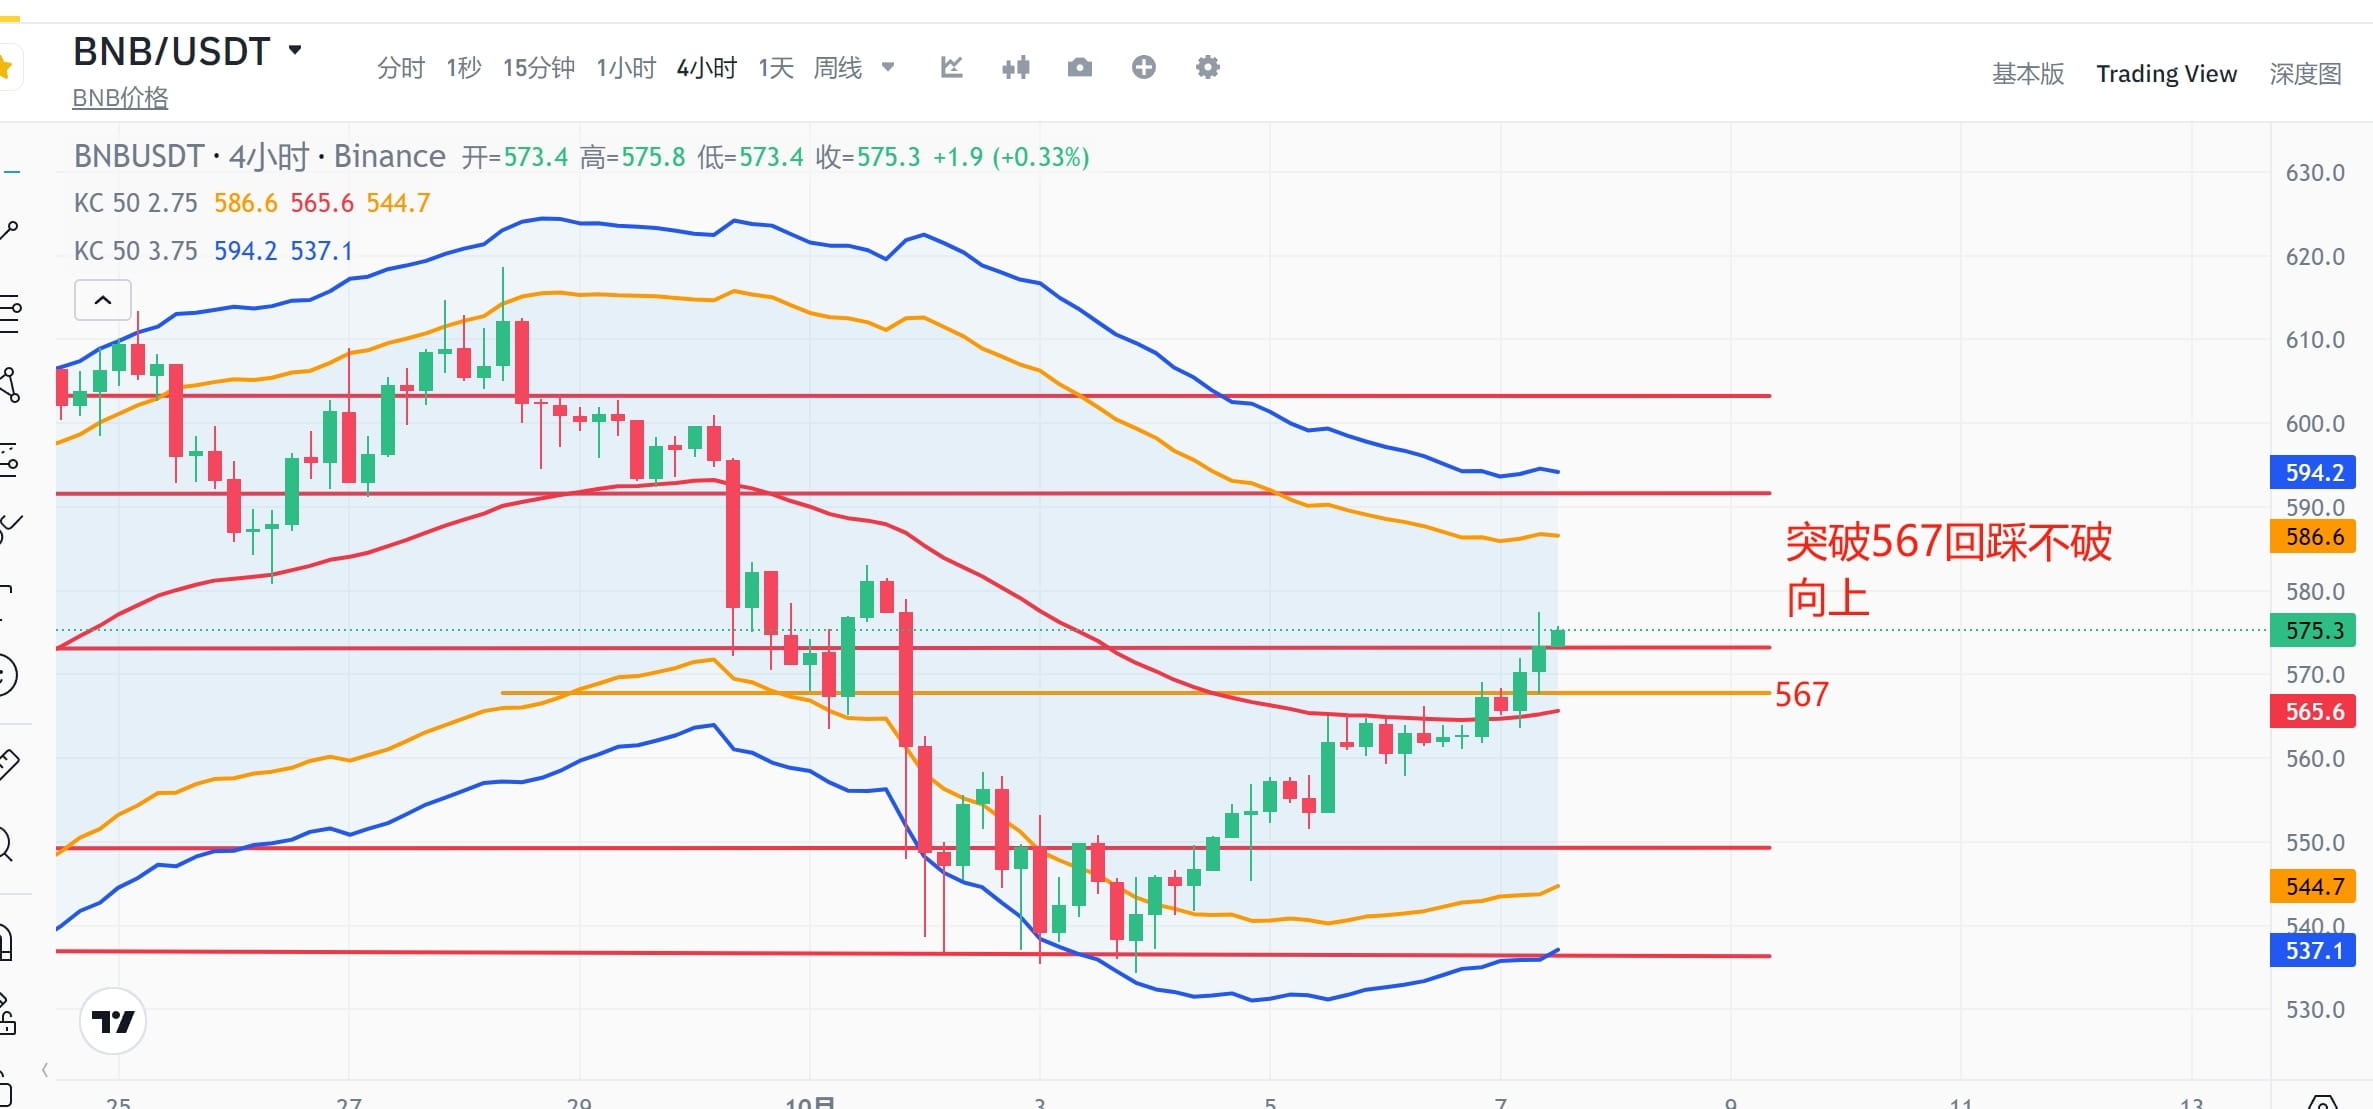
Here you can see the breakthrough and retracement of 567. The positive line breaks through, but the retracement does not break, so it goes up here. Pay attention to 570. Under strong bulls, this position should not be broken. If it is broken, you have to keep an eye on 567. Once it breaks here, it will not be fun.
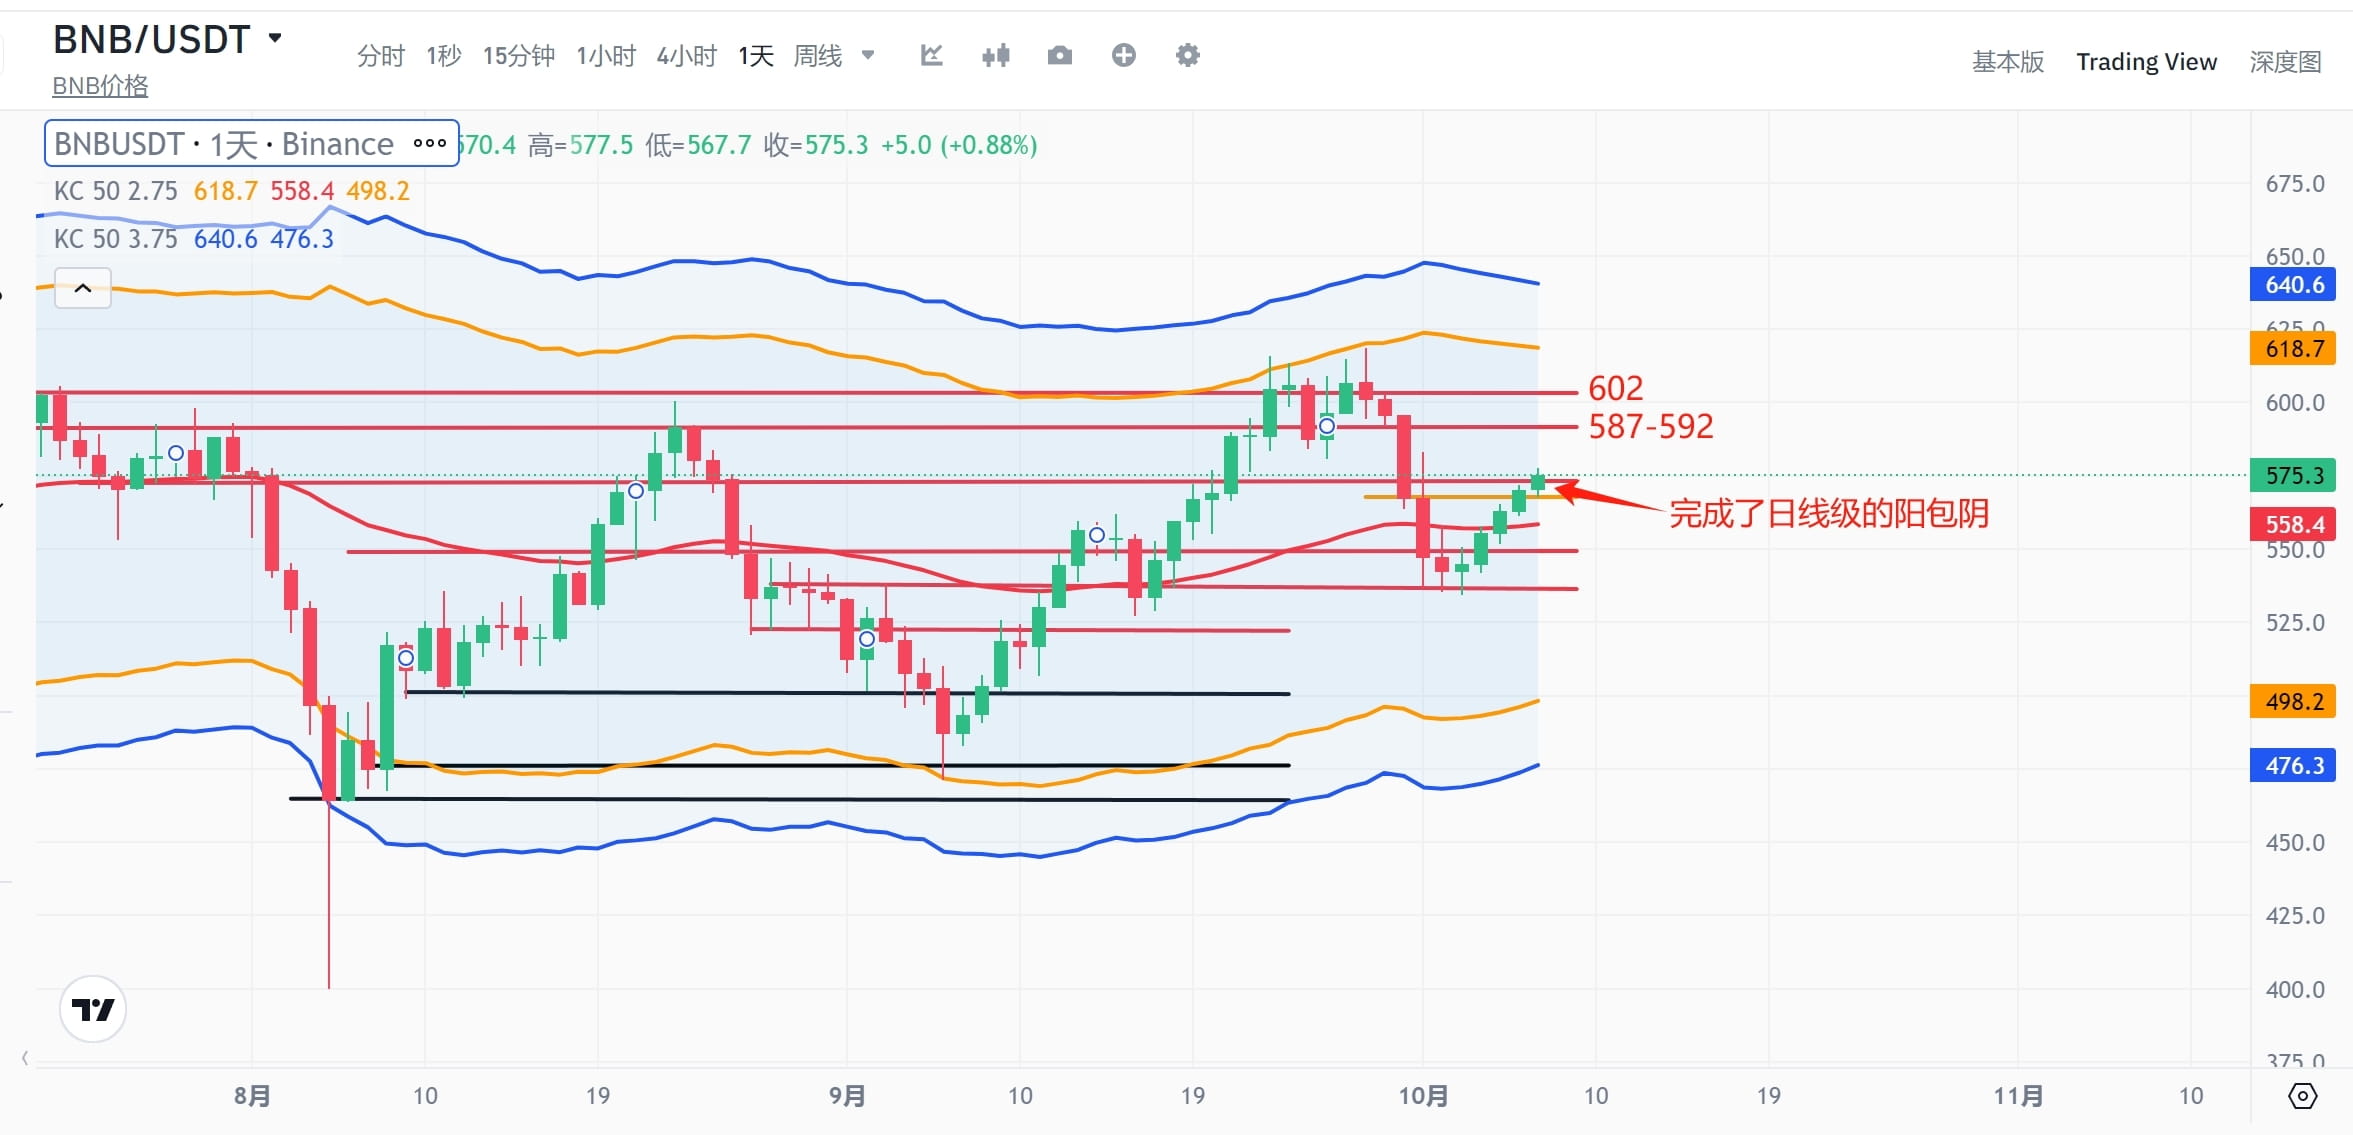
BNB has completed the daily level of Yang Enveloping Yin, and the rest is to see the breakthrough of 587-592. The position of BNB is basically clear, which is easier to identify. The daily line has five consecutive Yangs, which is also bullish. If it is a V-reversal, then this time we can see 618-620.