
Author: Tascha Labs
Compilation: The Way of DeFi
At any point in time, you can assume that the valuation of a blockchain platform is determined by three factors, including:
Adoption and use
Platform moat
Crypto Market Conditions
How do these 3 factors affect the valuation/market value of tokens?
1. Adoption and use:
This is the fundamental valuation driver. Users need a chain’s native token to pay transaction fees. More active users means more people need to hold at least a certain amount of said token, leading to higher token demand and driving prices up.
This is a mechanical relationship that has nothing to do with speculative demand or expectations of price appreciation. Therefore, it is a long-term valuation driver.
2. Platform moat:
This affects investors’ risk assessment of a platform. If a chain is perceived to have a large moat — say, it’s been around for a long time and has a strong community — then more people will consider it a safer bet.
Whether this perception is correct is questionable. The point is that the perception of greater moat and lower risk enables the token to command a premium, all else being equal. I call this the “platform-specific markup” (later, you’ll see what the markups for various chains refer to).
3. Crypto market conditions:
Investor sentiment -- such as risk appetite levels -- affects demand for all tokens. The same is true for overall crypto adoption levels. Without the context of the overall crypto market, it is impossible to talk about the valuation of a single token.
We can use active addresses or transaction counts to measure the adoption and usage of a chain, while using the total crypto market capitalization to represent market conditions. This gives us:
Valuation of a chain = a 1 * (active addresses or transaction count) + a 2 * (total crypto market cap) + (platform specific markup)
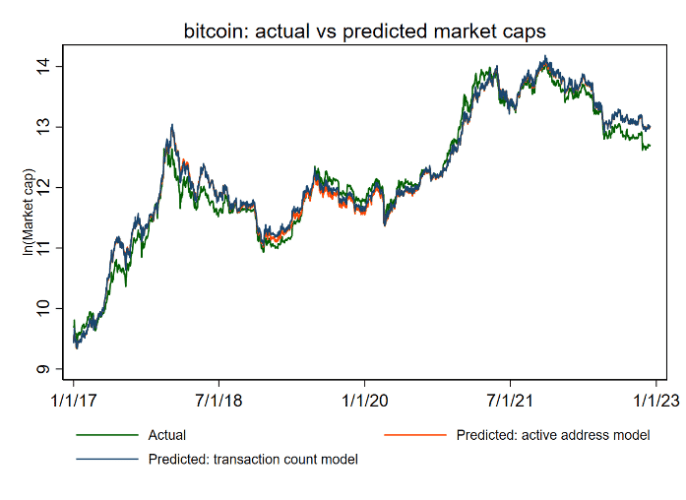
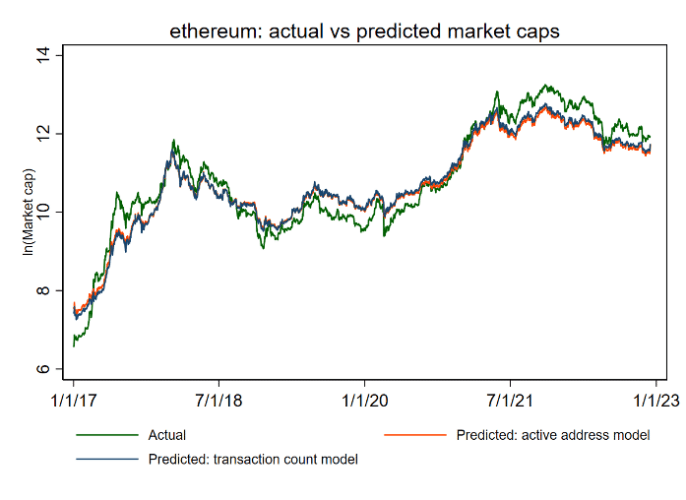
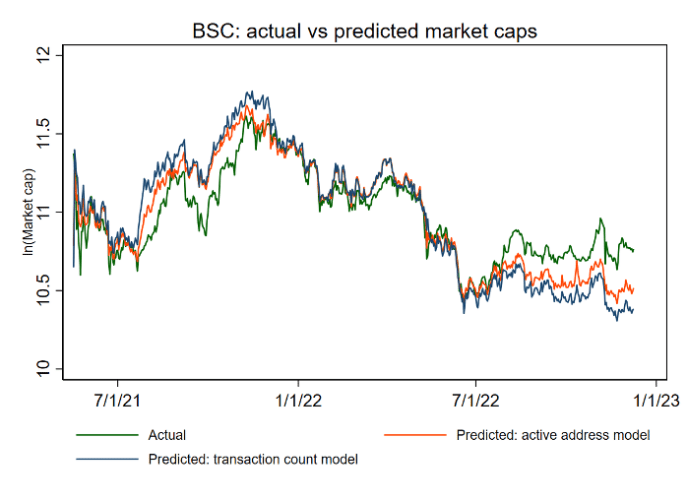
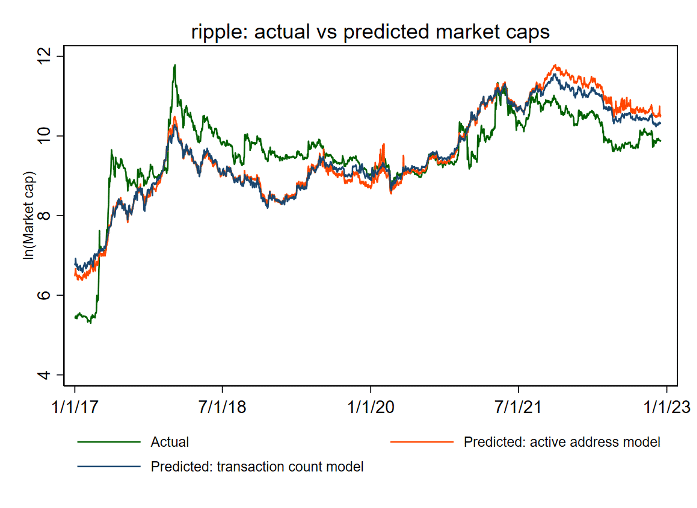
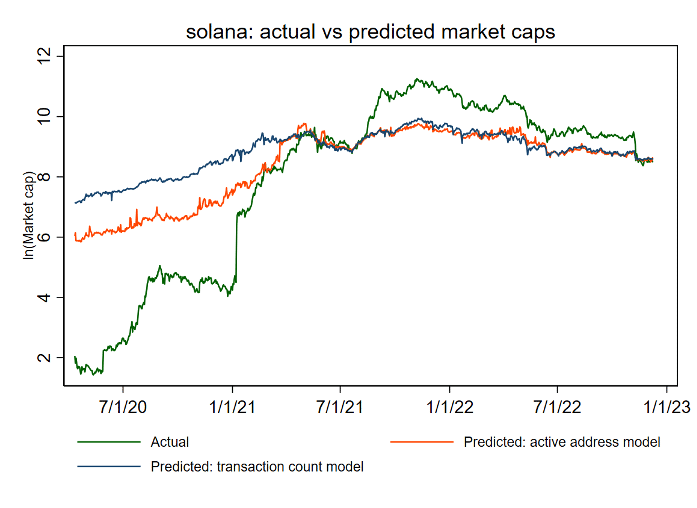
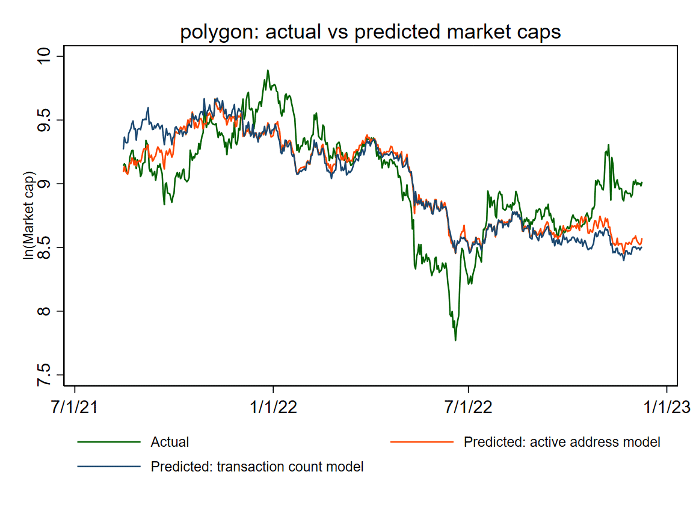
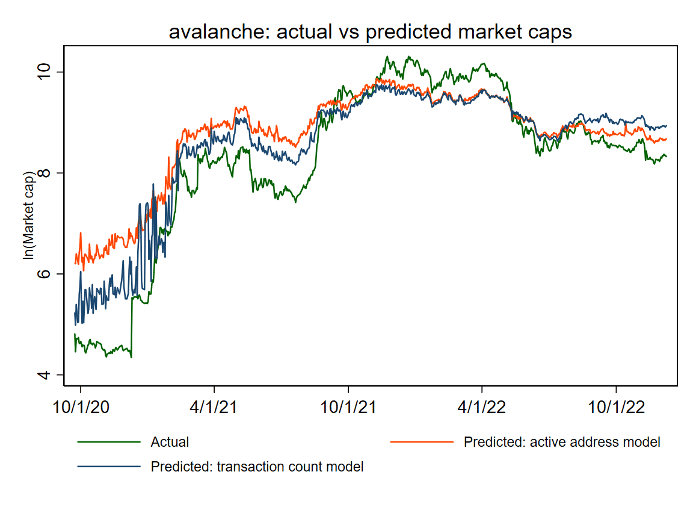
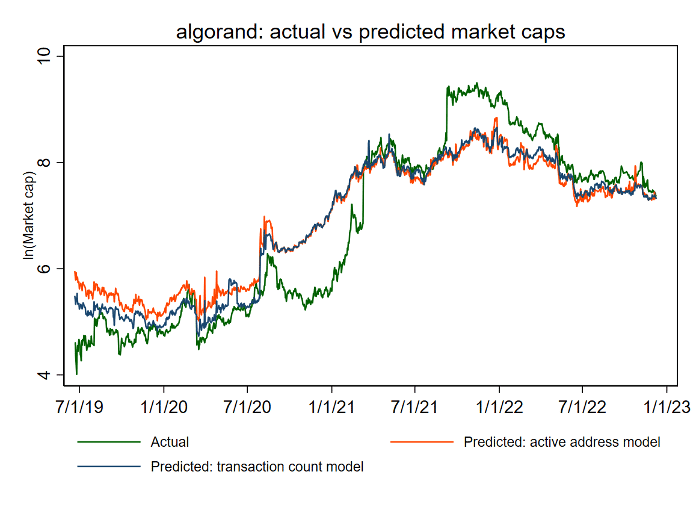
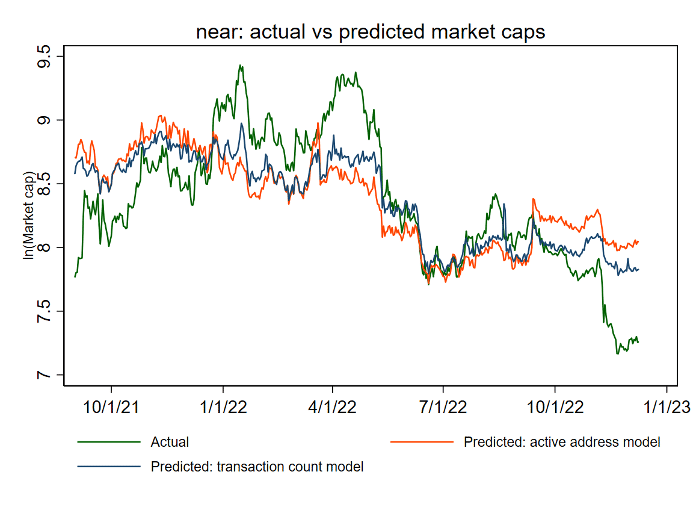
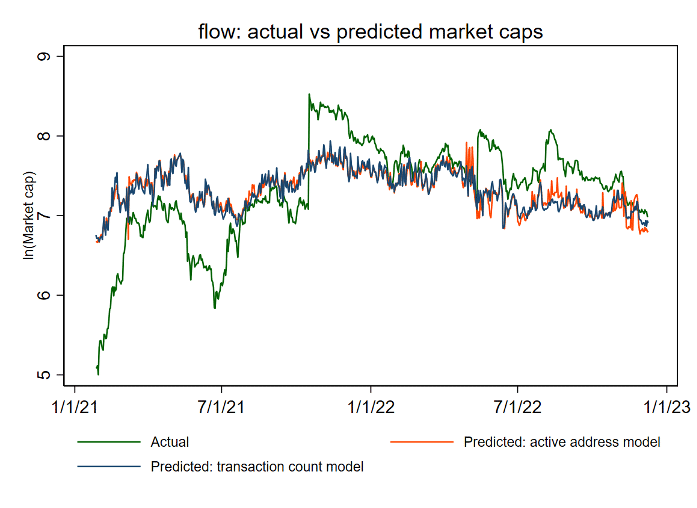
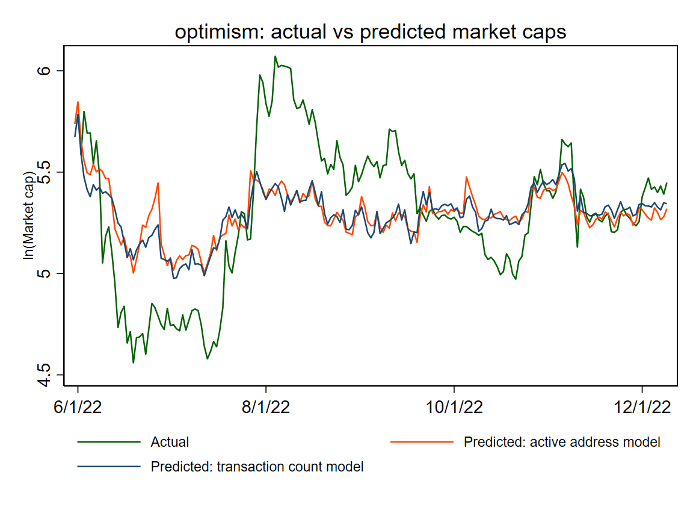
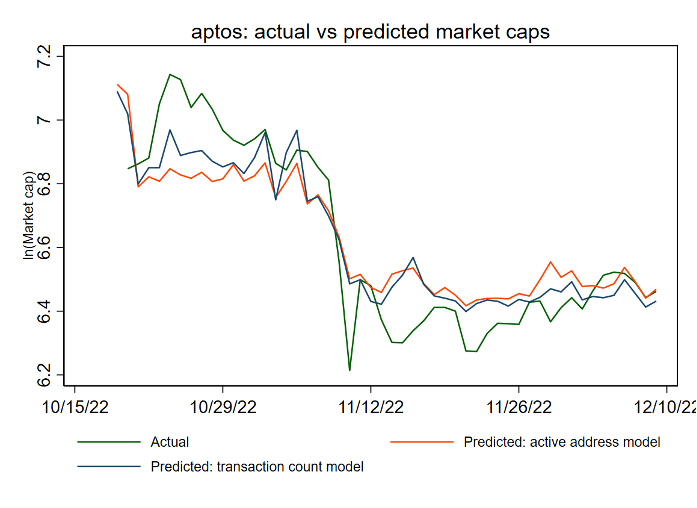
The chart below shows the actual market capitalization (log) and the market capitalization predicted by the model for the 12 major blockchains. The two models use active addresses and transaction counts to measure chain adoption, respectively.
About Terminology
I call the period when the actual market value (green line in the figure below) is higher than the predicted valuation (red and blue lines in the figure below) "overvaluation period", and the opposite is "undervaluation period".
These are awkward terms, because to say something is overvalued or undervalued implies that there is an objective, fixed true value somewhere.
The reality is that all valuations are relative. A chain’s valuation today can only be assessed in light of its past and the overall crypto context.
(It's like your physical location - a concept that seems real and reliable, but is actually just a location relative to the Earth.)
What “overvalued” really means here is that the current market cap is higher than investors have historically valued the platform, taking into account current adoption levels and crypto market conditions.
However, this is just lip service, so we will stick with the terms "overestimate" and "underestimate" for now.
Bitcoin
Ethereum
BSC
Ripple
Solana
Polygon
Avalanche
Algorand
Near
Flow
Optimism
Apartments
Here is a ranking of the gaps between actual and estimated market caps as of two weeks ago, by chain. Again, positive gap = overvalued, negative gap = undervalued.
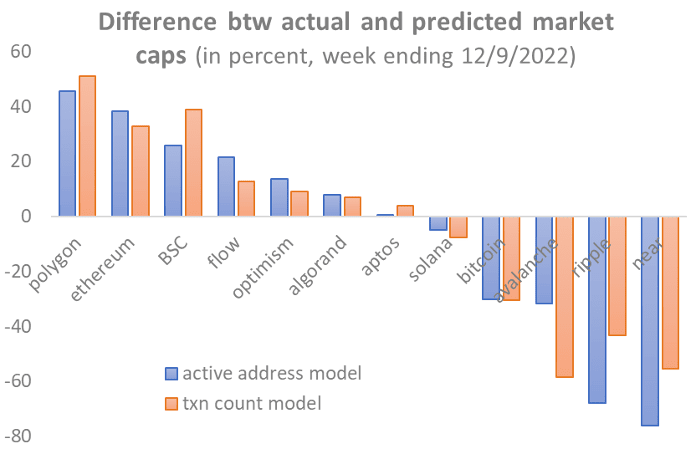
The results show that the most overvalued chains at the moment are:
Polygon
Ethereum
BSC
Flow
The most underrated chains are:
Near
Ripple
Avalanche
Bitcoin
The rest -- Optimism, Aptos, Algorand, Solana -- are all < 10% of the way there. I think these are more or less within the margin of error.
I know these results will hit a nerve with some people. If your favorite chain isn’t in the category you want to see, there are a few things to note:
First, these are results estimated based on experience. I am not imposing any personal opinions. So there is no need to shoot the messenger.
Second, there are a thousand reasons why these results should not apply “to the present situation”—the so-called “this time is different” phenomenon.
For example, you could say that chain xyz is priced higher now because token supply is decreasing, or the market is pricing in higher growth prospects because big projects are coming online. Or chain XXZ is priced lower because it is effectively dead or dying.
Are these all valid reasons? Of course they are.
But no matter how good the reason, remember that historically, periods of overvaluation are often followed by tokens underperforming the overall market in the subsequent year. This overvaluation-underperformance relationship is very strong.
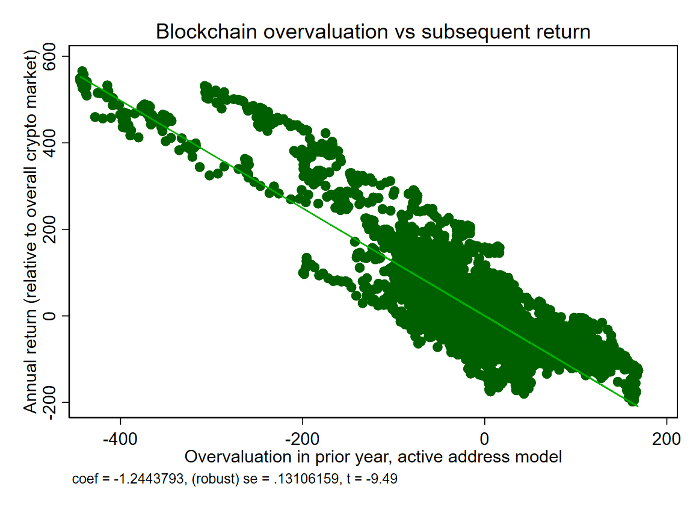
Is the case you have in mind really an exception? Is it statistically likely?
Third, while these valuation gaps often signal a regression, with periods of overvaluation or undervaluation generally lasting between six months and a year, there is no way to accurately predict how long they will last.
Just because a chain looks undervalued today doesn’t mean it will correct itself tomorrow, and vice versa. The classic “value investor” trap is to buy something that looks undervalued, and it will stay undervalued.
When you believe something is undervalued, a better approach is to put it on your radar. But only buy it when you see some signs that the trend may be turning.
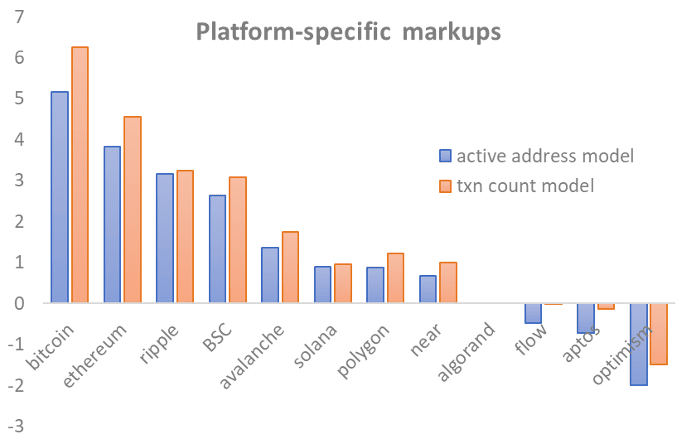
Finally, there are estimates of platform-specific markups. Again, these measure a platform’s moat or perceived risk level. If a chain is perceived to have a larger moat, i.e., more likely to continue to survive and thrive, then it can command a higher price for the same level of adoption and usage.
There are some patterns that stand out among these markups. You are smart. I am sure you can spot what they are.
Finally, while these valuations are based on data from 12 public blockchains, the same framework can be used to evaluate other blockchains, and in fact, any tokenized project with network effect potential, such as a gaming platform.