1. Overview of on-chain analysis
Our on-chain metrics focus on whale activity, capital turnover, and transfer volume momentum. These key on-chain metrics reflect the sentiment of large Bitcoin holders, general market participants, and overall trading activity.
1.1 Whale and Exchange Balance Changes (30 days)
Whale and exchange (>1k BTC) balance change chart shows relative activity. No major accumulation or selling by#BTCmajor holders. There have been occasional whale accumulations or sales over the past few months, but overall whale accumulations or sales remain low. This suggests caution among large investors.
explain:
When whales are not actively accumulating or allocating funds, this often signals a period of consolidation, with the big players waiting for clearer signals from the market before making major moves. This is consistent with the technical charts, where prices have been consolidating around $60,000.
1.2 Changes in net capital turnover position
The capital rotation net position change chart highlights the capital transfer between Bitcoin, Ethereum and stablecoins. The orange section represents stablecoins, showing an increase in capital inflows into these assets, especially in recent months. This shows that investors are turning to low-risk assets, indicating risk aversion in the broader market.
explain:
In times of high uncertainty, capital inflows into stablecoins typically indicate investors’ reluctance to put money into riskier assets such as Bitcoin. This is consistent with the cautious sentiment shown by whale inactivity, reflecting uncertainty about future price direction.
1.3 Transfer Volume Momentum
The transfer volume momentum chart shows that transaction activity on the Bitcoin blockchain has been decreasing over the past few months. The 30-day and 365-day moving averages of transfer volume are trending down, indicating that the overall interest in transaction activity is decreasing.
explain:
Low transfer volume often corresponds to periods of consolidation, during which prices remain relatively stable as fewer market participants actively trade or transfer Bitcoin on-chain. This may reflect a lack of buying interest and selling pressure, indicating a pause in market direction.
2. Technical chart analysis (BTC/USDT 1D TF):
Combined with on-chain data, the one-dimensional time frame technical chart can clearly show the current price trend and key support and resistance levels.
2.1 Trading volume and trading volume distribution
volume:
The volume overview shows that trading volume has been declining since Bitcoin reached its all-time high in 2023. The decline in trading volume, coupled with low on-chain transfer volume, indicates that both retail and institutional participation in the market has slowed, leading to the current consolidation phase.
Volume overview analysis:
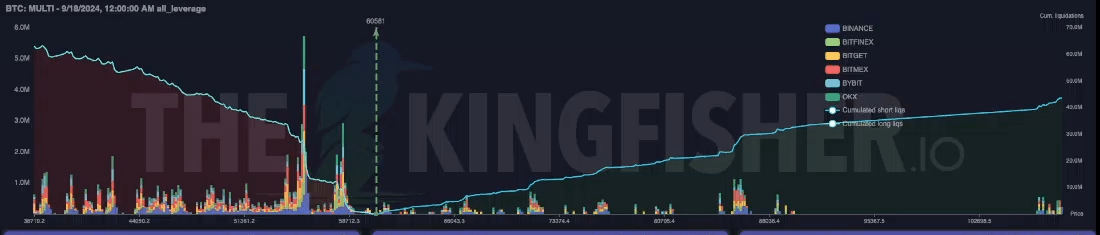
The volume profile shows that volume is highly concentrated around $60,000, indicating that this is an important point of control (PoC) and key support area. However, if Bitcoin fails to hold this level, the volume profile will have a gap between $60,000 and $50,000, which means that if it falls below $60,000, it may fall rapidly.
2.2 Support and resistance levels
Current resistance is at $65,000:
Currently, Bitcoin price is facing resistance near $65,000 after price action stalled in this area. A break above this level could open the doors for Bitcoin price to hit a new all-time high of $70,000.
$60,000 in immediate support:
Looking at the volume distribution, $60,000 is a critical support level. A break below this level could result in a sharp decline as there is a lack of strong trading activity between $60,000 and $50,000.
The main support level is at $45,000-47,000:
In the event of a major pullback, the next major support is around $45,000 to $47,000, where historical buying interest is strong and we are seeing heavy volume.
3. Combination of on-chain data and technical data
By combining on-chain metrics with the 1D chart, we can see a coherent picture of market consolidation with signs of potential downside risk. The following factors come into play:
Whale activity decreases:
The lack of significant accumulation or distribution by whales suggests that large investors are on the sidelines, which is consistent with the consolidation pattern on the technical charts. This lack of activity suggests that the market is unlikely to see major moves until whales begin to re-enter the market.
Increase capital flows to stablecoins:
Capital flows into stablecoins reflect a risk-off sentiment, meaning investors are hedging their bets by putting money into less volatile assets. Unless we see a reversal in this trend of funds flowing back into Bitcoin, this will exacerbate the overall bearish tone.
Transfer volume decreased:
Low on-chain transaction volume is another cautious indicator, with fewer participants actively moving Bitcoin. This further suggests that the market is hesitant and is waiting for a trigger to break out of the current consolidation range.
Volume and Price Action:
The chart supports the view that $60,000 is a critical level. If Bitcoin holds above this level, it is likely to rise. However, given the bearish on-chain signals, if $60,000 fails, a quick drop to the $50,000 range is likely.
4. Forecasts and price levels to watch
After comprehensive analysis, the following situations may occur.
Neutral-Bearish Short-Term Outlook:
Bearish scenario:
If whale accumulation remains low, capital continues to flow into stablecoins, and transfer volumes remain sluggish, there is a risk of a break below $60,000. In this case, the next major support levels are at $55,000 and $47,000, where buyers are likely to step in.
Bullish scenario:
If whales start accumulating again and we see capital flowing back into Bitcoin, then Bitcoin could break above $65,000 with a target of $70,000 and beyond. For this scenario, watch for increased on-chain activity and increased transfer volume, which are early signs of renewed buying interest.
Key Level:
support:
$60,000 (immediate support), $55,000, and $47,000 (primary support).
Resistance:
$65,000 and $70,000 (all-time high).
in conclusion:
The market is in a consolidation phase, with both on-chain and technical data pointing to uncertainty. If Bitcoin sustains above $60,000, there is upside potential, but a break below this level could result in a sharp price correction to $50,000. Watch for increased whale activity, capital flows back into Bitcoin, and increased transfer volumes as indicators of renewed bullish momentum. Until then, caution is advised, and the market may remain range-bound in the short term.
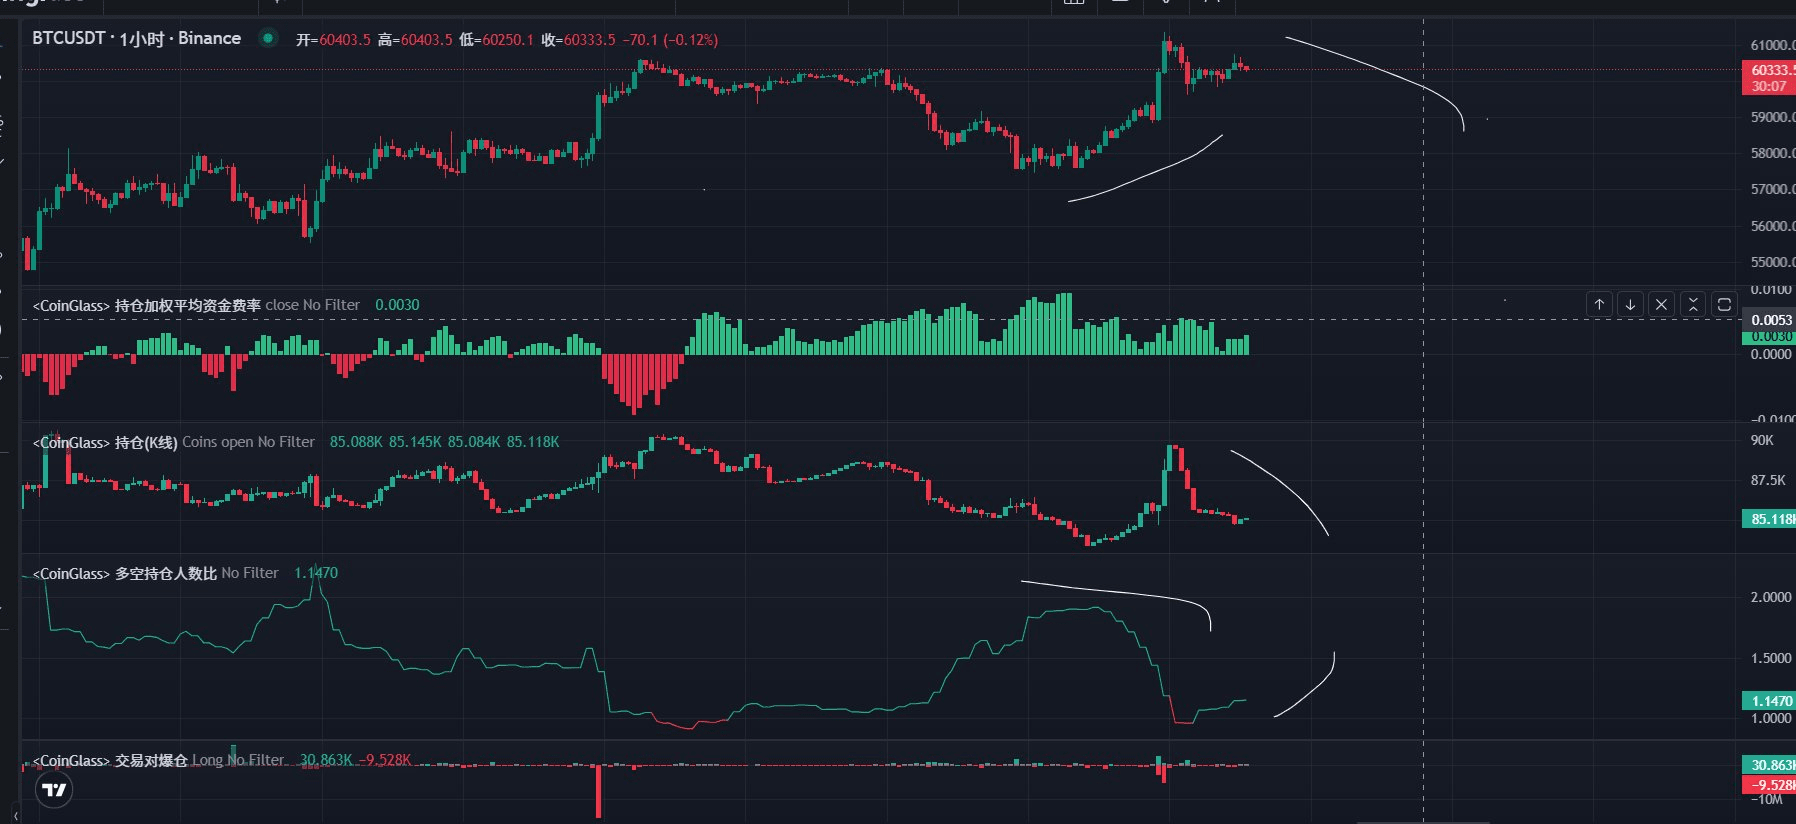
With this analysis, you now have a good idea of whale sentiment. It is important to note that key news events can activate whales, either bullish or bearish. Therefore, keeping a close eye on the market, especially volume, is crucial. From yesterday's futures analysis, we know that whales began to allocate around $60,000, which matches up well with today's findings. However, yesterday's analysis also showed that whales were mostly in short positions. Later today, I will conduct another futures market analysis using Hyblock Capital data to assess where the market is positioned ahead of the Fed decision. With some understanding and a little luck, we can successfully navigate today together.
