BTC experienced a sharp drop around 10 o'clock last night, directly breaking through the previous low of 25166, and set a new low of 24901 at 4 o'clock in the morning. It has now rebounded above 25000 to 25152.
The trend of Bitcoin is completely consistent with the deduction made in this article on September 1, without any error, which once again perfectly illustrates the subtlety of the Chaos Theory technique: predicting without predicting!
Apart from the Chaos Theory, what other technology can achieve such accurate prediction? When the trend can be seen through the Chaos Theory technology as clearly as the lines on your palm, and when sufficient theoretical confidence and trading confidence are established through the Chaos Theory technology, it becomes simple and efficient to formulate trading plans and execute trading strategies. This is the most solid foundation for achieving stable profits in the cryptocurrency circle, nothing else!
Many friends may be curious and ask: How did you do it? Why can you make such accurate judgments? I will keep it a secret here. Friends who are interested can join the community. I will solve the mystery in the next live broadcast.
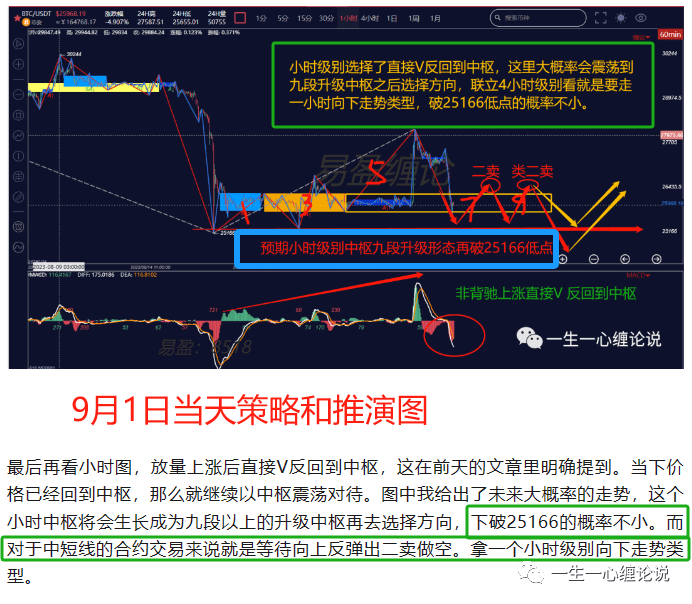
The above picture is a partial screenshot of this article on September 1st. Each trend is almost consistent with the actual market. At that time, the deduction of the nine-stage upgraded plunge pattern was clearly made, and the rebound was prompted to sell short, and a downward trend type was taken, which was perfectly achieved!
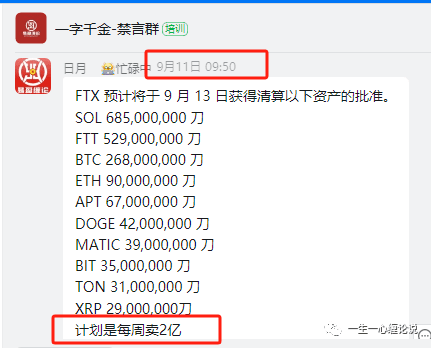
The bull market has already been hyped up, and now it is back to the market. Yesterday's sharp drop should be related to FTX's liquidation of its assets after bankruptcy, and the community will also remind you of the risk in the 10,000-word ban group tomorrow morning.
The buying point always appears in the panic decline! Bitcoin has broken a new low. After breaking 25,000 at around 11 o'clock last night, I have clearly reminded in the community: If you don't buy now, when will you buy! Buying here refers to spot. I have bought 30% of spot Bitcoin. Of course, buying now belongs to the left side, so I have to intervene in batches. The expectation is to do a 4-hour upward segment.
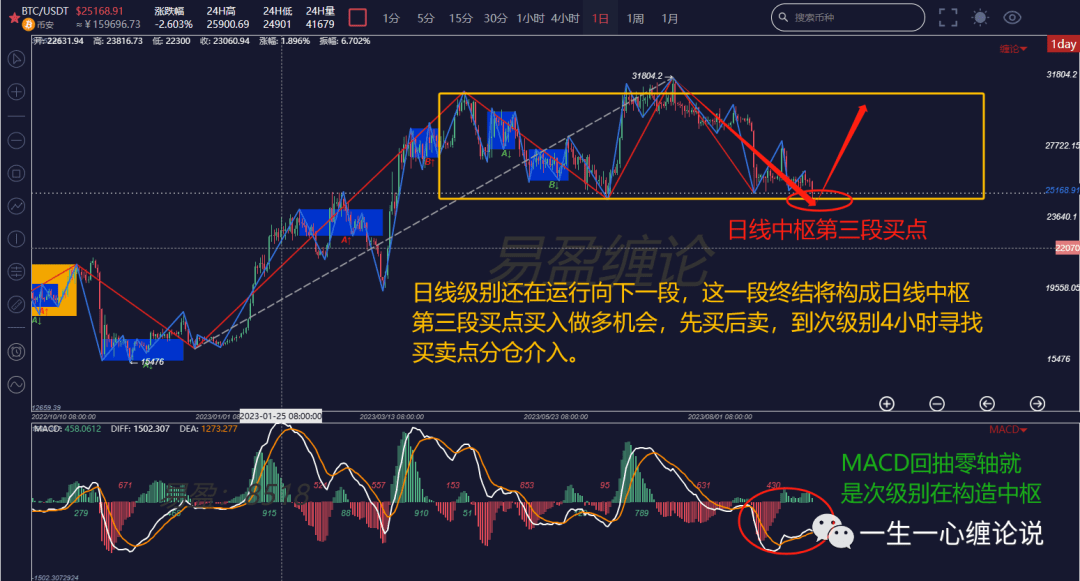
First look at the daily chart. It is still moving downward. The end of this downward movement will constitute the third buying point of the daily central axis. Buy first and sell later. Of course, the layout of the daily line now belongs to the left side, because it hit a new low last night. There is no problem with the long-term position to make a 20% bottom position spot. It is not too late to buy in batches after the daily line is released. Now it is just a rebound opportunity, not a reversal.
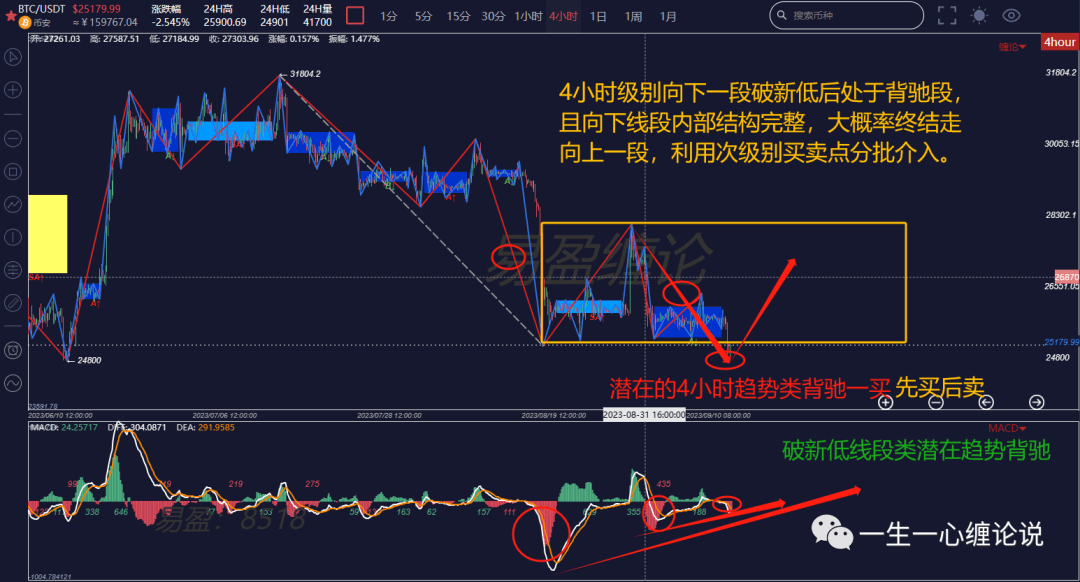
Looking at the 4-hour chart again, it is obviously in the divergence segment after breaking the new low, and the downward line segment also diverges. This is a 4-hour level line segment trend divergence, which is a potential 4-hour buy, and at least it will give the 4-hour upward space. Therefore, the next strategy is to buy in batches when a buy point appears at the secondary level.
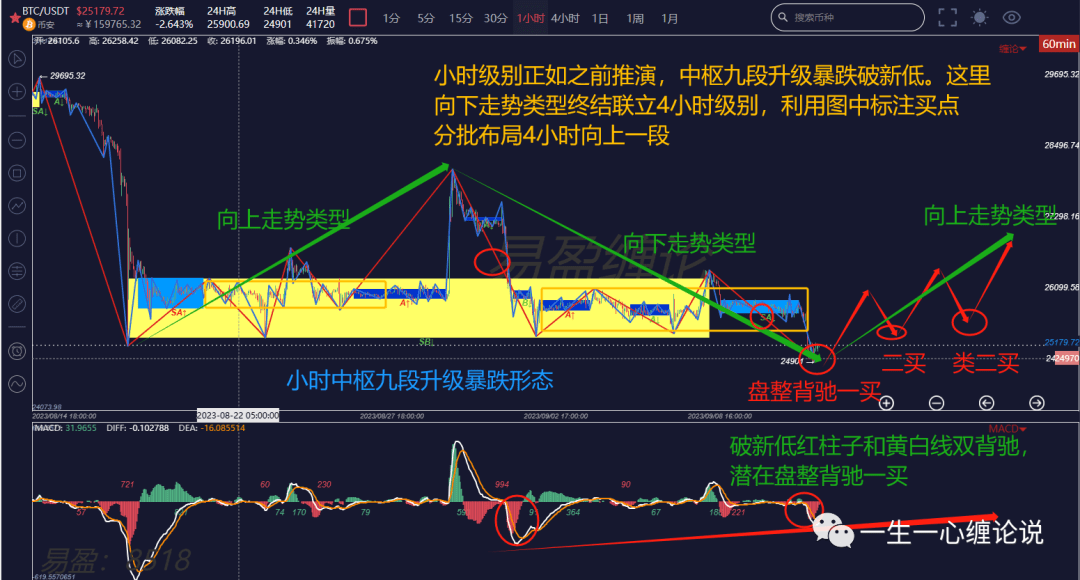
Finally, let's look at this classic hourly chart. The actual chart and the 1-day deduction chart only have slight differences in the points of each line segment. As can be seen from the chart, the hourly downward trend type after breaking the new low is also in the consolidation divergence segment, which is a potential first buy. Therefore, you can buy spot in batches here, and add positions when the second buy type in the chart appears. The expected 1-hour upward trend type (green line) corresponds to the 4-hour upward segment.
The above analysis is for reference only and does not constitute any investment advice!

