

#zcashetfpostsfirstweeklyoutflow$93.6m
zcashetfpostsfirstweeklyoutflow$93.6m
Hot
Latest

Article
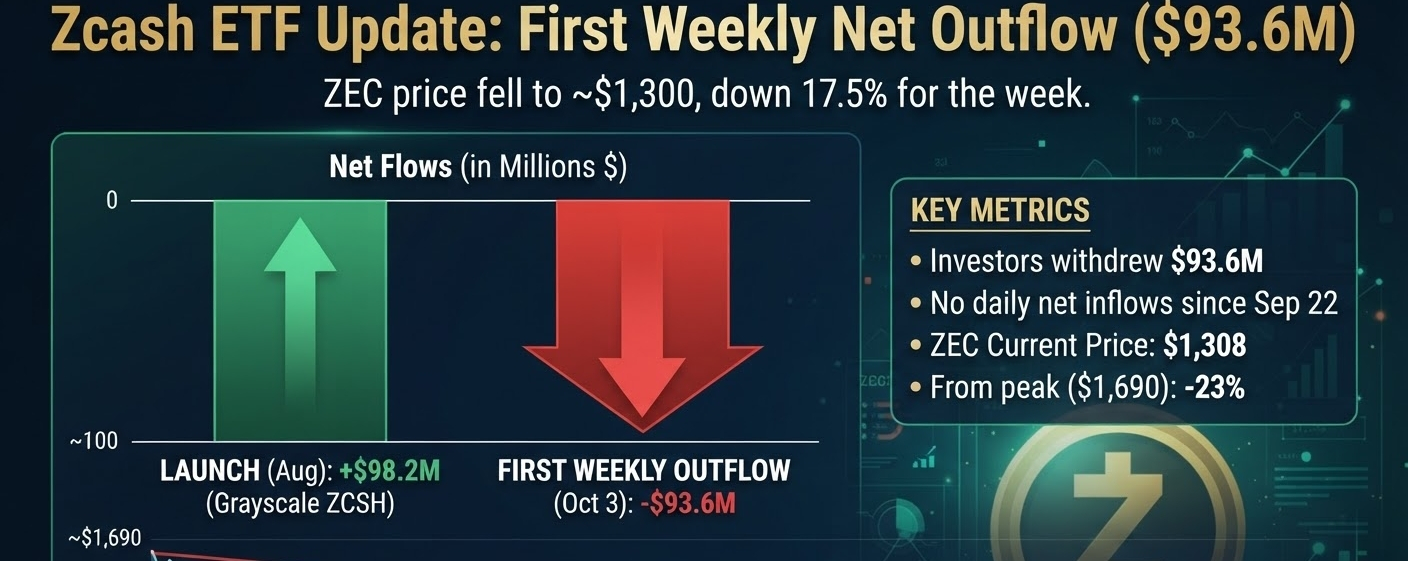
🚨 Zcash ETF Update: First Weekly Net Outflow ($93.6M) 📉#ZcashETFPostsFirstWeeklyOutflow$93.6M
🚀 Zcash ETF Update: First Weekly Net Outflow Recorded! 📉
Zcash ($ZEC) spot exchange-traded funds (ETFs) have experienced their first weekly net outflow since their official launch in August. 📊
According to market data from SoSoValue, investors pulled a total of $93.6 million as the price of ZEC retreated toward the $1,300 mark. 💸 This sharp shift follows a strong period where Grayscale’s ZCSH product alone attracted $98.2 million just two weeks prior. However, market momentum cooled significantly, with zero daily net inflows recorded since September 22. 🛑
As of October 3, ZEC was trading around $1,308, marking a decline of approximately 17.5% for the week and sitting about 23% lower than its recent peak of $1,690. 📉🔍
#zcash #ZEC #CryptoNews #ETF #MarketUpdate #BinanceSquare
$ZEC
🚨 Zcash ETF Update: First Weekly Net Outflow ($93.6M) 📉
#ZcashETFPostsFirstWeeklyOutflow$93.6M
🚀 Zcash ETF Update: First Weekly Net Outflow Recorded! 📉
Zcash ($ZEC ) spot exchange-traded funds (ETFs) have experienced their first weekly net outflow since their official launch in August. 📊
According to market data from SoSoValue, investors pulled a total of $93.6 million as the price of ZEC retreated toward the $1,300 mark. 💸 This sharp shift follows a strong period where Grayscale’s ZCSH product alone attracted $98.2 million just two weeks prior. However, market momentum cooled significantly, with zero daily net inflows recorded since September 22. 🛑
As of October 3, ZEC was trading around $1,308, marking a decline of approximately 17.5% for the week and sitting about 23% lower than its recent peak of $1,690. 📉🔍
#zcash #ZEC #CryptoNews #ETF #MarketUpdate #BinanceSquare
$ZEC
🚀 Zcash ETF Update: First Weekly Net Outflow Recorded! 📉
Zcash ($ZEC ) spot exchange-traded funds (ETFs) have experienced their first weekly net outflow since their official launch in August. 📊
According to market data from SoSoValue, investors pulled a total of $93.6 million as the price of ZEC retreated toward the $1,300 mark. 💸 This sharp shift follows a strong period where Grayscale’s ZCSH product alone attracted $98.2 million just two weeks prior. However, market momentum cooled significantly, with zero daily net inflows recorded since September 22. 🛑
As of October 3, ZEC was trading around $1,308, marking a decline of approximately 17.5% for the week and sitting about 23% lower than its recent peak of $1,690. 📉🔍
#zcash #ZEC #CryptoNews #ETF #MarketUpdate #BinanceSquare
$ZEC
7


·
--
ZCASH ETF UPDATE
Zcash’s ETF has recorded its first weekly net outflow since launching in August.
Investors withdrew $93.6M as $ZEC fell toward $1,300. Grayscale’s ZCSH had attracted $98.2M two weeks earlier, but no daily net inflows have been recorded since September 22, according to SoSoValue.
ZEC was around $1,308 on October 3, down about 17.5% for the week and roughly 23% from its recent $1,690 peak.
$ZEC
{future}(ZECUSDT)
ZCASH ETF UPDATE
Zcash’s ETF has recorded its first weekly net outflow since launching in August.
Investors withdrew $93.6M as $ZEC fell toward $1,300. Grayscale’s ZCSH had attracted $98.2M two weeks earlier, but no daily net inflows have been recorded since September 22, according to SoSoValue.
ZEC was around $1,308 on October 3, down about 17.5% for the week and roughly 23% from its recent $1,690 peak.
$ZEC
Zcash’s ETF has recorded its first weekly net outflow since launching in August.
Investors withdrew $93.6M as $ZEC fell toward $1,300. Grayscale’s ZCSH had attracted $98.2M two weeks earlier, but no daily net inflows have been recorded since September 22, according to SoSoValue.
ZEC was around $1,308 on October 3, down about 17.5% for the week and roughly 23% from its recent $1,690 peak.
$ZEC
146

·
--
Bullish
#usrussiaukrainetalksreportedlyincludelukoiloildeal
🌍 "Geopolitical Shift: US-Russia-Ukraine Peace Talks Reportedly Touch on Lukoil Energy Deal" 🛢️📉
$ZEC
{future}(ZECUSDT)
Major geopolitical headlines are breaking across financial news outlets today. High-level diplomatic discussions between U.S. representatives and Russian officials aimed at resolving the conflict in Ukraine have expanded to include a potential multibillion-dollar deal regarding Lukoil's international energy assets.
Reports indicate that potential asset restructuring or joint post-war energy frameworks could form part of broader economic normalization efforts if diplomatic breakthroughs materialize.
🧠 What Does This Mean for Global Markets & Crypto?
Crude Oil & Inflation Expectations: A potential easing of energy friction and sanctions risks could cool global crude prices. Lower energy prices naturally reduce headline inflation pressure, giving central banks around the world wider room to lower interest rates.
Global Liquidity Inflow: Any credible path toward geopolitical de-escalation tends to reduce systemic "black swan" risk premiums across global capital markets.
Risk-On Sentiment for Crypto: When systemic macro risks fade and energy-driven inflation cools, capital historically shifts out of safe-haven assets (cash, short-term bonds) and back into high-growth risk-on sectors like $BTC, $ETH, and major altcoins.
$NVDA.US
{stock_us}(NVDA.US)
📊 Key Macro Factors to Track:
Energy Markets: Crude oil price volatility and supply supply-chain recalibration.
Macro Inflation: Consumer Price Index (CPI) trends influenced by energy costs.
Capital Flows: Shift from defensive positions into digital assets and global equities.
👇 What’s your take on this news? Do you see geopolitical de-escalation kicking off a bigger rally across risk assets, or are you staying cautious? Share your thoughts below! 💬👇
#GreekPoliceBustCryptoScamRingArrest17 #ZcashETFPostsFirstWeeklyOutflow$93.6M
#usrussiaukrainetalksreportedlyincludelukoiloildeal
🌍 "Geopolitical Shift: US-Russia-Ukraine Peace Talks Reportedly Touch on Lukoil Energy Deal" 🛢️📉
$ZEC
Major geopolitical headlines are breaking across financial news outlets today. High-level diplomatic discussions between U.S. representatives and Russian officials aimed at resolving the conflict in Ukraine have expanded to include a potential multibillion-dollar deal regarding Lukoil's international energy assets.
Reports indicate that potential asset restructuring or joint post-war energy frameworks could form part of broader economic normalization efforts if diplomatic breakthroughs materialize.
🧠 What Does This Mean for Global Markets & Crypto?
Crude Oil & Inflation Expectations: A potential easing of energy friction and sanctions risks could cool global crude prices. Lower energy prices naturally reduce headline inflation pressure, giving central banks around the world wider room to lower interest rates.
Global Liquidity Inflow: Any credible path toward geopolitical de-escalation tends to reduce systemic "black swan" risk premiums across global capital markets.
Risk-On Sentiment for Crypto: When systemic macro risks fade and energy-driven inflation cools, capital historically shifts out of safe-haven assets (cash, short-term bonds) and back into high-growth risk-on sectors like $BTC, $ETH, and major altcoins.
$NVDA.US
📊 Key Macro Factors to Track:
Energy Markets: Crude oil price volatility and supply supply-chain recalibration.
Macro Inflation: Consumer Price Index (CPI) trends influenced by energy costs.
Capital Flows: Shift from defensive positions into digital assets and global equities.
👇 What’s your take on this news? Do you see geopolitical de-escalation kicking off a bigger rally across risk assets, or are you staying cautious? Share your thoughts below! 💬👇
#GreekPoliceBustCryptoScamRingArrest17 #ZcashETFPostsFirstWeeklyOutflow$93.6M
🌍 "Geopolitical Shift: US-Russia-Ukraine Peace Talks Reportedly Touch on Lukoil Energy Deal" 🛢️📉
$ZEC
Major geopolitical headlines are breaking across financial news outlets today. High-level diplomatic discussions between U.S. representatives and Russian officials aimed at resolving the conflict in Ukraine have expanded to include a potential multibillion-dollar deal regarding Lukoil's international energy assets.
Reports indicate that potential asset restructuring or joint post-war energy frameworks could form part of broader economic normalization efforts if diplomatic breakthroughs materialize.
🧠 What Does This Mean for Global Markets & Crypto?
Crude Oil & Inflation Expectations: A potential easing of energy friction and sanctions risks could cool global crude prices. Lower energy prices naturally reduce headline inflation pressure, giving central banks around the world wider room to lower interest rates.
Global Liquidity Inflow: Any credible path toward geopolitical de-escalation tends to reduce systemic "black swan" risk premiums across global capital markets.
Risk-On Sentiment for Crypto: When systemic macro risks fade and energy-driven inflation cools, capital historically shifts out of safe-haven assets (cash, short-term bonds) and back into high-growth risk-on sectors like $BTC, $ETH, and major altcoins.
$NVDA.US
📊 Key Macro Factors to Track:
Energy Markets: Crude oil price volatility and supply supply-chain recalibration.
Macro Inflation: Consumer Price Index (CPI) trends influenced by energy costs.
Capital Flows: Shift from defensive positions into digital assets and global equities.
👇 What’s your take on this news? Do you see geopolitical de-escalation kicking off a bigger rally across risk assets, or are you staying cautious? Share your thoughts below! 💬👇
#GreekPoliceBustCryptoScamRingArrest17 #ZcashETFPostsFirstWeeklyOutflow$93.6M

82

·
--
🚨 GREEK POLICE JUST BUSTED A CRYPTO SCAM RING — 17 ARRESTED, INCLUDING 9 MILITARY PERSONNEL.
This wasn’t some tiny Telegram rug.
Greek authorities say the network had been operating since at least 2025, using fake crypto-investment promises and pyramid-style recruiting to pull in new victims. Police estimate more than $8M flowed into the scheme.
The pitch was classic greed bait:
“Double your money in 50 days.”
Victims were encouraged to bring in more participants for bigger returns, while withdrawals were later frozen. Binance News says roughly 10,000 people may have participated, with average investments near €800.
Police arrested 17 suspects, while another 9 people were named in the case file. Authorities also seized hundreds of thousands of euros in cash and other evidence.
The real lesson?
Crypto didn’t create the scam.
The scam just used crypto as the wrapper.
Whenever the pitch is:
Guaranteed returns.
Recruit more people.
Double your money fast.
That’s not investing.
That’s the exit liquidity talking. 👀
$BTC $ETH $BNB
#greekpolicebustcryptoscamringarrest17 #ZcashETFPostsFirstWeeklyOutflow$93.6M #BitcoinRejectedAt$87K #FedOctoberRateHikeOddsFallTo17% #NvidiaHitsRecordHighUp2.4%
🚨 GREEK POLICE JUST BUSTED A CRYPTO SCAM RING — 17 ARRESTED, INCLUDING 9 MILITARY PERSONNEL.
This wasn’t some tiny Telegram rug.
Greek authorities say the network had been operating since at least 2025, using fake crypto-investment promises and pyramid-style recruiting to pull in new victims. Police estimate more than $8M flowed into the scheme.
The pitch was classic greed bait:
“Double your money in 50 days.”
Victims were encouraged to bring in more participants for bigger returns, while withdrawals were later frozen. Binance News says roughly 10,000 people may have participated, with average investments near €800.
Police arrested 17 suspects, while another 9 people were named in the case file. Authorities also seized hundreds of thousands of euros in cash and other evidence.
The real lesson?
Crypto didn’t create the scam.
The scam just used crypto as the wrapper.
Whenever the pitch is:
Guaranteed returns.
Recruit more people.
Double your money fast.
That’s not investing.
That’s the exit liquidity talking. 👀
$BTC $ETH $BNB
#greekpolicebustcryptoscamringarrest17 #ZcashETFPostsFirstWeeklyOutflow$93.6M #BitcoinRejectedAt$87K #FedOctoberRateHikeOddsFallTo17% #NvidiaHitsRecordHighUp2.4%
This wasn’t some tiny Telegram rug.
Greek authorities say the network had been operating since at least 2025, using fake crypto-investment promises and pyramid-style recruiting to pull in new victims. Police estimate more than $8M flowed into the scheme.
The pitch was classic greed bait:
“Double your money in 50 days.”
Victims were encouraged to bring in more participants for bigger returns, while withdrawals were later frozen. Binance News says roughly 10,000 people may have participated, with average investments near €800.
Police arrested 17 suspects, while another 9 people were named in the case file. Authorities also seized hundreds of thousands of euros in cash and other evidence.
The real lesson?
Crypto didn’t create the scam.
The scam just used crypto as the wrapper.
Whenever the pitch is:
Guaranteed returns.
Recruit more people.
Double your money fast.
That’s not investing.
That’s the exit liquidity talking. 👀
$BTC $ETH $BNB
#greekpolicebustcryptoscamringarrest17 #ZcashETFPostsFirstWeeklyOutflow$93.6M #BitcoinRejectedAt$87K #FedOctoberRateHikeOddsFallTo17% #NvidiaHitsRecordHighUp2.4%
246

·
--
#fedoctoberratehikeoddsfallto17%
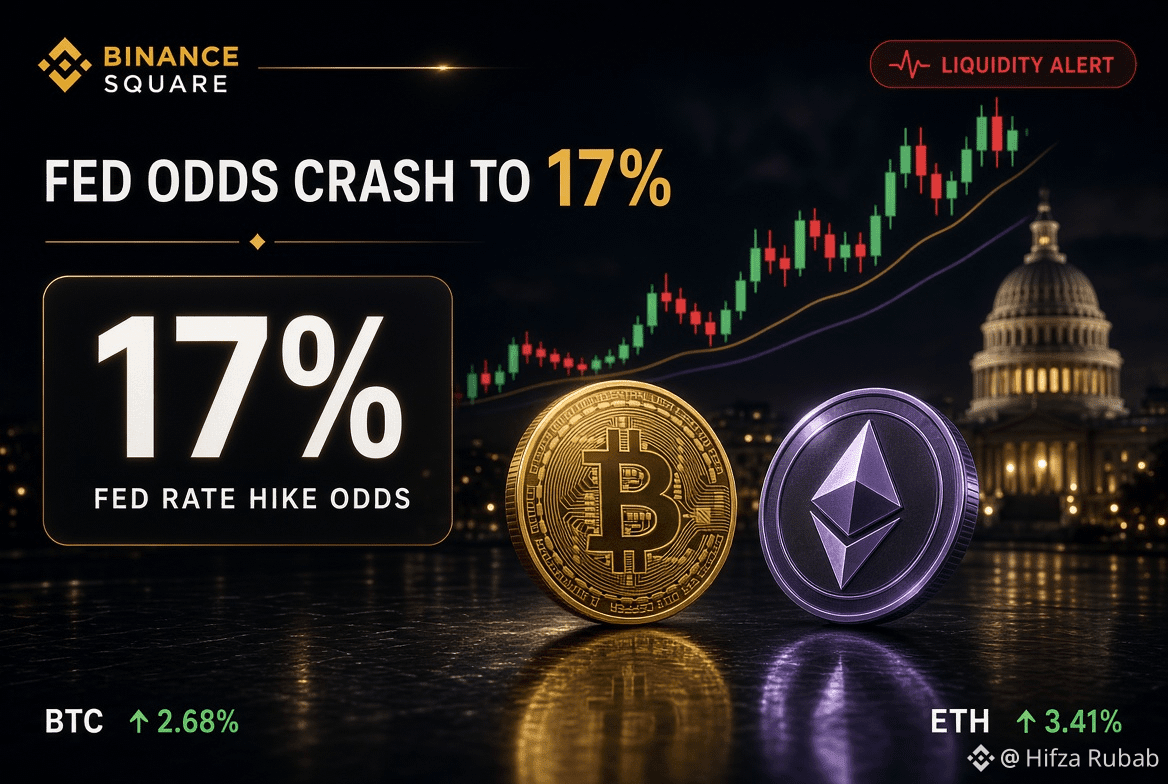
🚨 LIQUIDITY ALERT: FED RATE HIKE ODDS DROP TO 17%! 📊⚡
A weak U.S. jobs report has crashed October Fed rate hike odds from 75% down to 17%!
Easing policy expectations lower yields and unlock market liquidity, creating a powerful macro boost for crypto risk assets! 🚀🔥
💡 TRADER TAKEAWAY:
Fewer rate hikes = expanding global liquidity → strong crypto inflows! However, a cooling job market means watching economic data closely before taking heavy leverage! 📈⚠️
🔍 2 MACRO COINS TO WATCH:
🌐 $BTC (Bitcoin) — Prime liquidity sponge leading the market charge as macro headwinds fade! 💎⚡
🔹 $ETH (Ethereum) — Top smart-contract asset poised for heavy capital rotation as risk appetite expands! 🚀📊
Will this liquidity shift launch Bitcoin to a new high? Drop your targets below! 👇✨
#FedOctoberRateHikeOddsFallTo17%
#BitcoinRejectedAt$87K
#ZcashETFPostsFirstWeeklyOutflow$93.6M
#GreekPoliceBustCryptoScamRingArrest17
{spot}(ETHUSDT)
{spot}(BTCUSDT)
#fedoctoberratehikeoddsfallto17%
🚨 LIQUIDITY ALERT: FED RATE HIKE ODDS DROP TO 17%! 📊⚡
A weak U.S. jobs report has crashed October Fed rate hike odds from 75% down to 17%!
Easing policy expectations lower yields and unlock market liquidity, creating a powerful macro boost for crypto risk assets! 🚀🔥
💡 TRADER TAKEAWAY:
Fewer rate hikes = expanding global liquidity → strong crypto inflows! However, a cooling job market means watching economic data closely before taking heavy leverage! 📈⚠️
🔍 2 MACRO COINS TO WATCH:
🌐 $BTC (Bitcoin) — Prime liquidity sponge leading the market charge as macro headwinds fade! 💎⚡
🔹 $ETH (Ethereum) — Top smart-contract asset poised for heavy capital rotation as risk appetite expands! 🚀📊
Will this liquidity shift launch Bitcoin to a new high? Drop your targets below! 👇✨
#FedOctoberRateHikeOddsFallTo17%
#BitcoinRejectedAt$87K
#ZcashETFPostsFirstWeeklyOutflow$93.6M
#GreekPoliceBustCryptoScamRingArrest17
🚨 LIQUIDITY ALERT: FED RATE HIKE ODDS DROP TO 17%! 📊⚡
A weak U.S. jobs report has crashed October Fed rate hike odds from 75% down to 17%!
Easing policy expectations lower yields and unlock market liquidity, creating a powerful macro boost for crypto risk assets! 🚀🔥
💡 TRADER TAKEAWAY:
Fewer rate hikes = expanding global liquidity → strong crypto inflows! However, a cooling job market means watching economic data closely before taking heavy leverage! 📈⚠️
🔍 2 MACRO COINS TO WATCH:
🌐 $BTC (Bitcoin) — Prime liquidity sponge leading the market charge as macro headwinds fade! 💎⚡
🔹 $ETH (Ethereum) — Top smart-contract asset poised for heavy capital rotation as risk appetite expands! 🚀📊
Will this liquidity shift launch Bitcoin to a new high? Drop your targets below! 👇✨
#FedOctoberRateHikeOddsFallTo17%
#BitcoinRejectedAt$87K
#ZcashETFPostsFirstWeeklyOutflow$93.6M
#GreekPoliceBustCryptoScamRingArrest17
1
89
·
--
🚨 THE FED HIKE TRADE JUST COLLAPSED — OCTOBER ODDS ARE DOWN TO 17%.
After the latest U.S. jobs report showed just 29K payroll growth and unemployment rising to 4.2%, traders sharply cut expectations for another Fed hike this month. One market snapshot put the probability near 17%.
That is a huge shift from just days ago, when oil-driven inflation fears had pushed October hike odds above 70%.
The macro chain just flipped:
Weak jobs → lower hike odds → lower yield pressure → better conditions for risk assets.
That’s why this matters for:
$QQQ — tech gets relief if rates stop climbing.
$BTC — liquidity-sensitive assets benefit when Fed pressure eases.
$XAU — gold gets a cleaner setup if yields and the dollar soften.
$TLT — bonds benefit directly if markets price less tightening.
But don’t confuse “pause” with “pivot.”
Fed officials are still saying inflation is too high, and Reuters notes a December hike remains possible depending on incoming CPI and other data.
So the trade now is:
October pause narrative ON.
December uncertainty still alive.
$QQQ $BTC $XAU $TLT
#fedoctoberratehikeoddsfallto17% #ZcashETFPostsFirstWeeklyOutflow$93.6M #GreekPoliceBustCryptoScamRingArrest17 #BitcoinRejectedAt$87K #NvidiaHitsRecordHighUp2.4%
🚨 THE FED HIKE TRADE JUST COLLAPSED — OCTOBER ODDS ARE DOWN TO 17%.
After the latest U.S. jobs report showed just 29K payroll growth and unemployment rising to 4.2%, traders sharply cut expectations for another Fed hike this month. One market snapshot put the probability near 17%.
That is a huge shift from just days ago, when oil-driven inflation fears had pushed October hike odds above 70%.
The macro chain just flipped:
Weak jobs → lower hike odds → lower yield pressure → better conditions for risk assets.
That’s why this matters for:
$QQQ — tech gets relief if rates stop climbing.
$BTC — liquidity-sensitive assets benefit when Fed pressure eases.
$XAU — gold gets a cleaner setup if yields and the dollar soften.
$TLT — bonds benefit directly if markets price less tightening.
But don’t confuse “pause” with “pivot.”
Fed officials are still saying inflation is too high, and Reuters notes a December hike remains possible depending on incoming CPI and other data.
So the trade now is:
October pause narrative ON.
December uncertainty still alive.
$QQQ $BTC $XAU $TLT
#fedoctoberratehikeoddsfallto17% #ZcashETFPostsFirstWeeklyOutflow$93.6M #GreekPoliceBustCryptoScamRingArrest17 #BitcoinRejectedAt$87K #NvidiaHitsRecordHighUp2.4%
After the latest U.S. jobs report showed just 29K payroll growth and unemployment rising to 4.2%, traders sharply cut expectations for another Fed hike this month. One market snapshot put the probability near 17%.
That is a huge shift from just days ago, when oil-driven inflation fears had pushed October hike odds above 70%.
The macro chain just flipped:
Weak jobs → lower hike odds → lower yield pressure → better conditions for risk assets.
That’s why this matters for:
$QQQ — tech gets relief if rates stop climbing.
$BTC — liquidity-sensitive assets benefit when Fed pressure eases.
$XAU — gold gets a cleaner setup if yields and the dollar soften.
$TLT — bonds benefit directly if markets price less tightening.
But don’t confuse “pause” with “pivot.”
Fed officials are still saying inflation is too high, and Reuters notes a December hike remains possible depending on incoming CPI and other data.
So the trade now is:
October pause narrative ON.
December uncertainty still alive.
$QQQ $BTC $XAU $TLT
#fedoctoberratehikeoddsfallto17% #ZcashETFPostsFirstWeeklyOutflow$93.6M #GreekPoliceBustCryptoScamRingArrest17 #BitcoinRejectedAt$87K #NvidiaHitsRecordHighUp2.4%
53


Article
NVIDIA Hits Recording high up 2.4%#nvidiahitsrecordhighup2.4%
TLDR
NVDA set a new intraday record at $237.88 on 02/10/2026, while the official close was $233.95, up +1.34% from $230.86 The reported +2.4% refers to the session's peak advance: the stock gave back part of that gain before the closeThe move reflected broader AI/semicondoctor streangth and renewed investor focus on NVIDIA's AI-infrastructure demand, but next-session follow-through matters more than a single intraday high.
NVIDIA record-high update
As of the U.S. market close on 2026-10-02, NVIDIA (NVDA) reached a new intraday all-time high of $237.88. It finished at $233.95, a +$3.09 / +1.34% gain versus the prior close of $230.86. NVIDIA’s official investor-relations data confirms the new 52-week high.
Session Statistics
Date --------------------02/10/2026
Previous Close -----------$230.86
Open ------------------ $236.06
Intraday high/record high -------$237.88
Intraday Low ------------ $233.60
Closing price ------------ $233.95
Official close-to-close change ----- +$3.09/+1.34%
Intraday range -------$4.28
Intraday range as % of close ----1.83%
Volume ------ 134.9M shares
Approx market capitalization ----- $5.64T
After Hours Indication reported ---- $234.22, +0.12% after the close
The distinction is important:News reported that NVDA was up as much as 2.4% during the October 2 session, but the final closing return was +1.34%. That means the stock hit the record high early or mid-session and then saw profit-taking into the close.
Recent price performance
Using reported closing prices:
1 day: +1.34%, from $230.86 to $233.95.5 trading days: +2.22%.1 month: +2.41%.3 months: +20.08%.Year to date: +25.44%.1 year: +24.69%.Five years: +1,027.90%.
The recent pattern shows NVDA rebounding from $210.96 on 2026-09-14 to $233.95 on 2026-10-02, an increase of about +10.9% in roughly three weeks. The stock also advanced over five consecutive completed sessions from $225.07 on 2026-09-25 to $233.95 on 2026-10-02, though the path included normal day-to-day volatility.
What drove the record high?
Confirmed market context: Binance News attributed the move to ongoing strength in technology, AI-related equities, and semiconductor sentiment. NVDA’s record happened in a broader environment where investors continued to focus on demand for AI infrastructure.
Company-specific narrative: Reports around the session highlighted renewed positive analyst attention after meetings with NVIDIA management. The key theme was demand diversification beyond traditional hyperscalers, including frontier AI labs, alongside the company’s efforts to increase revenue generated per gigawatt of deployed AI infrastructure. This is a supportive narrative, but it is not proof that future revenue or the share price will follow a straight line.
Fundamental backdrop: NVIDIA’s previously reported fiscal Q2 2026 revenue was $46.7B, up +56% year over year, while Data Center revenue was $41.1B, also up +56% year over year. Blackwell Data Center revenue increased +17% sequentially. These are historical results, but they explain why the market remains highly focused on AI-capex durability.
Market-quality read
The record is constructive from a momentum perspective because it was accompanied by strong volume near 135M shares and came after a roughly +20% three-month advance. However, the close at $233.95 was $3.93 below the intraday high, indicating that some sellers emerged near the record level.
For the record breakout to gain stronger confirmation, the market would typically look for:
repeated closes near or above the prior record zone rather than only intraday peaks;continued strength across the broader semiconductor group;evidence that AI-infrastructure spending remains resilient in company updates and earnings;sustained trading activity rather than a one-session volume spike.
Key uncertainties remain AI-capex concentration, valuation sensitivity after a major multi-year rally, competitive developments, export-policy risks, and any macro shift that pushes yields higher and compresses technology valuations.
$NVDA $NVDAB $AAPL.US
#ZcashETFPostsFirstWeeklyOutflow$93.6M #GreekPoliceBustCryptoScamRingArrest17 #FedOctoberRateHikeOddsFallTo17% #BitcoinRejectedAt$87K
{alpha}(560xa9ee28c80f960b889dfbd1902055218cba016f75)
{stock_us}(NVDA.US)
{future}(NVDAUSDT)
[Click here for Post "FED Rate-Hike Expectations Ease"](https://app.binance.com/uni-qr/cpos/373333490155225?r=bubuyvnj&l=en&uco=cuthsvmhrnhukta6pswucq&uc=app_square_share_link&us=copylink)
NVIDIA Hits Recording high up 2.4%
#nvidiahitsrecordhighup2.4%
TLDR
NVDA set a new intraday record at $237.88 on 02/10/2026, while the official close was $233.95, up +1.34% from $230.86 The reported +2.4% refers to the session's peak advance: the stock gave back part of that gain before the closeThe move reflected broader AI/semicondoctor streangth and renewed investor focus on NVIDIA's AI-infrastructure demand, but next-session follow-through matters more than a single intraday high.
NVIDIA record-high update
As of the U.S. market close on 2026-10-02, NVIDIA (NVDA) reached a new intraday all-time high of $237.88. It finished at $233.95, a +$3.09 / +1.34% gain versus the prior close of $230.86. NVIDIA’s official investor-relations data confirms the new 52-week high.
Session Statistics
Date --------------------02/10/2026
Previous Close -----------$230.86
Open ------------------ $236.06
Intraday high/record high -------$237.88
Intraday Low ------------ $233.60
Closing price ------------ $233.95
Official close-to-close change ----- +$3.09/+1.34%
Intraday range -------$4.28
Intraday range as % of close ----1.83%
Volume ------ 134.9M shares
Approx market capitalization ----- $5.64T
After Hours Indication reported ---- $234.22, +0.12% after the close
The distinction is important:News reported that NVDA was up as much as 2.4% during the October 2 session, but the final closing return was +1.34%. That means the stock hit the record high early or mid-session and then saw profit-taking into the close.
Recent price performance
Using reported closing prices:
1 day: +1.34%, from $230.86 to $233.95.5 trading days: +2.22%.1 month: +2.41%.3 months: +20.08%.Year to date: +25.44%.1 year: +24.69%.Five years: +1,027.90%.
The recent pattern shows NVDA rebounding from $210.96 on 2026-09-14 to $233.95 on 2026-10-02, an increase of about +10.9% in roughly three weeks. The stock also advanced over five consecutive completed sessions from $225.07 on 2026-09-25 to $233.95 on 2026-10-02, though the path included normal day-to-day volatility.
What drove the record high?
Confirmed market context: Binance News attributed the move to ongoing strength in technology, AI-related equities, and semiconductor sentiment. NVDA’s record happened in a broader environment where investors continued to focus on demand for AI infrastructure.
Company-specific narrative: Reports around the session highlighted renewed positive analyst attention after meetings with NVIDIA management. The key theme was demand diversification beyond traditional hyperscalers, including frontier AI labs, alongside the company’s efforts to increase revenue generated per gigawatt of deployed AI infrastructure. This is a supportive narrative, but it is not proof that future revenue or the share price will follow a straight line.
Fundamental backdrop: NVIDIA’s previously reported fiscal Q2 2026 revenue was $46.7B, up +56% year over year, while Data Center revenue was $41.1B, also up +56% year over year. Blackwell Data Center revenue increased +17% sequentially. These are historical results, but they explain why the market remains highly focused on AI-capex durability.
Market-quality read
The record is constructive from a momentum perspective because it was accompanied by strong volume near 135M shares and came after a roughly +20% three-month advance. However, the close at $233.95 was $3.93 below the intraday high, indicating that some sellers emerged near the record level.
For the record breakout to gain stronger confirmation, the market would typically look for:
repeated closes near or above the prior record zone rather than only intraday peaks;continued strength across the broader semiconductor group;evidence that AI-infrastructure spending remains resilient in company updates and earnings;sustained trading activity rather than a one-session volume spike.
Key uncertainties remain AI-capex concentration, valuation sensitivity after a major multi-year rally, competitive developments, export-policy risks, and any macro shift that pushes yields higher and compresses technology valuations.
$NVDA $NVDAB $AAPL.US
#ZcashETFPostsFirstWeeklyOutflow$93.6M #GreekPoliceBustCryptoScamRingArrest17 #FedOctoberRateHikeOddsFallTo17% #BitcoinRejectedAt$87K
Click here for Post "FED Rate-Hike Expectations Ease"
TLDR
NVDA set a new intraday record at $237.88 on 02/10/2026, while the official close was $233.95, up +1.34% from $230.86 The reported +2.4% refers to the session's peak advance: the stock gave back part of that gain before the closeThe move reflected broader AI/semicondoctor streangth and renewed investor focus on NVIDIA's AI-infrastructure demand, but next-session follow-through matters more than a single intraday high.
NVIDIA record-high update
As of the U.S. market close on 2026-10-02, NVIDIA (NVDA) reached a new intraday all-time high of $237.88. It finished at $233.95, a +$3.09 / +1.34% gain versus the prior close of $230.86. NVIDIA’s official investor-relations data confirms the new 52-week high.
Session Statistics
Date --------------------02/10/2026
Previous Close -----------$230.86
Open ------------------ $236.06
Intraday high/record high -------$237.88
Intraday Low ------------ $233.60
Closing price ------------ $233.95
Official close-to-close change ----- +$3.09/+1.34%
Intraday range -------$4.28
Intraday range as % of close ----1.83%
Volume ------ 134.9M shares
Approx market capitalization ----- $5.64T
After Hours Indication reported ---- $234.22, +0.12% after the close
The distinction is important:News reported that NVDA was up as much as 2.4% during the October 2 session, but the final closing return was +1.34%. That means the stock hit the record high early or mid-session and then saw profit-taking into the close.
Recent price performance
Using reported closing prices:
1 day: +1.34%, from $230.86 to $233.95.5 trading days: +2.22%.1 month: +2.41%.3 months: +20.08%.Year to date: +25.44%.1 year: +24.69%.Five years: +1,027.90%.
The recent pattern shows NVDA rebounding from $210.96 on 2026-09-14 to $233.95 on 2026-10-02, an increase of about +10.9% in roughly three weeks. The stock also advanced over five consecutive completed sessions from $225.07 on 2026-09-25 to $233.95 on 2026-10-02, though the path included normal day-to-day volatility.
What drove the record high?
Confirmed market context: Binance News attributed the move to ongoing strength in technology, AI-related equities, and semiconductor sentiment. NVDA’s record happened in a broader environment where investors continued to focus on demand for AI infrastructure.
Company-specific narrative: Reports around the session highlighted renewed positive analyst attention after meetings with NVIDIA management. The key theme was demand diversification beyond traditional hyperscalers, including frontier AI labs, alongside the company’s efforts to increase revenue generated per gigawatt of deployed AI infrastructure. This is a supportive narrative, but it is not proof that future revenue or the share price will follow a straight line.
Fundamental backdrop: NVIDIA’s previously reported fiscal Q2 2026 revenue was $46.7B, up +56% year over year, while Data Center revenue was $41.1B, also up +56% year over year. Blackwell Data Center revenue increased +17% sequentially. These are historical results, but they explain why the market remains highly focused on AI-capex durability.
Market-quality read
The record is constructive from a momentum perspective because it was accompanied by strong volume near 135M shares and came after a roughly +20% three-month advance. However, the close at $233.95 was $3.93 below the intraday high, indicating that some sellers emerged near the record level.
For the record breakout to gain stronger confirmation, the market would typically look for:
repeated closes near or above the prior record zone rather than only intraday peaks;continued strength across the broader semiconductor group;evidence that AI-infrastructure spending remains resilient in company updates and earnings;sustained trading activity rather than a one-session volume spike.
Key uncertainties remain AI-capex concentration, valuation sensitivity after a major multi-year rally, competitive developments, export-policy risks, and any macro shift that pushes yields higher and compresses technology valuations.
$NVDA $NVDAB $AAPL.US
#ZcashETFPostsFirstWeeklyOutflow$93.6M #GreekPoliceBustCryptoScamRingArrest17 #FedOctoberRateHikeOddsFallTo17% #BitcoinRejectedAt$87K
Click here for Post "FED Rate-Hike Expectations Ease"
2
41

·
--
Super ($SUPER) rose 6.04% with high range position 88.8% and moderate volatility. Worldcoin ($WLD) surged 10.56%, volume 93.6M, momentum 22.3, volatility 18.6, reversal 19.2. Injective ($INJ) gained 2.25%, low momentum, low volatility. The strongest setup is $WLD: high reward, high volume, strong momentum. Watch if price stays above 0.5901; reversal risk if momentum stalls.
Super ($SUPER ) rose 6.04% with high range position 88.8% and moderate volatility. Worldcoin ($WLD ) surged 10.56%, volume 93.6M, momentum 22.3, volatility 18.6, reversal 19.2. Injective ($INJ ) gained 2.25%, low momentum, low volatility. The strongest setup is $WLD : high reward, high volume, strong momentum. Watch if price stays above 0.5901; reversal risk if momentum stalls.
77

·
--
Where do you stand on $ETH?
Bullish
Bearish
A whale opened a $93.6M long.
BlackRock and other ETFs sold $59.58M worth of ETH.
Comment your pick: bullish or bearish.
Not financial advice. DYOR.
Where do you stand on $ETH?
Bullish
Bearish
A whale opened a $93.6M long.
BlackRock and other ETFs sold $59.58M worth of ETH.
Comment your pick: bullish or bearish.
Not financial advice. DYOR.
Bullish
Bearish
A whale opened a $93.6M long.
BlackRock and other ETFs sold $59.58M worth of ETH.
Comment your pick: bullish or bearish.
Not financial advice. DYOR.

55

BREAKING:
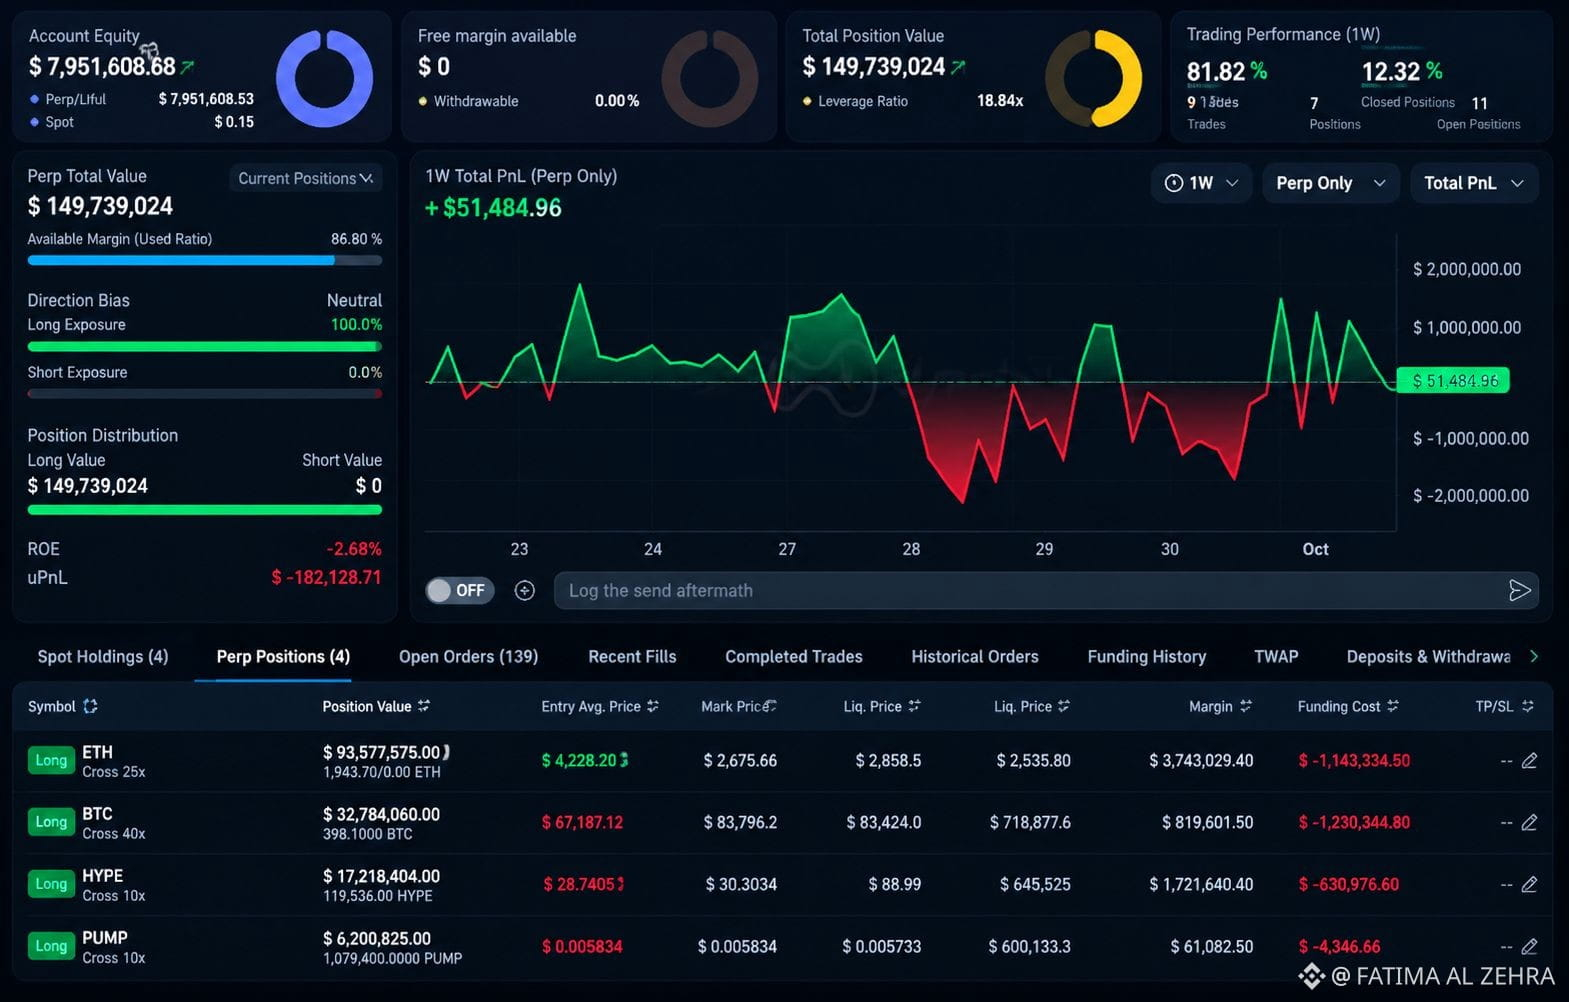
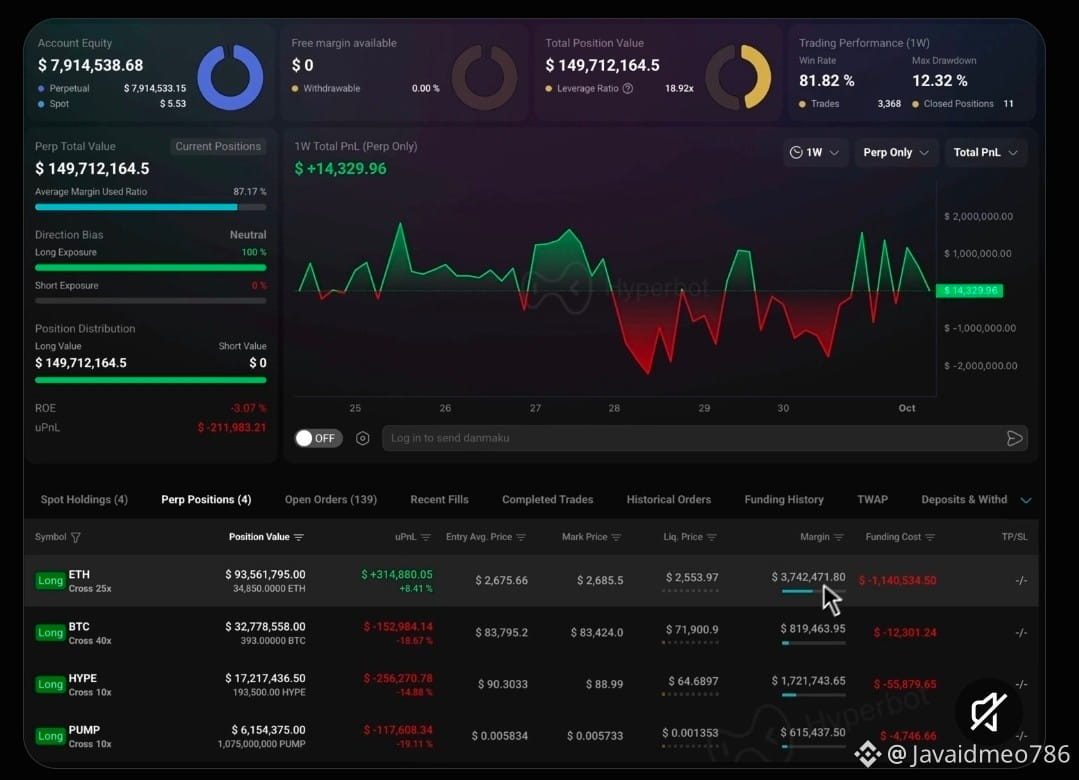
A whale with a 100% win rate has opened a $93.6M $ETH long, a $32.8M $BTC long, a $17.2M $HYPE long and a $6.2M $PUMP long.
🦥🦥#MetaMaskExitsLidoValidatorsAfterSecurityIncident
BREAKING:
A whale with a 100% win rate has opened a $93.6M $ETH long, a $32.8M $BTC long, a $17.2M $HYPE long and a $6.2M $PUMP long.
🦥🦥#MetaMaskExitsLidoValidatorsAfterSecurityIncident
A whale with a 100% win rate has opened a $93.6M $ETH long, a $32.8M $BTC long, a $17.2M $HYPE long and a $6.2M $PUMP long.
🦥🦥#MetaMaskExitsLidoValidatorsAfterSecurityIncident
AngelOfCrypto_-:
nice
1
1
297

·
--
🚨 A $150M+ WHALE JUST WENT HEAVILY LONG. 👀
While the crypto market is full of fear and uncertainty, one whale is reportedly betting BIG on a recovery.
🐋 $93.6M ETH LONG
₿ $32.8M BTC LONG
🔥 $17.2M HYPE LONG
🚀 $6.2M PUMP LONG
That’s roughly $150M+ in long exposure. 🤯
And the biggest question is:
WHAT DOES THIS WHALE SEE THAT THE REST OF THE MARKET DOESN’T? 👀
Is this smart money positioning for a bounce… or a massive leveraged gamble?
BULLISH SIGNAL OR TRAP? 🐋📈📉
#Bitcoin #Ethereum #Crypto #Trading #CryptoMarket $BTC $ETH $MOVR
🚨 A $150M+ WHALE JUST WENT HEAVILY LONG. 👀
While the crypto market is full of fear and uncertainty, one whale is reportedly betting BIG on a recovery.
🐋 $93.6M ETH LONG
₿ $32.8M BTC LONG
🔥 $17.2M HYPE LONG
🚀 $6.2M PUMP LONG
That’s roughly $150M+ in long exposure. 🤯
And the biggest question is:
WHAT DOES THIS WHALE SEE THAT THE REST OF THE MARKET DOESN’T? 👀
Is this smart money positioning for a bounce… or a massive leveraged gamble?
BULLISH SIGNAL OR TRAP? 🐋📈📉
#Bitcoin #Ethereum #Crypto #Trading #CryptoMarket $BTC $ETH $MOVR
While the crypto market is full of fear and uncertainty, one whale is reportedly betting BIG on a recovery.
🐋 $93.6M ETH LONG
₿ $32.8M BTC LONG
🔥 $17.2M HYPE LONG
🚀 $6.2M PUMP LONG
That’s roughly $150M+ in long exposure. 🤯
And the biggest question is:
WHAT DOES THIS WHALE SEE THAT THE REST OF THE MARKET DOESN’T? 👀
Is this smart money positioning for a bounce… or a massive leveraged gamble?
BULLISH SIGNAL OR TRAP? 🐋📈📉
#Bitcoin #Ethereum #Crypto #Trading #CryptoMarket $BTC $ETH $MOVR
209

·
--
A whale with a 100% win rate has opened a $93.6M $ETH long, a $32.8M $BTC long, a $17.2M $HOT long and a $6.2M $PUMP long.
Does he know something?
A whale with a 100% win rate has opened a $93.6M $ETH long, a $32.8M $BTC long, a $17.2M $HOT long and a $6.2M $PUMP long.
Does he know something?
Does he know something?
209

·
--
Is Bitcoin going through an accumulation phase or a false accumulation? 🧠📉Despite the recent price fluctuations the market is experiencing, many analysts believe that the current Bitcoin move resembles an accumulation phase before the next breakout.
Here are 3 key points you should monitor right now:
1️⃣ Support and resistance levels: Keeping the main support levels intact provides a positive signal for the continuation of the upward momentum.
Is Bitcoin going through an accumulation phase or a false accumulation? 🧠📉
Despite the recent price fluctuations the market is experiencing, many analysts believe that the current Bitcoin move resembles an accumulation phase before the next breakout.
Here are 3 key points you should monitor right now:
1️⃣ Support and resistance levels: Keeping the main support levels intact provides a positive signal for the continuation of the upward momentum.
Here are 3 key points you should monitor right now:
1️⃣ Support and resistance levels: Keeping the main support levels intact provides a positive signal for the continuation of the upward momentum.
45
Log in to explore more content
Join global crypto users on Binance Square
⚡️ Get latest and useful information about crypto.
💬 Trusted by the world’s largest crypto exchange.
👍 Discover real insights from verified creators.
Email / Phone number
Trending Topics
1
#ZcashETFPostsFirstWeeklyOutflow$93.6M
51 views
20 Discussing
2
#GreekPoliceBustCryptoScamRingArrest17
324 views
68 Discussing
3
#BitcoinRejectedAt$87K
49,390 views
87 Discussing
4
#FedOctoberRateHikeOddsFallTo17%
27,992 views
472 Discussing
5
#NvidiaHitsRecordHighUp2.4%
11,033 views
314 Discussing
6
#CanaryFilesAmendedS1ForPEPEETF
5,747 views
225 Discussing
7
#USRussiaUkraineTalksReportedlyIncludeLukoilOilDeal
15,096 views
293 Discussing
8
#BitcoinParesGainsAfterRallyTo$86.5K
39,475 views
150 Discussing
9
#CerebrasSinksNearly20%OnReportNvidiaToPowerOpenAI
88,335 views
866 Discussing
10
#SECProposesCryptoCustodyRules
114,255 views
1,075 Discussing