

#us10yearyieldnears5
us10yearyieldnears5
769 views
43 Discussing
Hot
Latest

·
--
Here's what happened when the US 10-year yield last climbed toward 5 percent and almost nobody in this market treated it as a warning.
Traders kept buying every dip in $BTC because sentiment still looked fine. They had no exit plan for a world where Treasuries started paying more than the alts they were holding.
The 10-year is the global hurdle rate. When it nears 5 percent, holding non-yielding crypto becomes a choice, not a default. We watched this in 2022 and again through parts of 2023. Capital rotated into $USDT. Borrowing costs rose. Yields on $AAVE stopped looking special next to a Treasury paying close to 5 percent with no smart-contract risk. Price did not collapse in a day. It leaked. Failed rallies stacked up. Liquidity left first, then the narrative followed.
Most of the conversation is still sitting on a Fear and Greed reading of 69 and treating it like confirmation. That number lags. A sticky 5 percent yield plus a firm dollar has historically been enough to stall ETF inflows and turn the rest of the market into a slow bleed. You do not need a recession for that. You just need yields to stay elevated while everyone else stays fully risk-on.
Where do you think this goes from here if the 10-year actually prints 5?
#US10YearYieldNears5 #DollarIndexHitsHighestSinceMay2025 #BitcoinETFsTake
Here's what happened when the US 10-year yield last climbed toward 5 percent and almost nobody in this market treated it as a warning.
Traders kept buying every dip in $BTC because sentiment still looked fine. They had no exit plan for a world where Treasuries started paying more than the alts they were holding.
The 10-year is the global hurdle rate. When it nears 5 percent, holding non-yielding crypto becomes a choice, not a default. We watched this in 2022 and again through parts of 2023. Capital rotated into $USDT. Borrowing costs rose. Yields on $AAVE stopped looking special next to a Treasury paying close to 5 percent with no smart-contract risk. Price did not collapse in a day. It leaked. Failed rallies stacked up. Liquidity left first, then the narrative followed.
Most of the conversation is still sitting on a Fear and Greed reading of 69 and treating it like confirmation. That number lags. A sticky 5 percent yield plus a firm dollar has historically been enough to stall ETF inflows and turn the rest of the market into a slow bleed. You do not need a recession for that. You just need yields to stay elevated while everyone else stays fully risk-on.
Where do you think this goes from here if the 10-year actually prints 5?
#US10YearYieldNears5 #DollarIndexHitsHighestSinceMay2025 #BitcoinETFsTake
Traders kept buying every dip in $BTC because sentiment still looked fine. They had no exit plan for a world where Treasuries started paying more than the alts they were holding.
The 10-year is the global hurdle rate. When it nears 5 percent, holding non-yielding crypto becomes a choice, not a default. We watched this in 2022 and again through parts of 2023. Capital rotated into $USDT. Borrowing costs rose. Yields on $AAVE stopped looking special next to a Treasury paying close to 5 percent with no smart-contract risk. Price did not collapse in a day. It leaked. Failed rallies stacked up. Liquidity left first, then the narrative followed.
Most of the conversation is still sitting on a Fear and Greed reading of 69 and treating it like confirmation. That number lags. A sticky 5 percent yield plus a firm dollar has historically been enough to stall ETF inflows and turn the rest of the market into a slow bleed. You do not need a recession for that. You just need yields to stay elevated while everyone else stays fully risk-on.
Where do you think this goes from here if the 10-year actually prints 5?
#US10YearYieldNears5 #DollarIndexHitsHighestSinceMay2025 #BitcoinETFsTake

101


The US 10-year Treasury yield is nearing the significant 5.3% mark. This level is closely watched by the crypto market as higher yields often indicate a tightening monetary environment or increased demand for safer assets, potentially drawing capital away from riskier investments like cryptocurrencies. Investors are assessing whether this signals further interest rate hikes or a stabilization, which could influence Bitcoin and altcoin prices.
This macroeconomic indicator's movement is crucial for understanding broader market sentiment and capital flows impacting digital assets. Traders are looking for signs of a peak in yields, which could precede a more favorable risk-on environment.
Disclaimer: This content is for informational purposes only and does not constitute investment advice.
#US10YearYieldNears5.3% $BTC
The US 10-year Treasury yield is nearing the significant 5.3% mark. This level is closely watched by the crypto market as higher yields often indicate a tightening monetary environment or increased demand for safer assets, potentially drawing capital away from riskier investments like cryptocurrencies. Investors are assessing whether this signals further interest rate hikes or a stabilization, which could influence Bitcoin and altcoin prices.
This macroeconomic indicator's movement is crucial for understanding broader market sentiment and capital flows impacting digital assets. Traders are looking for signs of a peak in yields, which could precede a more favorable risk-on environment.
Disclaimer: This content is for informational purposes only and does not constitute investment advice.
#US10YearYieldNears5.3% $BTC
This macroeconomic indicator's movement is crucial for understanding broader market sentiment and capital flows impacting digital assets. Traders are looking for signs of a peak in yields, which could precede a more favorable risk-on environment.
Disclaimer: This content is for informational purposes only and does not constitute investment advice.
#US10YearYieldNears5.3% $BTC
Habiburrahmansayem:
i want 5$ need
9
4
77

·
--
U.S. 10-year Treasury yield nears 5.3%|Binance OTC weekly report highlights long-end pressure|BTC around 839,000 doesn’t get me to chase
My stance is to prioritize defense, not equating a slowdown in inflation directly with a brand-new round of loose policy for Bitcoin. On Binance Square, the current trending list shows #US10YearYieldNears5.3%; the U.S. Treasury reported that the 10-year Treasury yield is 5.29% and the 30-year is 5.64% as of September 30. This isn’t data from “the Fed hiking today,” but a long-term funding price signaled by the bond market. The U.S. Bureau of Economic Analysis reported that, in August, the PCE price index excluding food and energy rose 3.0% year over year and 0.2% month over month. Core inflation easing and long-bond yields staying high can happen at the same time—so you can’t just pick the half that favors longs.
Binance OTC’s weekly observation also reminds: the short end benefits when inflation data softens, but the long end is held back by term premium and supply pressure. I want to emphasize that this is the analysis viewpoint of the trading desk, not a decision by a central bank, and not a guarantee for BTC price. Mechanistically, rising long-bond yields increase the opportunity cost of holding non-yielding assets and may squeeze institutions’ risk budgets; however, ETF net inflows, spot buy orders, and leverage de-risking can offset part of the pressure—so “high yields” don’t automatically mean “BTC must fall.” To verify this mechanism, you need to see whether capital and price keep diverging over time.
How has the market reacted so far? At the time of sampling, Binance BTC/USDT was about $83,920. Over the past 24 hours, the high was $84,490 and the low was $83,186, with a rise of roughly 0.15%, indicating price is still within the intraday range and hasn’t broken down unilaterally just because of one trending headline. The support band of $81,000—$83,000 used in the Binance OTC weekly report is part of its three-day chart framework; it can’t be mechanically treated as an immediate buy point right now. I’ll first look at the intraday lower edge near $83,180 and the upper edge near $84,490. If price holds above the upper edge while rates fall, the pressure narrative will be weakened; if price breaks below the lower edge and keeps losing it, my defensive view would gain more market evidence. The yield data is the September 30 closing value, and it shouldn’t be mistaken for real-time quotes moving right now.
If I were trading on my own, I wouldn’t participate; I’d stay flat. Only if an hourly close holds above $84,490, the pullback still defends it, and there’s no new rate spike, would I consider testing spot with total funds not exceeding 5%. Upon trigger, the initial target would be around $85,200. Near the target, I’d cut half; the remaining position would be observed to see if there’s actual buying follow-through. After entry, if an hourly close falls back below $84,490, I would stop out and exit—no letting a one-time fake breakout turn into a long-term hold. If it first breaks below $83,180, I wouldn’t catch the dip or chase a short; I’d wait for it to stand back above that level or rebuild the range. Predetermined account risk for any single trade wouldn’t exceed 0.5%, and I won’t use high leverage. If these conditions aren’t triggered, there will be no trade—so there’s no talk of returns.
The key is to separate the already-released macro facts, the OTC institutional viewpoint, and my own trading triggers. #US10YearYieldNears5.3% #BTC
The above is only personal market observation and does not constitute investment advice.
U.S. 10-year Treasury yield nears 5.3%|Binance OTC weekly report highlights long-end pressure|BTC around 839,000 doesn’t get me to chase
My stance is to prioritize defense, not equating a slowdown in inflation directly with a brand-new round of loose policy for Bitcoin. On Binance Square, the current trending list shows #US10YearYieldNears5.3%; the U.S. Treasury reported that the 10-year Treasury yield is 5.29% and the 30-year is 5.64% as of September 30. This isn’t data from “the Fed hiking today,” but a long-term funding price signaled by the bond market. The U.S. Bureau of Economic Analysis reported that, in August, the PCE price index excluding food and energy rose 3.0% year over year and 0.2% month over month. Core inflation easing and long-bond yields staying high can happen at the same time—so you can’t just pick the half that favors longs.
Binance OTC’s weekly observation also reminds: the short end benefits when inflation data softens, but the long end is held back by term premium and supply pressure. I want to emphasize that this is the analysis viewpoint of the trading desk, not a decision by a central bank, and not a guarantee for BTC price. Mechanistically, rising long-bond yields increase the opportunity cost of holding non-yielding assets and may squeeze institutions’ risk budgets; however, ETF net inflows, spot buy orders, and leverage de-risking can offset part of the pressure—so “high yields” don’t automatically mean “BTC must fall.” To verify this mechanism, you need to see whether capital and price keep diverging over time.
How has the market reacted so far? At the time of sampling, Binance BTC/USDT was about $83,920. Over the past 24 hours, the high was $84,490 and the low was $83,186, with a rise of roughly 0.15%, indicating price is still within the intraday range and hasn’t broken down unilaterally just because of one trending headline. The support band of $81,000—$83,000 used in the Binance OTC weekly report is part of its three-day chart framework; it can’t be mechanically treated as an immediate buy point right now. I’ll first look at the intraday lower edge near $83,180 and the upper edge near $84,490. If price holds above the upper edge while rates fall, the pressure narrative will be weakened; if price breaks below the lower edge and keeps losing it, my defensive view would gain more market evidence. The yield data is the September 30 closing value, and it shouldn’t be mistaken for real-time quotes moving right now.
If I were trading on my own, I wouldn’t participate; I’d stay flat. Only if an hourly close holds above $84,490, the pullback still defends it, and there’s no new rate spike, would I consider testing spot with total funds not exceeding 5%. Upon trigger, the initial target would be around $85,200. Near the target, I’d cut half; the remaining position would be observed to see if there’s actual buying follow-through. After entry, if an hourly close falls back below $84,490, I would stop out and exit—no letting a one-time fake breakout turn into a long-term hold. If it first breaks below $83,180, I wouldn’t catch the dip or chase a short; I’d wait for it to stand back above that level or rebuild the range. Predetermined account risk for any single trade wouldn’t exceed 0.5%, and I won’t use high leverage. If these conditions aren’t triggered, there will be no trade—so there’s no talk of returns.
The key is to separate the already-released macro facts, the OTC institutional viewpoint, and my own trading triggers. #US10YearYieldNears5.3% #BTC
The above is only personal market observation and does not constitute investment advice.
My stance is to prioritize defense, not equating a slowdown in inflation directly with a brand-new round of loose policy for Bitcoin. On Binance Square, the current trending list shows #US10YearYieldNears5.3%; the U.S. Treasury reported that the 10-year Treasury yield is 5.29% and the 30-year is 5.64% as of September 30. This isn’t data from “the Fed hiking today,” but a long-term funding price signaled by the bond market. The U.S. Bureau of Economic Analysis reported that, in August, the PCE price index excluding food and energy rose 3.0% year over year and 0.2% month over month. Core inflation easing and long-bond yields staying high can happen at the same time—so you can’t just pick the half that favors longs.
Binance OTC’s weekly observation also reminds: the short end benefits when inflation data softens, but the long end is held back by term premium and supply pressure. I want to emphasize that this is the analysis viewpoint of the trading desk, not a decision by a central bank, and not a guarantee for BTC price. Mechanistically, rising long-bond yields increase the opportunity cost of holding non-yielding assets and may squeeze institutions’ risk budgets; however, ETF net inflows, spot buy orders, and leverage de-risking can offset part of the pressure—so “high yields” don’t automatically mean “BTC must fall.” To verify this mechanism, you need to see whether capital and price keep diverging over time.
How has the market reacted so far? At the time of sampling, Binance BTC/USDT was about $83,920. Over the past 24 hours, the high was $84,490 and the low was $83,186, with a rise of roughly 0.15%, indicating price is still within the intraday range and hasn’t broken down unilaterally just because of one trending headline. The support band of $81,000—$83,000 used in the Binance OTC weekly report is part of its three-day chart framework; it can’t be mechanically treated as an immediate buy point right now. I’ll first look at the intraday lower edge near $83,180 and the upper edge near $84,490. If price holds above the upper edge while rates fall, the pressure narrative will be weakened; if price breaks below the lower edge and keeps losing it, my defensive view would gain more market evidence. The yield data is the September 30 closing value, and it shouldn’t be mistaken for real-time quotes moving right now.
If I were trading on my own, I wouldn’t participate; I’d stay flat. Only if an hourly close holds above $84,490, the pullback still defends it, and there’s no new rate spike, would I consider testing spot with total funds not exceeding 5%. Upon trigger, the initial target would be around $85,200. Near the target, I’d cut half; the remaining position would be observed to see if there’s actual buying follow-through. After entry, if an hourly close falls back below $84,490, I would stop out and exit—no letting a one-time fake breakout turn into a long-term hold. If it first breaks below $83,180, I wouldn’t catch the dip or chase a short; I’d wait for it to stand back above that level or rebuild the range. Predetermined account risk for any single trade wouldn’t exceed 0.5%, and I won’t use high leverage. If these conditions aren’t triggered, there will be no trade—so there’s no talk of returns.
The key is to separate the already-released macro facts, the OTC institutional viewpoint, and my own trading triggers. #US10YearYieldNears5.3% #BTC
The above is only personal market observation and does not constitute investment advice.

94

·
--
According to the latest data, the U.S. 10-year Treasury yield is approaching 5.3%, the highest level since 2007. To curb inflation, the Federal Reserve has raised rates 6 times in a row, for a cumulative increase of 375 basis points. High interest rates have led to a global return of capital to the United States, pushing up U.S. Treasury yields. Meanwhile, the market expects the Fed may raise rates once more before the end of the year. Current economic data show that inflation pressure remains, but signs of a slowdown in growth are beginning to emerge. #US10YearYieldNears5.3%
According to the latest data, the U.S. 10-year Treasury yield is approaching 5.3%, the highest level since 2007. To curb inflation, the Federal Reserve has raised rates 6 times in a row, for a cumulative increase of 375 basis points. High interest rates have led to a global return of capital to the United States, pushing up U.S. Treasury yields. Meanwhile, the market expects the Fed may raise rates once more before the end of the year. Current economic data show that inflation pressure remains, but signs of a slowdown in growth are beginning to emerge. #US10YearYieldNears5.3%
8

Most people treat Bitcoin ETFs like a one-way vault that only ever takes $BTC off the market.
You FOMO in after another week of inflows, convinced supply is getting locked up for good, then get wrecked when redemptions start and the same coins hit the order books overnight.
I've been tracking the creation and redemption data like it's on-chain because it basically is. Authorized participants can create shares by delivering BTC or redeem them and take the coins back to sell. That's the part the timeline skips. With Fear and Greed sitting at 69, everyone is greedy and assuming the bid never leaves. But look at the macro. Ten-year yields pushing toward 5% and a strong dollar historically kill risk appetite fast. When that happens, institutions don't hold for you. They redeem. Last time we saw a cluster of outflows, $BTC sold off hard and it dragged $ETH plus names like $AAVE down with it.
The part that actually matters is concentration. A handful of ETFs now control a massive slice of liquid supply. One large redemption doesn't look like a random whale. It looks like coordinated selling pressure that retail never sees coming until the candles are already red.
Where do you think this goes if yields keep grinding higher from here?
#BitcoinETFsTake #US10YearYieldNears5 #DollarIndexHitsHighestSinceMay2025
Most people treat Bitcoin ETFs like a one-way vault that only ever takes $BTC off the market.
You FOMO in after another week of inflows, convinced supply is getting locked up for good, then get wrecked when redemptions start and the same coins hit the order books overnight.
I've been tracking the creation and redemption data like it's on-chain because it basically is. Authorized participants can create shares by delivering BTC or redeem them and take the coins back to sell. That's the part the timeline skips. With Fear and Greed sitting at 69, everyone is greedy and assuming the bid never leaves. But look at the macro. Ten-year yields pushing toward 5% and a strong dollar historically kill risk appetite fast. When that happens, institutions don't hold for you. They redeem. Last time we saw a cluster of outflows, $BTC sold off hard and it dragged $ETH plus names like $AAVE down with it.
The part that actually matters is concentration. A handful of ETFs now control a massive slice of liquid supply. One large redemption doesn't look like a random whale. It looks like coordinated selling pressure that retail never sees coming until the candles are already red.
Where do you think this goes if yields keep grinding higher from here?
#BitcoinETFsTake #US10YearYieldNears5 #DollarIndexHitsHighestSinceMay2025
You FOMO in after another week of inflows, convinced supply is getting locked up for good, then get wrecked when redemptions start and the same coins hit the order books overnight.
I've been tracking the creation and redemption data like it's on-chain because it basically is. Authorized participants can create shares by delivering BTC or redeem them and take the coins back to sell. That's the part the timeline skips. With Fear and Greed sitting at 69, everyone is greedy and assuming the bid never leaves. But look at the macro. Ten-year yields pushing toward 5% and a strong dollar historically kill risk appetite fast. When that happens, institutions don't hold for you. They redeem. Last time we saw a cluster of outflows, $BTC sold off hard and it dragged $ETH plus names like $AAVE down with it.
The part that actually matters is concentration. A handful of ETFs now control a massive slice of liquid supply. One large redemption doesn't look like a random whale. It looks like coordinated selling pressure that retail never sees coming until the candles are already red.
Where do you think this goes if yields keep grinding higher from here?
#BitcoinETFsTake #US10YearYieldNears5 #DollarIndexHitsHighestSinceMay2025
63
Everyone thinks crypto pumps in a vacuum, but actually macro liquidity is quietly setting up a trap while everyone is celebrating greed index sitting at 69.
Most degens are blindly longing break-outs right now, only to get completely wiped when borrowing costs spike and risk-off liquidations trigger across the board.
Look at what happened during the last rate scares. Traders were aggressively loading up on high-beta plays like $NEAR and lending protocols like $AAVE thinking defi yields would outpace treasury returns, only to watch liquidity dry up overnight as institutional capital rotated into risk-free government paper. The spread shrinks, leverage gets expensive, and spot bids vanish right when you need exit liquidity the most.
Macro still rules the playground ngl. If sovereign yields tap new highs, that high-yield defi pool or alt rotation isn't going to save your over-leveraged long positions when margin calls hit.
Are you actively de-risking your spot bags here, or just riding the leverage into the macro prints?
#US10YearYieldNears5 #DollarIndexHitsHighestSinceMay2025 #USWeeklyJoblessClaimsFallTo197000
Everyone thinks crypto pumps in a vacuum, but actually macro liquidity is quietly setting up a trap while everyone is celebrating greed index sitting at 69.
Most degens are blindly longing break-outs right now, only to get completely wiped when borrowing costs spike and risk-off liquidations trigger across the board.
Look at what happened during the last rate scares. Traders were aggressively loading up on high-beta plays like $NEAR and lending protocols like $AAVE thinking defi yields would outpace treasury returns, only to watch liquidity dry up overnight as institutional capital rotated into risk-free government paper. The spread shrinks, leverage gets expensive, and spot bids vanish right when you need exit liquidity the most.
Macro still rules the playground ngl. If sovereign yields tap new highs, that high-yield defi pool or alt rotation isn't going to save your over-leveraged long positions when margin calls hit.
Are you actively de-risking your spot bags here, or just riding the leverage into the macro prints?
#US10YearYieldNears5 #DollarIndexHitsHighestSinceMay2025 #USWeeklyJoblessClaimsFallTo197000
Most degens are blindly longing break-outs right now, only to get completely wiped when borrowing costs spike and risk-off liquidations trigger across the board.
Look at what happened during the last rate scares. Traders were aggressively loading up on high-beta plays like $NEAR and lending protocols like $AAVE thinking defi yields would outpace treasury returns, only to watch liquidity dry up overnight as institutional capital rotated into risk-free government paper. The spread shrinks, leverage gets expensive, and spot bids vanish right when you need exit liquidity the most.
Macro still rules the playground ngl. If sovereign yields tap new highs, that high-yield defi pool or alt rotation isn't going to save your over-leveraged long positions when margin calls hit.
Are you actively de-risking your spot bags here, or just riding the leverage into the macro prints?
#US10YearYieldNears5 #DollarIndexHitsHighestSinceMay2025 #USWeeklyJoblessClaimsFallTo197000

170

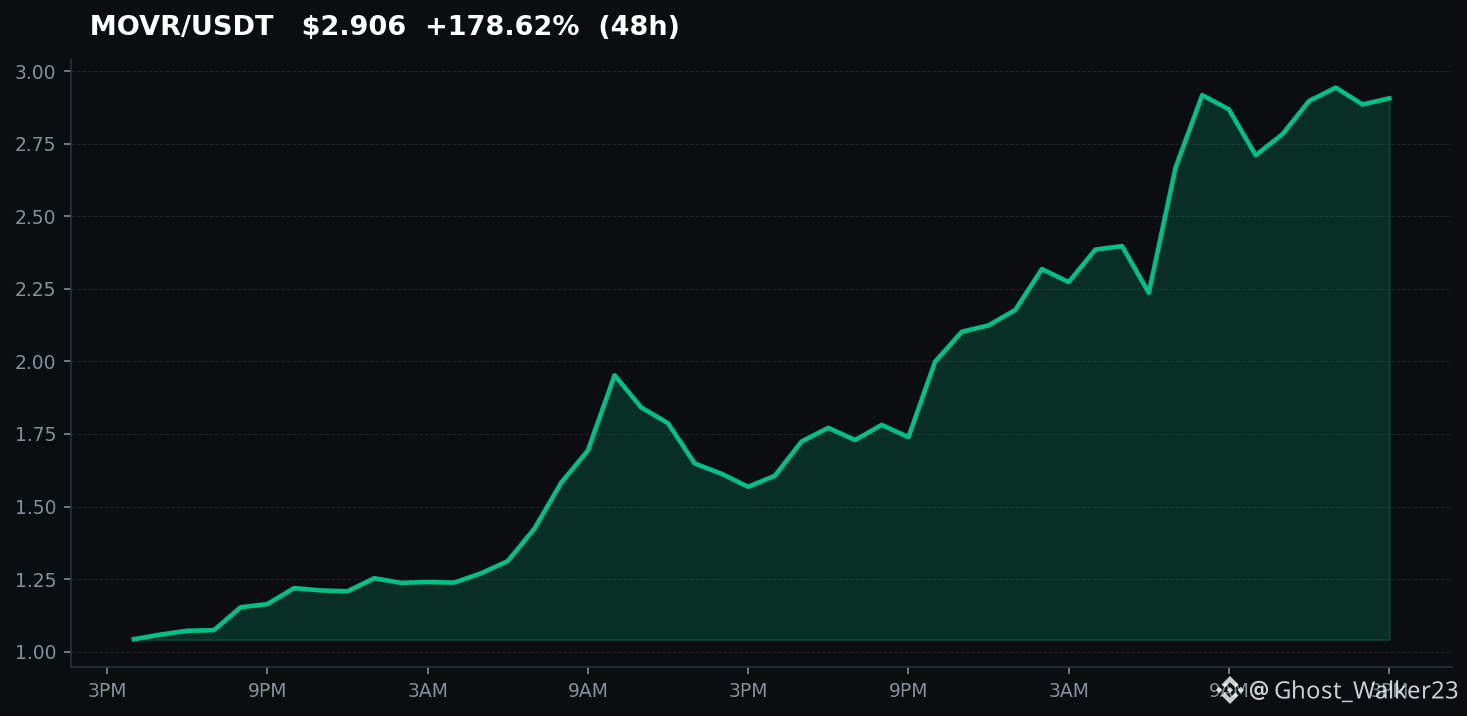
The surge in #US10YearYieldNears5.3% is a wake-up call! 📈 As yields rise, will risk appetite in crypto dim? With $MOVR skyrocketing +80.3%, are we seeing a flight to quality? Let's discuss! Do you think rising yields will challenge crypto's momentum? 🤔 #MOVR
❤️ Si te gustó, dale like y síguenos para el próximo análisis!
The surge in #US10YearYieldNears5.3% is a wake-up call! 📈 As yields rise, will risk appetite in crypto dim? With $MOVR skyrocketing +80.3%, are we seeing a flight to quality? Let's discuss! Do you think rising yields will challenge crypto's momentum? 🤔 #MOVR
❤️ Si te gustó, dale like y síguenos para el próximo análisis!
❤️ Si te gustó, dale like y síguenos para el próximo análisis!
30
·
--
10-year U.S. Treasury yield nears 5.3% climbs to trending topics|XMR drops to around 538|I’ll wait for funding-cost pressure to ease
My stance remains defensive: I won’t treat XMR as a safe-haven asset in a high-yield environment just because privacy coins differ from traditional financial narratives. The precise topic showing up on Binance Square right now is #US10YearYieldNears5.3%. According to the U.S. Treasury’s daily yield table, the 10-year Treasury yield on September 30 was 5.29%, up 3 basis points from 5.26% on September 29. This is the official daily data from the previous trading day; it’s not a real-time quote, and it’s not the Federal Reserve announcing a new policy rate.
I’ve previously discussed how 30-year yields affect the long-end funding cost. This time, I’m focusing on the 10-year—an extremely common reference used to price risk assets. These two maturities shouldn’t be confused.
Why would this affect the crypto market? When the risk-free rate rises, the opportunity cost of holding highly volatile, zero-coupon assets increases. Some capital may shift toward cash and short-duration bills. On the funding side, leverage positions may be re-evaluated as well. XMR’s privacy and fungibility stem from its network design and won’t automatically attract institutional money merely because U.S. Treasury yields are rising. It doesn’t have the same cash flows as the 10-year Treasuries, and it isn’t an interest-rate hedging instrument. The transmission is indirect—the strength or weakness should be validated through trades, relative price action, and liquidity. Correlation can’t be written as a causal law.
The current market reaction also doesn’t support blindly “buying the dip.” At the time of writing, Kraken’s XMR/USD is about 537.68. Over the past 24 hours, the high was 553.29, the low 536.22, and the open 544.84. The current price is below the open and near the day’s low. If BTC and the broader market continue to face pressure, XMR may be pared back alongside them. If later U.S. Treasury yields pull back and XMR reclaims the densely traded range from the prior hour, a repair in risk appetite may have a chance to be confirmed. I won’t claim that this drop is entirely caused by yields—exchange liquidity and the asset’s own supply-demand matter just as much. U.S. official Nonfarm Payrolls will be released tomorrow night, so today you shouldn’t treat ADP or hot-topic discussions as employment outcomes yet.
Key levels: I’m watching the day’s low near 536, and the opening zone around 544–545. If it breaks below 536 and holds for an hour, it suggests buyers couldn’t absorb the sell pressure. First, we need to see a return above 545; then we’ll judge whether the pullback can be defended. The conditions that would overturn my cautious view are: the 10-year yield no longer keeps rising, XMR closes back above 545 within the next hour and holds through the retest, and at the same time BTC no longer rapidly breaks down. If it’s just a single sharp rally or a spike on low-volume, that doesn’t count as confirmation.
If this were my own trade: I wouldn’t participate. I’d stay on the sidelines and keep my position size at 0%. Only if all three conditions above are met, I would use up to 0.75% of total funds for a spot long attempt, without leverage. The entry trigger would be: an hour close back above 545, and the pullback must hold 542–545. First target: 552 (take half off). Second target: 560 (close the remaining position). After entry, if within one hour price closes back below 539, I’d take half off. Hard stop-loss: 535, then close everything. If it breaks 536 first, the long plan is canceled. If liquidity clearly thins before the release of U.S. official data, I would also proactively cancel orders and remain in a flat (no position) state. This is a conditional plan, not something already executed.
Source: U.S. Treasury daily Treasury yield table, U.S. Bureau of Labor Statistics employment report schedule, Kraken XMR/USD行情. #US10YearYieldNears5.3% #XMR
The above is only my personal market observation and does not constitute investment advice.
10-year U.S. Treasury yield nears 5.3% climbs to trending topics|XMR drops to around 538|I’ll wait for funding-cost pressure to ease
My stance remains defensive: I won’t treat XMR as a safe-haven asset in a high-yield environment just because privacy coins differ from traditional financial narratives. The precise topic showing up on Binance Square right now is #US10YearYieldNears5.3%. According to the U.S. Treasury’s daily yield table, the 10-year Treasury yield on September 30 was 5.29%, up 3 basis points from 5.26% on September 29. This is the official daily data from the previous trading day; it’s not a real-time quote, and it’s not the Federal Reserve announcing a new policy rate.
I’ve previously discussed how 30-year yields affect the long-end funding cost. This time, I’m focusing on the 10-year—an extremely common reference used to price risk assets. These two maturities shouldn’t be confused.
Why would this affect the crypto market? When the risk-free rate rises, the opportunity cost of holding highly volatile, zero-coupon assets increases. Some capital may shift toward cash and short-duration bills. On the funding side, leverage positions may be re-evaluated as well. XMR’s privacy and fungibility stem from its network design and won’t automatically attract institutional money merely because U.S. Treasury yields are rising. It doesn’t have the same cash flows as the 10-year Treasuries, and it isn’t an interest-rate hedging instrument. The transmission is indirect—the strength or weakness should be validated through trades, relative price action, and liquidity. Correlation can’t be written as a causal law.
The current market reaction also doesn’t support blindly “buying the dip.” At the time of writing, Kraken’s XMR/USD is about 537.68. Over the past 24 hours, the high was 553.29, the low 536.22, and the open 544.84. The current price is below the open and near the day’s low. If BTC and the broader market continue to face pressure, XMR may be pared back alongside them. If later U.S. Treasury yields pull back and XMR reclaims the densely traded range from the prior hour, a repair in risk appetite may have a chance to be confirmed. I won’t claim that this drop is entirely caused by yields—exchange liquidity and the asset’s own supply-demand matter just as much. U.S. official Nonfarm Payrolls will be released tomorrow night, so today you shouldn’t treat ADP or hot-topic discussions as employment outcomes yet.
Key levels: I’m watching the day’s low near 536, and the opening zone around 544–545. If it breaks below 536 and holds for an hour, it suggests buyers couldn’t absorb the sell pressure. First, we need to see a return above 545; then we’ll judge whether the pullback can be defended. The conditions that would overturn my cautious view are: the 10-year yield no longer keeps rising, XMR closes back above 545 within the next hour and holds through the retest, and at the same time BTC no longer rapidly breaks down. If it’s just a single sharp rally or a spike on low-volume, that doesn’t count as confirmation.
If this were my own trade: I wouldn’t participate. I’d stay on the sidelines and keep my position size at 0%. Only if all three conditions above are met, I would use up to 0.75% of total funds for a spot long attempt, without leverage. The entry trigger would be: an hour close back above 545, and the pullback must hold 542–545. First target: 552 (take half off). Second target: 560 (close the remaining position). After entry, if within one hour price closes back below 539, I’d take half off. Hard stop-loss: 535, then close everything. If it breaks 536 first, the long plan is canceled. If liquidity clearly thins before the release of U.S. official data, I would also proactively cancel orders and remain in a flat (no position) state. This is a conditional plan, not something already executed.
Source: U.S. Treasury daily Treasury yield table, U.S. Bureau of Labor Statistics employment report schedule, Kraken XMR/USD行情. #US10YearYieldNears5.3% #XMR
The above is only my personal market observation and does not constitute investment advice.
My stance remains defensive: I won’t treat XMR as a safe-haven asset in a high-yield environment just because privacy coins differ from traditional financial narratives. The precise topic showing up on Binance Square right now is #US10YearYieldNears5.3%. According to the U.S. Treasury’s daily yield table, the 10-year Treasury yield on September 30 was 5.29%, up 3 basis points from 5.26% on September 29. This is the official daily data from the previous trading day; it’s not a real-time quote, and it’s not the Federal Reserve announcing a new policy rate.
I’ve previously discussed how 30-year yields affect the long-end funding cost. This time, I’m focusing on the 10-year—an extremely common reference used to price risk assets. These two maturities shouldn’t be confused.
Why would this affect the crypto market? When the risk-free rate rises, the opportunity cost of holding highly volatile, zero-coupon assets increases. Some capital may shift toward cash and short-duration bills. On the funding side, leverage positions may be re-evaluated as well. XMR’s privacy and fungibility stem from its network design and won’t automatically attract institutional money merely because U.S. Treasury yields are rising. It doesn’t have the same cash flows as the 10-year Treasuries, and it isn’t an interest-rate hedging instrument. The transmission is indirect—the strength or weakness should be validated through trades, relative price action, and liquidity. Correlation can’t be written as a causal law.
The current market reaction also doesn’t support blindly “buying the dip.” At the time of writing, Kraken’s XMR/USD is about 537.68. Over the past 24 hours, the high was 553.29, the low 536.22, and the open 544.84. The current price is below the open and near the day’s low. If BTC and the broader market continue to face pressure, XMR may be pared back alongside them. If later U.S. Treasury yields pull back and XMR reclaims the densely traded range from the prior hour, a repair in risk appetite may have a chance to be confirmed. I won’t claim that this drop is entirely caused by yields—exchange liquidity and the asset’s own supply-demand matter just as much. U.S. official Nonfarm Payrolls will be released tomorrow night, so today you shouldn’t treat ADP or hot-topic discussions as employment outcomes yet.
Key levels: I’m watching the day’s low near 536, and the opening zone around 544–545. If it breaks below 536 and holds for an hour, it suggests buyers couldn’t absorb the sell pressure. First, we need to see a return above 545; then we’ll judge whether the pullback can be defended. The conditions that would overturn my cautious view are: the 10-year yield no longer keeps rising, XMR closes back above 545 within the next hour and holds through the retest, and at the same time BTC no longer rapidly breaks down. If it’s just a single sharp rally or a spike on low-volume, that doesn’t count as confirmation.
If this were my own trade: I wouldn’t participate. I’d stay on the sidelines and keep my position size at 0%. Only if all three conditions above are met, I would use up to 0.75% of total funds for a spot long attempt, without leverage. The entry trigger would be: an hour close back above 545, and the pullback must hold 542–545. First target: 552 (take half off). Second target: 560 (close the remaining position). After entry, if within one hour price closes back below 539, I’d take half off. Hard stop-loss: 535, then close everything. If it breaks 536 first, the long plan is canceled. If liquidity clearly thins before the release of U.S. official data, I would also proactively cancel orders and remain in a flat (no position) state. This is a conditional plan, not something already executed.
Source: U.S. Treasury daily Treasury yield table, U.S. Bureau of Labor Statistics employment report schedule, Kraken XMR/USD行情. #US10YearYieldNears5.3% #XMR
The above is only my personal market observation and does not constitute investment advice.

25
Here's what happened when weekly jobless claims fell to 197,000 and most of crypto treated it like background noise.
Most traders saw a strong labor print and kept adding risk like the Fed had already pivoted. The real pain is buying that dip in alts while the data is arguing for higher-for-longer, then watching $USDT dominance grind up as liquidity leaves the room.
This is a case study in misreading a good number. Claims at 197k sit well below the level that usually means labor is cooling. A tight jobs picture still gives the Fed cover to stay restrictive.
That pressure hits yields first, then the dollar, then everything with a beta. We have seen this loop. Greed is sitting at 69 right now, which is exactly when people stop checking second-order effects.
Soft-landing talk is not the same as easy money. When jobless claims keep printing this low, $AAVE rates and alt liquidity can tighten faster than the headlines suggest. High-beta names like $FIL tend to feel it first because they run on speculative flow, not on a policy shift.
Where do you think this goes if the next print stays this tight?
#USWeeklyJoblessClaimsFallTo197000 #US10YearYieldNears5 #DollarIndexHitsHighestSinceMay2025
Here's what happened when weekly jobless claims fell to 197,000 and most of crypto treated it like background noise.
Most traders saw a strong labor print and kept adding risk like the Fed had already pivoted. The real pain is buying that dip in alts while the data is arguing for higher-for-longer, then watching $USDT dominance grind up as liquidity leaves the room.
This is a case study in misreading a good number. Claims at 197k sit well below the level that usually means labor is cooling. A tight jobs picture still gives the Fed cover to stay restrictive.
That pressure hits yields first, then the dollar, then everything with a beta. We have seen this loop. Greed is sitting at 69 right now, which is exactly when people stop checking second-order effects.
Soft-landing talk is not the same as easy money. When jobless claims keep printing this low, $AAVE rates and alt liquidity can tighten faster than the headlines suggest. High-beta names like $FIL tend to feel it first because they run on speculative flow, not on a policy shift.
Where do you think this goes if the next print stays this tight?
#USWeeklyJoblessClaimsFallTo197000 #US10YearYieldNears5 #DollarIndexHitsHighestSinceMay2025
Most traders saw a strong labor print and kept adding risk like the Fed had already pivoted. The real pain is buying that dip in alts while the data is arguing for higher-for-longer, then watching $USDT dominance grind up as liquidity leaves the room.
This is a case study in misreading a good number. Claims at 197k sit well below the level that usually means labor is cooling. A tight jobs picture still gives the Fed cover to stay restrictive.
That pressure hits yields first, then the dollar, then everything with a beta. We have seen this loop. Greed is sitting at 69 right now, which is exactly when people stop checking second-order effects.
Soft-landing talk is not the same as easy money. When jobless claims keep printing this low, $AAVE rates and alt liquidity can tighten faster than the headlines suggest. High-beta names like $FIL tend to feel it first because they run on speculative flow, not on a policy shift.
Where do you think this goes if the next print stays this tight?
#USWeeklyJoblessClaimsFallTo197000 #US10YearYieldNears5 #DollarIndexHitsHighestSinceMay2025

368
·
--
Have you noticed nobody is questioning why falling jobless claims to 197,000 is being treated as a buy signal for crypto?
Traders keep piling into alts on every strong labor print, then get wrecked when the Fed stays hawkish and liquidity dries up. They never know when to exit because they are reading the data backwards.
The 197,000 number shows a labor market that is still too tight for comfort. That keeps inflation sticky and delays any rate cuts, which is the last thing risk assets need right now. I reject the idea that this is bullish. Strong jobs in this cycle just mean higher yields for longer and a stronger dollar, both of which have been crushing crypto.
You can see it playing out already with $USDT holding firm while $AAVE and $NEAR fail to attract lasting bids. The actionable move is straightforward. Trim risk, sit in stables, and wait for actual weakness in the jobs data or a break in yields before you add. Greed at 69 means the crowd is still too optimistic.
Where do you think this jobs data actually takes the market from here?
#USWeeklyJoblessClaimsFallTo197000 #US10YearYieldNears5 #DollarIndexHitsHighestSinceMay2025
Have you noticed nobody is questioning why falling jobless claims to 197,000 is being treated as a buy signal for crypto?
Traders keep piling into alts on every strong labor print, then get wrecked when the Fed stays hawkish and liquidity dries up. They never know when to exit because they are reading the data backwards.
The 197,000 number shows a labor market that is still too tight for comfort. That keeps inflation sticky and delays any rate cuts, which is the last thing risk assets need right now. I reject the idea that this is bullish. Strong jobs in this cycle just mean higher yields for longer and a stronger dollar, both of which have been crushing crypto.
You can see it playing out already with $USDT holding firm while $AAVE and $NEAR fail to attract lasting bids. The actionable move is straightforward. Trim risk, sit in stables, and wait for actual weakness in the jobs data or a break in yields before you add. Greed at 69 means the crowd is still too optimistic.
Where do you think this jobs data actually takes the market from here?
#USWeeklyJoblessClaimsFallTo197000 #US10YearYieldNears5 #DollarIndexHitsHighestSinceMay2025
Traders keep piling into alts on every strong labor print, then get wrecked when the Fed stays hawkish and liquidity dries up. They never know when to exit because they are reading the data backwards.
The 197,000 number shows a labor market that is still too tight for comfort. That keeps inflation sticky and delays any rate cuts, which is the last thing risk assets need right now. I reject the idea that this is bullish. Strong jobs in this cycle just mean higher yields for longer and a stronger dollar, both of which have been crushing crypto.
You can see it playing out already with $USDT holding firm while $AAVE and $NEAR fail to attract lasting bids. The actionable move is straightforward. Trim risk, sit in stables, and wait for actual weakness in the jobs data or a break in yields before you add. Greed at 69 means the crowd is still too optimistic.
Where do you think this jobs data actually takes the market from here?
#USWeeklyJoblessClaimsFallTo197000 #US10YearYieldNears5 #DollarIndexHitsHighestSinceMay2025

153
·
--
Most traders celebrate greed levels hitting 69, completely ignoring that the US Dollar Index just printed its strongest rally in over a year.
When the dollar surges like this, chasing altcoin breakouts usually ends in holding heavy bags. You think you are catching momentum, but global capital is actually rotating straight into cash and defensive yields.
Here is what usually happens under the hood when DXY climbs. High-beta assets take the hardest hit first as institutional desks de-risk into $USDT and short-term paper. Projects with active developer momentum like $NEAR or DeFi blue chips like $AAVE might look resilient on the lower timeframes, but sustained dollar strength creates a liquidity vacuum that eventually drags the broader market down.
If borrowing costs stay elevated and dollar demand spikes, risk assets rarely get the clean liquidity expansion needed for a prolonged continuation. Historically, when macro liquidity tightens while retail sentiment stays greedy, pullbacks tend to be sudden rather than gradual.
Are you actively hedging your positions right now, or are you betting crypto decouples from macro strength this time?
#DollarIndexHitsHighestSinceMay2025 #US10YearYieldNears5
Most traders celebrate greed levels hitting 69, completely ignoring that the US Dollar Index just printed its strongest rally in over a year.
When the dollar surges like this, chasing altcoin breakouts usually ends in holding heavy bags. You think you are catching momentum, but global capital is actually rotating straight into cash and defensive yields.
Here is what usually happens under the hood when DXY climbs. High-beta assets take the hardest hit first as institutional desks de-risk into $USDT and short-term paper. Projects with active developer momentum like $NEAR or DeFi blue chips like $AAVE might look resilient on the lower timeframes, but sustained dollar strength creates a liquidity vacuum that eventually drags the broader market down.
If borrowing costs stay elevated and dollar demand spikes, risk assets rarely get the clean liquidity expansion needed for a prolonged continuation. Historically, when macro liquidity tightens while retail sentiment stays greedy, pullbacks tend to be sudden rather than gradual.
Are you actively hedging your positions right now, or are you betting crypto decouples from macro strength this time?
#DollarIndexHitsHighestSinceMay2025 #US10YearYieldNears5
When the dollar surges like this, chasing altcoin breakouts usually ends in holding heavy bags. You think you are catching momentum, but global capital is actually rotating straight into cash and defensive yields.
Here is what usually happens under the hood when DXY climbs. High-beta assets take the hardest hit first as institutional desks de-risk into $USDT and short-term paper. Projects with active developer momentum like $NEAR or DeFi blue chips like $AAVE might look resilient on the lower timeframes, but sustained dollar strength creates a liquidity vacuum that eventually drags the broader market down.
If borrowing costs stay elevated and dollar demand spikes, risk assets rarely get the clean liquidity expansion needed for a prolonged continuation. Historically, when macro liquidity tightens while retail sentiment stays greedy, pullbacks tend to be sudden rather than gradual.
Are you actively hedging your positions right now, or are you betting crypto decouples from macro strength this time?
#DollarIndexHitsHighestSinceMay2025 #US10YearYieldNears5

134
Tokenized U.S. stocks soar 390%: the convergence of Wall Street and the crypto world is accelerating
1. Tokenized stocks see explosive growth
In the third quarter of 2026, the global tokenized stock market delivered an impressive performance. Binance CEO Changpeng Zhao said in his latest public remarks that tokenized stocks surged 390% over the past year. Even so, tokenized stocks currently account for only 0.0029% of the total market capitalization of globally listed stocks, which stands at $1.519 trillion. The figure not only highlights the astonishing growth rate of this track, but also reveals the enormous untapped potential behind it.
Even more noteworthy are structural changes. In September, tokenized stocks’ share of trading volume on decentralized exchanges reached 11%, quickly narrowing the gap with memecoins’ 17% share. This indicates that on-chain capital is rotating structurally from speculative assets to real-world assets—tokenized U.S. stocks are becoming the new main storyline in the crypto market.
2. U.S. inflation cooling opens a window for risk assets
On the macro front, the U.S. August core PCE price index rose 3.0% year over year, below market expectations of 3.3%, hitting a new low since February. This data directly pushed Goldman Sachs to move its Federal Reserve rate-hike outlook from October to December, giving risk assets a valuable time window.
The softer inflation data significantly improved market sentiment. Bitcoin spot ETFs have recorded net inflows for multiple consecutive days, and traders are repricing the expected path of monetary policy ahead of year-end. For tokenized U.S. stocks, a more accommodative macro outlook suggests that more traditional capital may allocate to U.S. equities via on-chain channels, further boosting trading activity in tokenized stocks.
3. Institutional-grade infrastructure accelerates rollout
On the infrastructure side, several major developments are paving the way for tokenized U.S. stocks. OUSD stablecoin, issued by Bridge under Stripe and custodied by BlackRock and Bank of New York Mellon, was officially launched. It supports multi-chain deployment across Base, Ethereum, Solana, and more, and will connect to Coinbase on October 1. This infrastructure, backed by major players from traditional finance, provides an institutional-level foundation of trust for the settlement and circulation of tokenized assets.
Meanwhile, on September 30, the UK Financial Conduct Authority officially opened the application channel for crypto licenses. Firms will be required to obtain full licenses by October 25, 2027, or else they must stop providing regulated crypto services in the UK. Applicants must segregate customers’ crypto assets, meet a 40% capital requirement, and demonstrate operational and risk-control capabilities comparable to those of traditional financial institutions. As this regulatory framework takes effect, it will open a compliant pathway for tokenized U.S. stocks to enter the European market.
4. Plaza community enthusiasm keeps rising
According to community data from Binance Square, BNB leads the hottest token list with 3,801 mentions, followed by BTC with 3,687 mentions, and SOL with 2,046 mentions in third place. Notably, BTC’s bullish sentiment is clearly stronger than its bearish sentiment: the bullish-to-bearish ratio is 3 to 1, reflecting that the community remains optimistic about the outlook.
In terms of topic tags, Ethereum’s 70.9% gain in the third quarter and the U.S. 10-year Treasury yield nearing 5.3% are the two most discussed themes. They respectively represent bullish sentiment in the crypto market and interest-rate pressure in traditional financial markets. The parallel rise of these two topics mirrors the market’s central tension: crypto assets are accelerating upward amid institutionalization, while the traditional interest-rate environment still constrains overall risk appetite.
5. Outlook and risk warnings
A 390% growth in tokenized U.S. stocks is undoubtedly a milestone, but the 0.0029% penetration rate also reminds us that this track is still in a very early stage. With the rollout of institutional-grade stablecoins like OUSD, with regulatory frameworks in markets such as the UK becoming clearer step by step, and with further clarification of the Fed’s policy path, tokenized U.S. stocks are expected to continue expanding their influence in the crypto ecosystem into the fourth quarter of 2026.
However, investors also need to stay clear-headed. In September, the crypto industry suffered $768 million in hacker attacks, setting the highest single-month record of the year. The frequency of security incidents serves as a reminder that while pursuing innovation, the safety of assets and risk management cannot be overlooked.
#EtherGains70.9%InQ3 #US10YearYieldNears5.3% #TokenizedEquities
Tokenized U.S. stocks soar 390%: the convergence of Wall Street and the crypto world is accelerating
1. Tokenized stocks see explosive growth
In the third quarter of 2026, the global tokenized stock market delivered an impressive performance. Binance CEO Changpeng Zhao said in his latest public remarks that tokenized stocks surged 390% over the past year. Even so, tokenized stocks currently account for only 0.0029% of the total market capitalization of globally listed stocks, which stands at $1.519 trillion. The figure not only highlights the astonishing growth rate of this track, but also reveals the enormous untapped potential behind it.
Even more noteworthy are structural changes. In September, tokenized stocks’ share of trading volume on decentralized exchanges reached 11%, quickly narrowing the gap with memecoins’ 17% share. This indicates that on-chain capital is rotating structurally from speculative assets to real-world assets—tokenized U.S. stocks are becoming the new main storyline in the crypto market.
2. U.S. inflation cooling opens a window for risk assets
On the macro front, the U.S. August core PCE price index rose 3.0% year over year, below market expectations of 3.3%, hitting a new low since February. This data directly pushed Goldman Sachs to move its Federal Reserve rate-hike outlook from October to December, giving risk assets a valuable time window.
The softer inflation data significantly improved market sentiment. Bitcoin spot ETFs have recorded net inflows for multiple consecutive days, and traders are repricing the expected path of monetary policy ahead of year-end. For tokenized U.S. stocks, a more accommodative macro outlook suggests that more traditional capital may allocate to U.S. equities via on-chain channels, further boosting trading activity in tokenized stocks.
3. Institutional-grade infrastructure accelerates rollout
On the infrastructure side, several major developments are paving the way for tokenized U.S. stocks. OUSD stablecoin, issued by Bridge under Stripe and custodied by BlackRock and Bank of New York Mellon, was officially launched. It supports multi-chain deployment across Base, Ethereum, Solana, and more, and will connect to Coinbase on October 1. This infrastructure, backed by major players from traditional finance, provides an institutional-level foundation of trust for the settlement and circulation of tokenized assets.
Meanwhile, on September 30, the UK Financial Conduct Authority officially opened the application channel for crypto licenses. Firms will be required to obtain full licenses by October 25, 2027, or else they must stop providing regulated crypto services in the UK. Applicants must segregate customers’ crypto assets, meet a 40% capital requirement, and demonstrate operational and risk-control capabilities comparable to those of traditional financial institutions. As this regulatory framework takes effect, it will open a compliant pathway for tokenized U.S. stocks to enter the European market.
4. Plaza community enthusiasm keeps rising
According to community data from Binance Square, BNB leads the hottest token list with 3,801 mentions, followed by BTC with 3,687 mentions, and SOL with 2,046 mentions in third place. Notably, BTC’s bullish sentiment is clearly stronger than its bearish sentiment: the bullish-to-bearish ratio is 3 to 1, reflecting that the community remains optimistic about the outlook.
In terms of topic tags, Ethereum’s 70.9% gain in the third quarter and the U.S. 10-year Treasury yield nearing 5.3% are the two most discussed themes. They respectively represent bullish sentiment in the crypto market and interest-rate pressure in traditional financial markets. The parallel rise of these two topics mirrors the market’s central tension: crypto assets are accelerating upward amid institutionalization, while the traditional interest-rate environment still constrains overall risk appetite.
5. Outlook and risk warnings
A 390% growth in tokenized U.S. stocks is undoubtedly a milestone, but the 0.0029% penetration rate also reminds us that this track is still in a very early stage. With the rollout of institutional-grade stablecoins like OUSD, with regulatory frameworks in markets such as the UK becoming clearer step by step, and with further clarification of the Fed’s policy path, tokenized U.S. stocks are expected to continue expanding their influence in the crypto ecosystem into the fourth quarter of 2026.
However, investors also need to stay clear-headed. In September, the crypto industry suffered $768 million in hacker attacks, setting the highest single-month record of the year. The frequency of security incidents serves as a reminder that while pursuing innovation, the safety of assets and risk management cannot be overlooked.
#EtherGains70.9%InQ3 #US10YearYieldNears5.3% #TokenizedEquities
1. Tokenized stocks see explosive growth
In the third quarter of 2026, the global tokenized stock market delivered an impressive performance. Binance CEO Changpeng Zhao said in his latest public remarks that tokenized stocks surged 390% over the past year. Even so, tokenized stocks currently account for only 0.0029% of the total market capitalization of globally listed stocks, which stands at $1.519 trillion. The figure not only highlights the astonishing growth rate of this track, but also reveals the enormous untapped potential behind it.
Even more noteworthy are structural changes. In September, tokenized stocks’ share of trading volume on decentralized exchanges reached 11%, quickly narrowing the gap with memecoins’ 17% share. This indicates that on-chain capital is rotating structurally from speculative assets to real-world assets—tokenized U.S. stocks are becoming the new main storyline in the crypto market.
2. U.S. inflation cooling opens a window for risk assets
On the macro front, the U.S. August core PCE price index rose 3.0% year over year, below market expectations of 3.3%, hitting a new low since February. This data directly pushed Goldman Sachs to move its Federal Reserve rate-hike outlook from October to December, giving risk assets a valuable time window.
The softer inflation data significantly improved market sentiment. Bitcoin spot ETFs have recorded net inflows for multiple consecutive days, and traders are repricing the expected path of monetary policy ahead of year-end. For tokenized U.S. stocks, a more accommodative macro outlook suggests that more traditional capital may allocate to U.S. equities via on-chain channels, further boosting trading activity in tokenized stocks.
3. Institutional-grade infrastructure accelerates rollout
On the infrastructure side, several major developments are paving the way for tokenized U.S. stocks. OUSD stablecoin, issued by Bridge under Stripe and custodied by BlackRock and Bank of New York Mellon, was officially launched. It supports multi-chain deployment across Base, Ethereum, Solana, and more, and will connect to Coinbase on October 1. This infrastructure, backed by major players from traditional finance, provides an institutional-level foundation of trust for the settlement and circulation of tokenized assets.
Meanwhile, on September 30, the UK Financial Conduct Authority officially opened the application channel for crypto licenses. Firms will be required to obtain full licenses by October 25, 2027, or else they must stop providing regulated crypto services in the UK. Applicants must segregate customers’ crypto assets, meet a 40% capital requirement, and demonstrate operational and risk-control capabilities comparable to those of traditional financial institutions. As this regulatory framework takes effect, it will open a compliant pathway for tokenized U.S. stocks to enter the European market.
4. Plaza community enthusiasm keeps rising
According to community data from Binance Square, BNB leads the hottest token list with 3,801 mentions, followed by BTC with 3,687 mentions, and SOL with 2,046 mentions in third place. Notably, BTC’s bullish sentiment is clearly stronger than its bearish sentiment: the bullish-to-bearish ratio is 3 to 1, reflecting that the community remains optimistic about the outlook.
In terms of topic tags, Ethereum’s 70.9% gain in the third quarter and the U.S. 10-year Treasury yield nearing 5.3% are the two most discussed themes. They respectively represent bullish sentiment in the crypto market and interest-rate pressure in traditional financial markets. The parallel rise of these two topics mirrors the market’s central tension: crypto assets are accelerating upward amid institutionalization, while the traditional interest-rate environment still constrains overall risk appetite.
5. Outlook and risk warnings
A 390% growth in tokenized U.S. stocks is undoubtedly a milestone, but the 0.0029% penetration rate also reminds us that this track is still in a very early stage. With the rollout of institutional-grade stablecoins like OUSD, with regulatory frameworks in markets such as the UK becoming clearer step by step, and with further clarification of the Fed’s policy path, tokenized U.S. stocks are expected to continue expanding their influence in the crypto ecosystem into the fourth quarter of 2026.
However, investors also need to stay clear-headed. In September, the crypto industry suffered $768 million in hacker attacks, setting the highest single-month record of the year. The frequency of security incidents serves as a reminder that while pursuing innovation, the safety of assets and risk management cannot be overlooked.
#EtherGains70.9%InQ3 #US10YearYieldNears5.3% #TokenizedEquities
218

·
--
⏸️ Litecoin (LTC) 68.89 — ranging, low volatility, no clear direction on the 1 hour chart.
Levels: entry 67.17 · stop 62.554 · target 77.284 · support 65.852.
Funding -0.0011% per 8h (-1.2% annualised), 7th percentile of the past 167 days · top traders long/short 3.93 (88th percentile) · 24h +2.42% on $0.0bn spot volume · News tone mixed (+24).
What would change it: an hourly close above 77.284 (target) or below 67.17 (entry).
Spot is 2.50% from 67.17 (entry) — the level that ends this range. Live price below.
Not financial advice. Research desk output; do your own research.
$LTC $BTC $ETH #MetaMaskExitsLidoValidatorsAfterSecurityIncident #US10YearYieldNears5.3%
⏸️ Litecoin (LTC) 68.89 — ranging, low volatility, no clear direction on the 1 hour chart.
Levels: entry 67.17 · stop 62.554 · target 77.284 · support 65.852.
Funding -0.0011% per 8h (-1.2% annualised), 7th percentile of the past 167 days · top traders long/short 3.93 (88th percentile) · 24h +2.42% on $0.0bn spot volume · News tone mixed (+24).
What would change it: an hourly close above 77.284 (target) or below 67.17 (entry).
Spot is 2.50% from 67.17 (entry) — the level that ends this range. Live price below.
Not financial advice. Research desk output; do your own research.
$LTC $BTC $ETH #MetaMaskExitsLidoValidatorsAfterSecurityIncident #US10YearYieldNears5.3%
Levels: entry 67.17 · stop 62.554 · target 77.284 · support 65.852.
Funding -0.0011% per 8h (-1.2% annualised), 7th percentile of the past 167 days · top traders long/short 3.93 (88th percentile) · 24h +2.42% on $0.0bn spot volume · News tone mixed (+24).
What would change it: an hourly close above 77.284 (target) or below 67.17 (entry).
Spot is 2.50% from 67.17 (entry) — the level that ends this range. Live price below.
Not financial advice. Research desk output; do your own research.
$LTC $BTC $ETH #MetaMaskExitsLidoValidatorsAfterSecurityIncident #US10YearYieldNears5.3%
78
If you're still buying every alt dip without watching the dollar, stop now.
Traders keep getting chopped up because they treat crypto like it lives in a vacuum. You watch your bags bleed while the DXY prints new highs and you wonder why the bounce never comes.
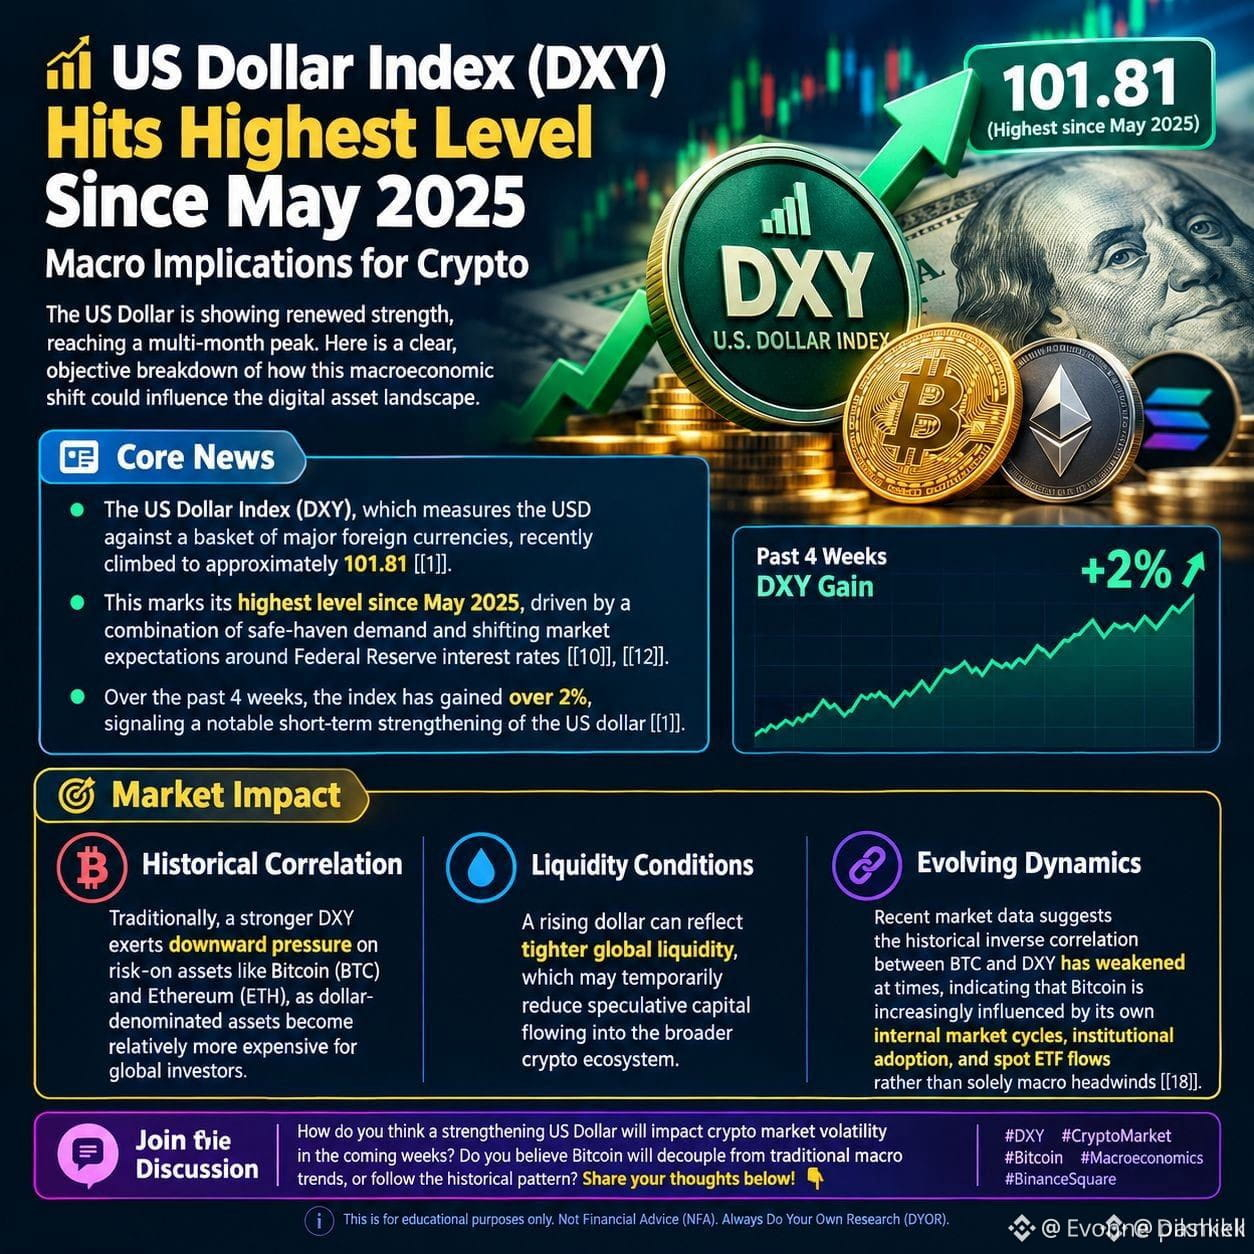
The dollar index just hit its highest since May 2025. Strong USD has a long history of draining liquidity from risk assets, and crypto is still a risk asset no matter how many people want to believe otherwise. Some will argue that Bitcoin ETFs and institutional flows have broken the old correlation. I am not convinced. When the dollar rips like this, capital usually parks in $USDT first and alts like $NEAR and $AAVE take the brunt.
We are sitting at 69 on the fear and greed index. That greed plus a surging dollar is a setup a lot of people are going to regret.
Where do you think this goes from here?
#DollarIndexHitsHighestSinceMay2025 #US10YearYieldNears5
If you're still buying every alt dip without watching the dollar, stop now.
Traders keep getting chopped up because they treat crypto like it lives in a vacuum. You watch your bags bleed while the DXY prints new highs and you wonder why the bounce never comes.
The dollar index just hit its highest since May 2025. Strong USD has a long history of draining liquidity from risk assets, and crypto is still a risk asset no matter how many people want to believe otherwise. Some will argue that Bitcoin ETFs and institutional flows have broken the old correlation. I am not convinced. When the dollar rips like this, capital usually parks in $USDT first and alts like $NEAR and $AAVE take the brunt.
We are sitting at 69 on the fear and greed index. That greed plus a surging dollar is a setup a lot of people are going to regret.
Where do you think this goes from here?
#DollarIndexHitsHighestSinceMay2025 #US10YearYieldNears5
Traders keep getting chopped up because they treat crypto like it lives in a vacuum. You watch your bags bleed while the DXY prints new highs and you wonder why the bounce never comes.
The dollar index just hit its highest since May 2025. Strong USD has a long history of draining liquidity from risk assets, and crypto is still a risk asset no matter how many people want to believe otherwise. Some will argue that Bitcoin ETFs and institutional flows have broken the old correlation. I am not convinced. When the dollar rips like this, capital usually parks in $USDT first and alts like $NEAR and $AAVE take the brunt.
We are sitting at 69 on the fear and greed index. That greed plus a surging dollar is a setup a lot of people are going to regret.
Where do you think this goes from here?
#DollarIndexHitsHighestSinceMay2025 #US10YearYieldNears5
144
·
--
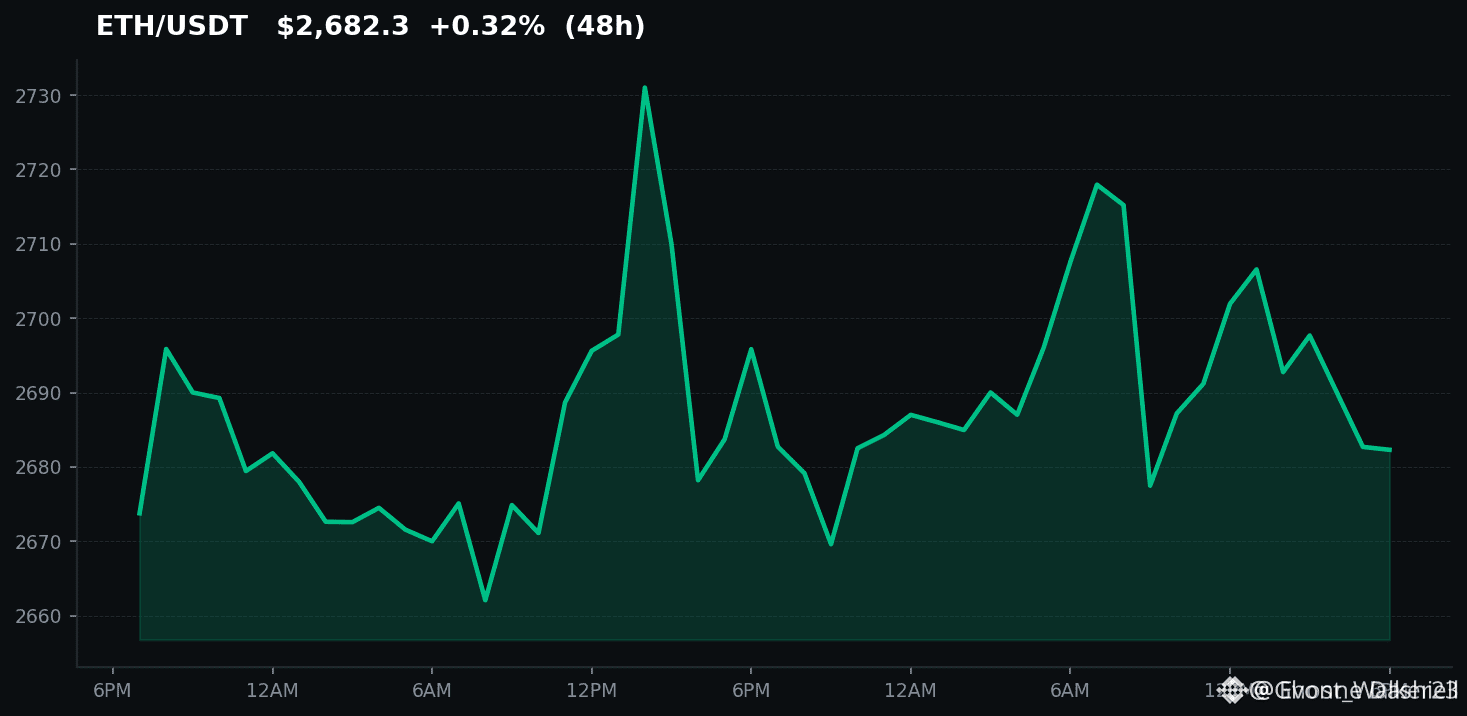
Have you noticed nobody is asking whether ETH's 70 percent run is actually sustainable, or just another relief rally dressed up as a comeback?
Traders keep getting chopped up on these moves. They buy the breakout, then freeze when it stalls because they never defined an exit.
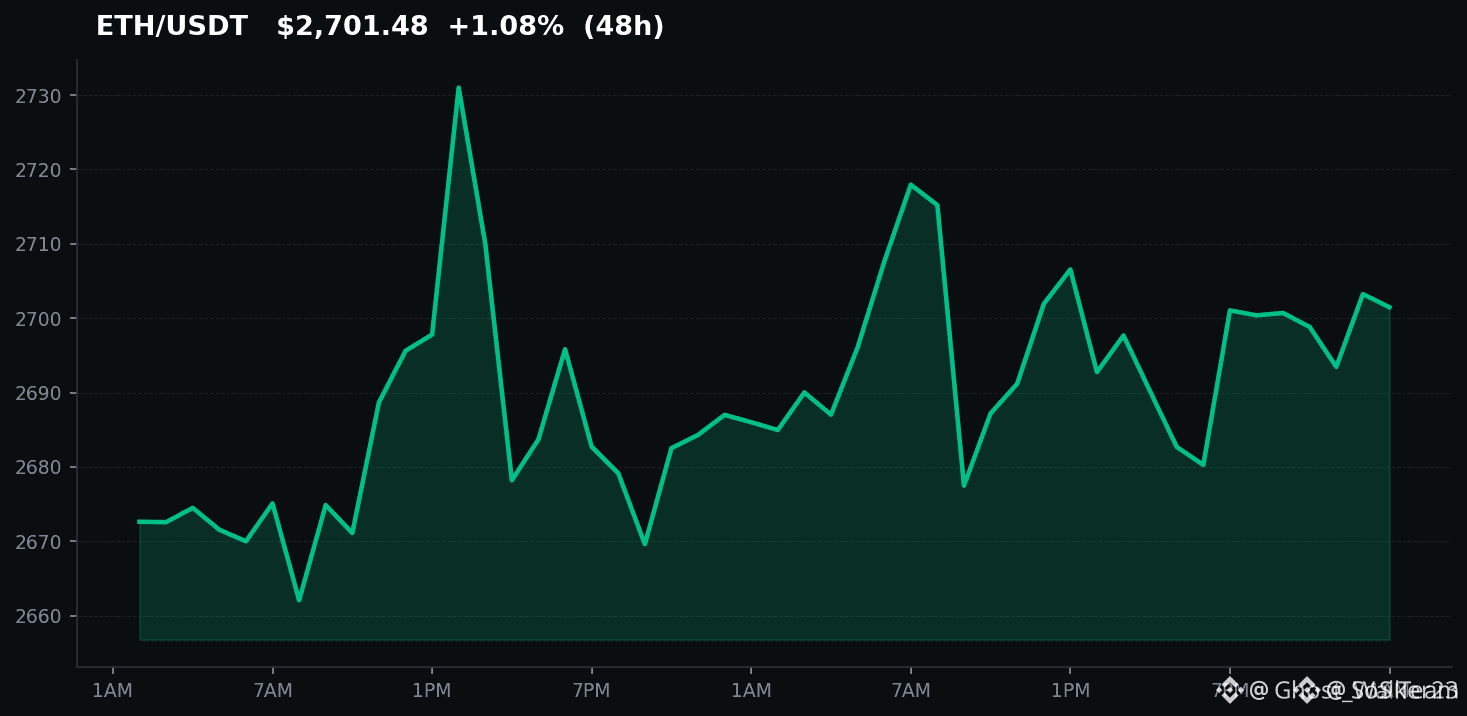
Treat this as a case study. $ETH ripping 70 percent from the lows looks explosive until you remember how these setups played out in 2022 and 2023. The move is real. The interpretation is lazy.
$AAVE and the rest of DeFi are catching a bid because they always do when ETH volatility spikes, not because fundamentals suddenly flipped. Fear and Greed sitting at 69 tells you retail is already leaning in. That is usually when the people who bought $USDT on the way down start distributing into strength.
The mainstream story is that this is the beginning of a new ETH cycle. I see a crowded trade. The dollar and yields are not the backdrop you want for a clean continuation. A 70 percent gain does not erase a multi-year range. It just creates a better place for larger players to sell.
Where do you think this $ETH move actually tops from here?
#EtherGains70 #US10YearYieldNears5 #DollarIndexHitsHighestSinceMay2025
Have you noticed nobody is asking whether ETH's 70 percent run is actually sustainable, or just another relief rally dressed up as a comeback?
Traders keep getting chopped up on these moves. They buy the breakout, then freeze when it stalls because they never defined an exit.
Treat this as a case study. $ETH ripping 70 percent from the lows looks explosive until you remember how these setups played out in 2022 and 2023. The move is real. The interpretation is lazy.
$AAVE and the rest of DeFi are catching a bid because they always do when ETH volatility spikes, not because fundamentals suddenly flipped. Fear and Greed sitting at 69 tells you retail is already leaning in. That is usually when the people who bought $USDT on the way down start distributing into strength.
The mainstream story is that this is the beginning of a new ETH cycle. I see a crowded trade. The dollar and yields are not the backdrop you want for a clean continuation. A 70 percent gain does not erase a multi-year range. It just creates a better place for larger players to sell.
Where do you think this $ETH move actually tops from here?
#EtherGains70 #US10YearYieldNears5 #DollarIndexHitsHighestSinceMay2025
Traders keep getting chopped up on these moves. They buy the breakout, then freeze when it stalls because they never defined an exit.
Treat this as a case study. $ETH ripping 70 percent from the lows looks explosive until you remember how these setups played out in 2022 and 2023. The move is real. The interpretation is lazy.
$AAVE and the rest of DeFi are catching a bid because they always do when ETH volatility spikes, not because fundamentals suddenly flipped. Fear and Greed sitting at 69 tells you retail is already leaning in. That is usually when the people who bought $USDT on the way down start distributing into strength.
The mainstream story is that this is the beginning of a new ETH cycle. I see a crowded trade. The dollar and yields are not the backdrop you want for a clean continuation. A 70 percent gain does not erase a multi-year range. It just creates a better place for larger players to sell.
Where do you think this $ETH move actually tops from here?
#EtherGains70 #US10YearYieldNears5 #DollarIndexHitsHighestSinceMay2025
12
Here's what happened when Ethereum quietly put together a 70 percent gain while most people were still debating whether any L1 besides Bitcoin even mattered.
The pain is familiar. You either sold too soon, missed the entry after months of sideways action, or now feel that itch to chase because sitting out a $ETH move like this stings more than a small loss.
This one reads like a case study in patience versus panic. The 70 percent stretch did not come from a single catalyst. Staking locked supply, L2 activity picked up, and some of the same institutions that piled into Bitcoin ETFs started treating Ethereum as the next liquid bet.
It looks closer to the 2020 grind than the 2021 mania, when everything went vertical at once. Compare that to $NEAR, which printed bigger daily candles but failed to hold the same kind of follow-through. Ethereum's move had more of a slow accumulation feel, which is why so many traders stayed on the sidelines until it was already up.
What we can take from similar past events is the checkpoint nature of a 70 percent run. In 2017 and again in 2020, these percentages often marked a pause rather than the end. With the Fear and Greed Index sitting at 69, greed is already in the room. $AAVE volumes and DeFi activity usually trail these ETH legs, so the next few weeks will tell us if this is rotation or just another relief bounce that fades when yields stay elevated.
Where do you think $ETH goes from here after stretching 70 percent like this?
#EtherGains70 #BitcoinETFsTake #US10YearYieldNears5
Here's what happened when Ethereum quietly put together a 70 percent gain while most people were still debating whether any L1 besides Bitcoin even mattered.
The pain is familiar. You either sold too soon, missed the entry after months of sideways action, or now feel that itch to chase because sitting out a $ETH move like this stings more than a small loss.
This one reads like a case study in patience versus panic. The 70 percent stretch did not come from a single catalyst. Staking locked supply, L2 activity picked up, and some of the same institutions that piled into Bitcoin ETFs started treating Ethereum as the next liquid bet.
It looks closer to the 2020 grind than the 2021 mania, when everything went vertical at once. Compare that to $NEAR , which printed bigger daily candles but failed to hold the same kind of follow-through. Ethereum's move had more of a slow accumulation feel, which is why so many traders stayed on the sidelines until it was already up.
What we can take from similar past events is the checkpoint nature of a 70 percent run. In 2017 and again in 2020, these percentages often marked a pause rather than the end. With the Fear and Greed Index sitting at 69, greed is already in the room. $AAVE volumes and DeFi activity usually trail these ETH legs, so the next few weeks will tell us if this is rotation or just another relief bounce that fades when yields stay elevated.
Where do you think $ETH goes from here after stretching 70 percent like this?
#EtherGains70 #BitcoinETFsTake #US10YearYieldNears5
The pain is familiar. You either sold too soon, missed the entry after months of sideways action, or now feel that itch to chase because sitting out a $ETH move like this stings more than a small loss.
This one reads like a case study in patience versus panic. The 70 percent stretch did not come from a single catalyst. Staking locked supply, L2 activity picked up, and some of the same institutions that piled into Bitcoin ETFs started treating Ethereum as the next liquid bet.
It looks closer to the 2020 grind than the 2021 mania, when everything went vertical at once. Compare that to $NEAR , which printed bigger daily candles but failed to hold the same kind of follow-through. Ethereum's move had more of a slow accumulation feel, which is why so many traders stayed on the sidelines until it was already up.
What we can take from similar past events is the checkpoint nature of a 70 percent run. In 2017 and again in 2020, these percentages often marked a pause rather than the end. With the Fear and Greed Index sitting at 69, greed is already in the room. $AAVE volumes and DeFi activity usually trail these ETH legs, so the next few weeks will tell us if this is rotation or just another relief bounce that fades when yields stay elevated.
Where do you think $ETH goes from here after stretching 70 percent like this?
#EtherGains70 #BitcoinETFsTake #US10YearYieldNears5
10
·
--
Everyone thinks institutional ETF inflows mean instant green candles across the entire market, but actually, they often mask aggressive spot distribution behind closed doors. Most retail investors rush to buy high-beta tokens like $NEAR or enter leveraged positions the moment they see positive flow headlines, only to end up trapped when liquidity suddenly thins out.
Think of an ETF vehicle less like a firehose of free cash and more like a slow-moving sponge. When institutions allocate capital, their hedging strategies and multi-day settlement cycles operate on a completely different rhythm than typical retail order books. While billions quietly settle into $BTC funds, that capital rarely rotates down the risk curve into other assets the way traders assume it will during a classic run.
Instead of chasing momentum every time an inflow report drops, watching net liquidity in $USDT and tracking real spot market depth will give you a far more honest picture of where things stand. Where do you think this institutional dynamic takes retail liquidity from here?
#BitcoinETFsTake #DollarIndexHitsHighestSinceMay2025 #US10YearYieldNears5
Everyone thinks institutional ETF inflows mean instant green candles across the entire market, but actually, they often mask aggressive spot distribution behind closed doors. Most retail investors rush to buy high-beta tokens like $NEAR or enter leveraged positions the moment they see positive flow headlines, only to end up trapped when liquidity suddenly thins out.
Think of an ETF vehicle less like a firehose of free cash and more like a slow-moving sponge. When institutions allocate capital, their hedging strategies and multi-day settlement cycles operate on a completely different rhythm than typical retail order books. While billions quietly settle into $BTC funds, that capital rarely rotates down the risk curve into other assets the way traders assume it will during a classic run.
Instead of chasing momentum every time an inflow report drops, watching net liquidity in $USDT and tracking real spot market depth will give you a far more honest picture of where things stand. Where do you think this institutional dynamic takes retail liquidity from here?
#BitcoinETFsTake #DollarIndexHitsHighestSinceMay2025 #US10YearYieldNears5
Think of an ETF vehicle less like a firehose of free cash and more like a slow-moving sponge. When institutions allocate capital, their hedging strategies and multi-day settlement cycles operate on a completely different rhythm than typical retail order books. While billions quietly settle into $BTC funds, that capital rarely rotates down the risk curve into other assets the way traders assume it will during a classic run.
Instead of chasing momentum every time an inflow report drops, watching net liquidity in $USDT and tracking real spot market depth will give you a far more honest picture of where things stand. Where do you think this institutional dynamic takes retail liquidity from here?
#BitcoinETFsTake #DollarIndexHitsHighestSinceMay2025 #US10YearYieldNears5
175

·
--
NEAR Don’t rush to guess the bottom—first check how much sell pressure remains in the divergence zone.
Binance U-Margin Perpetuals|NEAR over the past 24 hours -9.41%; weakness is still present, so for a fix first see whether sell pressure is converging. Current price is about 4.802, with 24h trading volume around 1.056 billion; the 30m volume ratio is only 0.2x, indicating weak participation.
Funding/positioning: long accounts account for 62%; buy/sell ratio (aggressive) is 0.95 (aggressive executions are nearly balanced).
Reference indicators: 30m ATR trend-band reference level 5.017012—current price has broken below the reference level, suggesting trend-support protection is starting to come under pressure. 30m KDJ is 34.87/33.43/37.75, implying short-term divergence is still in the middle zone.
Focus on just two key levels: whether the aggressive buy/sell ratio can break away from the balance area near 1; and whether the current price can reclaim the ATR trend-band reference level of 5.017012. The next two paths: one is repair after fear is released, and the other is a low-volume rebound that keeps drifting lower.
#NEAR #异动警报 #US10YearYieldNears5.3%
NEAR Don’t rush to guess the bottom—first check how much sell pressure remains in the divergence zone.
Binance U-Margin Perpetuals|NEAR over the past 24 hours -9.41%; weakness is still present, so for a fix first see whether sell pressure is converging. Current price is about 4.802, with 24h trading volume around 1.056 billion; the 30m volume ratio is only 0.2x, indicating weak participation.
Funding/positioning: long accounts account for 62%; buy/sell ratio (aggressive) is 0.95 (aggressive executions are nearly balanced).
Reference indicators: 30m ATR trend-band reference level 5.017012—current price has broken below the reference level, suggesting trend-support protection is starting to come under pressure. 30m KDJ is 34.87/33.43/37.75, implying short-term divergence is still in the middle zone.
Focus on just two key levels: whether the aggressive buy/sell ratio can break away from the balance area near 1; and whether the current price can reclaim the ATR trend-band reference level of 5.017012. The next two paths: one is repair after fear is released, and the other is a low-volume rebound that keeps drifting lower.
#NEAR #异动警报 #US10YearYieldNears5.3%
Binance U-Margin Perpetuals|NEAR over the past 24 hours -9.41%; weakness is still present, so for a fix first see whether sell pressure is converging. Current price is about 4.802, with 24h trading volume around 1.056 billion; the 30m volume ratio is only 0.2x, indicating weak participation.
Funding/positioning: long accounts account for 62%; buy/sell ratio (aggressive) is 0.95 (aggressive executions are nearly balanced).
Reference indicators: 30m ATR trend-band reference level 5.017012—current price has broken below the reference level, suggesting trend-support protection is starting to come under pressure. 30m KDJ is 34.87/33.43/37.75, implying short-term divergence is still in the middle zone.
Focus on just two key levels: whether the aggressive buy/sell ratio can break away from the balance area near 1; and whether the current price can reclaim the ATR trend-band reference level of 5.017012. The next two paths: one is repair after fear is released, and the other is a low-volume rebound that keeps drifting lower.
#NEAR #异动警报 #US10YearYieldNears5.3%
81

·
--
I stared at the candlesticks last night and my hands were shaking—I almost got washed out by my own greed.
Day 31 of my live trading journal, and the market is still that annoying little demon.
Today the AI system’s signal is mostly bearish with a wait-and-see bias; the 4h range-bound action is too painstaking.
$BTC is hovering around $84,643, briefly touched $85,274 and then retreated; volume is over 1.4 billion, clearly showing the bulls are exhausted.
I chickened out—I didn’t chase, and watched it spike and then fall back.
Honestly, what I still hold—$SOL —and it are both falling with it; they’re stuck in the same choppy range, unable to go up or down.
In the past I always wanted to catch the very top, but now I only hope I don’t get trapped in the middle of the mountain.
This brainless range-bound market—who on earth is distributing here?
Tell me—on this pullback, are you adding to your position or cutting and running?
#US10YearYieldNears5.3% This trending topic gave me chills. The macro backdrop has changed; liquidity is tightening, and our little retail money is the easiest to get shaken out.
#US10YearYieldNears5.3% $BTC
I stared at the candlesticks last night and my hands were shaking—I almost got washed out by my own greed.
Day 31 of my live trading journal, and the market is still that annoying little demon.
Today the AI system’s signal is mostly bearish with a wait-and-see bias; the 4h range-bound action is too painstaking.
$BTC is hovering around $84,643, briefly touched $85,274 and then retreated; volume is over 1.4 billion, clearly showing the bulls are exhausted.
I chickened out—I didn’t chase, and watched it spike and then fall back.
Honestly, what I still hold—$SOL —and it are both falling with it; they’re stuck in the same choppy range, unable to go up or down.
In the past I always wanted to catch the very top, but now I only hope I don’t get trapped in the middle of the mountain.
This brainless range-bound market—who on earth is distributing here?
Tell me—on this pullback, are you adding to your position or cutting and running?
#US10YearYieldNears5.3% This trending topic gave me chills. The macro backdrop has changed; liquidity is tightening, and our little retail money is the easiest to get shaken out.
#US10YearYieldNears5.3% $BTC
Day 31 of my live trading journal, and the market is still that annoying little demon.
Today the AI system’s signal is mostly bearish with a wait-and-see bias; the 4h range-bound action is too painstaking.
$BTC is hovering around $84,643, briefly touched $85,274 and then retreated; volume is over 1.4 billion, clearly showing the bulls are exhausted.
I chickened out—I didn’t chase, and watched it spike and then fall back.
Honestly, what I still hold—$SOL —and it are both falling with it; they’re stuck in the same choppy range, unable to go up or down.
In the past I always wanted to catch the very top, but now I only hope I don’t get trapped in the middle of the mountain.
This brainless range-bound market—who on earth is distributing here?
Tell me—on this pullback, are you adding to your position or cutting and running?
#US10YearYieldNears5.3% This trending topic gave me chills. The macro backdrop has changed; liquidity is tightening, and our little retail money is the easiest to get shaken out.
#US10YearYieldNears5.3% $BTC
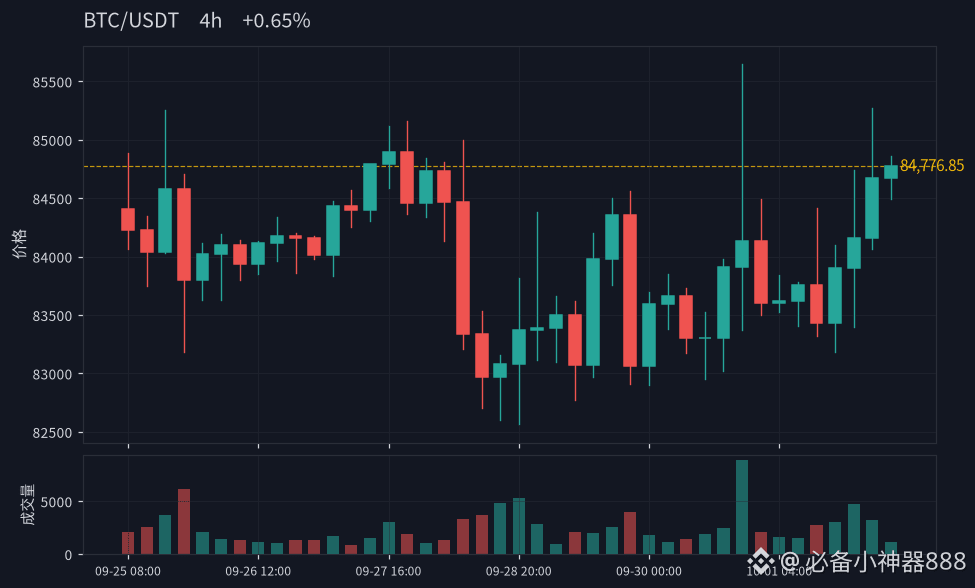
216

·
--
🟢 $UNI • 15m
What I see: the price structure and momentum are currently forming a scenario that needs confirmation from the next candle.
🎯 Conviction 71.6/100 • Entry 81.4/100 • News NEUTRAL
Scenario plan
• Entry: $9.06 - $9.07
• Staggered TP: $9.34 / $9.48 / $9.62
• Invalidation: $8.88
📰 News context:
1. Three hidden flaws in Uniswap’s StablePair hook drain LP returns
I focus more on the quality of the setup than chasing candles. Wait for the price to stay in line with the scenario; if the structure changes, the analysis will change too.
⚠️ Educational content. Not a call to trade. Keep doing research and manage risk.
🔥 Binance Square: #EAECEF #US10YearYieldNears5
🟢 $UNI • 15m
What I see: the price structure and momentum are currently forming a scenario that needs confirmation from the next candle.
🎯 Conviction 71.6/100 • Entry 81.4/100 • News NEUTRAL
Scenario plan
• Entry: $9.06 - $9.07
• Staggered TP: $9.34 / $9.48 / $9.62
• Invalidation: $8.88
📰 News context:
1. Three hidden flaws in Uniswap’s StablePair hook drain LP returns
I focus more on the quality of the setup than chasing candles. Wait for the price to stay in line with the scenario; if the structure changes, the analysis will change too.
⚠️ Educational content. Not a call to trade. Keep doing research and manage risk.
🔥 Binance Square: #EAECEF #US10YearYieldNears5
What I see: the price structure and momentum are currently forming a scenario that needs confirmation from the next candle.
🎯 Conviction 71.6/100 • Entry 81.4/100 • News NEUTRAL
Scenario plan
• Entry: $9.06 - $9.07
• Staggered TP: $9.34 / $9.48 / $9.62
• Invalidation: $8.88
📰 News context:
1. Three hidden flaws in Uniswap’s StablePair hook drain LP returns
I focus more on the quality of the setup than chasing candles. Wait for the price to stay in line with the scenario; if the structure changes, the analysis will change too.
⚠️ Educational content. Not a call to trade. Keep doing research and manage risk.
🔥 Binance Square: #EAECEF #US10YearYieldNears5
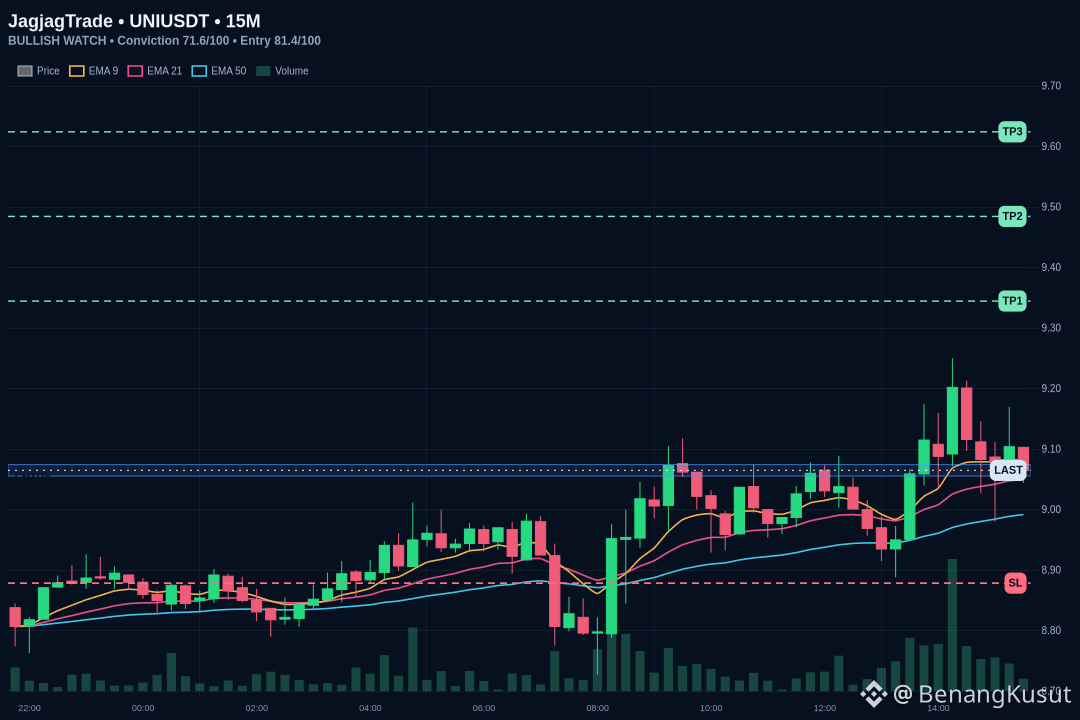
47
Log in to explore more content
Join global crypto users on Binance Square
⚡️ Get latest and useful information about crypto.
💬 Trusted by the world’s largest crypto exchange.
👍 Discover real insights from verified creators.
Email / Phone number
Trending Topics
1
#AmazonPlansToSell$8BNvidiaChips
34 views
10 Discussing
2
#NEARFallsToAround$4.70Down14%
25,003 views
45 Discussing
3
#EthereumFoundationLaunchesZkAPIOnMainnet
19,228 views
314 Discussing
4
#EvernorthPlansNasdaqListingOct8
37,534 views
295 Discussing
5
#SECProposesCryptoCustodyFramework
35,207 views
251 Discussing
6
#IMFApproves$139MDisbursementToElSalvador
23,914 views
18 Discussing
7
#AnthropicTargetsIPOAsSoonAsMidNovember
26,328 views
243 Discussing
8
#EtherGains70.9%InQ3
233,113 views
1,560 Discussing
9
#TreasuryLetsStatesFileStablecoinCertificationsEarly
17,862 views
113 Discussing
10
#US10YearYieldNears5.3%
190,262 views
1,390 Discussing