
#irys
irys
1.3M views
7,997 Discussing
Hot
Latest


·
--
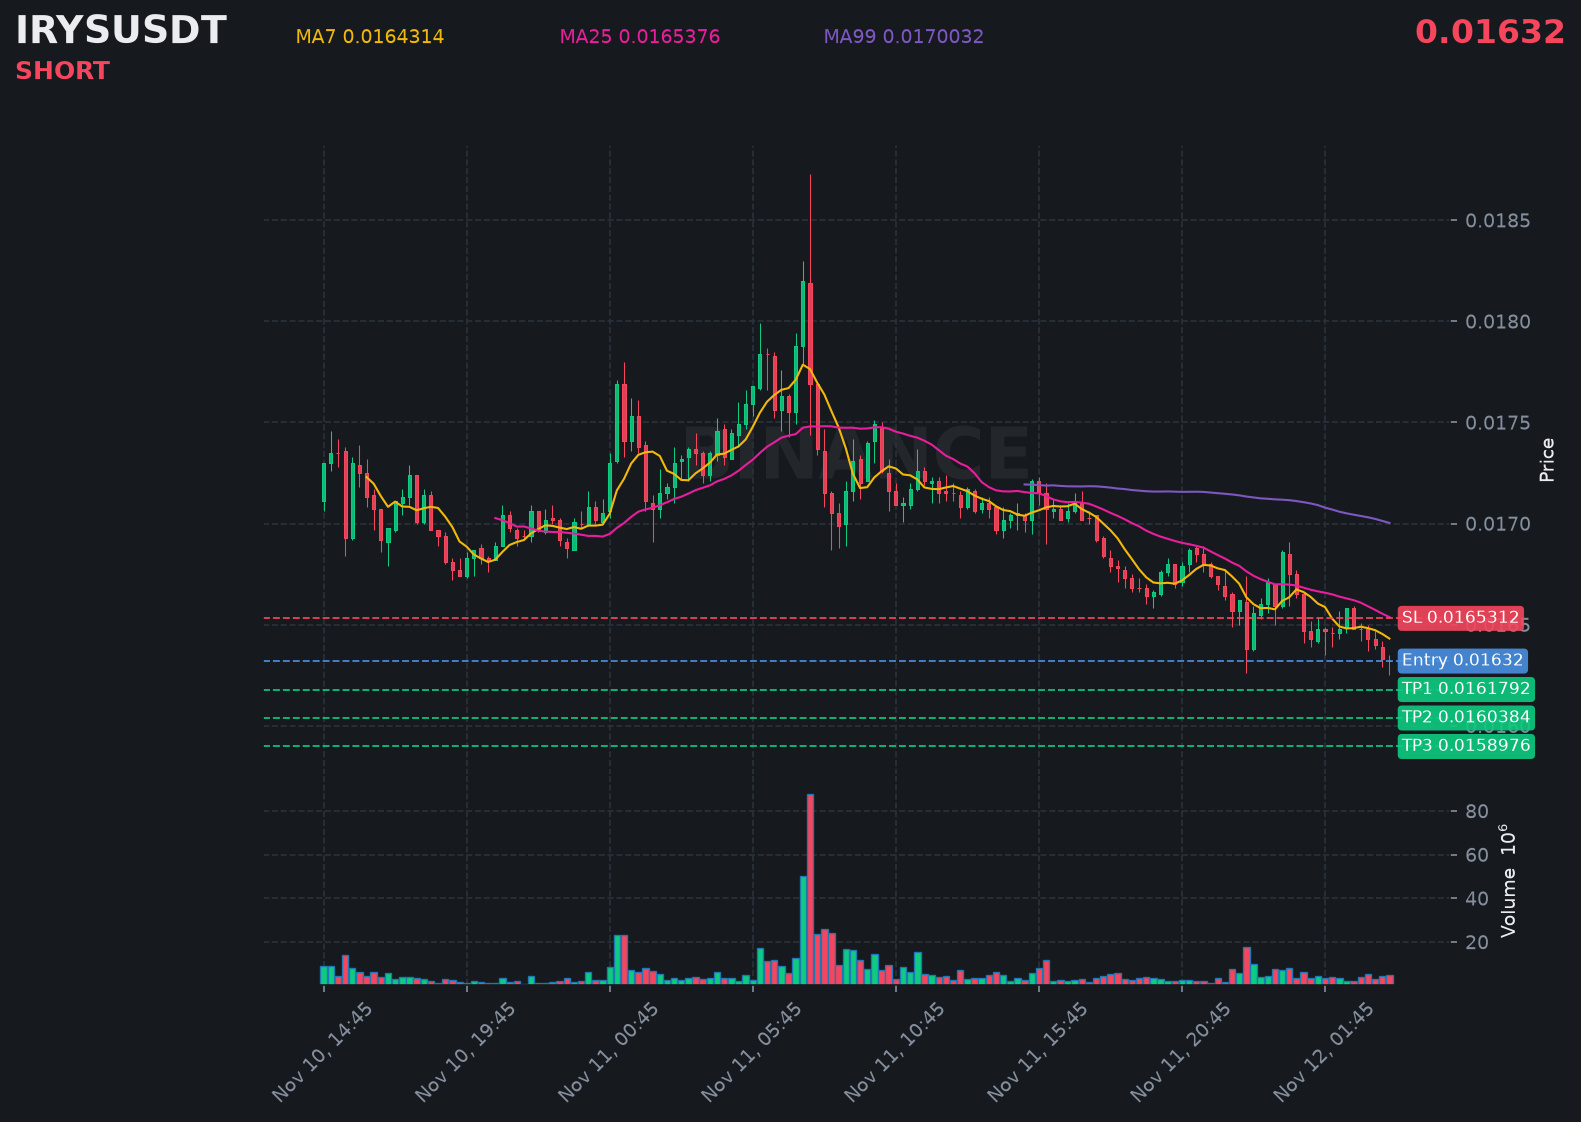
$IRYS just printed a strong bearish candle, signaling more downside pressure building right now.
📍 @ 0.01632 | Volume: 0.08M USD
RSI 37 | EMA20: 0.0165054 USD
📈 Trade Plan:
📈 Entry: 0.0162778 – 0.0163622
🛑 Stop Loss: 0.0165312
🎯 TP1: 0.0161792
🎯 TP2: 0.0160384
🎯 TP3: 0.0158976
Waiting for confirmation, then riding the downtrend.
👉 $IRYS 👈 Catch it
#IRYS
$IRYS just printed a strong bearish candle, signaling more downside pressure building right now.
📍 @ 0.01632 | Volume: 0.08M USD
RSI 37 | EMA20: 0.0165054 USD
📈 Trade Plan:
📈 Entry: 0.0162778 – 0.0163622
🛑 Stop Loss: 0.0165312
🎯 TP1: 0.0161792
🎯 TP2: 0.0160384
🎯 TP3: 0.0158976
Waiting for confirmation, then riding the downtrend.
👉 $IRYS 👈 Catch it
#IRYS
📍 @ 0.01632 | Volume: 0.08M USD
RSI 37 | EMA20: 0.0165054 USD
📈 Trade Plan:
📈 Entry: 0.0162778 – 0.0163622
🛑 Stop Loss: 0.0165312
🎯 TP1: 0.0161792
🎯 TP2: 0.0160384
🎯 TP3: 0.0158976
Waiting for confirmation, then riding the downtrend.
👉 $IRYS 👈 Catch it
#IRYS
83
·
--
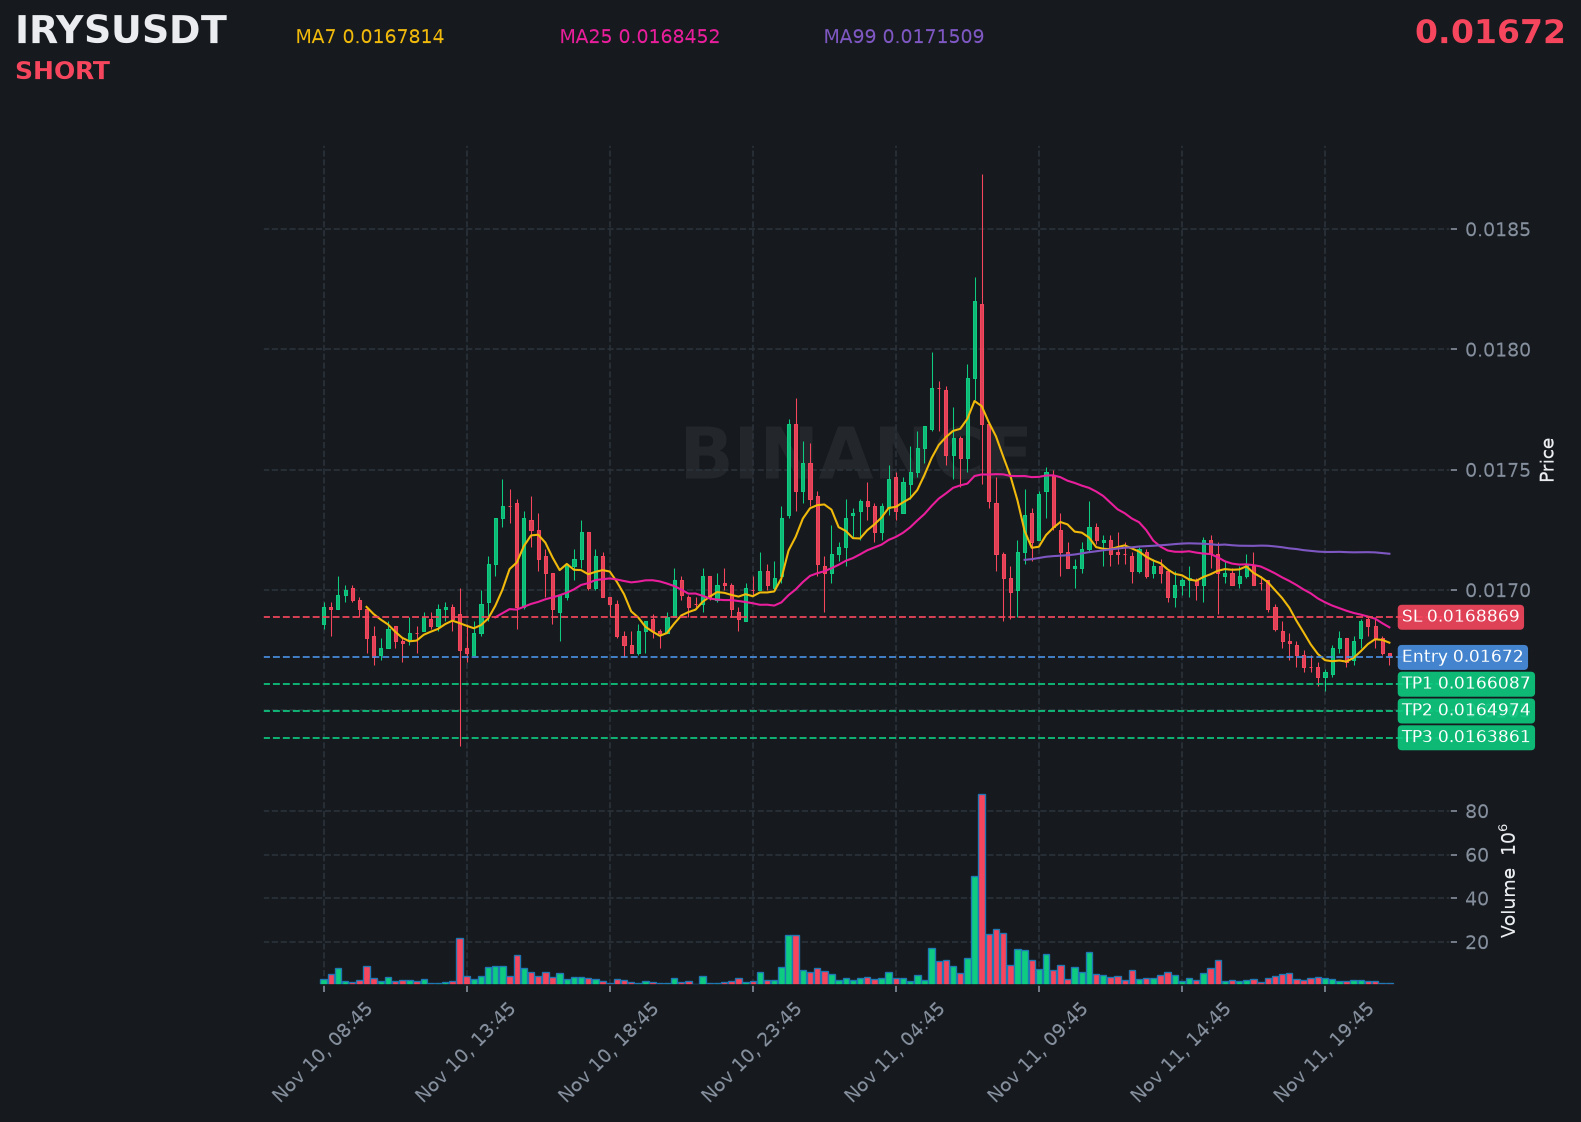
$IRYS is trending down with real conviction, sellers capping every bounce along the way.
📍 @ 0.01672 | Volume: 0.02M USD
RSI 41 | EMA20: 0.016818 USD
📈 Trade Plan:
📈 Entry: 0.0166866 – 0.0167534
🛑 Stop Loss: 0.0168869
🎯 TP1: 0.0166087
🎯 TP2: 0.0164974
🎯 TP3: 0.0163861
Waiting for confirmation, then riding the downtrend.
👉 $IRYS 👈 Catch it
#IRYS
$IRYS is trending down with real conviction, sellers capping every bounce along the way.
📍 @ 0.01672 | Volume: 0.02M USD
RSI 41 | EMA20: 0.016818 USD
📈 Trade Plan:
📈 Entry: 0.0166866 – 0.0167534
🛑 Stop Loss: 0.0168869
🎯 TP1: 0.0166087
🎯 TP2: 0.0164974
🎯 TP3: 0.0163861
Waiting for confirmation, then riding the downtrend.
👉 $IRYS 👈 Catch it
#IRYS
📍 @ 0.01672 | Volume: 0.02M USD
RSI 41 | EMA20: 0.016818 USD
📈 Trade Plan:
📈 Entry: 0.0166866 – 0.0167534
🛑 Stop Loss: 0.0168869
🎯 TP1: 0.0166087
🎯 TP2: 0.0164974
🎯 TP3: 0.0163861
Waiting for confirmation, then riding the downtrend.
👉 $IRYS 👈 Catch it
#IRYS
91

·
--
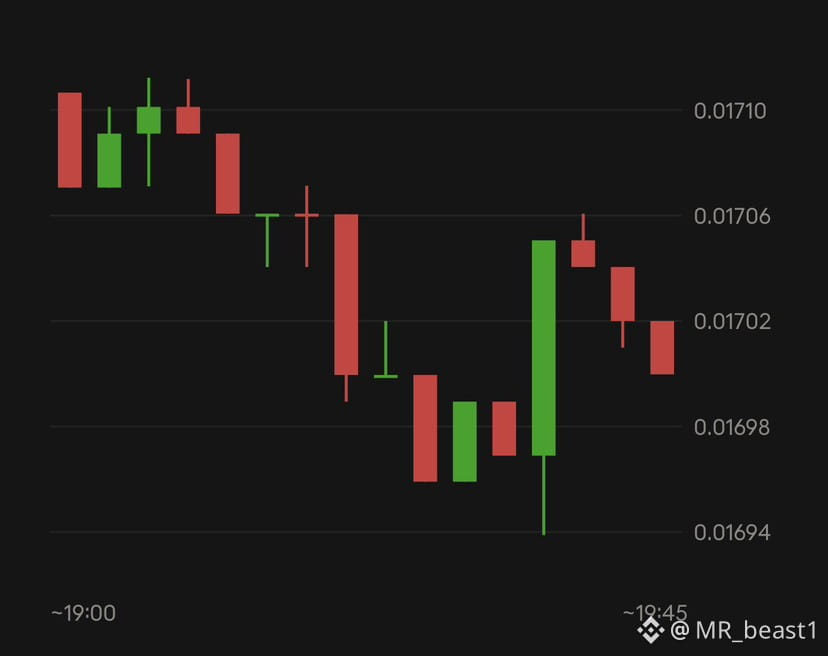
$IRYS is trading at 0.01701, down about 0.4% on the day, inside a tight 24h range of 0.01672 to 0.01873. In the visible window, price slid from about 0.01710 to a low near 0.01694. It then bounced sharply to about 0.01704 and is now fading back to 0.01700. The MA60 (0.01704) is turning down, and price is slightly below it. That makes the short-term trend neutral to mildly bearish, with the bounce failing at the MA. The order book is slightly bid-heavy (53% vs 47%), and volume is modest, with the heavier red bars on the drops. The 30- and 90-day readings are positive (+17.6% and +3.5%), but the 7-day (−19.8%) and 180-day (−67.8%) are weak. This is a young, volatile token. Support is around 0.01694–0.01697 and resistance around 0.01704–0.01710. A move above the MA60 would be the first sign of strength. This is not financial advice.
{future}(IRYSUSDT)
#irys #HotCPIDecemberHikePriced #AnthropicRejectsIPODelayValuationinQuestion #CanNvidiaEarningsEaseMarketConcerns?
$IRYS is trading at 0.01701, down about 0.4% on the day, inside a tight 24h range of 0.01672 to 0.01873. In the visible window, price slid from about 0.01710 to a low near 0.01694. It then bounced sharply to about 0.01704 and is now fading back to 0.01700. The MA60 (0.01704) is turning down, and price is slightly below it. That makes the short-term trend neutral to mildly bearish, with the bounce failing at the MA. The order book is slightly bid-heavy (53% vs 47%), and volume is modest, with the heavier red bars on the drops. The 30- and 90-day readings are positive (+17.6% and +3.5%), but the 7-day (−19.8%) and 180-day (−67.8%) are weak. This is a young, volatile token. Support is around 0.01694–0.01697 and resistance around 0.01704–0.01710. A move above the MA60 would be the first sign of strength. This is not financial advice.
#irys #HotCPIDecemberHikePriced #AnthropicRejectsIPODelayValuationinQuestion #CanNvidiaEarningsEaseMarketConcerns?
#irys #HotCPIDecemberHikePriced #AnthropicRejectsIPODelayValuationinQuestion #CanNvidiaEarningsEaseMarketConcerns?
1
824

·
--
#Irys Here is the 24-hour technical prediction and trading setup for Irys (IRYS) in English, complete with Take Profit (TP) and Stop Loss (SL) levels:
Market Outlook (Next 24 Hours)
Irys (IRYS) is trading around $0.0171 – $0.0174, stabilizing near short-term local support zones after recent market-wide consolidation. Momentum on lower timeframes indicates that buyers are attempting to build a defense base. If this support zone holds firm, a relief bounce toward immediate resistance is likely; however, a breakdown below support could trigger further downward pressure.
Trading Setup (Next 24 Hours)
* Market Bias: Neutral / Short-Term Bounce Watch
* Strategy: Range Scalping / Defensive Long on Support Test
| Parameter | Level / Target |
|---|---|
| Entry Zone (Long) | $0.0167 – $0.0172 (Near immediate local demand floor) |
| Take Profit (TP 1) | $0.0185 (First minor resistance / intraday ceiling) |
| Take Profit (TP 2) | $0.0198 (Stronger overhead supply zone) |
| Stop Loss (SL) | $0.0160 (Strict stop loss below critical local support) |
Key Technical Levels to Watch
* Support Levels:
* $0.0167 (Immediate intraday defense floor)
* $0.0160 (Key structural safety level)
* Resistance Levels:
* $0.0185 (Short-term barrier)
* $0.0198 (Major supply ceiling)
> Risk Management Warning: Small-cap altcoins carry high volatility and thin order book depth. Always use careful position sizing, adhere strictly to your stop loss, and avoid high leverage.
>
#Irys Here is the 24-hour technical prediction and trading setup for Irys (IRYS) in English, complete with Take Profit (TP) and Stop Loss (SL) levels:
Market Outlook (Next 24 Hours)
Irys (IRYS) is trading around $0.0171 – $0.0174, stabilizing near short-term local support zones after recent market-wide consolidation. Momentum on lower timeframes indicates that buyers are attempting to build a defense base. If this support zone holds firm, a relief bounce toward immediate resistance is likely; however, a breakdown below support could trigger further downward pressure.
Trading Setup (Next 24 Hours)
* Market Bias: Neutral / Short-Term Bounce Watch
* Strategy: Range Scalping / Defensive Long on Support Test
| Parameter | Level / Target |
|---|---|
| Entry Zone (Long) | $0.0167 – $0.0172 (Near immediate local demand floor) |
| Take Profit (TP 1) | $0.0185 (First minor resistance / intraday ceiling) |
| Take Profit (TP 2) | $0.0198 (Stronger overhead supply zone) |
| Stop Loss (SL) | $0.0160 (Strict stop loss below critical local support) |
Key Technical Levels to Watch
* Support Levels:
* $0.0167 (Immediate intraday defense floor)
* $0.0160 (Key structural safety level)
* Resistance Levels:
* $0.0185 (Short-term barrier)
* $0.0198 (Major supply ceiling)
> Risk Management Warning: Small-cap altcoins carry high volatility and thin order book depth. Always use careful position sizing, adhere strictly to your stop loss, and avoid high leverage.
>
Market Outlook (Next 24 Hours)
Irys (IRYS) is trading around $0.0171 – $0.0174, stabilizing near short-term local support zones after recent market-wide consolidation. Momentum on lower timeframes indicates that buyers are attempting to build a defense base. If this support zone holds firm, a relief bounce toward immediate resistance is likely; however, a breakdown below support could trigger further downward pressure.
Trading Setup (Next 24 Hours)
* Market Bias: Neutral / Short-Term Bounce Watch
* Strategy: Range Scalping / Defensive Long on Support Test
| Parameter | Level / Target |
|---|---|
| Entry Zone (Long) | $0.0167 – $0.0172 (Near immediate local demand floor) |
| Take Profit (TP 1) | $0.0185 (First minor resistance / intraday ceiling) |
| Take Profit (TP 2) | $0.0198 (Stronger overhead supply zone) |
| Stop Loss (SL) | $0.0160 (Strict stop loss below critical local support) |
Key Technical Levels to Watch
* Support Levels:
* $0.0167 (Immediate intraday defense floor)
* $0.0160 (Key structural safety level)
* Resistance Levels:
* $0.0185 (Short-term barrier)
* $0.0198 (Major supply ceiling)
> Risk Management Warning: Small-cap altcoins carry high volatility and thin order book depth. Always use careful position sizing, adhere strictly to your stop loss, and avoid high leverage.
>
153

·
--
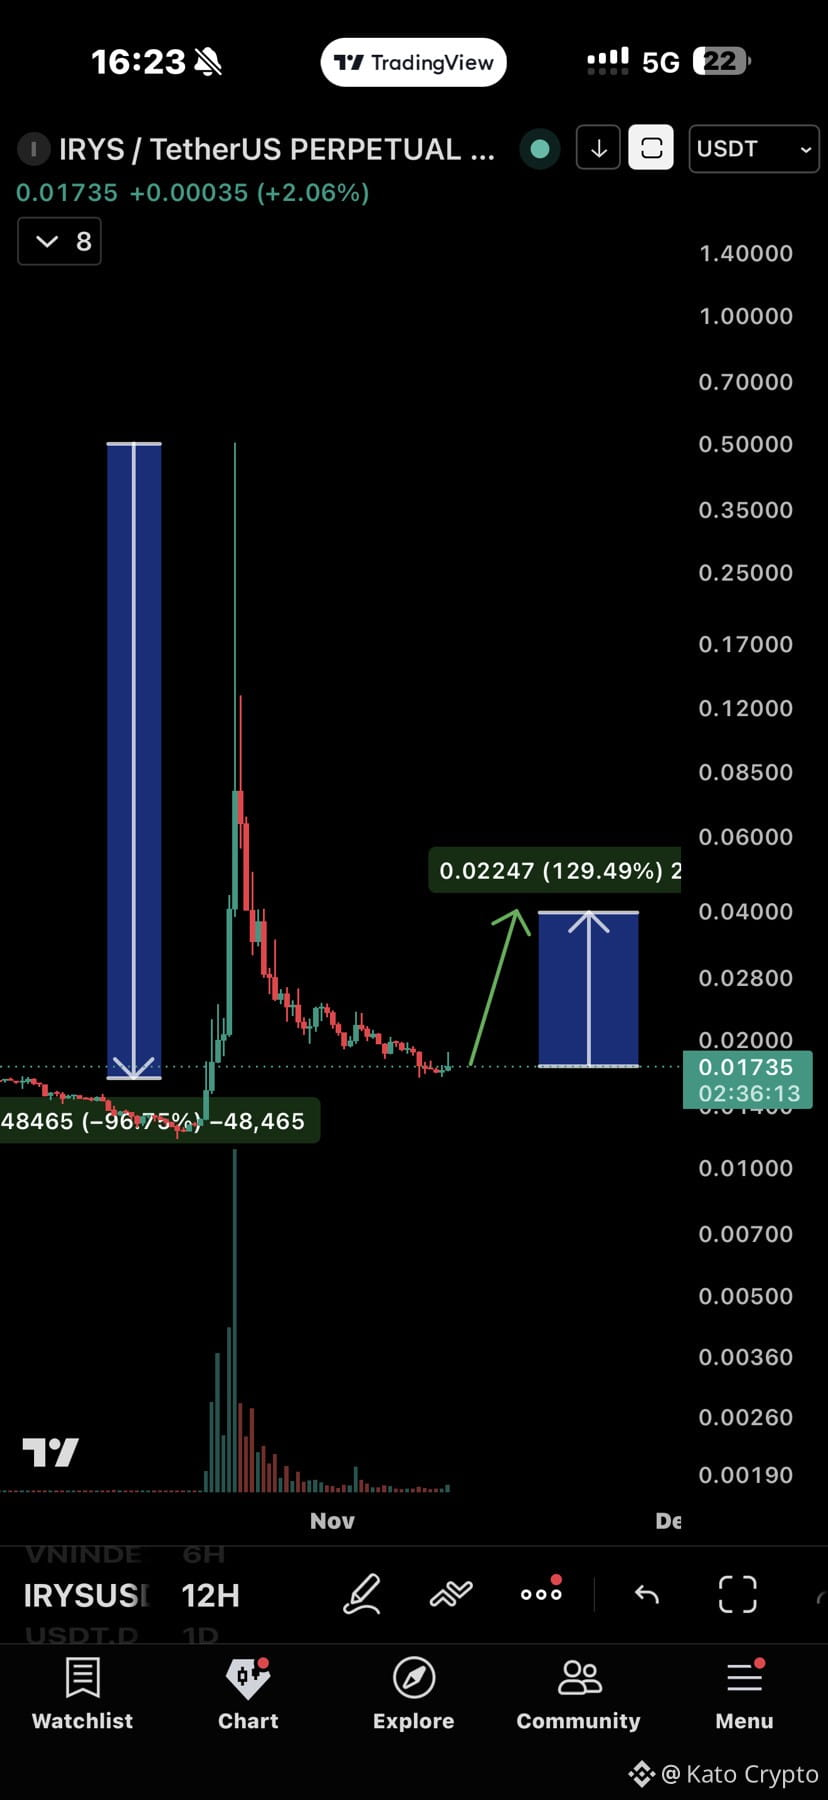
#Irys - Long position
Entry: $0.01740
SL: $0.01414
TP1: $0.01856
TP2: $0.01945
TP3: $0.02122
TP4: $0.02475
TP5: $0.02829
TP6: $0.03536
$IRYS
#Irys - Long position
Entry: $0.01740
SL: $0.01414
TP1: $0.01856
TP2: $0.01945
TP3: $0.02122
TP4: $0.02475
TP5: $0.02829
TP6: $0.03536
$IRYS
Entry: $0.01740
SL: $0.01414
TP1: $0.01856
TP2: $0.01945
TP3: $0.02122
TP4: $0.02475
TP5: $0.02829
TP6: $0.03536
$IRYS
Kato Crypto
·
--
Bullish$IRYS will follow #Agt
buy some at 0.017
buy some at 0.017
1
1
7
2.6k

·
--
30D trade $IRYS 3.8K USDT
🚀 CRYPTO MARKET UPDATE 📊
💎 $IRYS /USDT
{future}(IRYSUSDT)
🟢 Price: $0.01754 (+2.10%)
📈 Showing a recovery with bullish momentum.
🎯 Resistance: $0.01784 – $0.01799
⚠️ Crypto is volatile. Always manage your risk!
#IRYS #Binance #Crypto #MarketUpdates" #HotCPIDecemberHikePriced
🚀 CRYPTO MARKET UPDATE 📊
💎 $IRYS /USDT
🟢 Price: $0.01754 (+2.10%)
📈 Showing a recovery with bullish momentum.
🎯 Resistance: $0.01784 – $0.01799
⚠️ Crypto is volatile. Always manage your risk!
#IRYS #Binance #Crypto #MarketUpdates" #HotCPIDecemberHikePriced
💎 $IRYS /USDT
🟢 Price: $0.01754 (+2.10%)
📈 Showing a recovery with bullish momentum.
🎯 Resistance: $0.01784 – $0.01799
⚠️ Crypto is volatile. Always manage your risk!
#IRYS #Binance #Crypto #MarketUpdates" #HotCPIDecemberHikePriced
551

·
--
Bearish
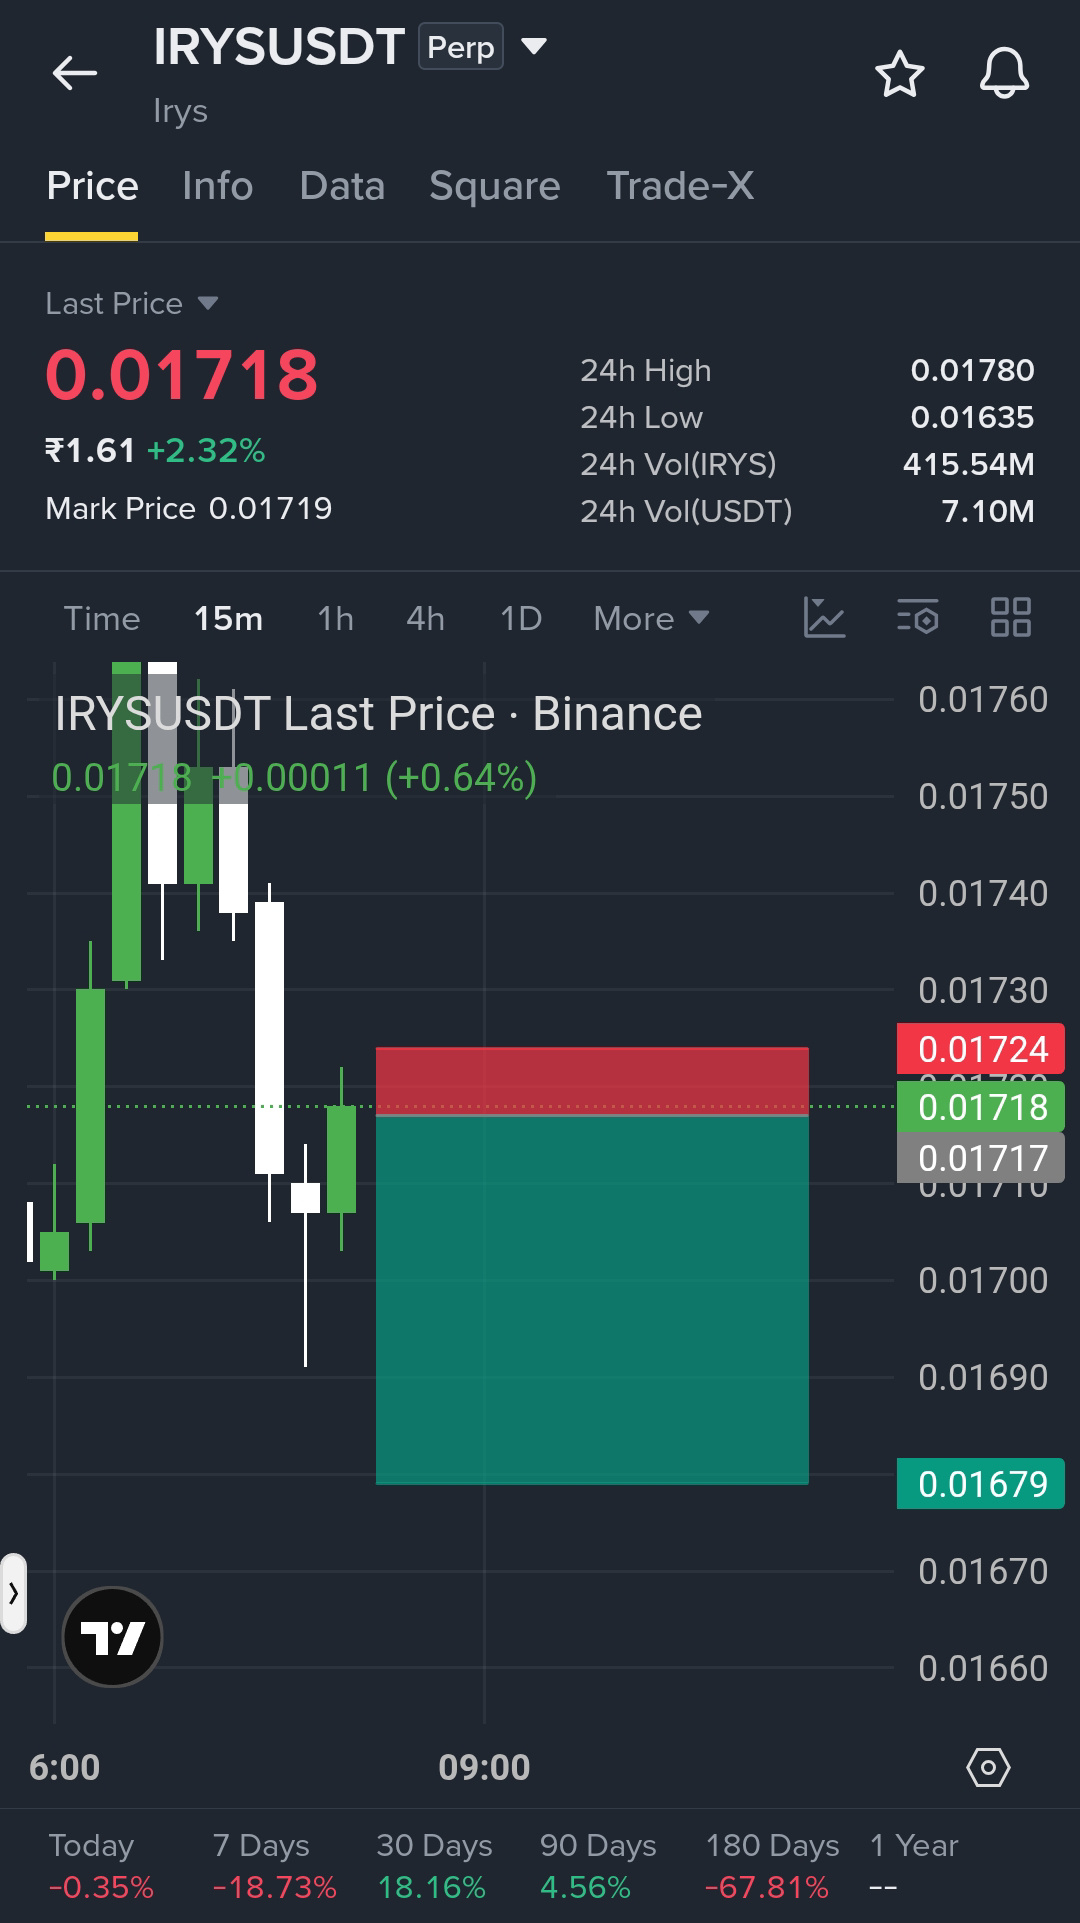
#IRYS SHORT ALERT 🤯 IRYS is struggling to reclaim resistance. I’m taking a Short here 👇
Entry: 0.01717
Stop-loss: 0.01724
TP1: 0.01704
TP2: 0.01692
TP3: 0.01679
Click here to trade 👇⬇️⬇️ Short.. With meeee...👇⬇️ $IRYS
{future}(IRYSUSDT)
#IRYS SHORT ALERT 🤯 IRYS is struggling to reclaim resistance. I’m taking a Short here 👇
Entry: 0.01717
Stop-loss: 0.01724
TP1: 0.01704
TP2: 0.01692
TP3: 0.01679
Click here to trade 👇⬇️⬇️ Short.. With meeee...👇⬇️ $IRYS
Entry: 0.01717
Stop-loss: 0.01724
TP1: 0.01704
TP2: 0.01692
TP3: 0.01679
Click here to trade 👇⬇️⬇️ Short.. With meeee...👇⬇️ $IRYS
354

·
--
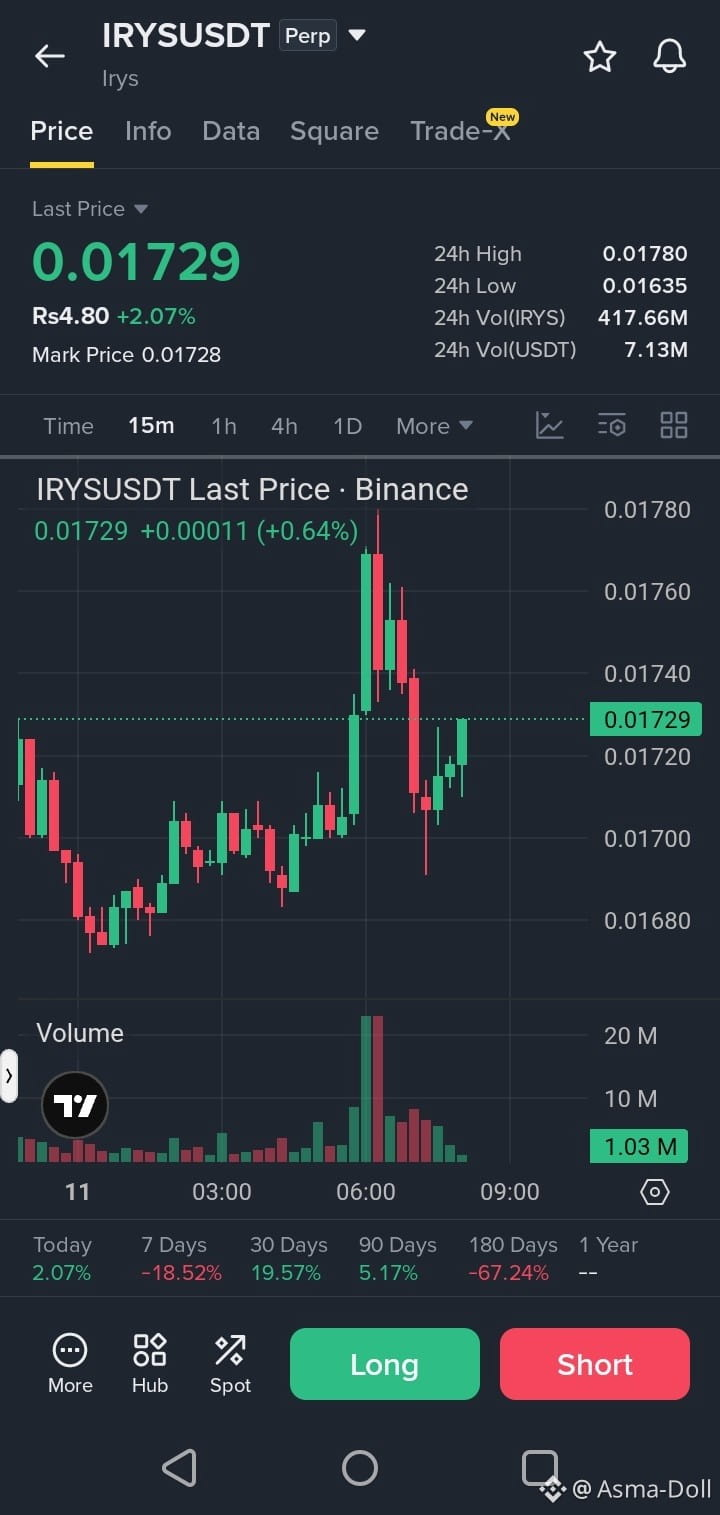
$IRYS /USDT – LONG SIGNAL 📈
Entry Zone: 0.01715 – 0.01730
Stop Loss (SL): 0.01665
Take Profit Targets:
TP1: 0.01760
TP2: 0.01790
TP3: 0.01840
Trade here $IRYS
{future}(IRYSUSDT)
Analysis:
Price showing a positive recovery (+2.07%).
Strong support near 0.01635.
Buyers attempting to push price toward 0.01780 resistance.
Short-term momentum slightly bullish.
Breakout above 0.01780 could trigger further upside.
Confirmation: Clean breakout above 0.01780 with strong volume confirms bullish momentum.
Risk-to-Reward: Approximately 1:1 to 1:2.2 (depending on entry and target).
⚠️ Avoid entry if price loses 0.01665. Wait for confirmation before trading.
#IRYS #IRYSUSDT #BinanceFutures #CryptoSignals #Altcoins
$IRYS /USDT – LONG SIGNAL 📈
Entry Zone: 0.01715 – 0.01730
Stop Loss (SL): 0.01665
Take Profit Targets:
TP1: 0.01760
TP2: 0.01790
TP3: 0.01840
Trade here $IRYS
Analysis:
Price showing a positive recovery (+2.07%).
Strong support near 0.01635.
Buyers attempting to push price toward 0.01780 resistance.
Short-term momentum slightly bullish.
Breakout above 0.01780 could trigger further upside.
Confirmation: Clean breakout above 0.01780 with strong volume confirms bullish momentum.
Risk-to-Reward: Approximately 1:1 to 1:2.2 (depending on entry and target).
⚠️ Avoid entry if price loses 0.01665. Wait for confirmation before trading.
#IRYS #IRYSUSDT #BinanceFutures #CryptoSignals #Altcoins
Entry Zone: 0.01715 – 0.01730
Stop Loss (SL): 0.01665
Take Profit Targets:
TP1: 0.01760
TP2: 0.01790
TP3: 0.01840
Trade here $IRYS
Analysis:
Price showing a positive recovery (+2.07%).
Strong support near 0.01635.
Buyers attempting to push price toward 0.01780 resistance.
Short-term momentum slightly bullish.
Breakout above 0.01780 could trigger further upside.
Confirmation: Clean breakout above 0.01780 with strong volume confirms bullish momentum.
Risk-to-Reward: Approximately 1:1 to 1:2.2 (depending on entry and target).
⚠️ Avoid entry if price loses 0.01665. Wait for confirmation before trading.
#IRYS #IRYSUSDT #BinanceFutures #CryptoSignals #Altcoins
Lucky_Yt:
great
1
3
86

·
--
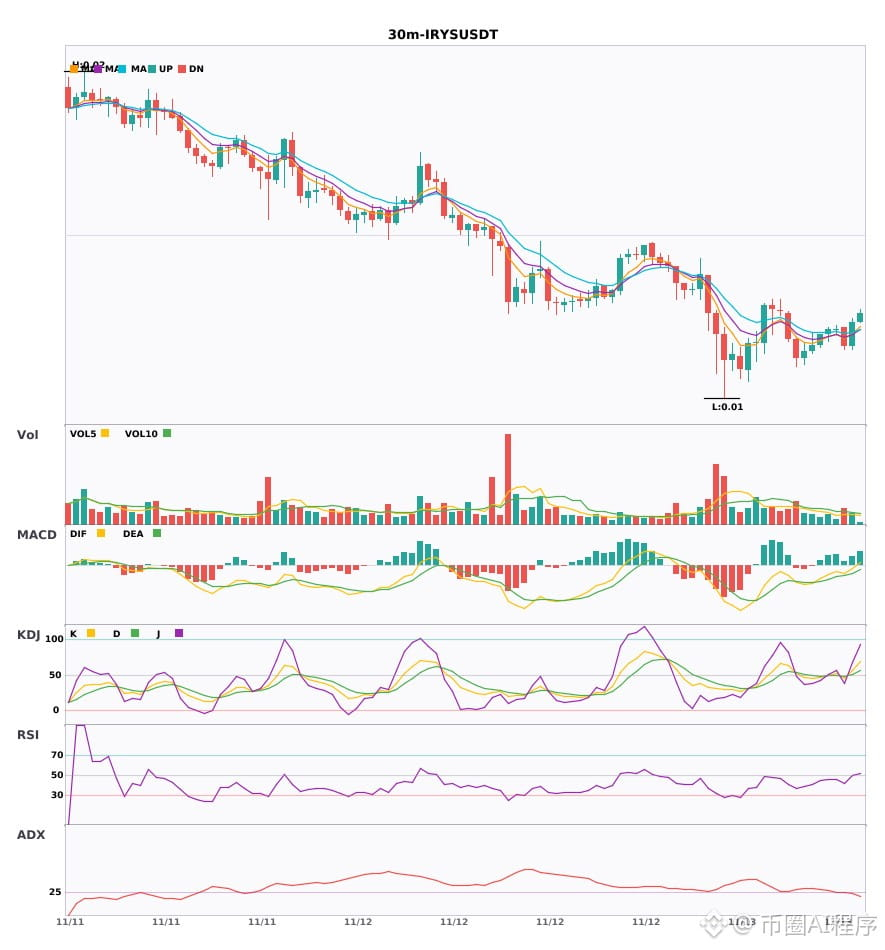
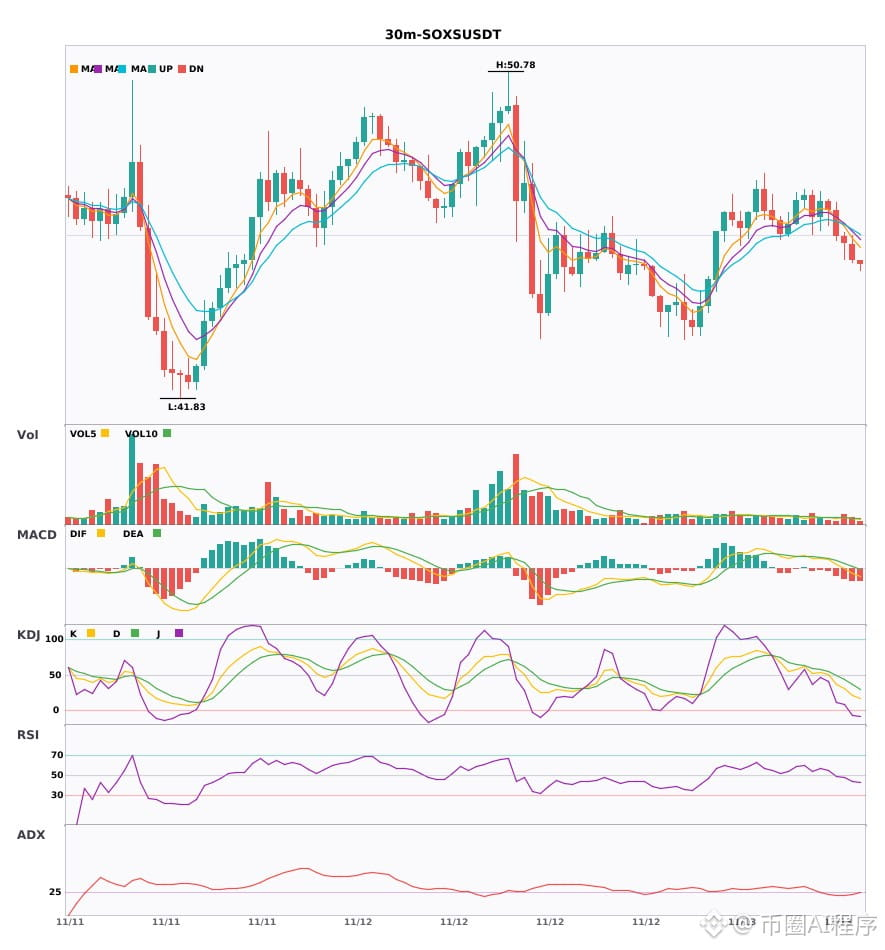
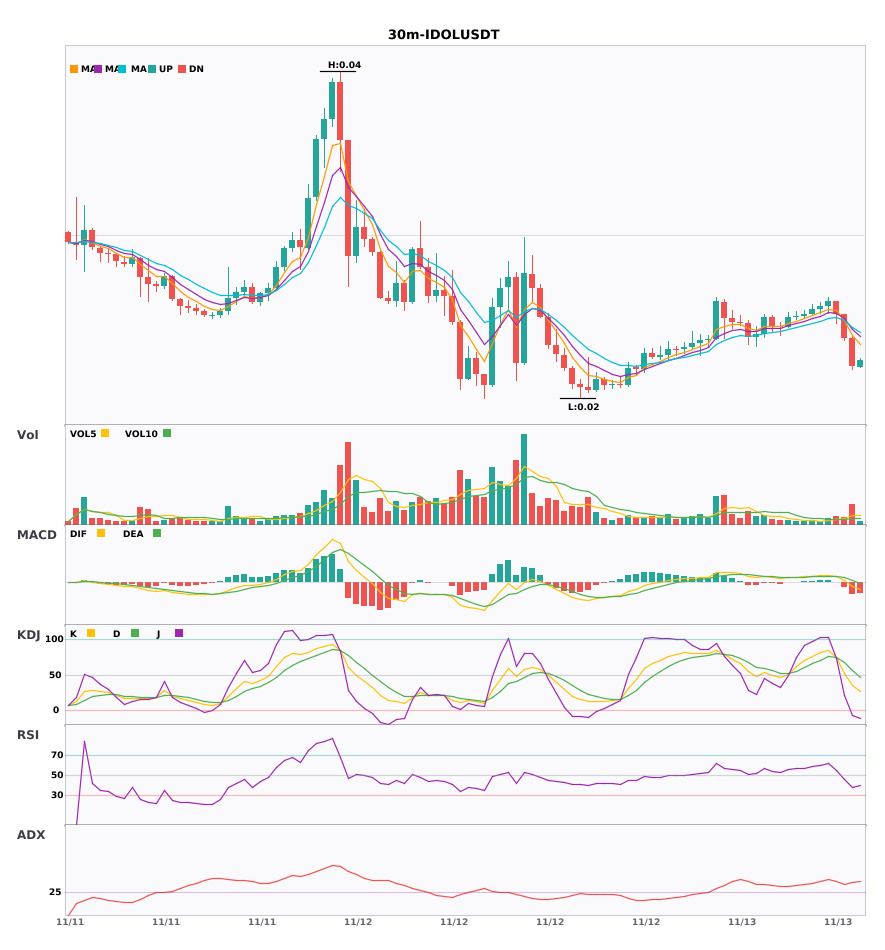
30m weakened; 4h bearish trend just confirmed $IRYS $SOXS $IDOL🔥
════════════════════
🟢 $IRYS 30-minute bearish signal
⚠️Technical analysis: 30-minute entry; EMA5 has just crossed below EMA8, turning bearish; KDJ bearish crossover moving down; 4-hour bearish confluence confirmed; volume increased 1.2x
════════════════════
🟢 $SOXS 30-minute bearish signal
⚠️Technical analysis: 4-hour and 30-minute bearish confluence confirmed; MACD bearish crossover, green bars continuing to expand; moving averages diverging bearishly downward; KDJ K crossing below D, showing weakness; volume increased 1.5x
════════════════════
🟢 $IDOL 30-minute bearish signal
⚠️Technical analysis: 30-minute entry; 4-hour bearish confluence confirmed. MACD bearish crossover below the zero line, with expanding green bars; moving averages aligned bearishly and diverging downward; volume surged 3.1x, confirming a clear bearish signal.
════════════════════
🔔 Follow for first-hand market alerts 🔔
#多周期共振 #IRYS #SOXS #IDOL
📌 When trading, pay attention to whether the candlestick pattern aligns
30m weakened; 4h bearish trend just confirmed $IRYS $SOXS $IDOL 🔥
════════════════════
🟢 $IRYS 30-minute bearish signal
⚠️Technical analysis: 30-minute entry; EMA5 has just crossed below EMA8, turning bearish; KDJ bearish crossover moving down; 4-hour bearish confluence confirmed; volume increased 1.2x
════════════════════
🟢 $SOXS 30-minute bearish signal
⚠️Technical analysis: 4-hour and 30-minute bearish confluence confirmed; MACD bearish crossover, green bars continuing to expand; moving averages diverging bearishly downward; KDJ K crossing below D, showing weakness; volume increased 1.5x
════════════════════
🟢 $IDOL 30-minute bearish signal
⚠️Technical analysis: 30-minute entry; 4-hour bearish confluence confirmed. MACD bearish crossover below the zero line, with expanding green bars; moving averages aligned bearishly and diverging downward; volume surged 3.1x, confirming a clear bearish signal.
════════════════════
🔔 Follow for first-hand market alerts 🔔
#多周期共振 #IRYS #SOXS #IDOL
📌 When trading, pay attention to whether the candlestick pattern aligns
════════════════════
🟢 $IRYS 30-minute bearish signal
⚠️Technical analysis: 30-minute entry; EMA5 has just crossed below EMA8, turning bearish; KDJ bearish crossover moving down; 4-hour bearish confluence confirmed; volume increased 1.2x
════════════════════
🟢 $SOXS 30-minute bearish signal
⚠️Technical analysis: 4-hour and 30-minute bearish confluence confirmed; MACD bearish crossover, green bars continuing to expand; moving averages diverging bearishly downward; KDJ K crossing below D, showing weakness; volume increased 1.5x
════════════════════
🟢 $IDOL 30-minute bearish signal
⚠️Technical analysis: 30-minute entry; 4-hour bearish confluence confirmed. MACD bearish crossover below the zero line, with expanding green bars; moving averages aligned bearishly and diverging downward; volume surged 3.1x, confirming a clear bearish signal.
════════════════════
🔔 Follow for first-hand market alerts 🔔
#多周期共振 #IRYS #SOXS #IDOL
📌 When trading, pay attention to whether the candlestick pattern aligns
36

·
--
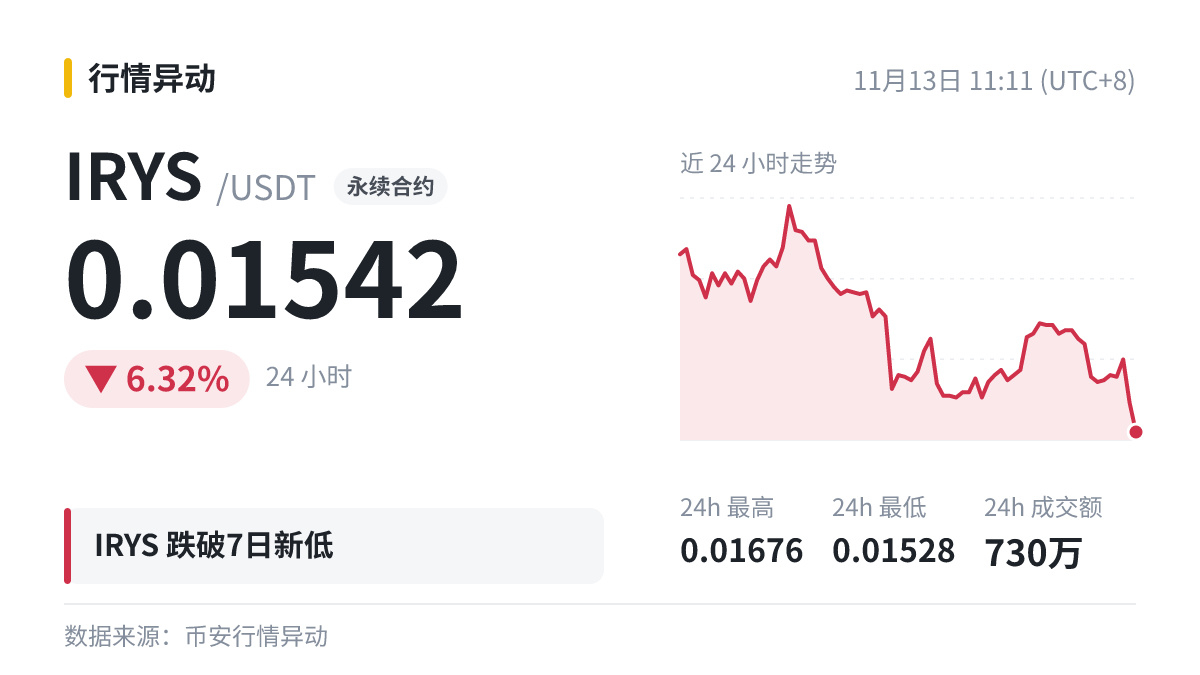
😵 $IRYS set a new 7-day low at 0.01542, breaking below the previous low of 0.01543.
Support has been breached. The sharper the drop, the more likely panic is to overshoot. At this level, what do you look at first?
#IRYS
😵 $IRYS set a new 7-day low at 0.01542, breaking below the previous low of 0.01543.
Support has been breached. The sharper the drop, the more likely panic is to overshoot. At this level, what do you look at first?
#IRYS
Support has been breached. The sharper the drop, the more likely panic is to overshoot. At this level, what do you look at first?
#IRYS
猪生狼来了:
看归零
1
1
296

🧊 $IRYS hit a new 7-day low of 0.01541, breaking below the previous low of 0.01543.
A single bearish candle punched straight through. First, see whether support can hold—don’t rush to catch a falling knife. When it drops to this level, what’s the first thing you think of?
#IRYS
🧊 $IRYS hit a new 7-day low of 0.01541, breaking below the previous low of 0.01543.
A single bearish candle punched straight through. First, see whether support can hold—don’t rush to catch a falling knife. When it drops to this level, what’s the first thing you think of?
#IRYS
A single bearish candle punched straight through. First, see whether support can hold—don’t rush to catch a falling knife. When it drops to this level, what’s the first thing you think of?
#IRYS
26

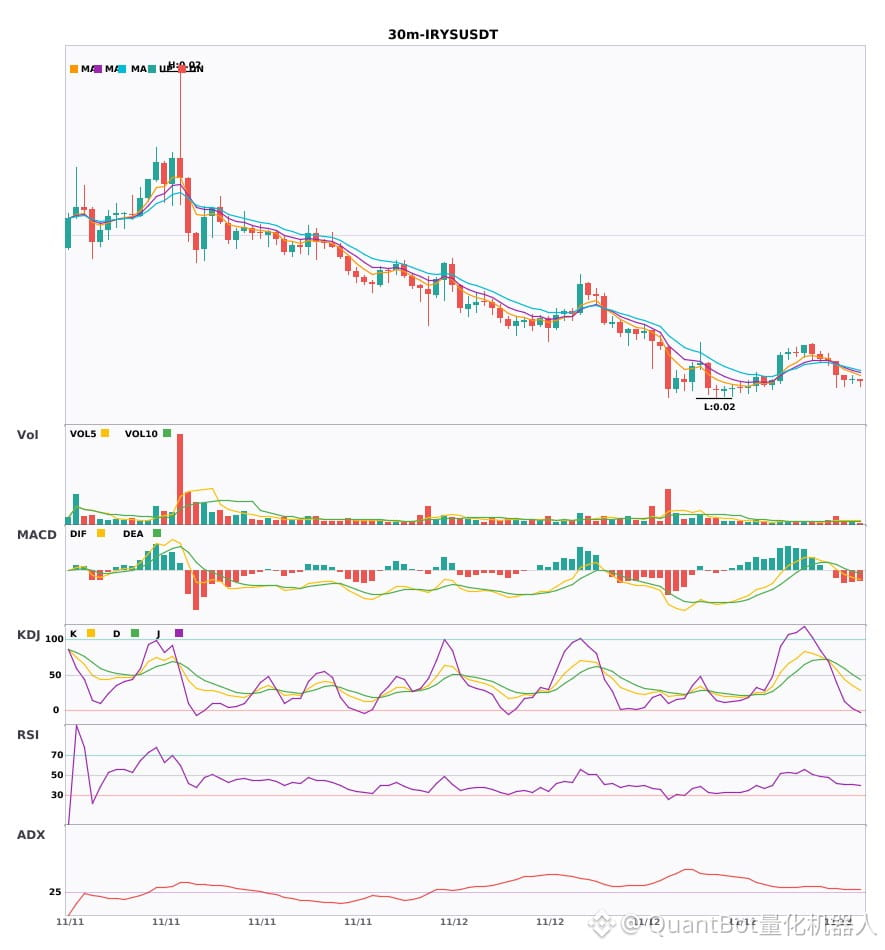
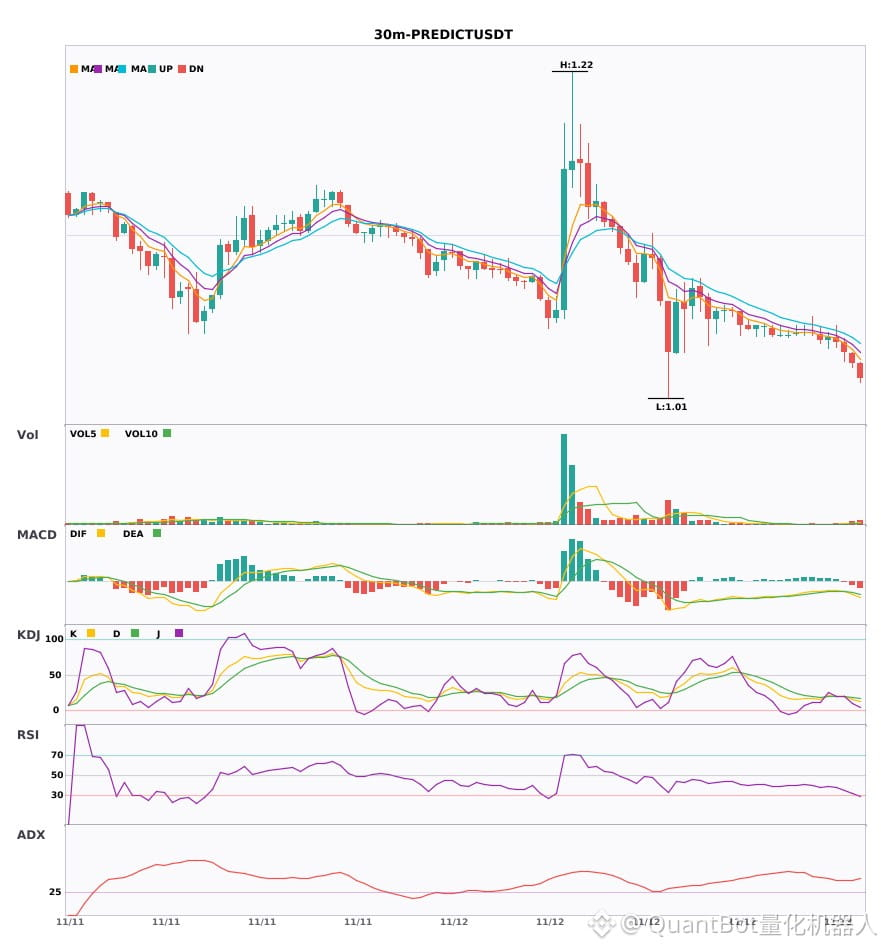
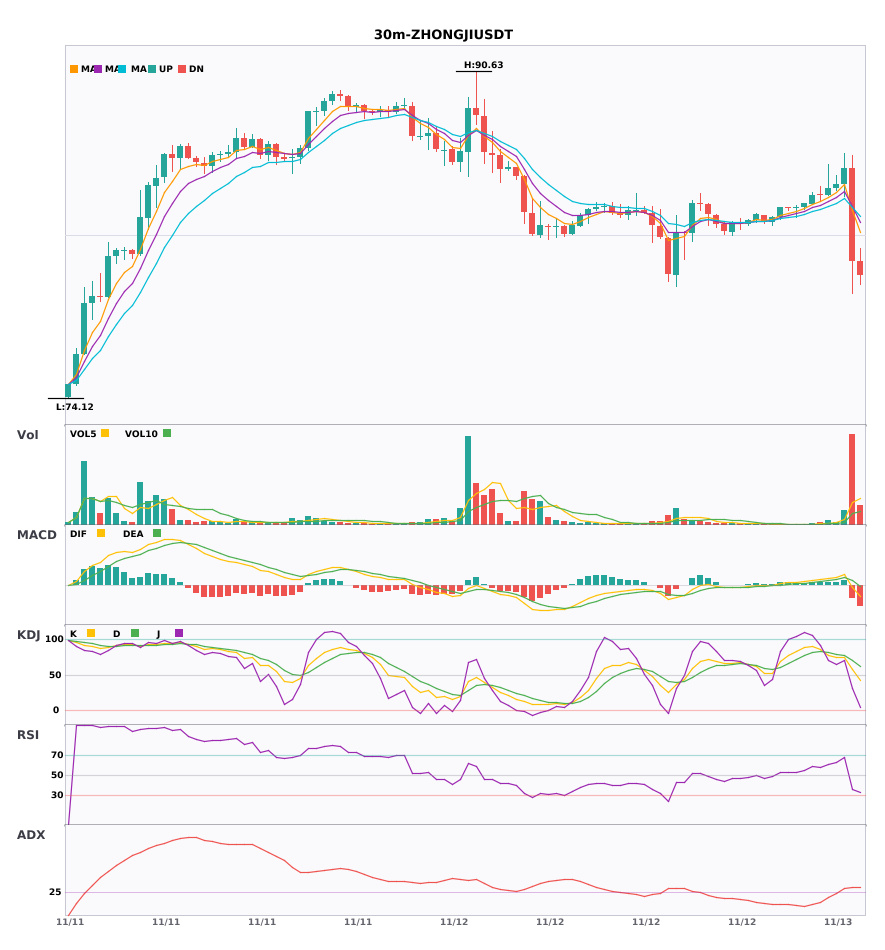
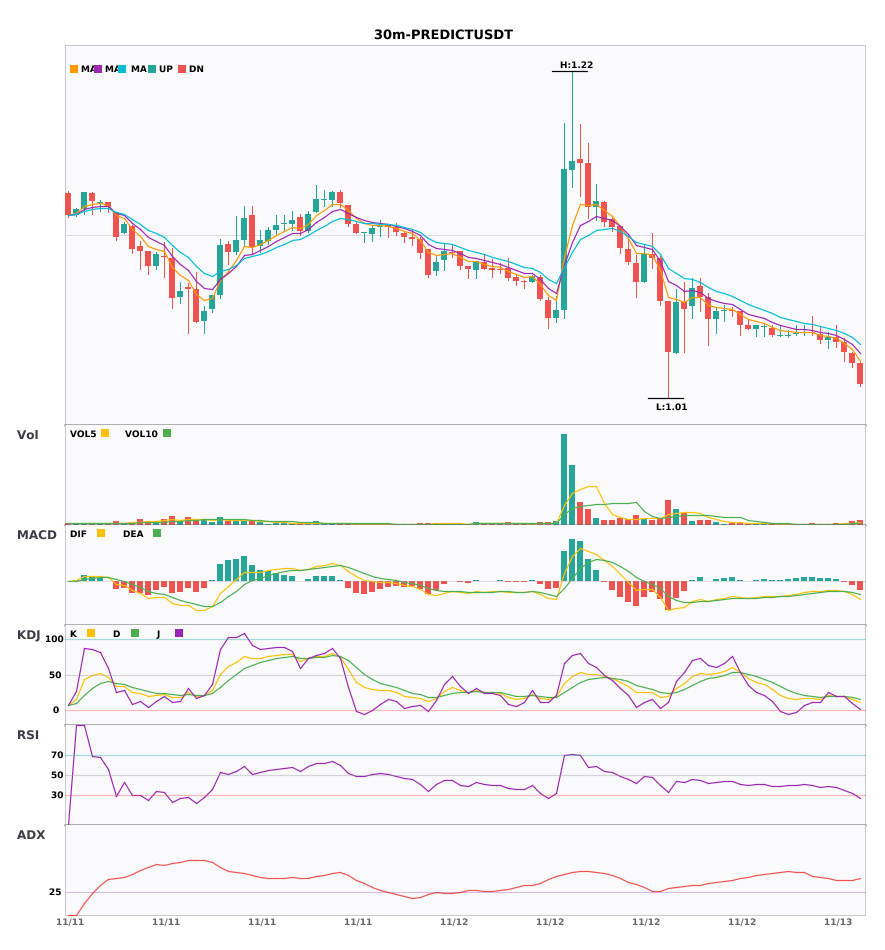
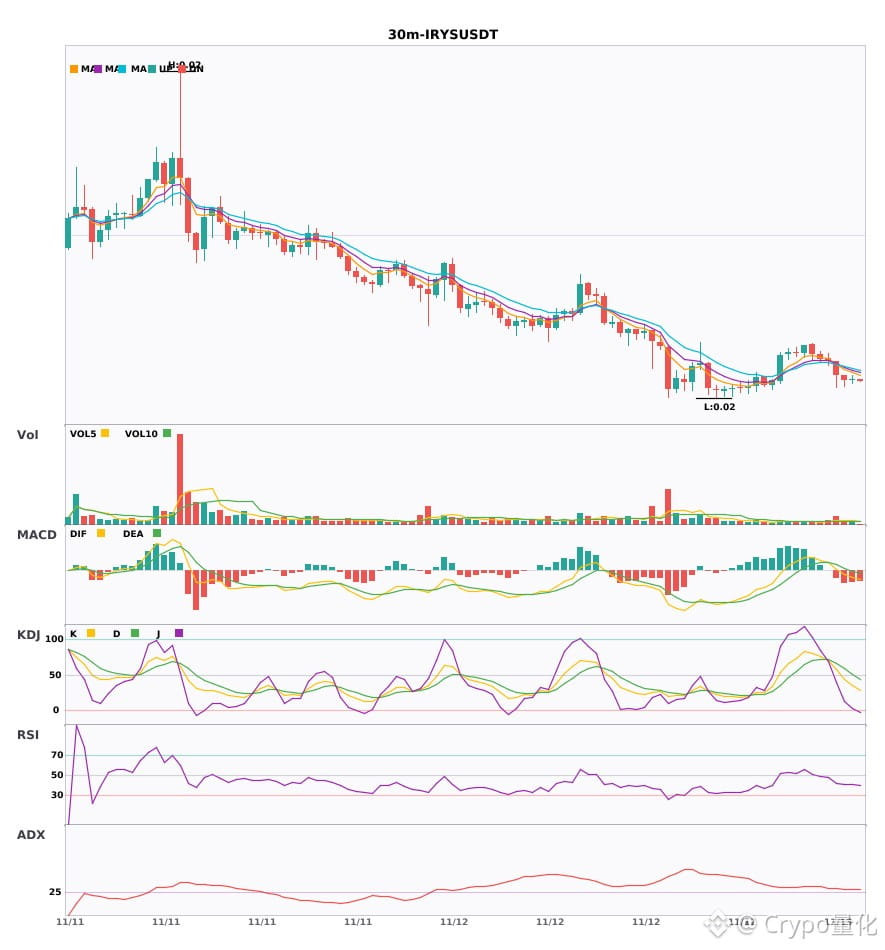
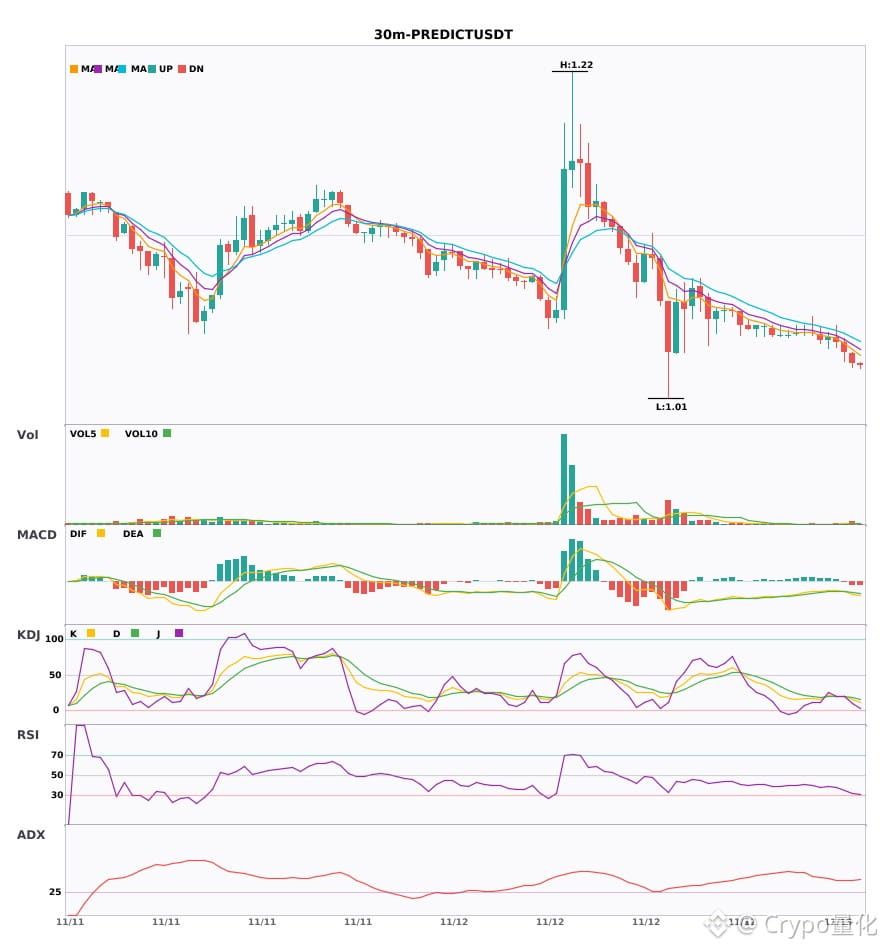
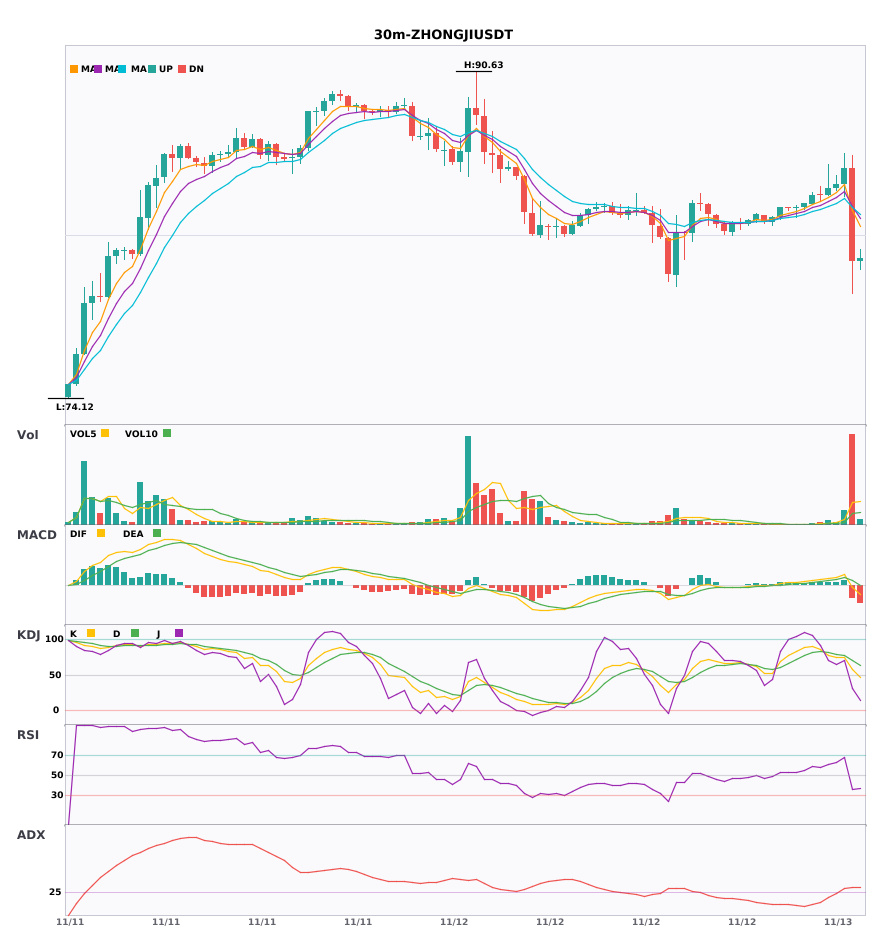
$IRYS / $PREDICT / $ZHONGJI 30-minute timeframe resonance to the downside, with bearish signals confirmed simultaneously
📉 $IRYS | 30-minute bearish signal
━━━━━━━━━━━━━━━━━━
Technical analysis: ADX(32) indicates a strong trend; MACD DIF has fallen below the zero line, confirming the bearish signal; EMA5<EMA8<EMA13 are bearishly aligned; trading volume surged to 2.3 times its previous level, confirming downward pressure.
Price change: -0.3200%
📉 $PREDICT | 30-minute bearish signal
━━━━━━━━━━━━━━━━━━
Technical analysis: ADX(37) indicates a pronounced trend; MACD formed a death cross below zero, accelerating the bearish momentum; EMA5<8<13 are bearishly aligned; KDJ death cross (K19.7/D19.8); trading volume surged to 2.1 times its previous level.
Price change: -0.5800%
📌 Market update: Binance will list Predict (PREDICT) and label it with a "Seed" tag.
📉 $ZHONGJI | 30-minute bearish signal
━━━━━━━━━━━━━━━━━━
Technical analysis: ADX(35) indicates a pronounced trend; MACD formed a death cross below zero, accelerating the bearish momentum; EMA5 crossed below EMA8, turning bearish in the short term; bullish momentum dominates KDJ (K57.4/D70.7); volume surged 7.7 times.
Price change: -5.4800%
━━━━━━━━━━━━━━━━━━
#技术分析 #IRYS #PREDICT #ZHONGJI
📌 The above content is for reference only and does not constitute investment advice
$IRYS / $PREDICT / $ZHONGJI 30-minute timeframe resonance to the downside, with bearish signals confirmed simultaneously
📉 $IRYS | 30-minute bearish signal
━━━━━━━━━━━━━━━━━━
Technical analysis: ADX(32) indicates a strong trend; MACD DIF has fallen below the zero line, confirming the bearish signal; EMA5<EMA8<EMA13 are bearishly aligned; trading volume surged to 2.3 times its previous level, confirming downward pressure.
Price change: -0.3200%
📉 $PREDICT | 30-minute bearish signal
━━━━━━━━━━━━━━━━━━
Technical analysis: ADX(37) indicates a pronounced trend; MACD formed a death cross below zero, accelerating the bearish momentum; EMA5<8<13 are bearishly aligned; KDJ death cross (K19.7/D19.8); trading volume surged to 2.1 times its previous level.
Price change: -0.5800%
📌 Market update: Binance will list Predict (PREDICT) and label it with a "Seed" tag.
📉 $ZHONGJI | 30-minute bearish signal
━━━━━━━━━━━━━━━━━━
Technical analysis: ADX(35) indicates a pronounced trend; MACD formed a death cross below zero, accelerating the bearish momentum; EMA5 crossed below EMA8, turning bearish in the short term; bullish momentum dominates KDJ (K57.4/D70.7); volume surged 7.7 times.
Price change: -5.4800%
━━━━━━━━━━━━━━━━━━
#技术分析 #IRYS #PREDICT #ZHONGJI
📌 The above content is for reference only and does not constitute investment advice
📉 $IRYS | 30-minute bearish signal
━━━━━━━━━━━━━━━━━━
Technical analysis: ADX(32) indicates a strong trend; MACD DIF has fallen below the zero line, confirming the bearish signal; EMA5<EMA8<EMA13 are bearishly aligned; trading volume surged to 2.3 times its previous level, confirming downward pressure.
Price change: -0.3200%
📉 $PREDICT | 30-minute bearish signal
━━━━━━━━━━━━━━━━━━
Technical analysis: ADX(37) indicates a pronounced trend; MACD formed a death cross below zero, accelerating the bearish momentum; EMA5<8<13 are bearishly aligned; KDJ death cross (K19.7/D19.8); trading volume surged to 2.1 times its previous level.
Price change: -0.5800%
📌 Market update: Binance will list Predict (PREDICT) and label it with a "Seed" tag.
📉 $ZHONGJI | 30-minute bearish signal
━━━━━━━━━━━━━━━━━━
Technical analysis: ADX(35) indicates a pronounced trend; MACD formed a death cross below zero, accelerating the bearish momentum; EMA5 crossed below EMA8, turning bearish in the short term; bullish momentum dominates KDJ (K57.4/D70.7); volume surged 7.7 times.
Price change: -5.4800%
━━━━━━━━━━━━━━━━━━
#技术分析 #IRYS #PREDICT #ZHONGJI
📌 The above content is for reference only and does not constitute investment advice
26
·
--
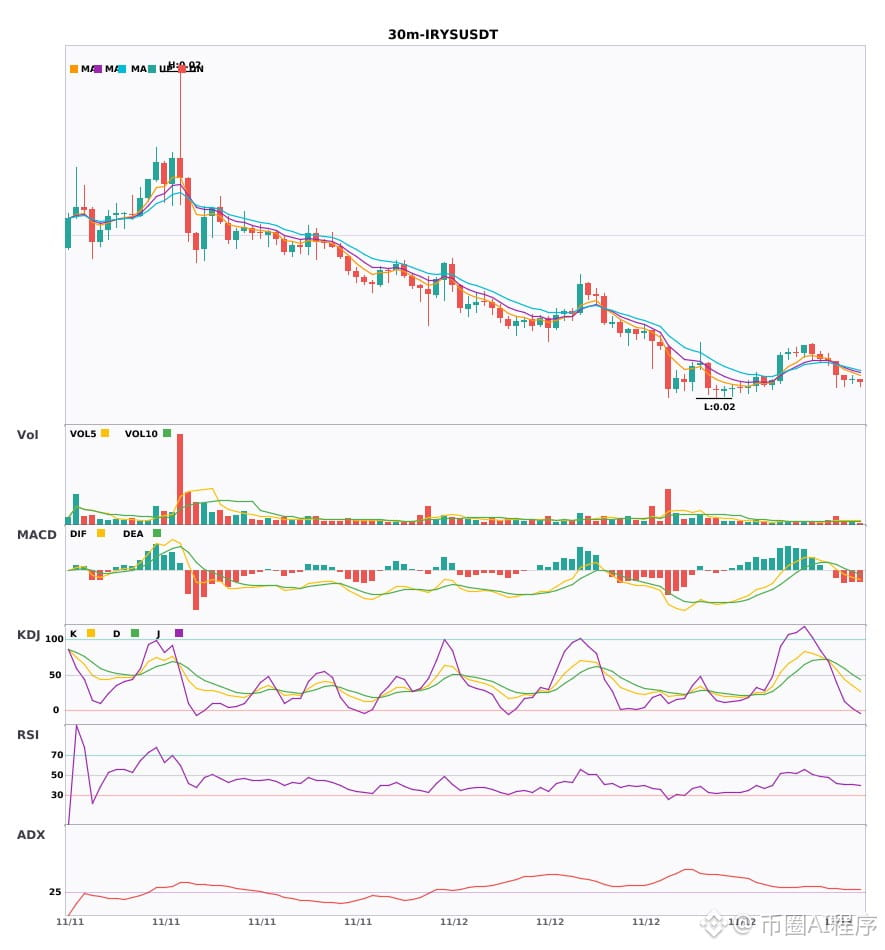
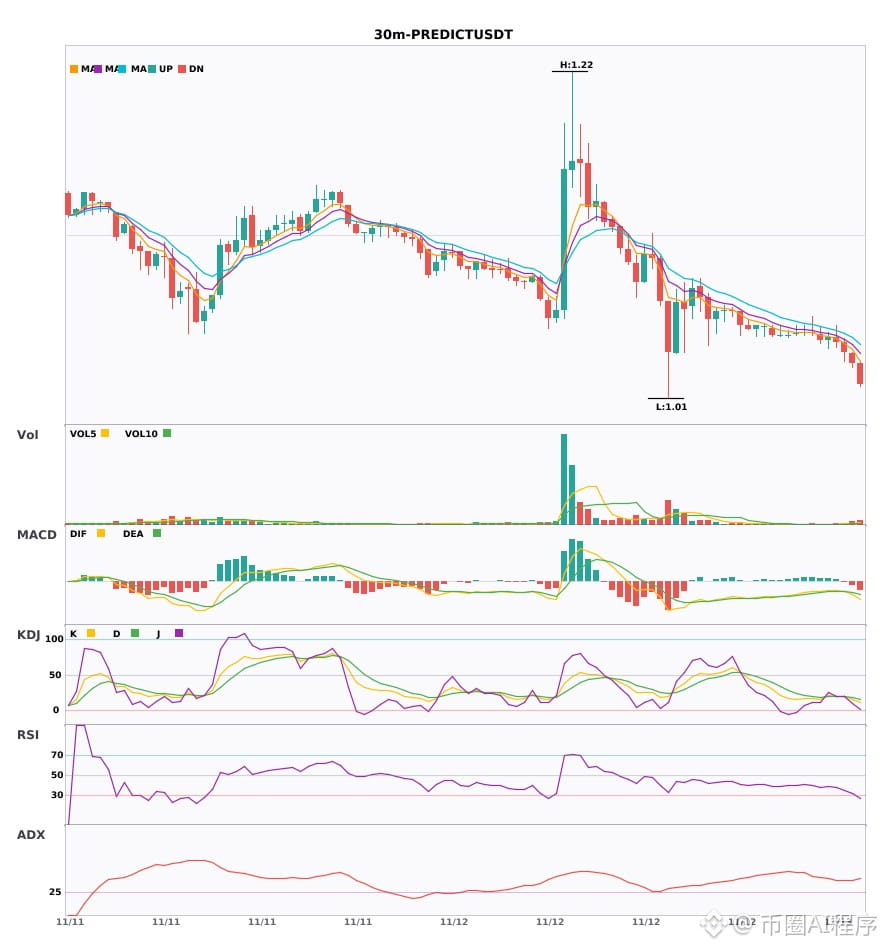
$IRYS / $PREDICT 30-minute bearish + 4-hour bearish alignment; multi-timeframe confluence turns bearish 🔥
════════════════════
🟢 $IRYS 30-minute bearish signal
⚠️Technical analysis: 4-hour bearish + 30-minute bearish confluence confirmed: MACD bearish crossover with expanding green bars, moving averages in a bearish alignment spreading downward, trading volume up 2.3x
════════════════════
🟢 $PREDICT 30-minute bearish signal
⚠️Technical analysis: 4-hour bearish + 30-minute confluence for a short! MACD bearish crossover with expanding green bars, moving averages in a bearish alignment spreading downward, KDJ bearish crossover but not oversold, trading volume up 2.1x
📢Market update: Binance will list Predict (PREDICT) with the "Seed Tag".
════════════════════
🔔 Follow for first-hand market alerts 🔔
#多周期共振 #IRYS #PREDICT
📌 When trading, pay attention to whether the candlestick pattern confirms
$IRYS / $PREDICT 30-minute bearish + 4-hour bearish alignment; multi-timeframe confluence turns bearish 🔥
════════════════════
🟢 $IRYS 30-minute bearish signal
⚠️Technical analysis: 4-hour bearish + 30-minute bearish confluence confirmed: MACD bearish crossover with expanding green bars, moving averages in a bearish alignment spreading downward, trading volume up 2.3x
════════════════════
🟢 $PREDICT 30-minute bearish signal
⚠️Technical analysis: 4-hour bearish + 30-minute confluence for a short! MACD bearish crossover with expanding green bars, moving averages in a bearish alignment spreading downward, KDJ bearish crossover but not oversold, trading volume up 2.1x
📢Market update: Binance will list Predict (PREDICT) with the "Seed Tag".
════════════════════
🔔 Follow for first-hand market alerts 🔔
#多周期共振 #IRYS #PREDICT
📌 When trading, pay attention to whether the candlestick pattern confirms
════════════════════
🟢 $IRYS 30-minute bearish signal
⚠️Technical analysis: 4-hour bearish + 30-minute bearish confluence confirmed: MACD bearish crossover with expanding green bars, moving averages in a bearish alignment spreading downward, trading volume up 2.3x
════════════════════
🟢 $PREDICT 30-minute bearish signal
⚠️Technical analysis: 4-hour bearish + 30-minute confluence for a short! MACD bearish crossover with expanding green bars, moving averages in a bearish alignment spreading downward, KDJ bearish crossover but not oversold, trading volume up 2.1x
📢Market update: Binance will list Predict (PREDICT) with the "Seed Tag".
════════════════════
🔔 Follow for first-hand market alerts 🔔
#多周期共振 #IRYS #PREDICT
📌 When trading, pay attention to whether the candlestick pattern confirms
21
·
--
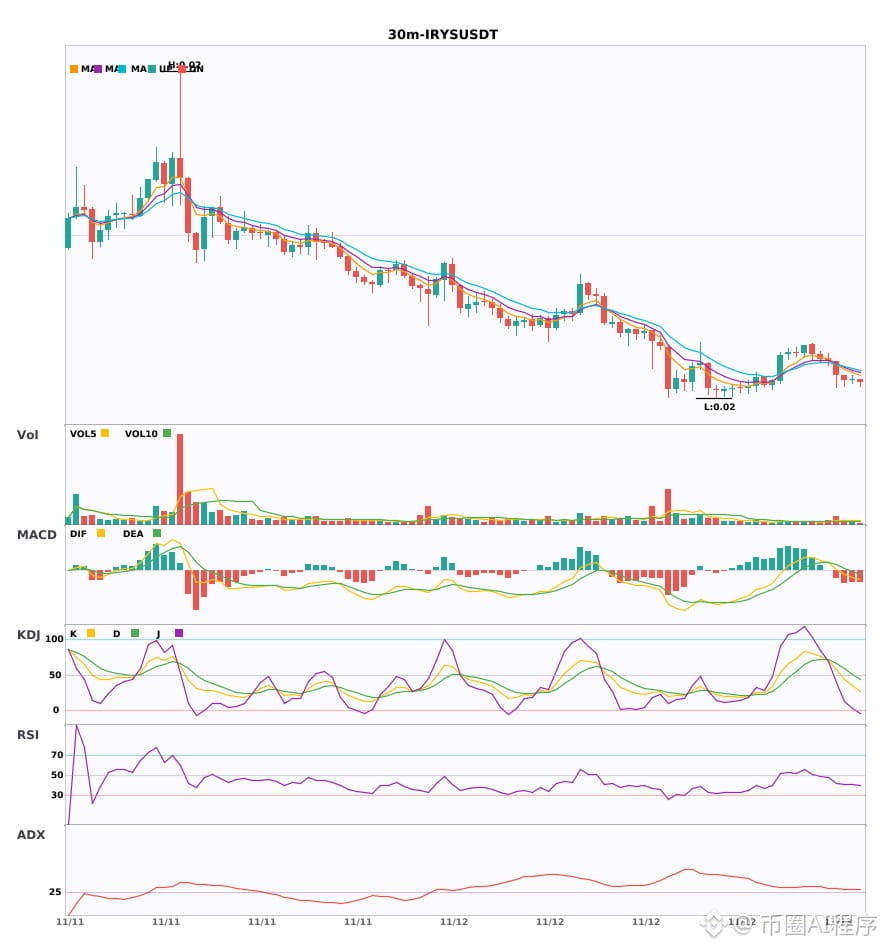
$IRYS $PREDICT 30-minute shorts emerge; 4-hour bearish trend confirmed 🔥
════════════════════
🟢 $IRYS 30-minute bearish signal
⚠️Technical analysis: Bearish confluence across multiple timeframes: the 30-minute MACD has formed a death cross and fallen below the zero line on 2.3x volume; moving averages are bearishly aligned and diverging downward. The 4-hour bearish confluence is confirmed.
════════════════════
🟢 $PREDICT 30-minute bearish signal
⚠️Technical analysis: The 30-minute entry signal is confirmed by 4-hour bearish confluence. After the MACD death cross, the green bars continue to expand; moving averages are bearishly aligned and diverging downward. The KDJ death cross is not yet oversold, and volume has doubled, suggesting a short-term bearish outlook.
📢Market update: Binance will list Predict (PREDICT) and mark it with a Seed tag.
════════════════════
🔔 Follow for first-hand market alerts 🔔
#多周期共振 #IRYS #PREDICT
📌 When trading, pay attention to whether the candlestick pattern aligns
$IRYS $PREDICT 30-minute shorts emerge; 4-hour bearish trend confirmed 🔥
════════════════════
🟢 $IRYS 30-minute bearish signal
⚠️Technical analysis: Bearish confluence across multiple timeframes: the 30-minute MACD has formed a death cross and fallen below the zero line on 2.3x volume; moving averages are bearishly aligned and diverging downward. The 4-hour bearish confluence is confirmed.
════════════════════
🟢 $PREDICT 30-minute bearish signal
⚠️Technical analysis: The 30-minute entry signal is confirmed by 4-hour bearish confluence. After the MACD death cross, the green bars continue to expand; moving averages are bearishly aligned and diverging downward. The KDJ death cross is not yet oversold, and volume has doubled, suggesting a short-term bearish outlook.
📢Market update: Binance will list Predict (PREDICT) and mark it with a Seed tag.
════════════════════
🔔 Follow for first-hand market alerts 🔔
#多周期共振 #IRYS #PREDICT
📌 When trading, pay attention to whether the candlestick pattern aligns
════════════════════
🟢 $IRYS 30-minute bearish signal
⚠️Technical analysis: Bearish confluence across multiple timeframes: the 30-minute MACD has formed a death cross and fallen below the zero line on 2.3x volume; moving averages are bearishly aligned and diverging downward. The 4-hour bearish confluence is confirmed.
════════════════════
🟢 $PREDICT 30-minute bearish signal
⚠️Technical analysis: The 30-minute entry signal is confirmed by 4-hour bearish confluence. After the MACD death cross, the green bars continue to expand; moving averages are bearishly aligned and diverging downward. The KDJ death cross is not yet oversold, and volume has doubled, suggesting a short-term bearish outlook.
📢Market update: Binance will list Predict (PREDICT) and mark it with a Seed tag.
════════════════════
🔔 Follow for first-hand market alerts 🔔
#多周期共振 #IRYS #PREDICT
📌 When trading, pay attention to whether the candlestick pattern aligns
14

·
--
30-minute short signals on three coins at once. Beware of risk: $IRYS / $PREDICT / $ZHONGJI🔥
════════════════════
🟢 $IRYS 30-minute short signal
⚠️Technical analysis: ADX as high as 32, clear trend | MACD fell below zero, turning bearish | Moving averages aligned bearishly and pointing down | Volume increased 2.3x
════════════════════
🟢 $PREDICT 30-minute short signal
⚠️Technical analysis: ADX (37) indicates a strong trend; MACD formed a bearish cross below zero, with bears gaining strength; moving averages aligned bearishly and pointing down; KDJ bearish cross, K 19.7 and D 19.8, leaning bearish; volume increased 2.1x
📢Market update: Binance will list Predict (PREDICT) and mark it with a "Seed" tag.
════════════════════
🟢 $ZHONGJI 30-minute short signal
⚠️Technical analysis: Clear ADX trend, MACD bearish cross accelerating the downturn, moving averages just turned bearish, KDJ showing strong bullish momentum, volume surged 7.7x.
════════════════════
🔔 Follow for real-time market movements 🔔
#技术分析 #IRYS #PREDICT #ZHONGJI
📌 When trading, check whether the candlestick pattern confirms the signal.
30-minute short signals on three coins at once. Beware of risk: $IRYS / $PREDICT / $ZHONGJI 🔥
════════════════════
🟢 $IRYS 30-minute short signal
⚠️Technical analysis: ADX as high as 32, clear trend | MACD fell below zero, turning bearish | Moving averages aligned bearishly and pointing down | Volume increased 2.3x
════════════════════
🟢 $PREDICT 30-minute short signal
⚠️Technical analysis: ADX (37) indicates a strong trend; MACD formed a bearish cross below zero, with bears gaining strength; moving averages aligned bearishly and pointing down; KDJ bearish cross, K 19.7 and D 19.8, leaning bearish; volume increased 2.1x
📢Market update: Binance will list Predict (PREDICT) and mark it with a "Seed" tag.
════════════════════
🟢 $ZHONGJI 30-minute short signal
⚠️Technical analysis: Clear ADX trend, MACD bearish cross accelerating the downturn, moving averages just turned bearish, KDJ showing strong bullish momentum, volume surged 7.7x.
════════════════════
🔔 Follow for real-time market movements 🔔
#技术分析 #IRYS #PREDICT #ZHONGJI
📌 When trading, check whether the candlestick pattern confirms the signal.
════════════════════
🟢 $IRYS 30-minute short signal
⚠️Technical analysis: ADX as high as 32, clear trend | MACD fell below zero, turning bearish | Moving averages aligned bearishly and pointing down | Volume increased 2.3x
════════════════════
🟢 $PREDICT 30-minute short signal
⚠️Technical analysis: ADX (37) indicates a strong trend; MACD formed a bearish cross below zero, with bears gaining strength; moving averages aligned bearishly and pointing down; KDJ bearish cross, K 19.7 and D 19.8, leaning bearish; volume increased 2.1x
📢Market update: Binance will list Predict (PREDICT) and mark it with a "Seed" tag.
════════════════════
🟢 $ZHONGJI 30-minute short signal
⚠️Technical analysis: Clear ADX trend, MACD bearish cross accelerating the downturn, moving averages just turned bearish, KDJ showing strong bullish momentum, volume surged 7.7x.
════════════════════
🔔 Follow for real-time market movements 🔔
#技术分析 #IRYS #PREDICT #ZHONGJI
📌 When trading, check whether the candlestick pattern confirms the signal.
14

·
--
🐻 $IRYS sets a new 7-day low at 0.0157, breaking below the previous low of 0.01584.
Buying can't keep up, and support is weak. Use less leverage to stay more composed during the decline.
#IRYS
🐻 $IRYS sets a new 7-day low at 0.0157, breaking below the previous low of 0.01584.
Buying can't keep up, and support is weak. Use less leverage to stay more composed during the decline.
#IRYS
Buying can't keep up, and support is weak. Use less leverage to stay more composed during the decline.
#IRYS
137
·
--
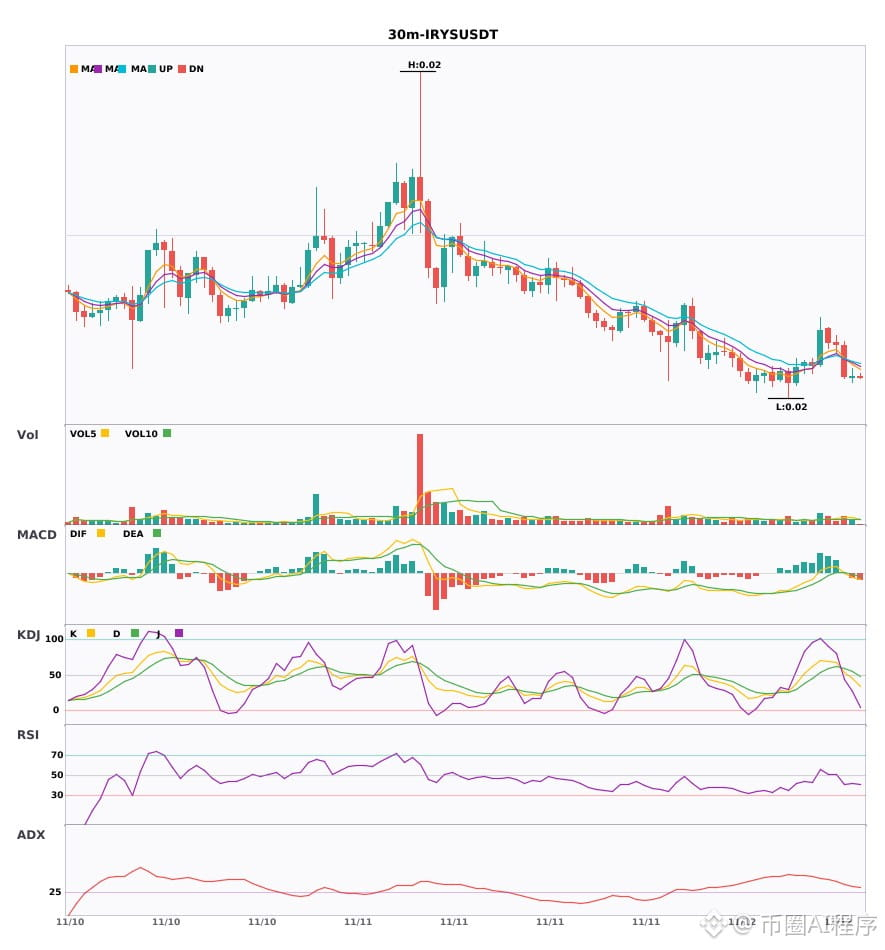
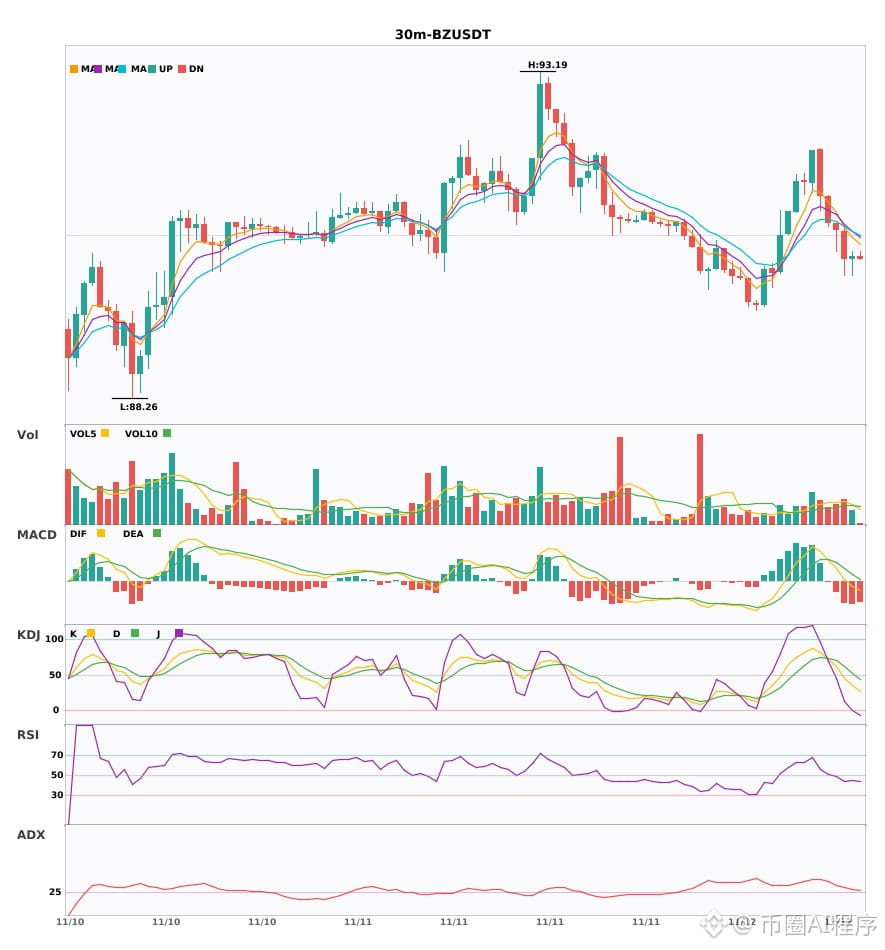
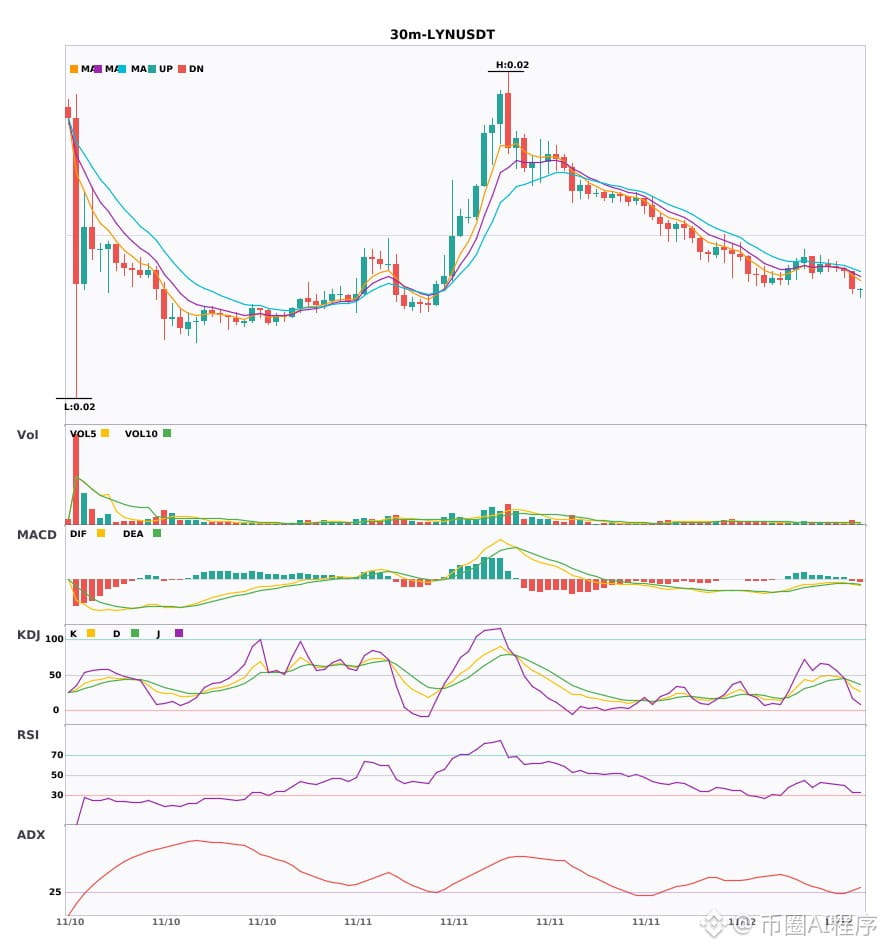
$IRYS / $BZ / $LYN 30-minute bearish signals, 4-hour bearish trend confirmed🔥
════════════════════
🟢 $IRYS 30-minute bearish signal
⚠️Technical analysis: 4-hour bearish confluence confirmed | 30-minute entry: MACD bearish, trend weak, momentum strengthening | EMA5 crosses below EMA8, short-term trend turns bearish | Normal volume (1.4x)
════════════════════
🟢 $BZ 30-minute bearish signal
⚠️Technical analysis: 4-hour bearish confluence confirmed | 30-minute entry: MACD DIF falls below zero, trend turns bearish | EMA5 < EMA8 < EMA13, bearish alignment | Normal volume (1.3x)
════════════════════
🟢 $LYN 30-minute bearish signal
⚠️Technical analysis: 4-hour bearish confluence confirmed | 30-minute entry: MACD bearish crossover below zero, bearish momentum accelerating | EMA5 < EMA8 < EMA13, bearish alignment | KDJ bearish crossover, short-term outlook bearish (K: 32.8, D: 40.6) | Volume increases (2.0x)
════════════════════
🔔 Follow for first-hand market movement alerts 🔔
#多周期共振 #IRYS #BZ #LYN
📌 When trading, pay attention to whether the candlestick pattern is in line
$IRYS / $BZ / $LYN 30-minute bearish signals, 4-hour bearish trend confirmed🔥
════════════════════
🟢 $IRYS 30-minute bearish signal
⚠️Technical analysis: 4-hour bearish confluence confirmed | 30-minute entry: MACD bearish, trend weak, momentum strengthening | EMA5 crosses below EMA8, short-term trend turns bearish | Normal volume (1.4x)
════════════════════
🟢 $BZ 30-minute bearish signal
⚠️Technical analysis: 4-hour bearish confluence confirmed | 30-minute entry: MACD DIF falls below zero, trend turns bearish | EMA5 < EMA8 < EMA13, bearish alignment | Normal volume (1.3x)
════════════════════
🟢 $LYN 30-minute bearish signal
⚠️Technical analysis: 4-hour bearish confluence confirmed | 30-minute entry: MACD bearish crossover below zero, bearish momentum accelerating | EMA5 < EMA8 < EMA13, bearish alignment | KDJ bearish crossover, short-term outlook bearish (K: 32.8, D: 40.6) | Volume increases (2.0x)
════════════════════
🔔 Follow for first-hand market movement alerts 🔔
#多周期共振 #IRYS #BZ #LYN
📌 When trading, pay attention to whether the candlestick pattern is in line
════════════════════
🟢 $IRYS 30-minute bearish signal
⚠️Technical analysis: 4-hour bearish confluence confirmed | 30-minute entry: MACD bearish, trend weak, momentum strengthening | EMA5 crosses below EMA8, short-term trend turns bearish | Normal volume (1.4x)
════════════════════
🟢 $BZ 30-minute bearish signal
⚠️Technical analysis: 4-hour bearish confluence confirmed | 30-minute entry: MACD DIF falls below zero, trend turns bearish | EMA5 < EMA8 < EMA13, bearish alignment | Normal volume (1.3x)
════════════════════
🟢 $LYN 30-minute bearish signal
⚠️Technical analysis: 4-hour bearish confluence confirmed | 30-minute entry: MACD bearish crossover below zero, bearish momentum accelerating | EMA5 < EMA8 < EMA13, bearish alignment | KDJ bearish crossover, short-term outlook bearish (K: 32.8, D: 40.6) | Volume increases (2.0x)
════════════════════
🔔 Follow for first-hand market movement alerts 🔔
#多周期共振 #IRYS #BZ #LYN
📌 When trading, pay attention to whether the candlestick pattern is in line
9
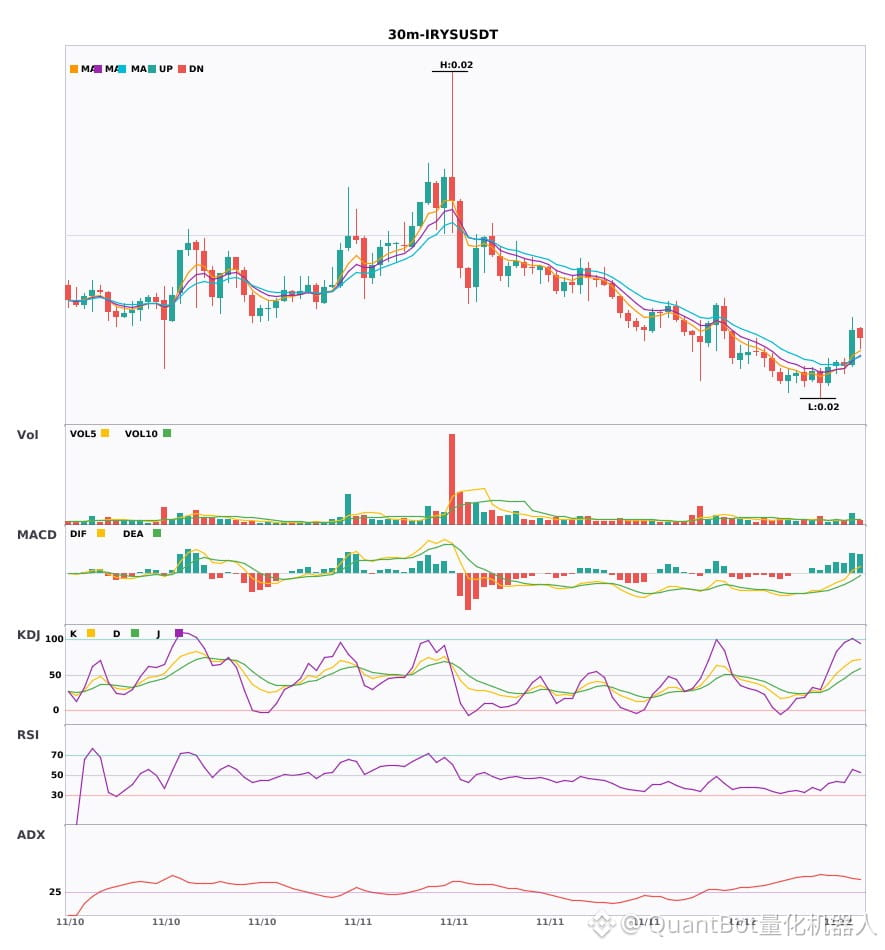
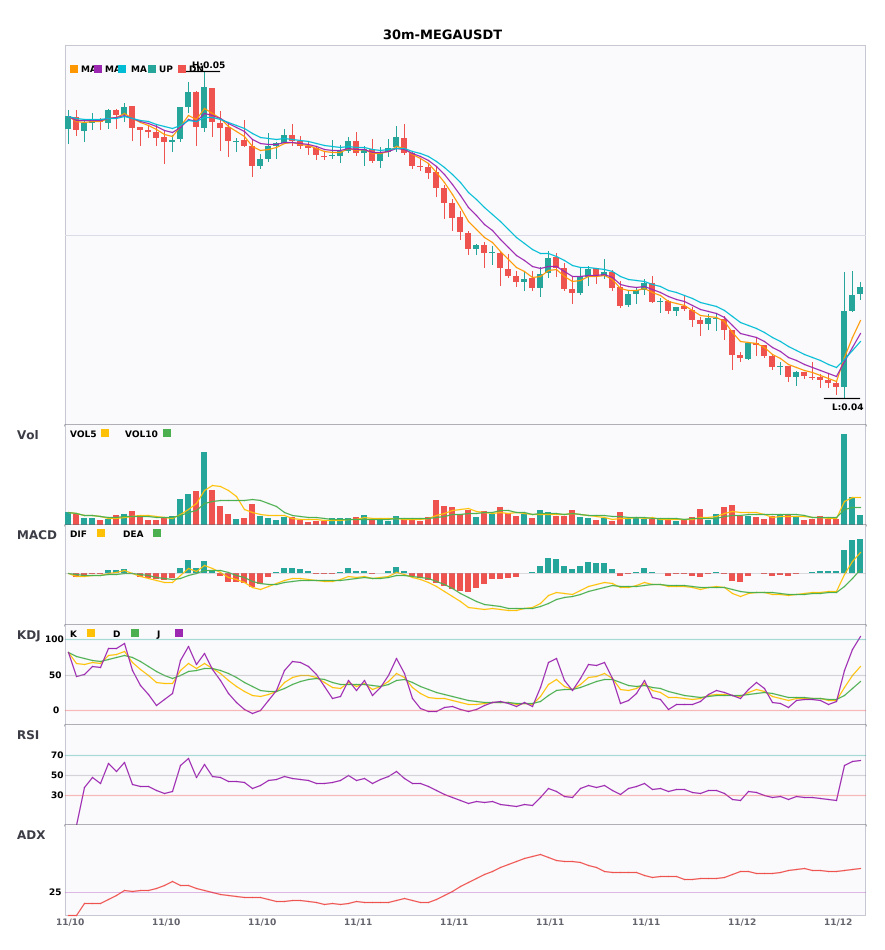
$IRYS / $MEGA 30-minute timeframe shows a bullish bias, with a short-term confluence opportunity
📈 $IRYS | 30-minute bullish signal
━━━━━━━━━━━━━━━━━━
Technical analysis: ADX(42) indicates a clear trending market | MACD DIF breaks above the zero line, signaling a bullish trend reversal | EMA5 crosses above EMA8, signaling a short-term bullish trend | KDJ is strong, with bulls in control (K: 69.6, D: 53.7) | Volume expands (2.0x)
Price change: 1.7700%
📈 $MEGA | 30-minute bullish signal
━━━━━━━━━━━━━━━━━━
Technical analysis: ADX(52) indicates a very strong trend (watch for an overheated pullback) | MACD DIF breaks above the zero line, signaling a bullish trend reversal | EMA5 > EMA8 > EMA13, a bullish alignment | KDJ is weak, with bears in control (K: 49.0, D: 30.7) | Volume surges (5.8x)
Price change: 1.1000%
━━━━━━━━━━━━━━━━━━
#技术分析 #IRYS #MEGA
📌 The above content is for reference only and does not constitute investment advice
$IRYS / $MEGA 30-minute timeframe shows a bullish bias, with a short-term confluence opportunity
📈 $IRYS | 30-minute bullish signal
━━━━━━━━━━━━━━━━━━
Technical analysis: ADX(42) indicates a clear trending market | MACD DIF breaks above the zero line, signaling a bullish trend reversal | EMA5 crosses above EMA8, signaling a short-term bullish trend | KDJ is strong, with bulls in control (K: 69.6, D: 53.7) | Volume expands (2.0x)
Price change: 1.7700%
📈 $MEGA | 30-minute bullish signal
━━━━━━━━━━━━━━━━━━
Technical analysis: ADX(52) indicates a very strong trend (watch for an overheated pullback) | MACD DIF breaks above the zero line, signaling a bullish trend reversal | EMA5 > EMA8 > EMA13, a bullish alignment | KDJ is weak, with bears in control (K: 49.0, D: 30.7) | Volume surges (5.8x)
Price change: 1.1000%
━━━━━━━━━━━━━━━━━━
#技术分析 #IRYS #MEGA
📌 The above content is for reference only and does not constitute investment advice
📈 $IRYS | 30-minute bullish signal
━━━━━━━━━━━━━━━━━━
Technical analysis: ADX(42) indicates a clear trending market | MACD DIF breaks above the zero line, signaling a bullish trend reversal | EMA5 crosses above EMA8, signaling a short-term bullish trend | KDJ is strong, with bulls in control (K: 69.6, D: 53.7) | Volume expands (2.0x)
Price change: 1.7700%
📈 $MEGA | 30-minute bullish signal
━━━━━━━━━━━━━━━━━━
Technical analysis: ADX(52) indicates a very strong trend (watch for an overheated pullback) | MACD DIF breaks above the zero line, signaling a bullish trend reversal | EMA5 > EMA8 > EMA13, a bullish alignment | KDJ is weak, with bears in control (K: 49.0, D: 30.7) | Volume surges (5.8x)
Price change: 1.1000%
━━━━━━━━━━━━━━━━━━
#技术分析 #IRYS #MEGA
📌 The above content is for reference only and does not constitute investment advice
27
·
--
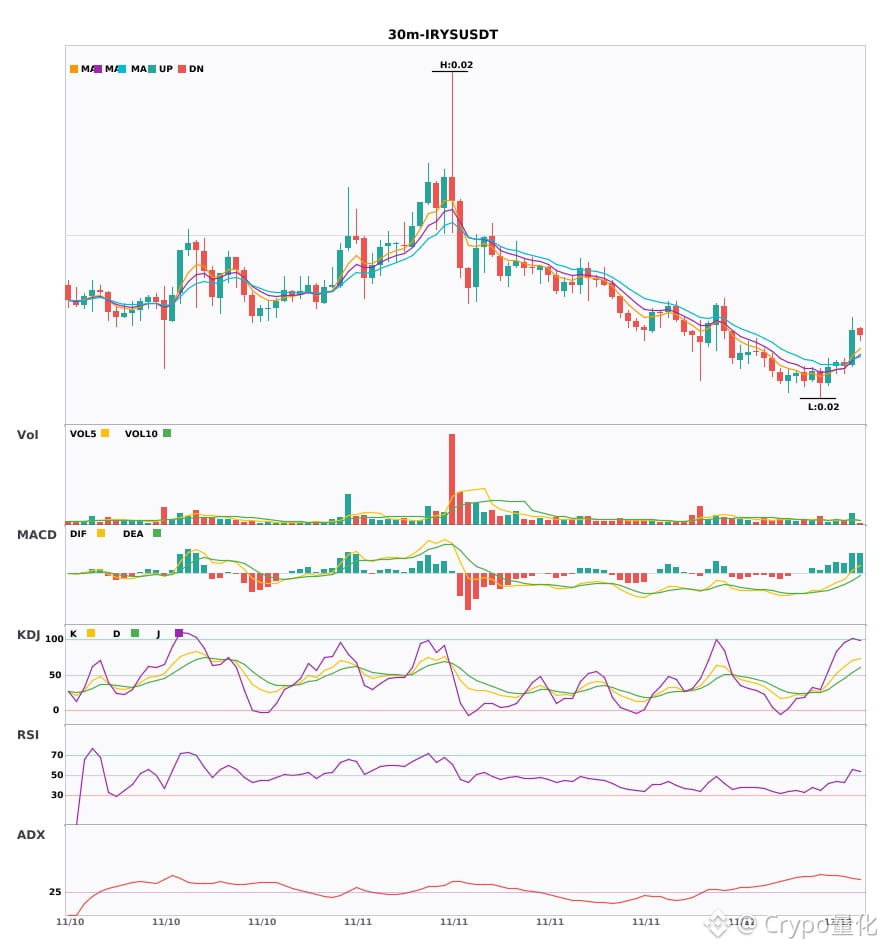
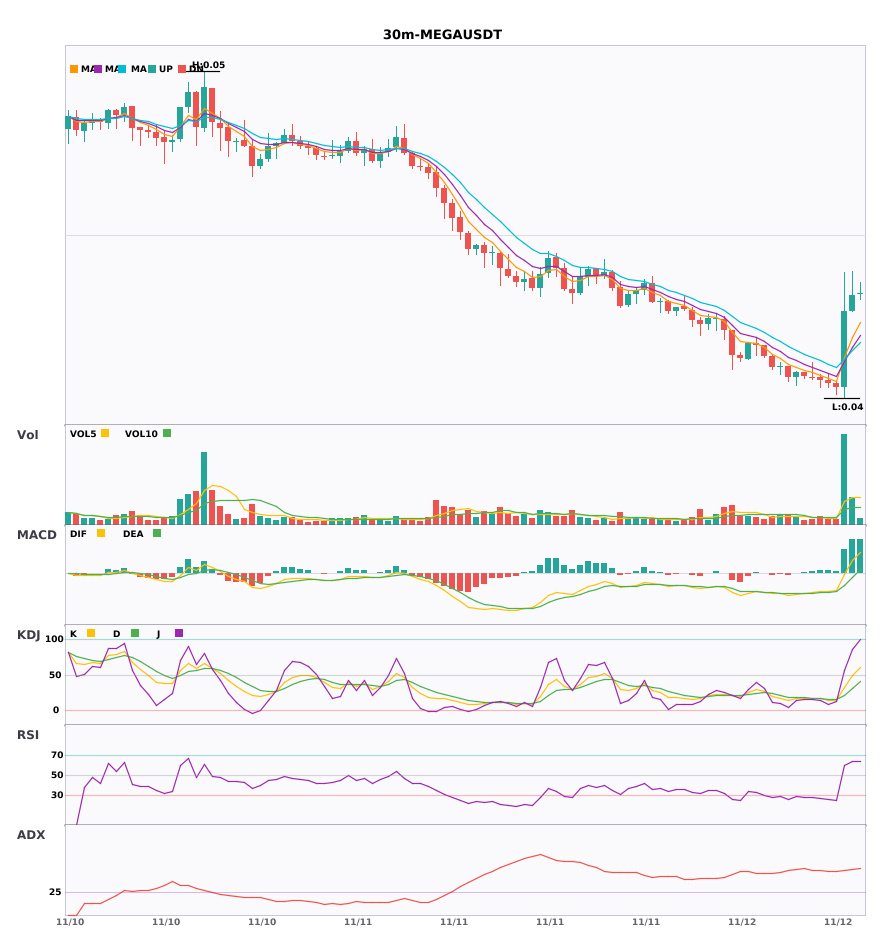
Two bullish signals on the 30-minute timeframe appeared at the same time: $IRYS / $MEGA🔥
════════════════════
🔴 $IRYS 30-minute bullish signal
⚠️Technical analysis: ADX(42): clear trending market | MACD DIF breaks above zero, trend turns bullish | EMA5 crosses above EMA8, short-term trend turns bullish | KDJ is strong, bulls have the upper hand (K: 69.6, D: 53.7) | Volume increases (2.0x)
════════════════════
🔴 $MEGA 30-minute bullish signal
⚠️Technical analysis: ADX(52): very strong trend (watch out for an overheated pullback) | MACD DIF breaks above zero, trend turns bullish | EMA5 > EMA8 > EMA13, bullish alignment | KDJ is weak, bears have the upper hand (K: 49.0, D: 30.7) | Volume surges (5.8x)
════════════════════
🔔 Follow for real-time market updates 🔔
#技术分析 #IRYS #MEGA
📌 When trading, pay attention to whether the candlestick patterns confirm the signal
Two bullish signals on the 30-minute timeframe appeared at the same time: $IRYS / $MEGA 🔥
════════════════════
🔴 $IRYS 30-minute bullish signal
⚠️Technical analysis: ADX(42): clear trending market | MACD DIF breaks above zero, trend turns bullish | EMA5 crosses above EMA8, short-term trend turns bullish | KDJ is strong, bulls have the upper hand (K: 69.6, D: 53.7) | Volume increases (2.0x)
════════════════════
🔴 $MEGA 30-minute bullish signal
⚠️Technical analysis: ADX(52): very strong trend (watch out for an overheated pullback) | MACD DIF breaks above zero, trend turns bullish | EMA5 > EMA8 > EMA13, bullish alignment | KDJ is weak, bears have the upper hand (K: 49.0, D: 30.7) | Volume surges (5.8x)
════════════════════
🔔 Follow for real-time market updates 🔔
#技术分析 #IRYS #MEGA
📌 When trading, pay attention to whether the candlestick patterns confirm the signal
════════════════════
🔴 $IRYS 30-minute bullish signal
⚠️Technical analysis: ADX(42): clear trending market | MACD DIF breaks above zero, trend turns bullish | EMA5 crosses above EMA8, short-term trend turns bullish | KDJ is strong, bulls have the upper hand (K: 69.6, D: 53.7) | Volume increases (2.0x)
════════════════════
🔴 $MEGA 30-minute bullish signal
⚠️Technical analysis: ADX(52): very strong trend (watch out for an overheated pullback) | MACD DIF breaks above zero, trend turns bullish | EMA5 > EMA8 > EMA13, bullish alignment | KDJ is weak, bears have the upper hand (K: 49.0, D: 30.7) | Volume surges (5.8x)
════════════════════
🔔 Follow for real-time market updates 🔔
#技术分析 #IRYS #MEGA
📌 When trading, pay attention to whether the candlestick patterns confirm the signal
7

·
--
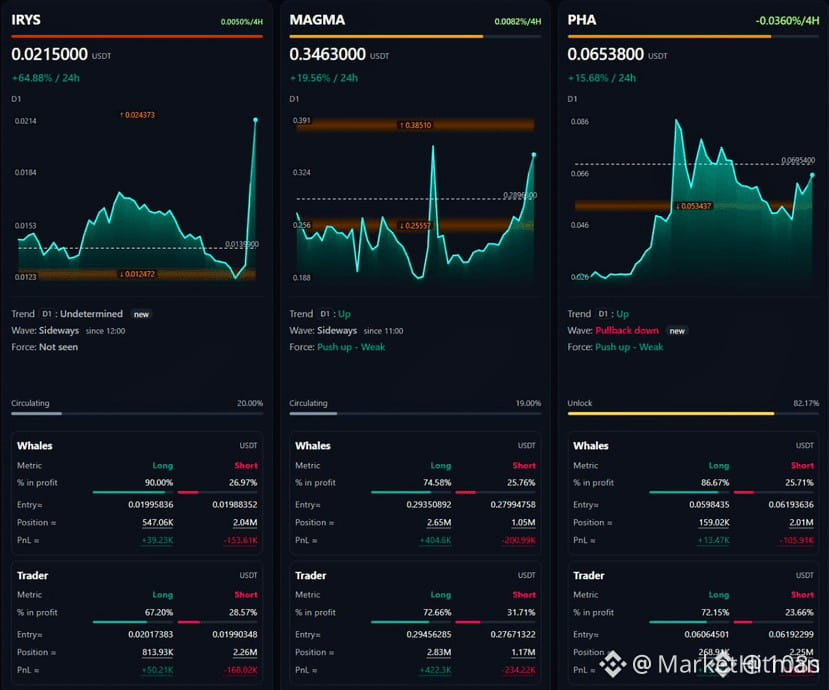
🚀 $IRYS IS SLICING THROUGH RESISTANCE WITH UNSTOPPABLE MOMENTUM ⚡
Sellers are completely checked out as aggressive bids flood the order book and clear every overhead barrier. 📊 This is pure momentum expansion where waiting for a shallow retrace is the smartest play before the next leg expands. ⚡
Smart positioning right now means staying patient for that micro-dip instead of chasing green candles at the absolute highs. 💡 Are you scaling in on the pullback or waiting for confirmation above the high timeframe level? 👇
⚠️ Not financial advice. Always manage your risk. 🛡️
🏷️ #IRYS #LongSetup #Momentum #Breakout #Crypto
🔥 💎
🚀 $IRYS IS SLICING THROUGH RESISTANCE WITH UNSTOPPABLE MOMENTUM ⚡
Sellers are completely checked out as aggressive bids flood the order book and clear every overhead barrier. 📊 This is pure momentum expansion where waiting for a shallow retrace is the smartest play before the next leg expands. ⚡
Smart positioning right now means staying patient for that micro-dip instead of chasing green candles at the absolute highs. 💡 Are you scaling in on the pullback or waiting for confirmation above the high timeframe level? 👇
⚠️ Not financial advice. Always manage your risk. 🛡️
🏷️ #IRYS #LongSetup #Momentum #Breakout #Crypto
🔥 💎
Sellers are completely checked out as aggressive bids flood the order book and clear every overhead barrier. 📊 This is pure momentum expansion where waiting for a shallow retrace is the smartest play before the next leg expands. ⚡
Smart positioning right now means staying patient for that micro-dip instead of chasing green candles at the absolute highs. 💡 Are you scaling in on the pullback or waiting for confirmation above the high timeframe level? 👇
⚠️ Not financial advice. Always manage your risk. 🛡️
🏷️ #IRYS #LongSetup #Momentum #Breakout #Crypto
🔥 💎
48
Log in to explore more content
Join global crypto users on Binance Square
⚡️ Get latest and useful information about crypto.
💬 Trusted by the world’s largest crypto exchange.
👍 Discover real insights from verified creators.
Email / Phone number
Trending Topics
1
#USPPIMissMayEaseBTCPressure
31,844 views
624 Discussing
2
#BitcoinCoreDisclosesTorTrafficVulnerability
12,167 views
308 Discussing
3
#WhatWillDriveCryptoandStocks’NextRebound?
137,030 views
1,522 Discussing
4
#BitcoinBreaksBelow200WeekMovingAverage
41,097 views
446 Discussing
5
#SpaceXTeslaMergerTalksWouldCombine30220BTC
13,765 views
234 Discussing
6
#Anthropic’s6xIPODemandSignalsPotentialRecordRaise
46,205 views
679 Discussing
7
#USCryptoETFsLose$1.48BInFiveDays
2,312 views
41 Discussing
8
#KoreaDigitalAssetBasicActFinalDraftExpectedEarlyJanuary
3,594 views
20 Discussing
9
#RippleRLUSDMarketCapSurpassesPayPalPYUSD
8,729 views
124 Discussing
10
#JaneStreetNearlyOctuplesFidelityBitcoinETFHoldings
18,961 views
234 Discussing