
#cxmt
cxmt
100,247 views
586 Discussing
Hot
Latest

·
--
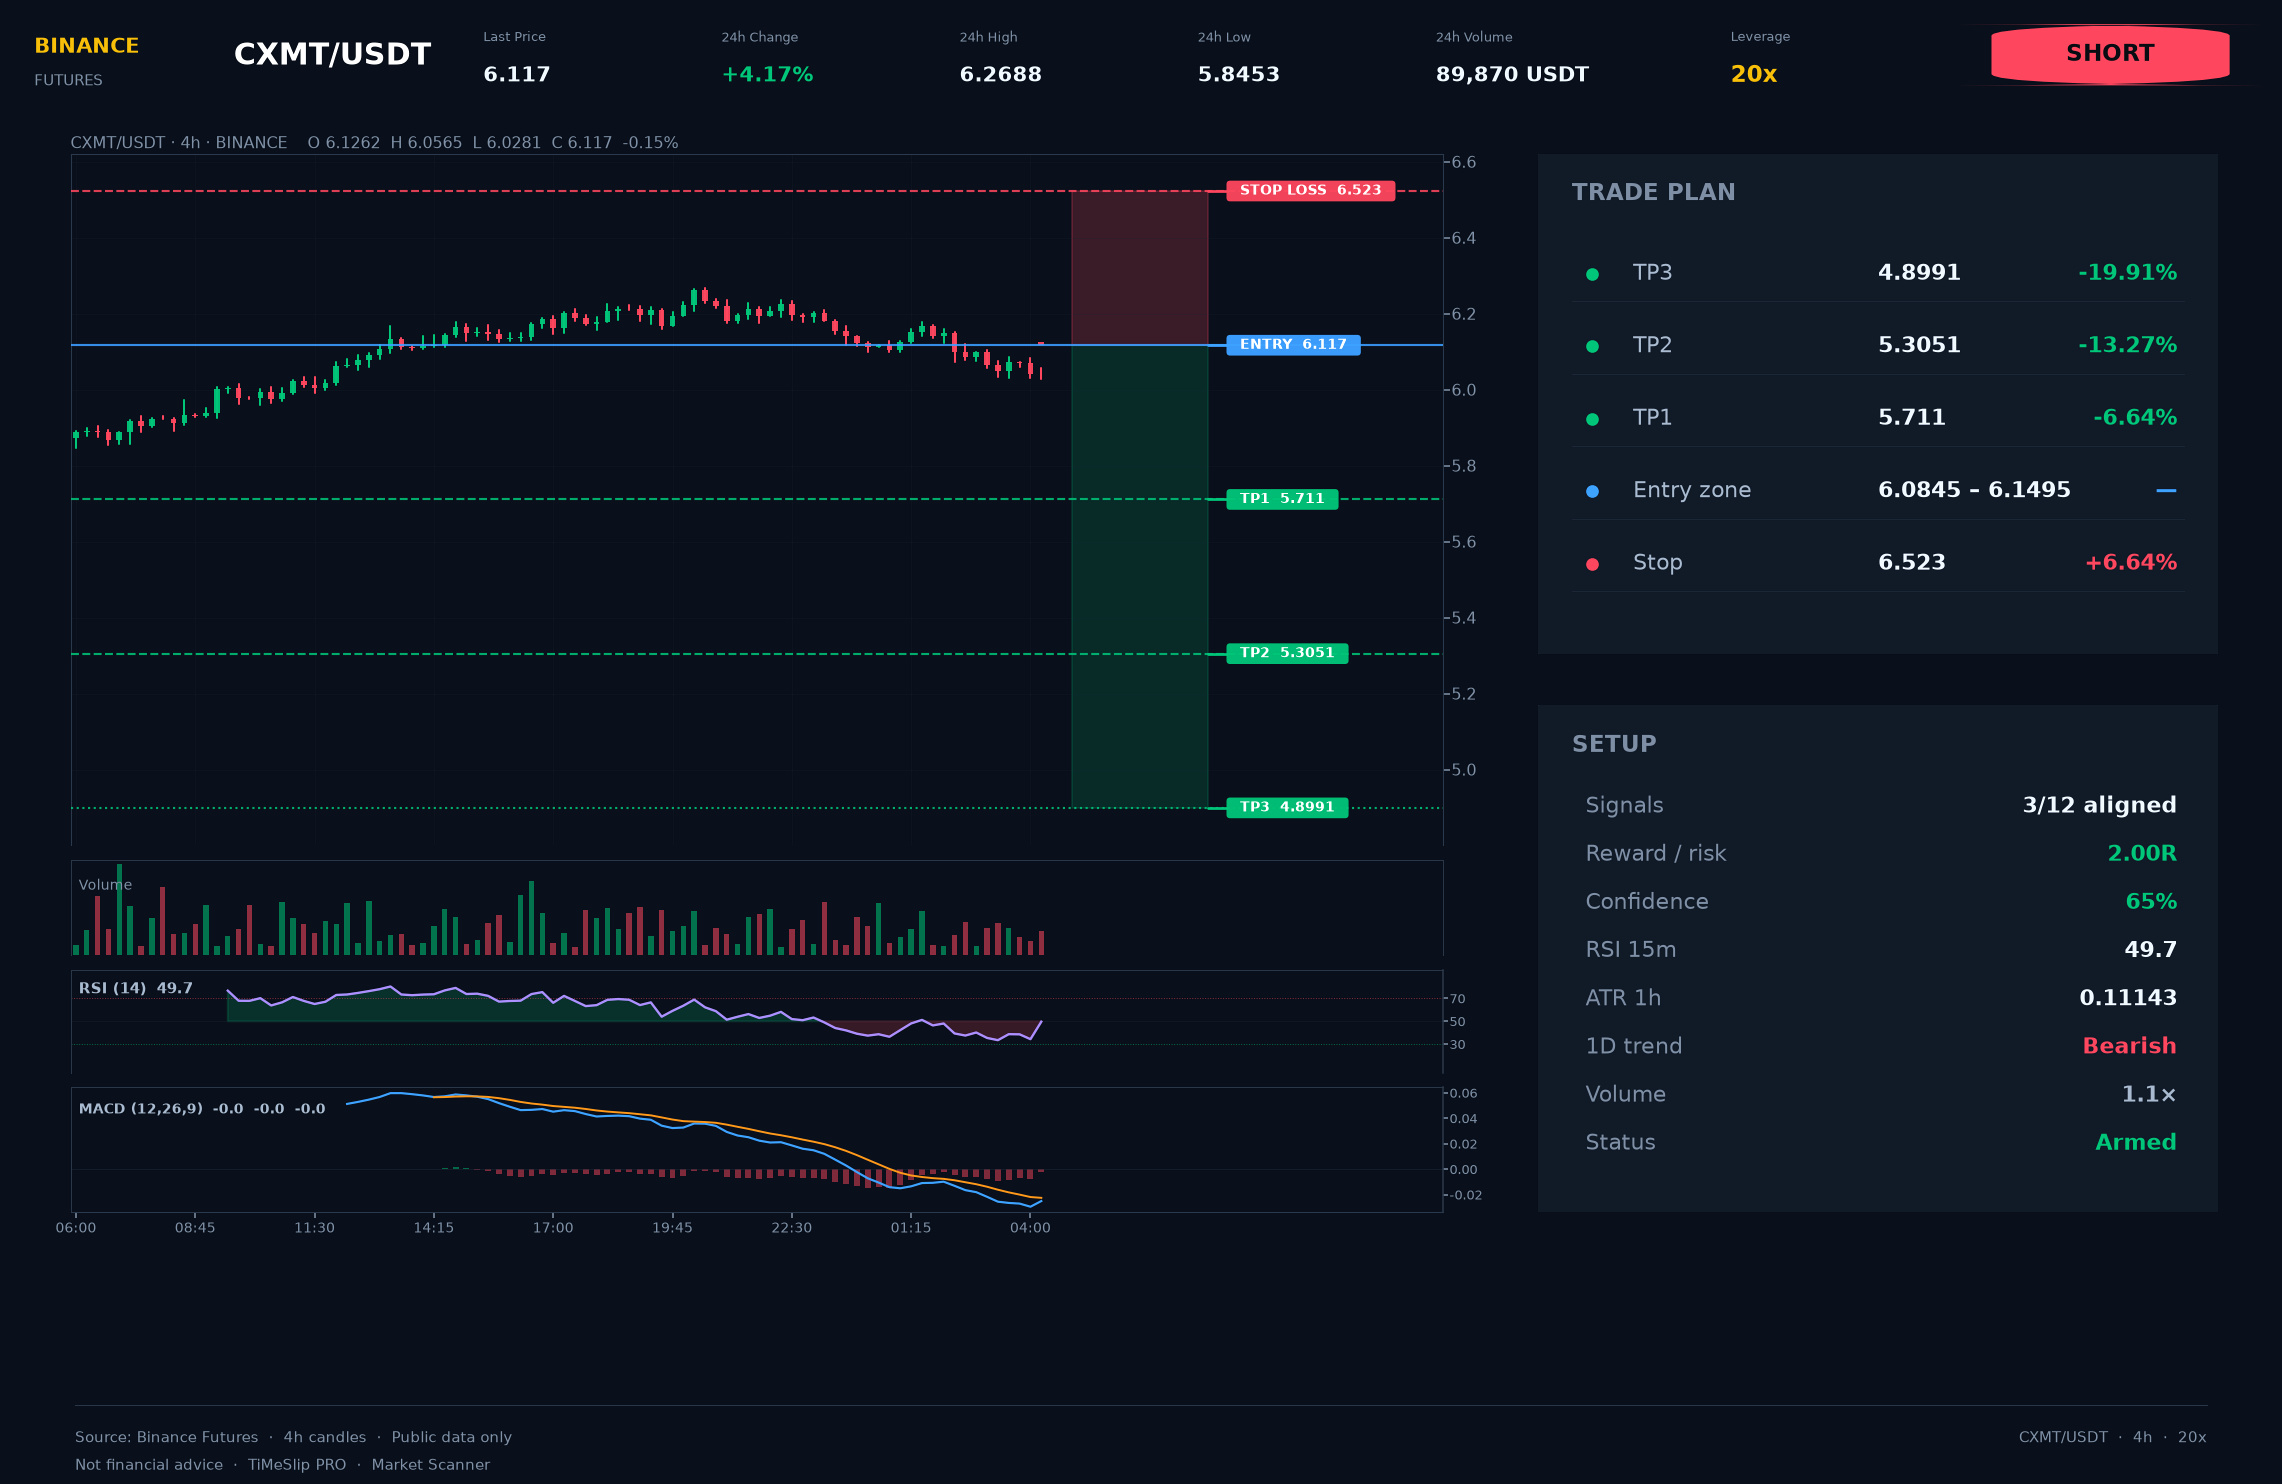
$CXMT 🔴 (SELL)
ENTRY: 6.1170
STOP: 6.5230
• TP1: 5.7110
• TP2: 5.3051
• TP3: 4.8991
🎯 Golden rule: take TP1, then move stop to break-even to protect capital.
Sellers on CXMT got a technical chance. Judge by level hold, not the first reaction.
Sellers pushed through 6.2334 and left a confirmed retest. Risk management: 6.64%. Alignment: 8h, 12h, 1d. ATR(14): 0.11143.
Pattern quality: 65/100. Stay disciplined on position sizing. ⚠️ Risk to stop is high (6.64%): reduce position size.
Volume within normal range (1.1×).
📚 Order Flow: order book imbalance +7.0%; aggressive buys 73.0%. Based on this data, flow does not provide enough confirmation.
🚀 Join the trader community — more actionable ideas ahead!
Material is for educational purposes. Author is not responsible for your trading results.
#CXMT #CXMTNews $CXMT 👈 Tap to trade
$CXMT 🔴 (SELL)
ENTRY: 6.1170
STOP: 6.5230
• TP1: 5.7110
• TP2: 5.3051
• TP3: 4.8991
🎯 Golden rule: take TP1, then move stop to break-even to protect capital.
Sellers on CXMT got a technical chance. Judge by level hold, not the first reaction.
Sellers pushed through 6.2334 and left a confirmed retest. Risk management: 6.64%. Alignment: 8h, 12h, 1d. ATR(14): 0.11143.
Pattern quality: 65/100. Stay disciplined on position sizing. ⚠️ Risk to stop is high (6.64%): reduce position size.
Volume within normal range (1.1×).
📚 Order Flow: order book imbalance +7.0%; aggressive buys 73.0%. Based on this data, flow does not provide enough confirmation.
🚀 Join the trader community — more actionable ideas ahead!
Material is for educational purposes. Author is not responsible for your trading results.
#CXMT #CXMTNews $CXMT 👈 Tap to trade
ENTRY: 6.1170
STOP: 6.5230
• TP1: 5.7110
• TP2: 5.3051
• TP3: 4.8991
🎯 Golden rule: take TP1, then move stop to break-even to protect capital.
Sellers on CXMT got a technical chance. Judge by level hold, not the first reaction.
Sellers pushed through 6.2334 and left a confirmed retest. Risk management: 6.64%. Alignment: 8h, 12h, 1d. ATR(14): 0.11143.
Pattern quality: 65/100. Stay disciplined on position sizing. ⚠️ Risk to stop is high (6.64%): reduce position size.
Volume within normal range (1.1×).
📚 Order Flow: order book imbalance +7.0%; aggressive buys 73.0%. Based on this data, flow does not provide enough confirmation.
🚀 Join the trader community — more actionable ideas ahead!
Material is for educational purposes. Author is not responsible for your trading results.
#CXMT #CXMTNews $CXMT 👈 Tap to trade
394

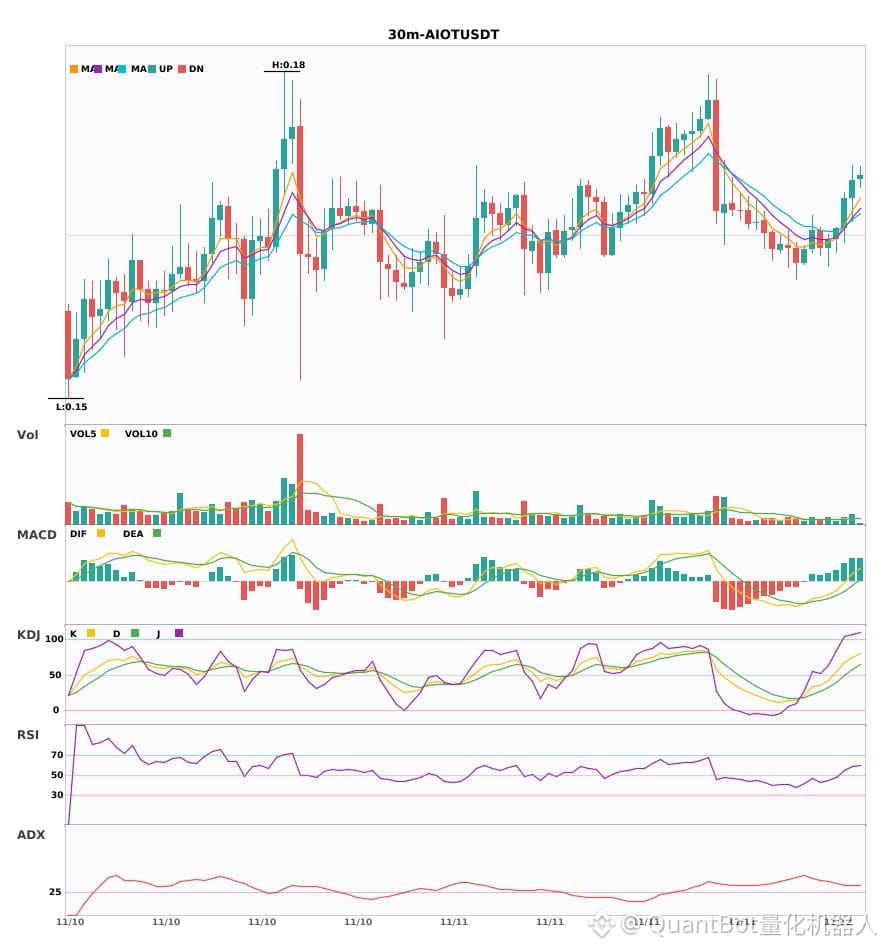
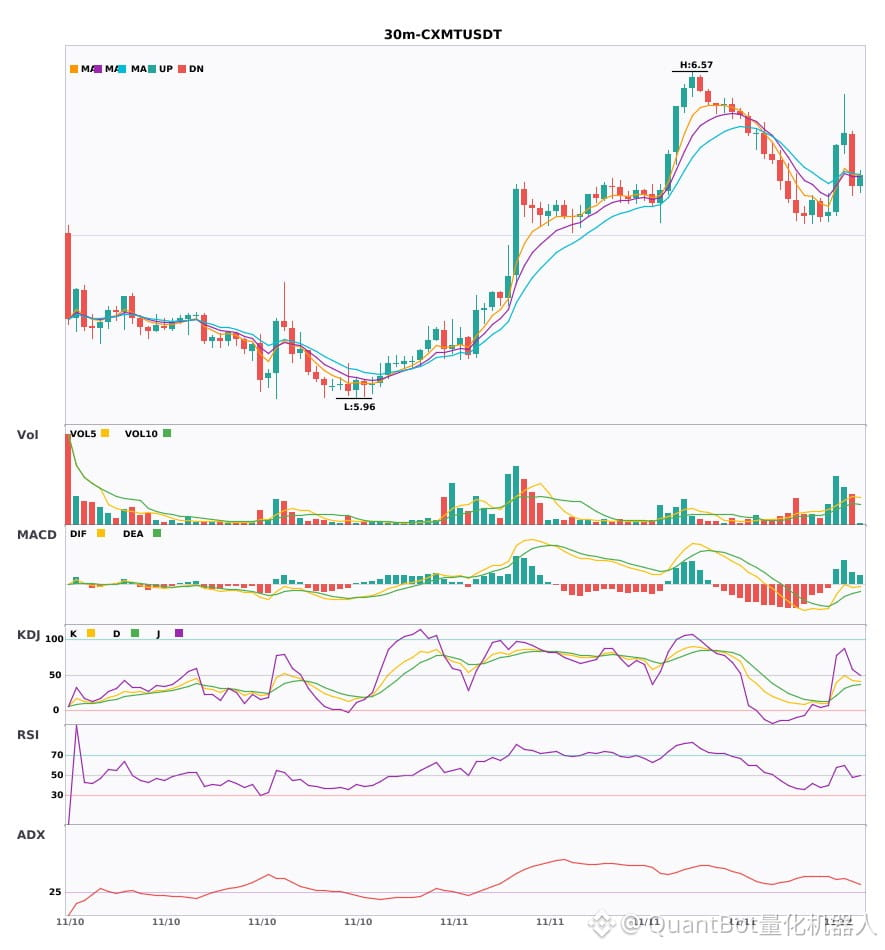
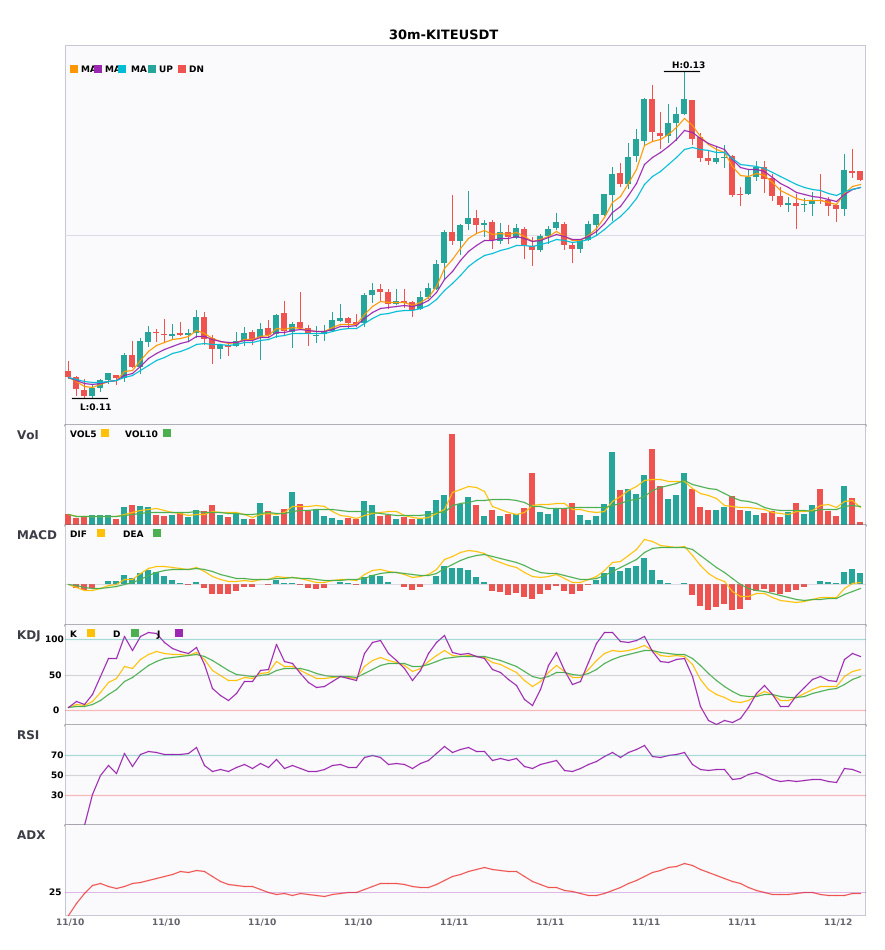
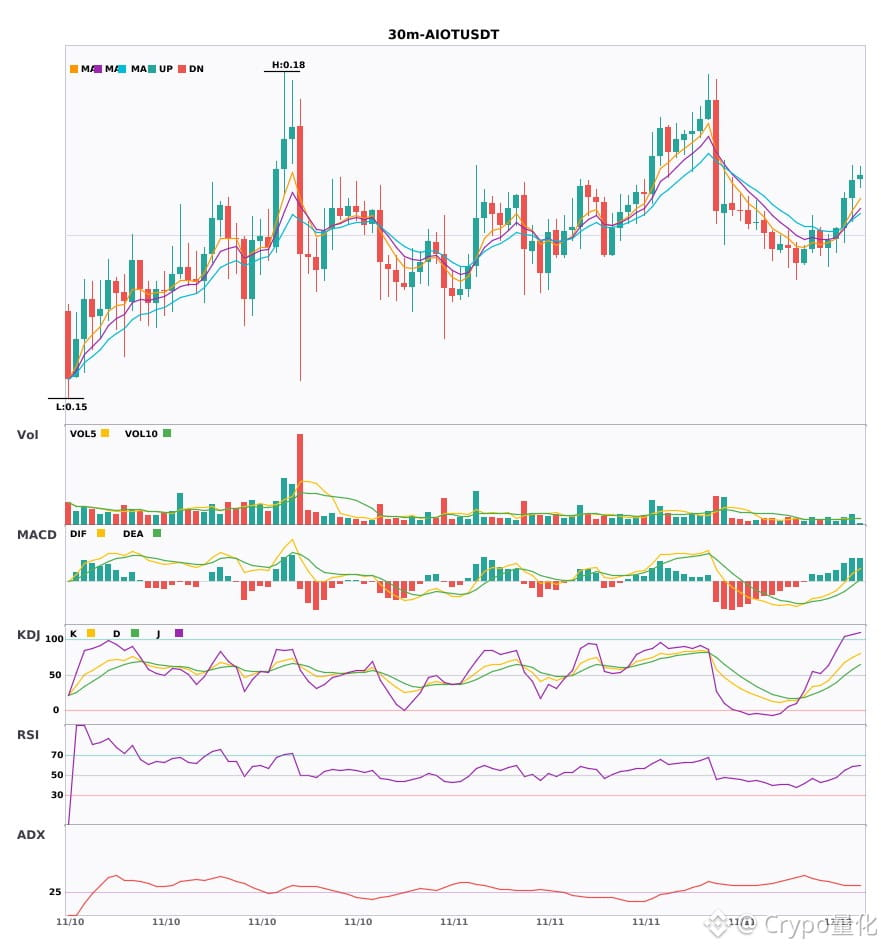
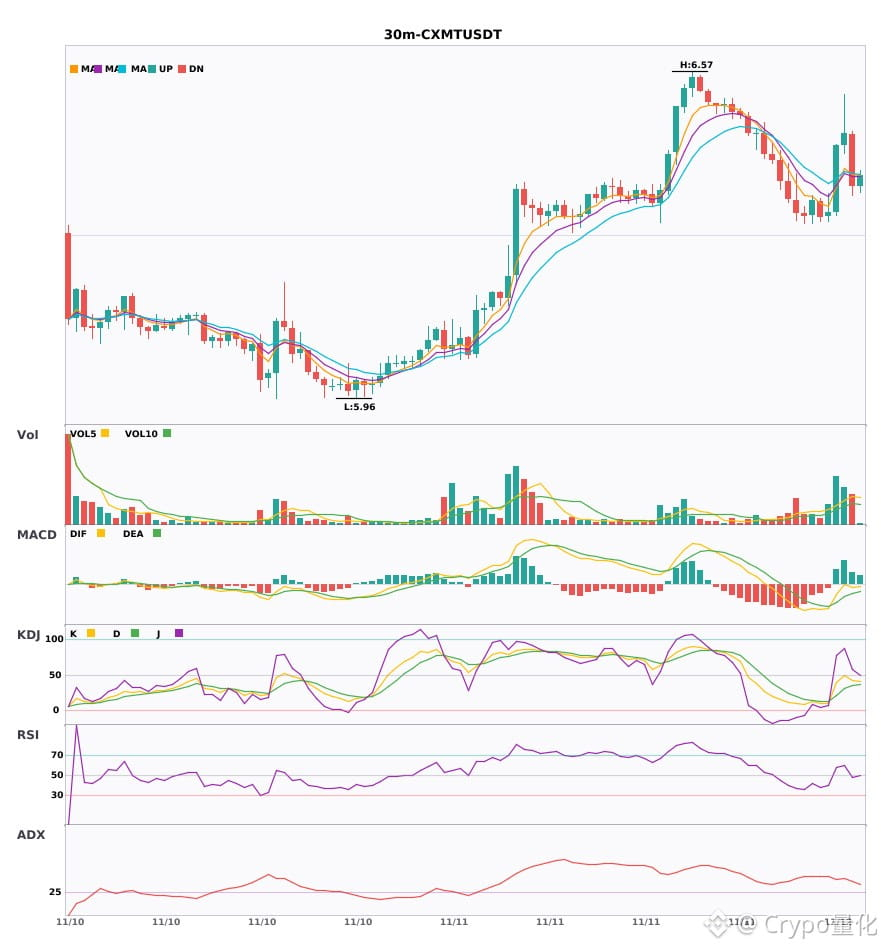
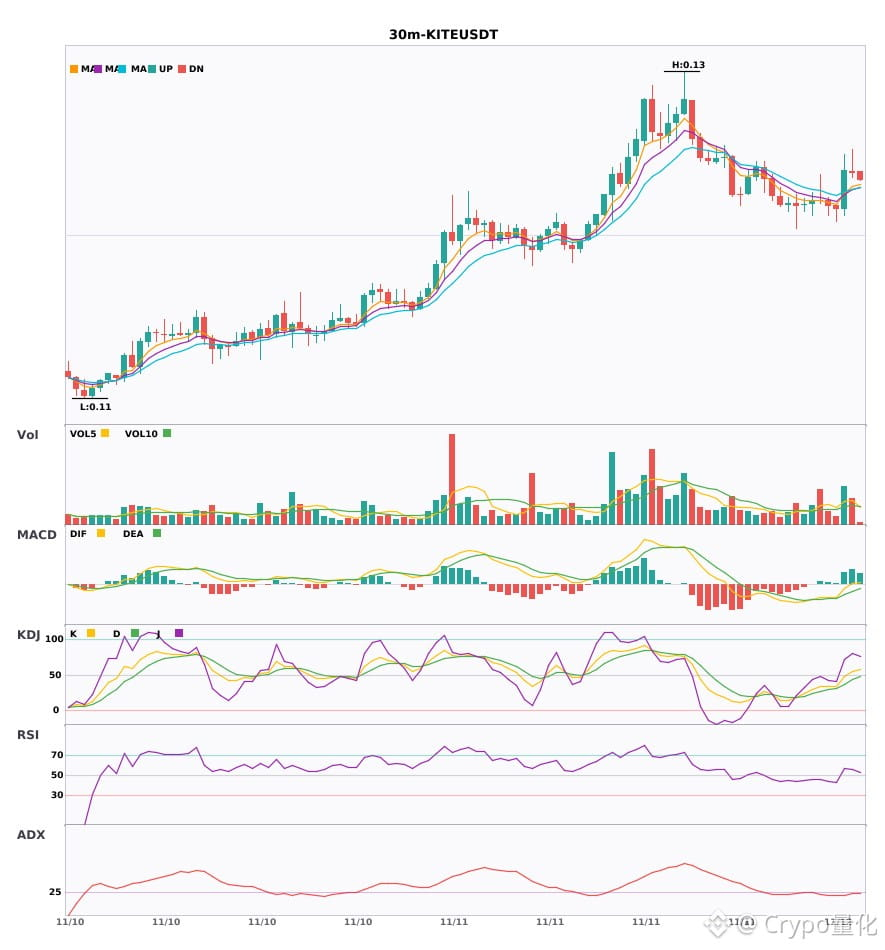
$AIOT / $CXMT / $KITE 30-minute technical indicators are strengthening in sync. Which has greater breakout potential?
📈 $AIOT | 30-minute bullish signal
━━━━━━━━━━━━━━━━━━
Technical analysis: ADX(35) Clear trending market | MACD DIF crosses above zero, trend turns bullish | EMA5 > EMA8 > EMA13, bullish alignment | KDJ running strongly, bulls have the edge (K=74.1 D=57.6) | Volume expands (1.7x)
Price change: 0.7000%
📈 $CXMT | 30-minute bullish signal
━━━━━━━━━━━━━━━━━━
Technical analysis: ADX(45) Clear trending market | MACD DIF crosses above zero, trend turns bullish | EMA5 crosses above EMA8, short-term trend turns bullish | KDJ running weakly, bears have the edge (K=49.7 D=30.9) | Volume surges (3.2x)
Price change: 0.3300%
📈 $KITE | 30-minute bullish signal
━━━━━━━━━━━━━━━━━━
Technical analysis: ADX(26) Trend is forming; an opportunity to participate | MACD DIF crosses above zero, trend turns bullish | Moving averages are converging, gathering momentum and nearing a directional move | Volume expands (2.1x)
Price change: -0.0900%
━━━━━━━━━━━━━━━━━━
#技术分析 #AIOT #CXMT #KITE
📌 The above content is for reference only and does not constitute investment advice
$AIOT / $CXMT / $KITE 30-minute technical indicators are strengthening in sync. Which has greater breakout potential?
📈 $AIOT | 30-minute bullish signal
━━━━━━━━━━━━━━━━━━
Technical analysis: ADX(35) Clear trending market | MACD DIF crosses above zero, trend turns bullish | EMA5 > EMA8 > EMA13, bullish alignment | KDJ running strongly, bulls have the edge (K=74.1 D=57.6) | Volume expands (1.7x)
Price change: 0.7000%
📈 $CXMT | 30-minute bullish signal
━━━━━━━━━━━━━━━━━━
Technical analysis: ADX(45) Clear trending market | MACD DIF crosses above zero, trend turns bullish | EMA5 crosses above EMA8, short-term trend turns bullish | KDJ running weakly, bears have the edge (K=49.7 D=30.9) | Volume surges (3.2x)
Price change: 0.3300%
📈 $KITE | 30-minute bullish signal
━━━━━━━━━━━━━━━━━━
Technical analysis: ADX(26) Trend is forming; an opportunity to participate | MACD DIF crosses above zero, trend turns bullish | Moving averages are converging, gathering momentum and nearing a directional move | Volume expands (2.1x)
Price change: -0.0900%
━━━━━━━━━━━━━━━━━━
#技术分析 #AIOT #CXMT #KITE
📌 The above content is for reference only and does not constitute investment advice
📈 $AIOT | 30-minute bullish signal
━━━━━━━━━━━━━━━━━━
Technical analysis: ADX(35) Clear trending market | MACD DIF crosses above zero, trend turns bullish | EMA5 > EMA8 > EMA13, bullish alignment | KDJ running strongly, bulls have the edge (K=74.1 D=57.6) | Volume expands (1.7x)
Price change: 0.7000%
📈 $CXMT | 30-minute bullish signal
━━━━━━━━━━━━━━━━━━
Technical analysis: ADX(45) Clear trending market | MACD DIF crosses above zero, trend turns bullish | EMA5 crosses above EMA8, short-term trend turns bullish | KDJ running weakly, bears have the edge (K=49.7 D=30.9) | Volume surges (3.2x)
Price change: 0.3300%
📈 $KITE | 30-minute bullish signal
━━━━━━━━━━━━━━━━━━
Technical analysis: ADX(26) Trend is forming; an opportunity to participate | MACD DIF crosses above zero, trend turns bullish | Moving averages are converging, gathering momentum and nearing a directional move | Volume expands (2.1x)
Price change: -0.0900%
━━━━━━━━━━━━━━━━━━
#技术分析 #AIOT #CXMT #KITE
📌 The above content is for reference only and does not constitute investment advice
12

·
--
Three bullish signals on the 30-minute timeframe appeared simultaneously: $AIOT / $CXMT / $KITE🔥
════════════════════
🔴 $AIOT 30-minute bullish signal
⚠️Technical analysis: ADX(35) indicates a clear trend | MACD DIF breaks above the zero line, signaling a bullish trend reversal | EMA5 > EMA8 > EMA13, bullish alignment | KDJ is strong, with bulls in control (K: 74.1, D: 57.6) | Volume increased (1.7x)
════════════════════
🔴 $CXMT 30-minute bullish signal
⚠️Technical analysis: ADX(45) indicates a clear trend | MACD DIF breaks above the zero line, signaling a bullish trend reversal | EMA5 crosses above EMA8, turning bullish in the short term | KDJ is weak, with bears in control (K: 49.7, D: 30.9) | Volume surged (3.2x)
════════════════════
🔴 $KITE 30-minute bullish signal
⚠️Technical analysis: ADX(26) indicates a trend is forming and may be actionable | MACD DIF breaks above the zero line, signaling a bullish trend reversal | Moving averages are converging, building momentum before a direction is chosen | Volume increased (2.1x)
════════════════════
🔔 Follow for the latest market-moving updates 🔔
#技术分析 #AIOT #CXMT #KITE
📌 When trading, watch for whether the candlestick pattern confirms the signal
Three bullish signals on the 30-minute timeframe appeared simultaneously: $AIOT / $CXMT / $KITE 🔥
════════════════════
🔴 $AIOT 30-minute bullish signal
⚠️Technical analysis: ADX(35) indicates a clear trend | MACD DIF breaks above the zero line, signaling a bullish trend reversal | EMA5 > EMA8 > EMA13, bullish alignment | KDJ is strong, with bulls in control (K: 74.1, D: 57.6) | Volume increased (1.7x)
════════════════════
🔴 $CXMT 30-minute bullish signal
⚠️Technical analysis: ADX(45) indicates a clear trend | MACD DIF breaks above the zero line, signaling a bullish trend reversal | EMA5 crosses above EMA8, turning bullish in the short term | KDJ is weak, with bears in control (K: 49.7, D: 30.9) | Volume surged (3.2x)
════════════════════
🔴 $KITE 30-minute bullish signal
⚠️Technical analysis: ADX(26) indicates a trend is forming and may be actionable | MACD DIF breaks above the zero line, signaling a bullish trend reversal | Moving averages are converging, building momentum before a direction is chosen | Volume increased (2.1x)
════════════════════
🔔 Follow for the latest market-moving updates 🔔
#技术分析 #AIOT #CXMT #KITE
📌 When trading, watch for whether the candlestick pattern confirms the signal
════════════════════
🔴 $AIOT 30-minute bullish signal
⚠️Technical analysis: ADX(35) indicates a clear trend | MACD DIF breaks above the zero line, signaling a bullish trend reversal | EMA5 > EMA8 > EMA13, bullish alignment | KDJ is strong, with bulls in control (K: 74.1, D: 57.6) | Volume increased (1.7x)
════════════════════
🔴 $CXMT 30-minute bullish signal
⚠️Technical analysis: ADX(45) indicates a clear trend | MACD DIF breaks above the zero line, signaling a bullish trend reversal | EMA5 crosses above EMA8, turning bullish in the short term | KDJ is weak, with bears in control (K: 49.7, D: 30.9) | Volume surged (3.2x)
════════════════════
🔴 $KITE 30-minute bullish signal
⚠️Technical analysis: ADX(26) indicates a trend is forming and may be actionable | MACD DIF breaks above the zero line, signaling a bullish trend reversal | Moving averages are converging, building momentum before a direction is chosen | Volume increased (2.1x)
════════════════════
🔔 Follow for the latest market-moving updates 🔔
#技术分析 #AIOT #CXMT #KITE
📌 When trading, watch for whether the candlestick pattern confirms the signal
2
·
--
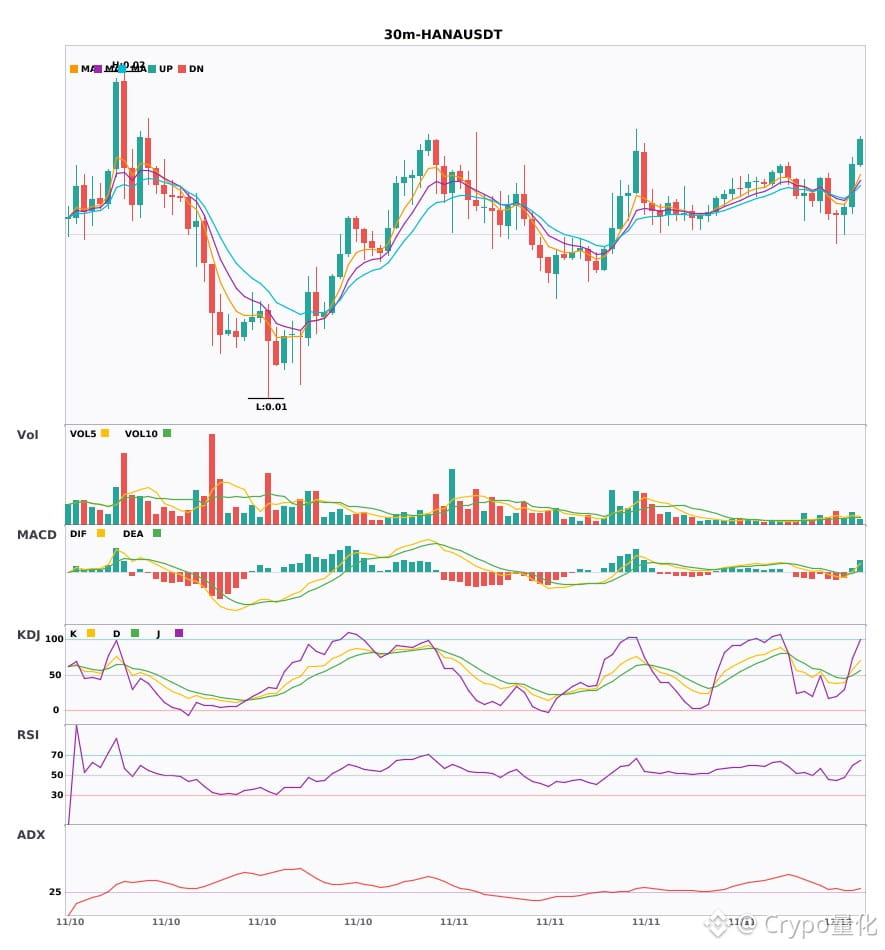
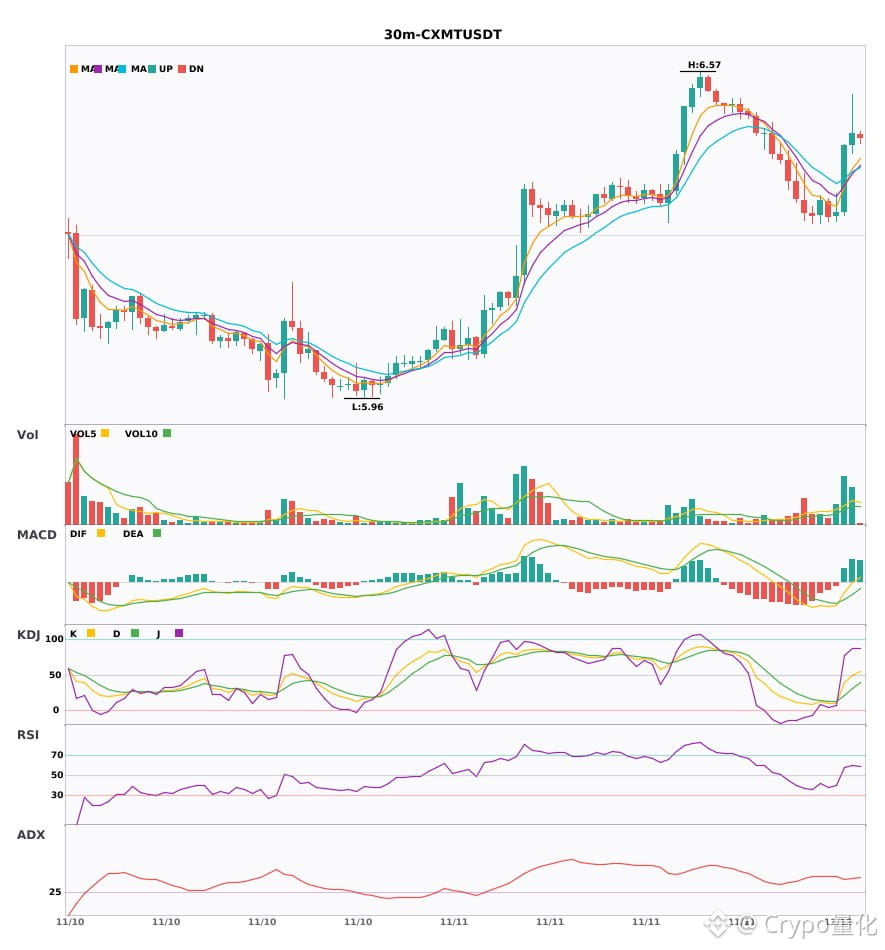
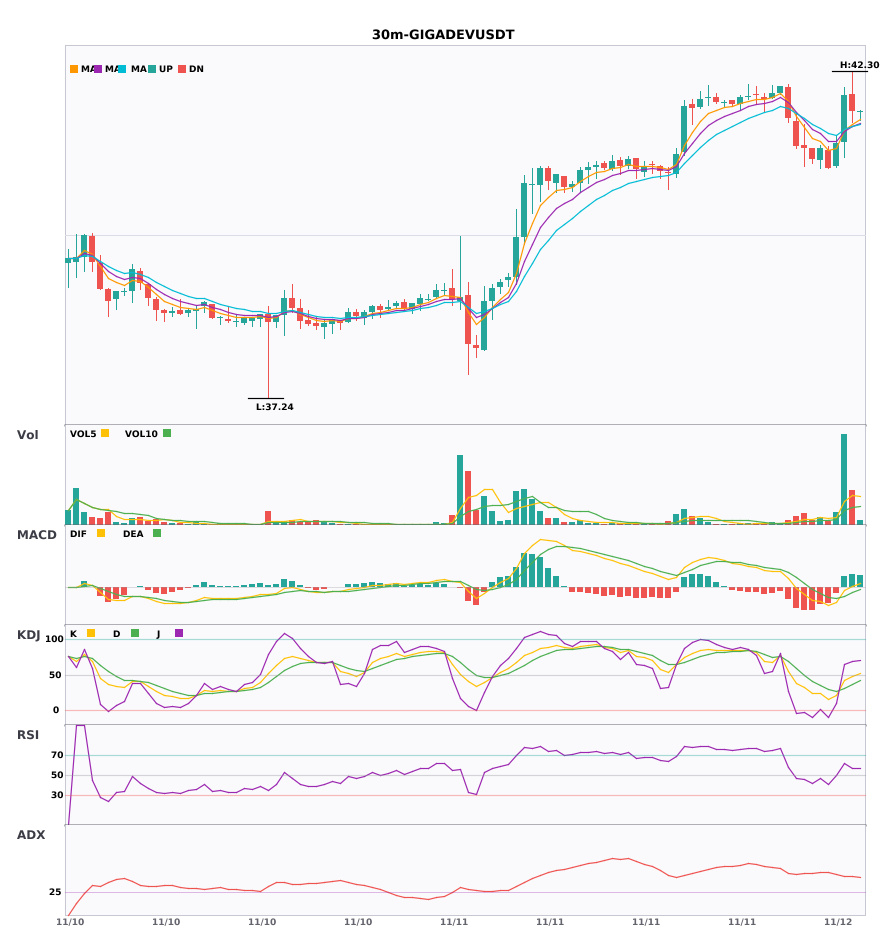
$HANA / $CXMT / $GIGADEV : Technical indicators are strengthening across the 30-minute charts—which has the greatest breakout potential? 🔥
════════════════════
🔴 $HANA 30-minute bullish signals
⚠️Technical analysis: ADX (30): trend is forming; potential opportunity to participate | MACD golden cross above zero, bullish momentum is building | EMA5 crosses above EMA8, short-term trend turns bullish | KDJ golden cross, bullish short-term outlook (K: 57.2, D: 48.9) | Volume expands (1.7x)
════════════════════
🔴 $CXMT 30-minute bullish signals
⚠️Technical analysis: ADX (45): clear trending market | MACD DIF breaks above the zero line, trend turns bullish | EMA5 crosses above EMA8, short-term trend turns bullish | KDJ remains weak, bears have the upper hand (K: 49.7, D: 30.9) | Volume surges (3.2x)
════════════════════
🔴 $GIGADEV 30-minute bullish signals
⚠️Technical analysis: ADX (45): clear trending market | MACD DIF breaks above the zero line, trend turns bullish | Moving averages are converging, building momentum; a directional move is imminent | KDJ remains weak, bears have the upper hand (K: 47.8, D: 37.1) | Volume surges (6.2x)
════════════════════
🔔 Follow for the latest market movements 🔔
#技术分析 #HANA #CXMT #GIGADEV
📌 When trading, watch for confirming candlestick patterns
$HANA / $CXMT / $GIGADEV : Technical indicators are strengthening across the 30-minute charts—which has the greatest breakout potential? 🔥
════════════════════
🔴 $HANA 30-minute bullish signals
⚠️Technical analysis: ADX (30): trend is forming; potential opportunity to participate | MACD golden cross above zero, bullish momentum is building | EMA5 crosses above EMA8, short-term trend turns bullish | KDJ golden cross, bullish short-term outlook (K: 57.2, D: 48.9) | Volume expands (1.7x)
════════════════════
🔴 $CXMT 30-minute bullish signals
⚠️Technical analysis: ADX (45): clear trending market | MACD DIF breaks above the zero line, trend turns bullish | EMA5 crosses above EMA8, short-term trend turns bullish | KDJ remains weak, bears have the upper hand (K: 49.7, D: 30.9) | Volume surges (3.2x)
════════════════════
🔴 $GIGADEV 30-minute bullish signals
⚠️Technical analysis: ADX (45): clear trending market | MACD DIF breaks above the zero line, trend turns bullish | Moving averages are converging, building momentum; a directional move is imminent | KDJ remains weak, bears have the upper hand (K: 47.8, D: 37.1) | Volume surges (6.2x)
════════════════════
🔔 Follow for the latest market movements 🔔
#技术分析 #HANA #CXMT #GIGADEV
📌 When trading, watch for confirming candlestick patterns
════════════════════
🔴 $HANA 30-minute bullish signals
⚠️Technical analysis: ADX (30): trend is forming; potential opportunity to participate | MACD golden cross above zero, bullish momentum is building | EMA5 crosses above EMA8, short-term trend turns bullish | KDJ golden cross, bullish short-term outlook (K: 57.2, D: 48.9) | Volume expands (1.7x)
════════════════════
🔴 $CXMT 30-minute bullish signals
⚠️Technical analysis: ADX (45): clear trending market | MACD DIF breaks above the zero line, trend turns bullish | EMA5 crosses above EMA8, short-term trend turns bullish | KDJ remains weak, bears have the upper hand (K: 49.7, D: 30.9) | Volume surges (3.2x)
════════════════════
🔴 $GIGADEV 30-minute bullish signals
⚠️Technical analysis: ADX (45): clear trending market | MACD DIF breaks above the zero line, trend turns bullish | Moving averages are converging, building momentum; a directional move is imminent | KDJ remains weak, bears have the upper hand (K: 47.8, D: 37.1) | Volume surges (6.2x)
════════════════════
🔔 Follow for the latest market movements 🔔
#技术分析 #HANA #CXMT #GIGADEV
📌 When trading, watch for confirming candlestick patterns
8

·
--
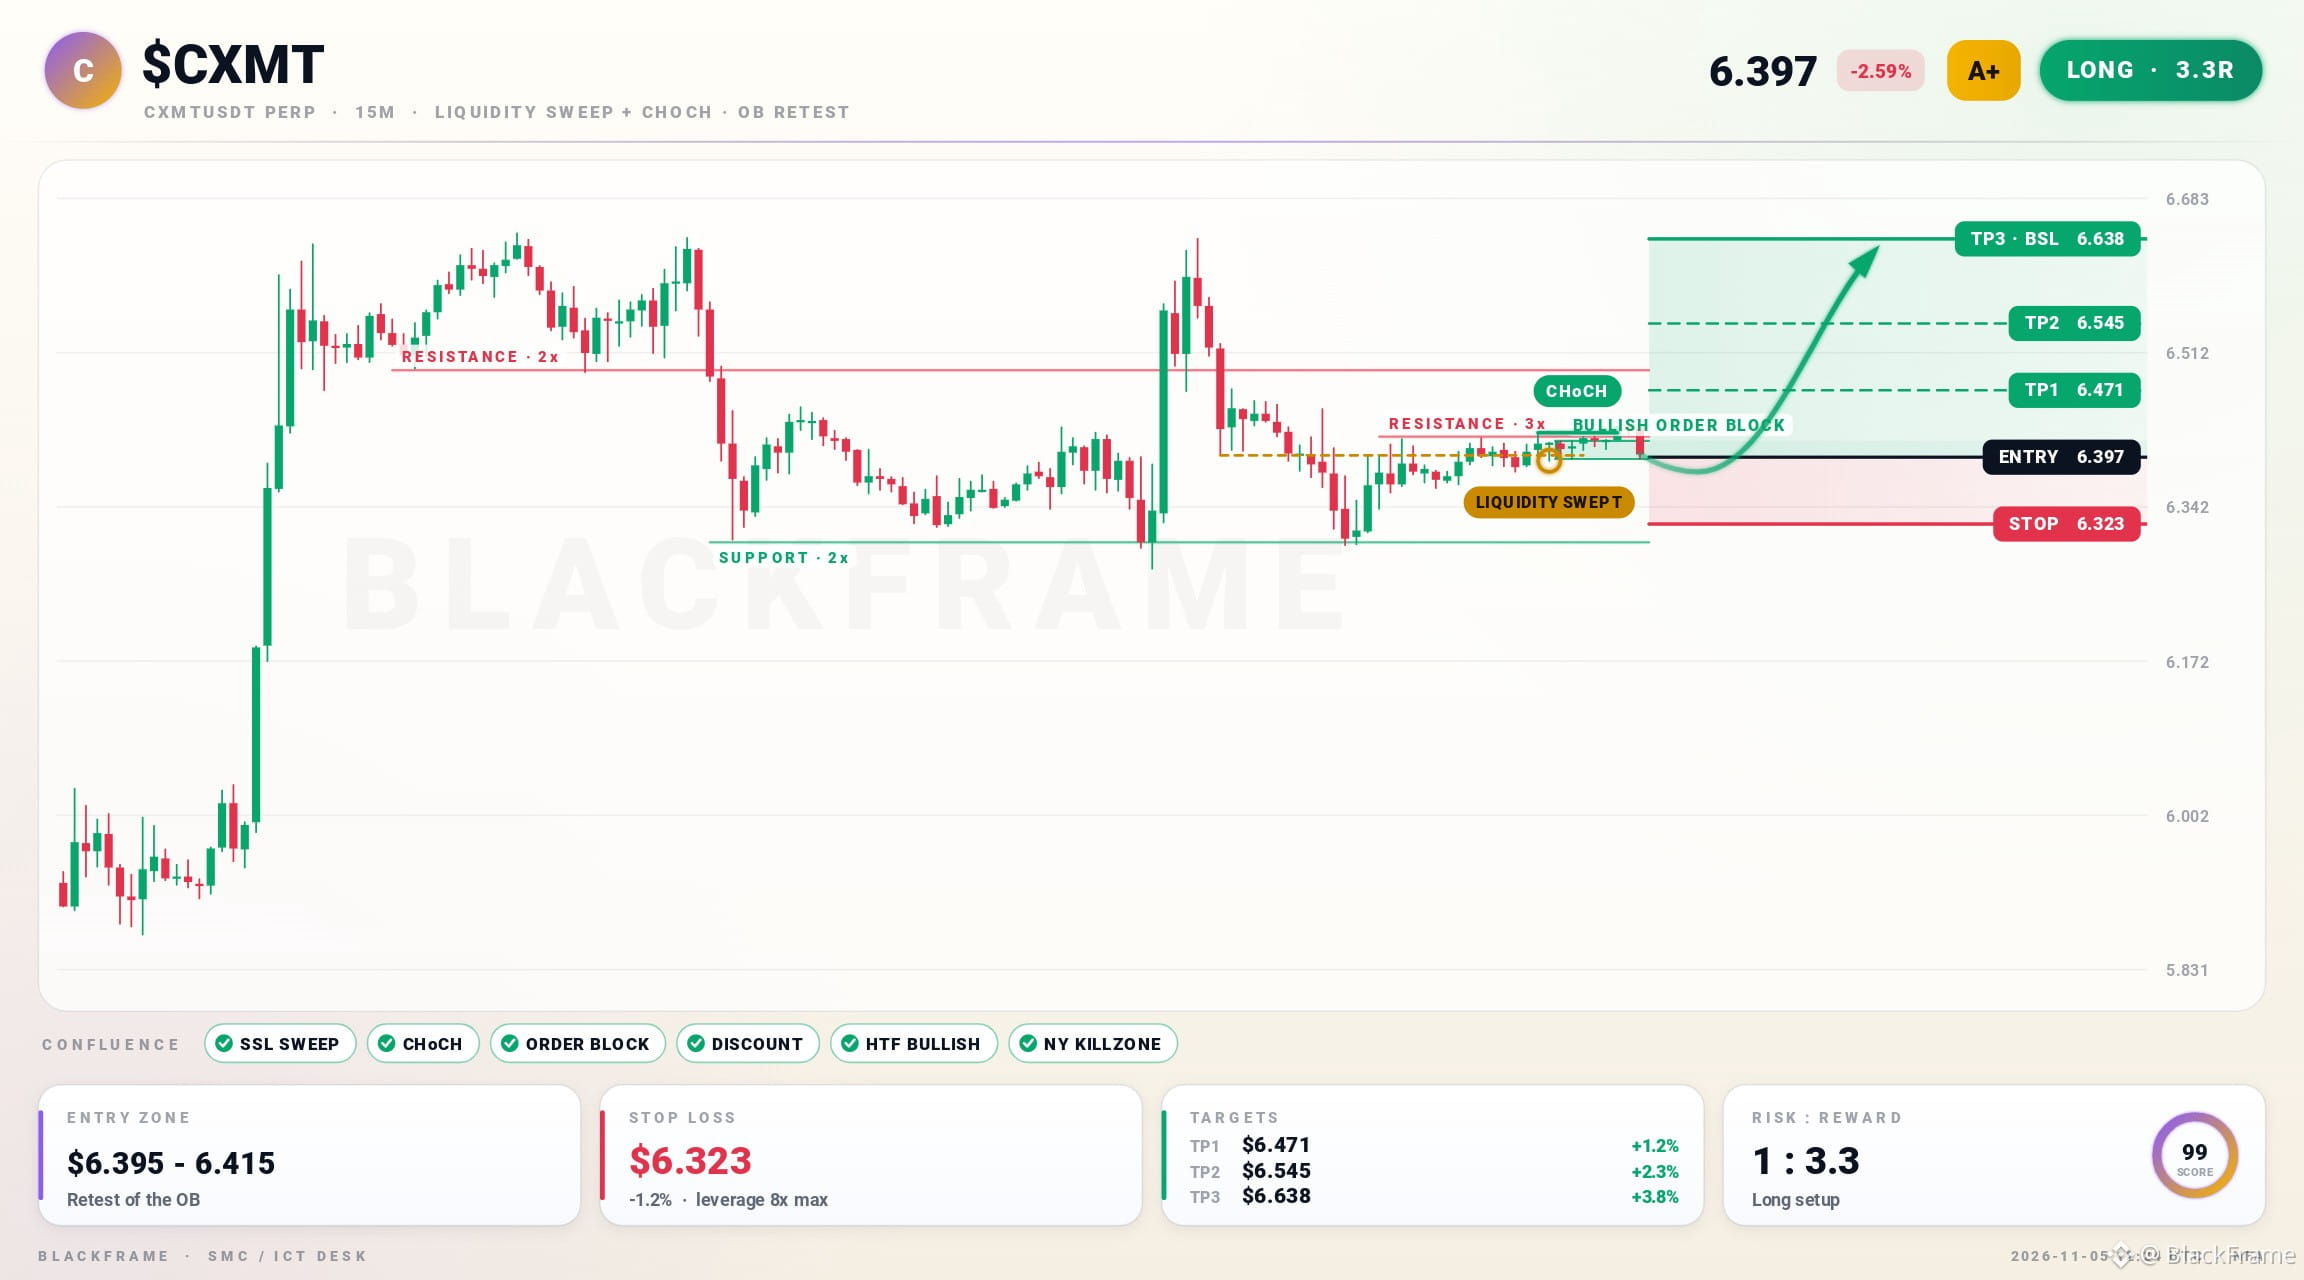
🔔 $CXMT captures discount after liquidity sweep
LONG · 15M
Entry: $6.397 - $6.415
TP1: $6.471
TP2: $6.545
TP3: $6.638
SL: $6.323
Sell-side liquidity was swept, confirming CHoCH on the 15M. Price retested a fresh bullish order block at discount, aligning with HTF bullish bias and New York killzone. Target is buy-side liquidity at $6.638; stop at $6.323.
#CXMT #SmartMoney · NFA
🔔 $CXMT captures discount after liquidity sweep
LONG · 15M
Entry: $6.397 - $6.415
TP1: $6.471
TP2: $6.545
TP3: $6.638
SL: $6.323
Sell-side liquidity was swept, confirming CHoCH on the 15M. Price retested a fresh bullish order block at discount, aligning with HTF bullish bias and New York killzone. Target is buy-side liquidity at $6.638; stop at $6.323.
#CXMT #SmartMoney · NFA
LONG · 15M
Entry: $6.397 - $6.415
TP1: $6.471
TP2: $6.545
TP3: $6.638
SL: $6.323
Sell-side liquidity was swept, confirming CHoCH on the 15M. Price retested a fresh bullish order block at discount, aligning with HTF bullish bias and New York killzone. Target is buy-side liquidity at $6.638; stop at $6.323.
#CXMT #SmartMoney · NFA
55
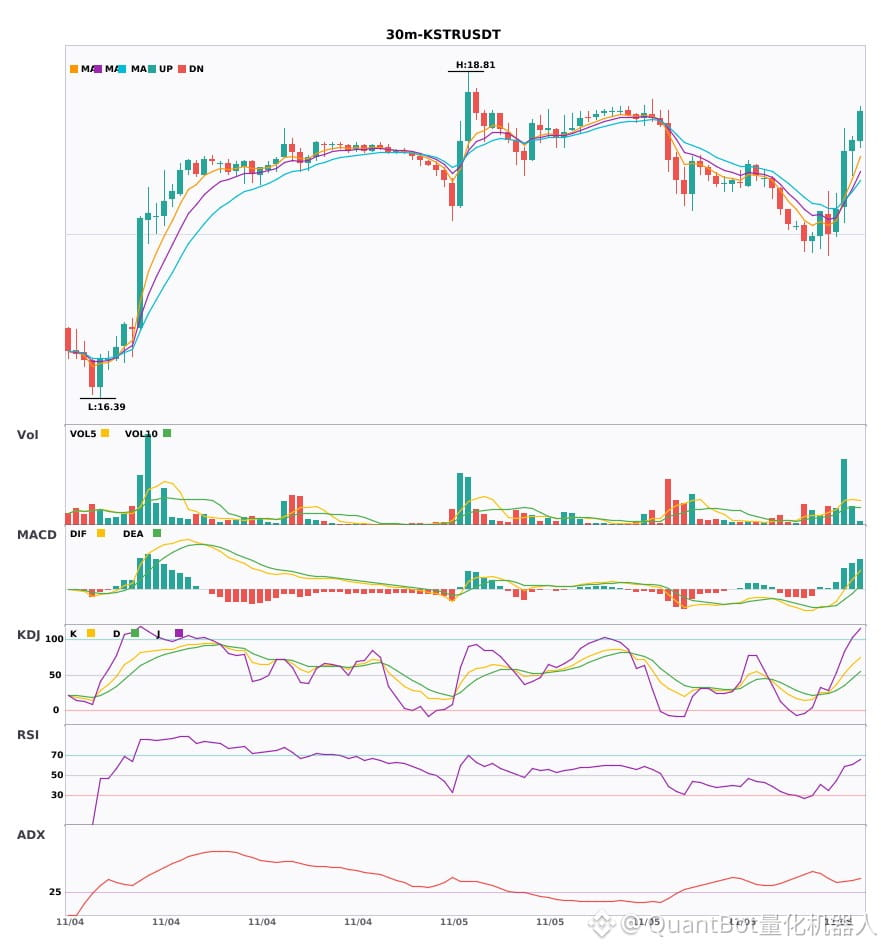
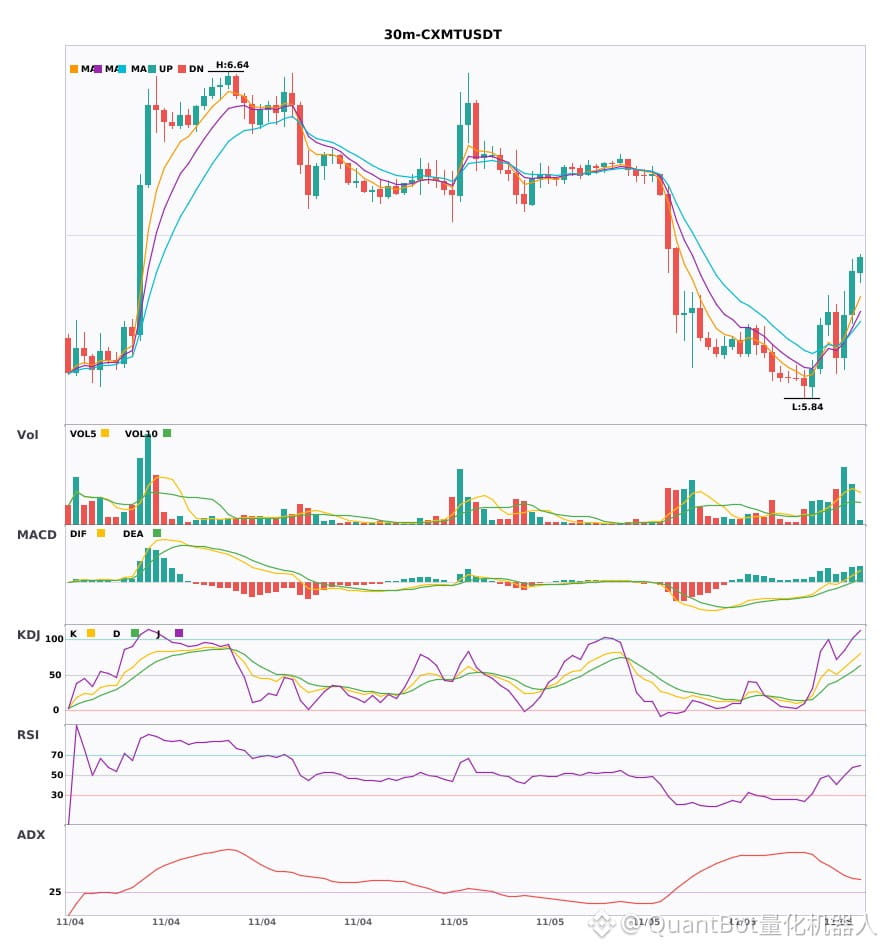
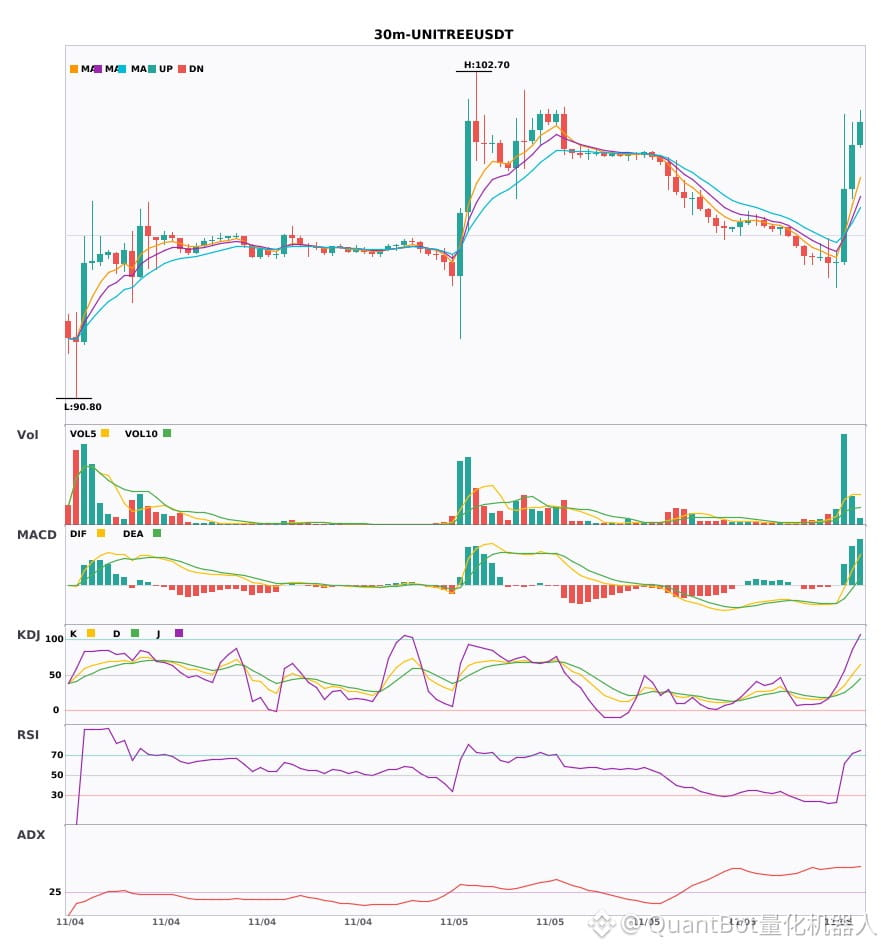
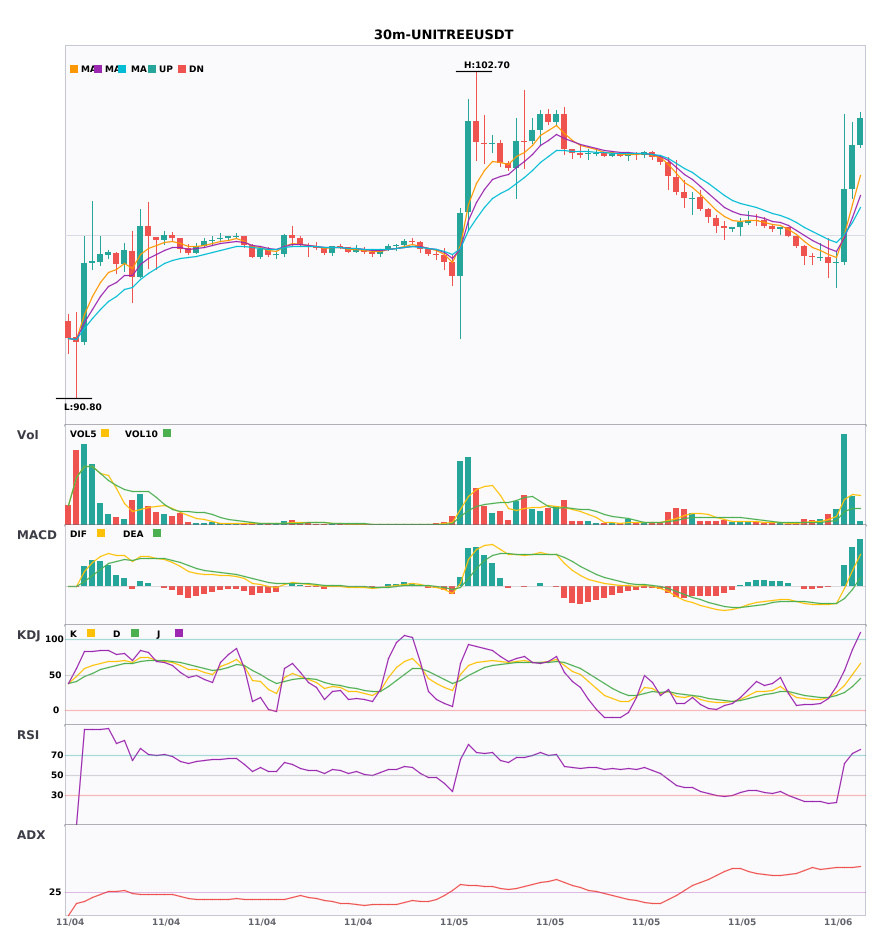
$KSTR / $CXMT / $UNITREE 30-minute technicals are strengthening in sync—which has the greatest breakout potential?
📈 $KSTR | 30-minute bullish signal
━━━━━━━━━━━━━━━━━━
Technical analysis: ADX (41): clear trending market | MACD is bullish; trend is strong and momentum is increasing | EMA5 > EMA8 > EMA13: bullish alignment | Volume surge (4.0x)
Price change: 0.4400%
📈 $CXMT | 30-minute bullish signal
━━━━━━━━━━━━━━━━━━
Technical analysis: ADX (40): clear trending market | MACD is bullish; trend is strong and momentum is increasing | EMA5 > EMA8 > EMA13: bullish alignment | KDJ is strong, with bulls in control (K: 70.3, D: 55.1) | Volume surge (2.7x)
Price change: 1.7900%
📈 $UNITREE | 30-minute bullish signal
━━━━━━━━━━━━━━━━━━
Technical analysis: ADX (55): very strong trend (beware of a pullback from overbought levels) | MACD DIF breaks above the zero line; trend turns bullish | EMA5 > EMA8 > EMA13: bullish alignment | Volume surge (6.5x)
Price change: 1.6300%
━━━━━━━━━━━━━━━━━━
#技术分析 #KSTR #CXMT #UNITREE
📌 The above is for reference only and does not constitute investment advice
$KSTR / $CXMT / $UNITREE 30-minute technicals are strengthening in sync—which has the greatest breakout potential?
📈 $KSTR | 30-minute bullish signal
━━━━━━━━━━━━━━━━━━
Technical analysis: ADX (41): clear trending market | MACD is bullish; trend is strong and momentum is increasing | EMA5 > EMA8 > EMA13: bullish alignment | Volume surge (4.0x)
Price change: 0.4400%
📈 $CXMT | 30-minute bullish signal
━━━━━━━━━━━━━━━━━━
Technical analysis: ADX (40): clear trending market | MACD is bullish; trend is strong and momentum is increasing | EMA5 > EMA8 > EMA13: bullish alignment | KDJ is strong, with bulls in control (K: 70.3, D: 55.1) | Volume surge (2.7x)
Price change: 1.7900%
📈 $UNITREE | 30-minute bullish signal
━━━━━━━━━━━━━━━━━━
Technical analysis: ADX (55): very strong trend (beware of a pullback from overbought levels) | MACD DIF breaks above the zero line; trend turns bullish | EMA5 > EMA8 > EMA13: bullish alignment | Volume surge (6.5x)
Price change: 1.6300%
━━━━━━━━━━━━━━━━━━
#技术分析 #KSTR #CXMT #UNITREE
📌 The above is for reference only and does not constitute investment advice
📈 $KSTR | 30-minute bullish signal
━━━━━━━━━━━━━━━━━━
Technical analysis: ADX (41): clear trending market | MACD is bullish; trend is strong and momentum is increasing | EMA5 > EMA8 > EMA13: bullish alignment | Volume surge (4.0x)
Price change: 0.4400%
📈 $CXMT | 30-minute bullish signal
━━━━━━━━━━━━━━━━━━
Technical analysis: ADX (40): clear trending market | MACD is bullish; trend is strong and momentum is increasing | EMA5 > EMA8 > EMA13: bullish alignment | KDJ is strong, with bulls in control (K: 70.3, D: 55.1) | Volume surge (2.7x)
Price change: 1.7900%
📈 $UNITREE | 30-minute bullish signal
━━━━━━━━━━━━━━━━━━
Technical analysis: ADX (55): very strong trend (beware of a pullback from overbought levels) | MACD DIF breaks above the zero line; trend turns bullish | EMA5 > EMA8 > EMA13: bullish alignment | Volume surge (6.5x)
Price change: 1.6300%
━━━━━━━━━━━━━━━━━━
#技术分析 #KSTR #CXMT #UNITREE
📌 The above is for reference only and does not constitute investment advice
43
·
--
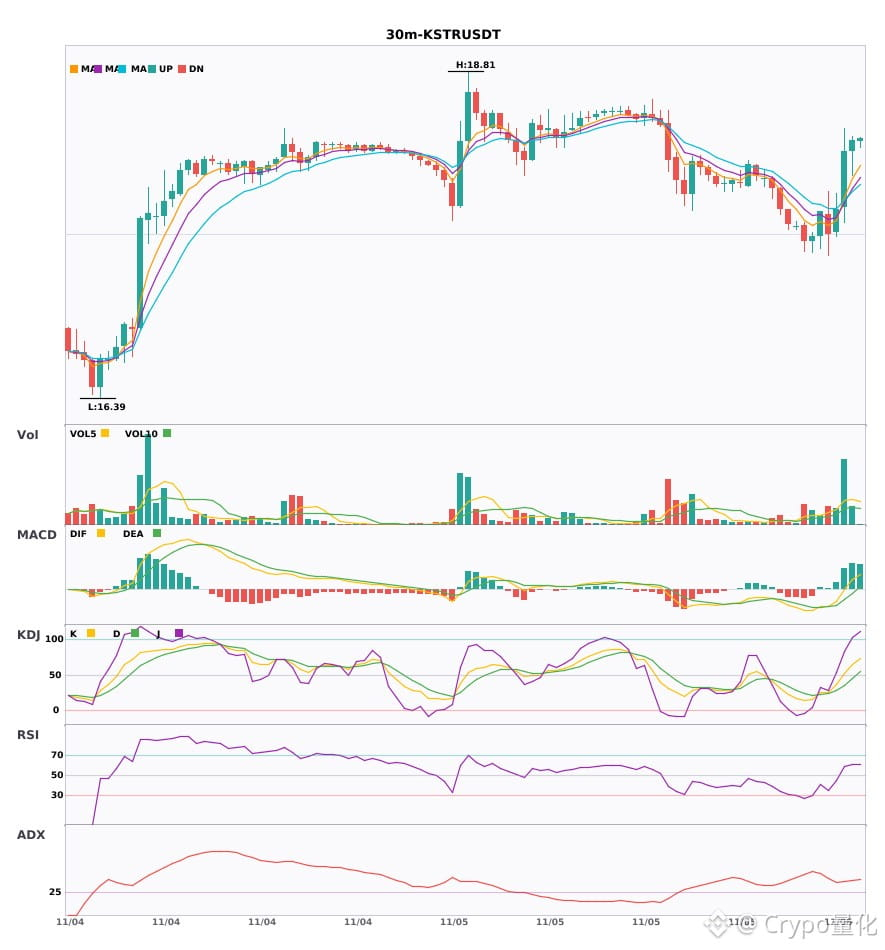
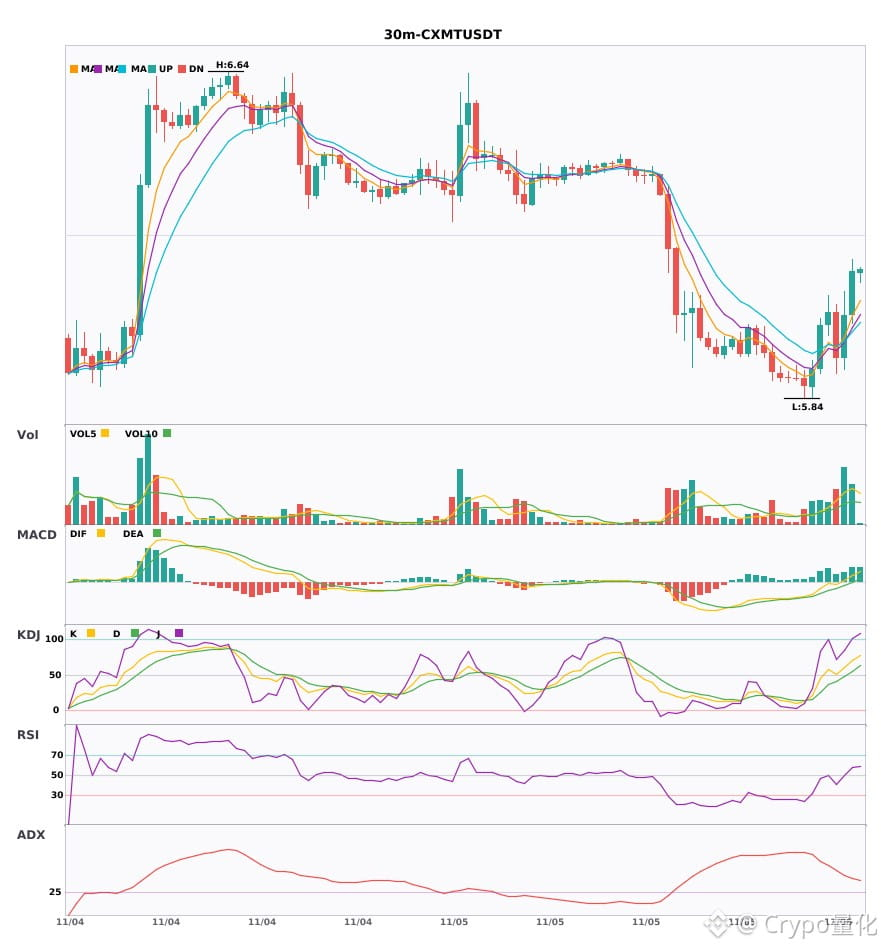
$KSTR / $CXMT / $UNITREE 30-minute confluence turns bullish, with bullish signals appearing simultaneously 🔥
════════════════════
🔴 $KSTR 30-minute bullish signal
⚠️Technical analysis: ADX(41): clear trending market | MACD is bullish, the trend is strong, and momentum is strengthening | EMA5 > EMA8 > EMA13: bullish alignment | Volume surge (4.0x)
════════════════════
🔴 $CXMT 30-minute bullish signal
⚠️Technical analysis: ADX(40): clear trending market | MACD is bullish, the trend is strong, and momentum is strengthening | EMA5 > EMA8 > EMA13: bullish alignment | KDJ is strong, with bulls in control (K: 70.3, D: 55.1) | Volume surge (2.7x)
════════════════════
🔴 $UNITREE 30-minute bullish signal
⚠️Technical analysis: ADX(55): exceptionally strong trend (beware of an overheated pullback) | MACD DIF breaks above the zero line; trend turns bullish | EMA5 > EMA8 > EMA13: bullish alignment | Volume surge (6.5x)
════════════════════
🔔 Follow for first-hand market alerts 🔔
#技术分析 #KSTR #CXMT #UNITREE
📌 When trading, pay attention to whether the candlestick pattern meets the criteria
$KSTR / $CXMT / $UNITREE 30-minute confluence turns bullish, with bullish signals appearing simultaneously 🔥
════════════════════
🔴 $KSTR 30-minute bullish signal
⚠️Technical analysis: ADX(41): clear trending market | MACD is bullish, the trend is strong, and momentum is strengthening | EMA5 > EMA8 > EMA13: bullish alignment | Volume surge (4.0x)
════════════════════
🔴 $CXMT 30-minute bullish signal
⚠️Technical analysis: ADX(40): clear trending market | MACD is bullish, the trend is strong, and momentum is strengthening | EMA5 > EMA8 > EMA13: bullish alignment | KDJ is strong, with bulls in control (K: 70.3, D: 55.1) | Volume surge (2.7x)
════════════════════
🔴 $UNITREE 30-minute bullish signal
⚠️Technical analysis: ADX(55): exceptionally strong trend (beware of an overheated pullback) | MACD DIF breaks above the zero line; trend turns bullish | EMA5 > EMA8 > EMA13: bullish alignment | Volume surge (6.5x)
════════════════════
🔔 Follow for first-hand market alerts 🔔
#技术分析 #KSTR #CXMT #UNITREE
📌 When trading, pay attention to whether the candlestick pattern meets the criteria
════════════════════
🔴 $KSTR 30-minute bullish signal
⚠️Technical analysis: ADX(41): clear trending market | MACD is bullish, the trend is strong, and momentum is strengthening | EMA5 > EMA8 > EMA13: bullish alignment | Volume surge (4.0x)
════════════════════
🔴 $CXMT 30-minute bullish signal
⚠️Technical analysis: ADX(40): clear trending market | MACD is bullish, the trend is strong, and momentum is strengthening | EMA5 > EMA8 > EMA13: bullish alignment | KDJ is strong, with bulls in control (K: 70.3, D: 55.1) | Volume surge (2.7x)
════════════════════
🔴 $UNITREE 30-minute bullish signal
⚠️Technical analysis: ADX(55): exceptionally strong trend (beware of an overheated pullback) | MACD DIF breaks above the zero line; trend turns bullish | EMA5 > EMA8 > EMA13: bullish alignment | Volume surge (6.5x)
════════════════════
🔔 Follow for first-hand market alerts 🔔
#技术分析 #KSTR #CXMT #UNITREE
📌 When trading, pay attention to whether the candlestick pattern meets the criteria
18
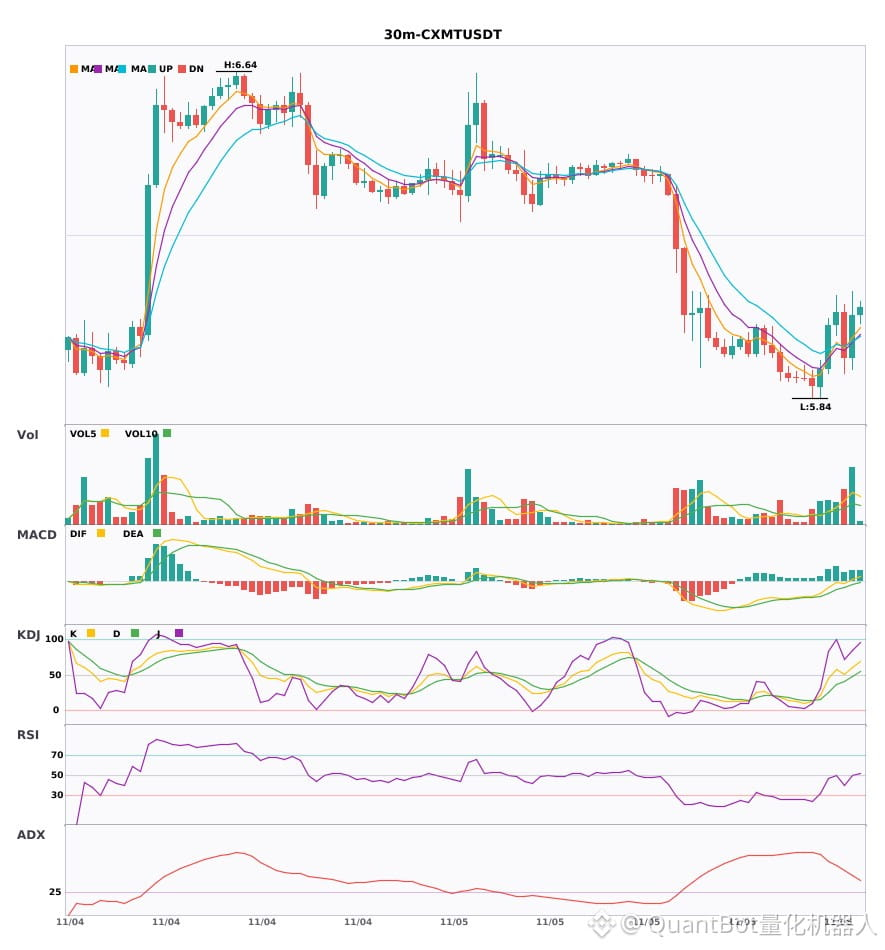
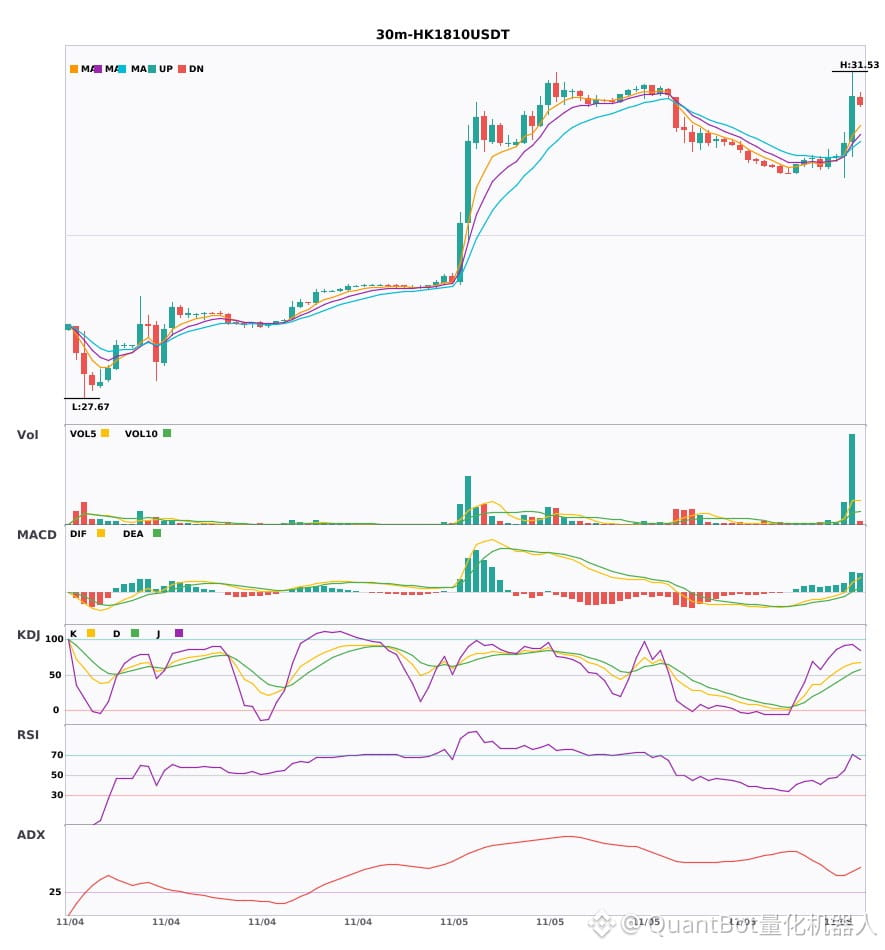
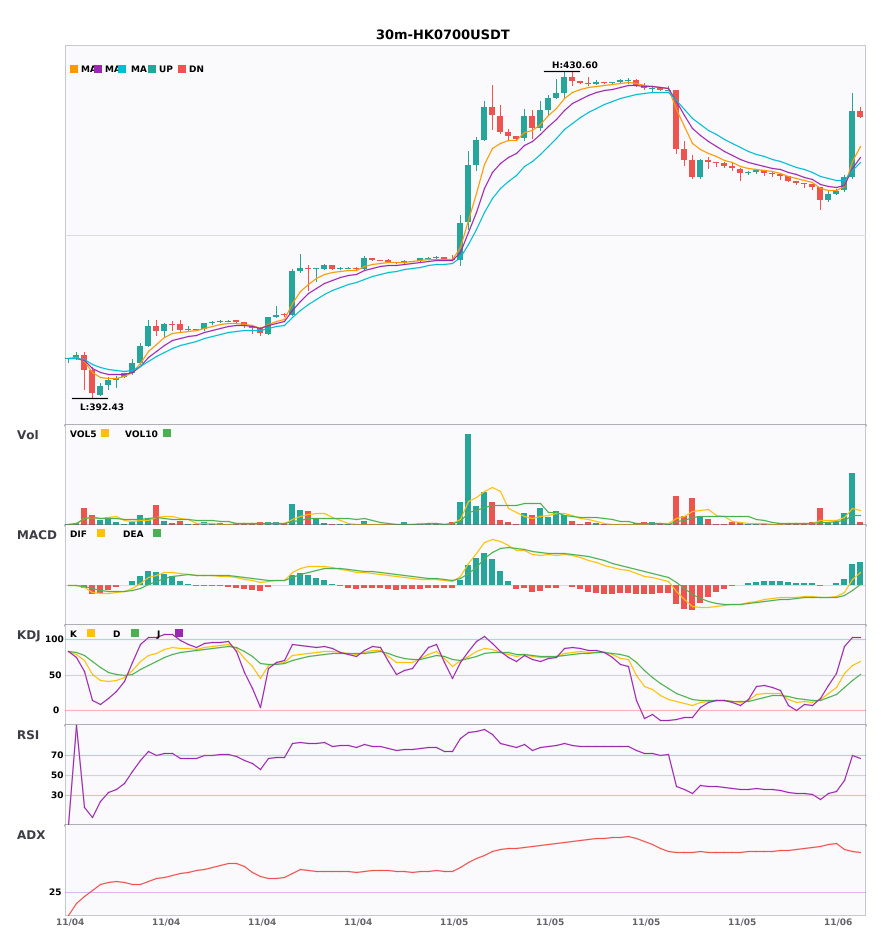
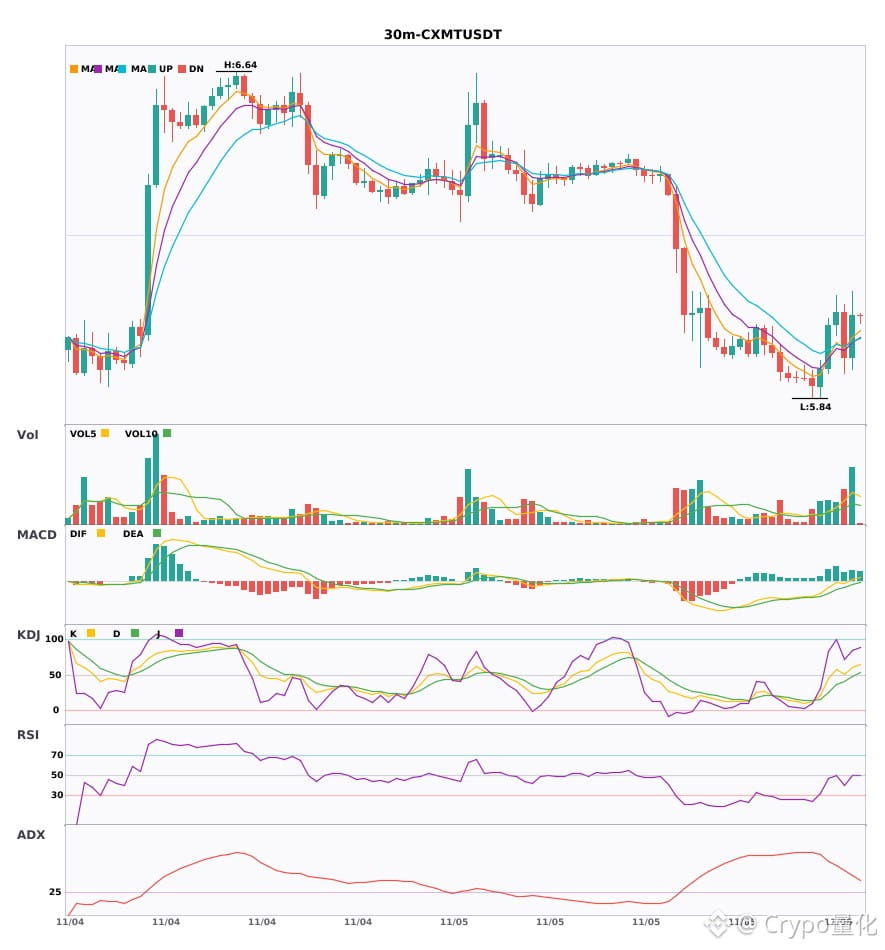
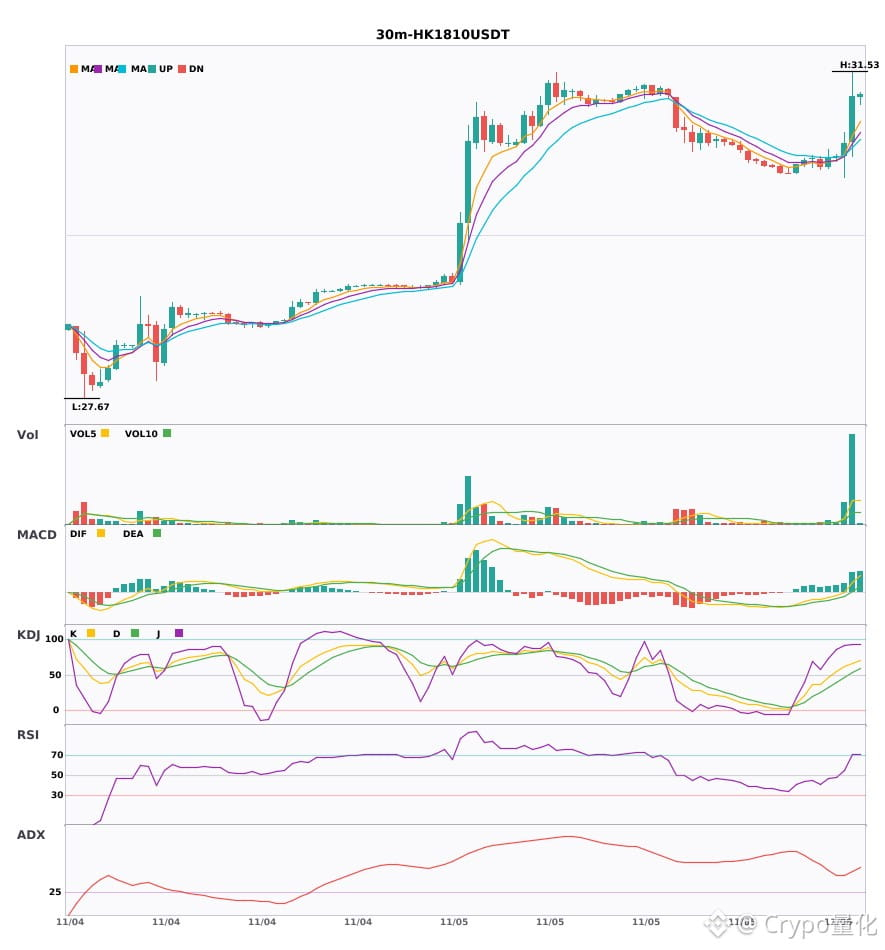
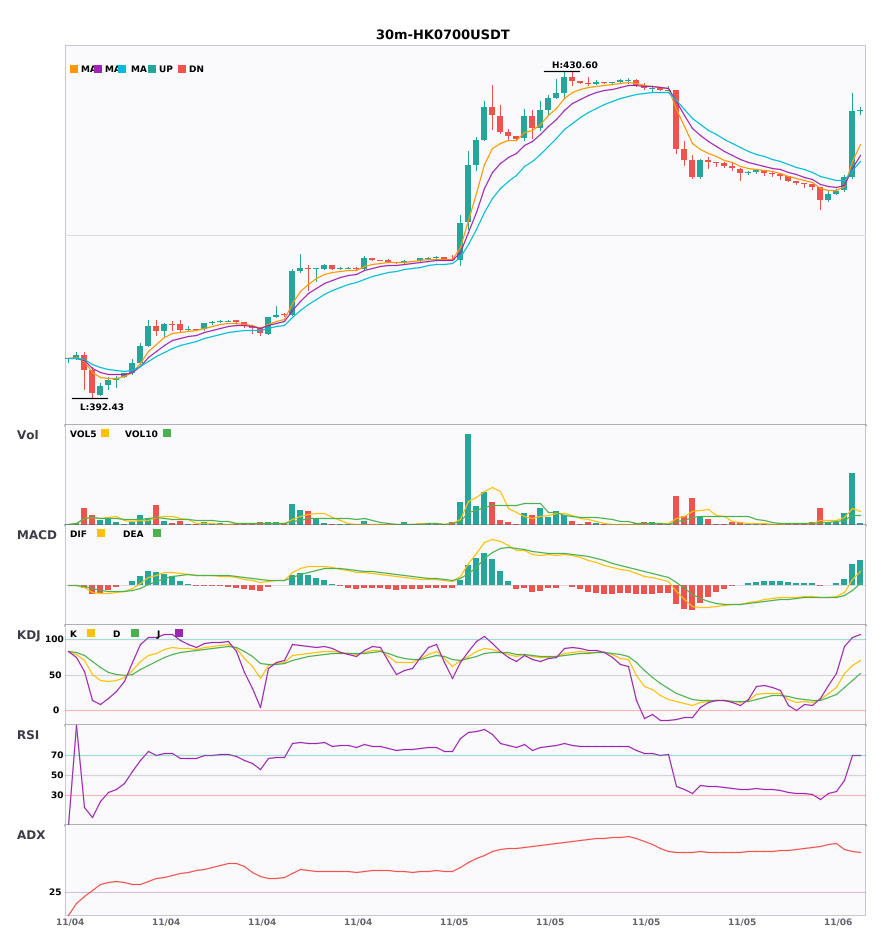
$CXMT / $HK1810 / $HK0700 30-minute technical indicators are strengthening in sync. Which has more explosive potential?
📈 $CXMT | 30-minute bullish signal
━━━━━━━━━━━━━━━━━━
Technical analysis: ADX(42): clear trending market | MACD DIF broke above the zero line, turning the trend bullish | Moving averages are converging, building momentum; a breakout direction is imminent | Volume surge (2.7x)
Price change: 1.7700%
📈 $HK1810 | 30-minute bullish signal
━━━━━━━━━━━━━━━━━━
Technical analysis: ADX(46): very strong trend (watch for an overheated pullback) | MACD DIF broke above the zero line, turning the trend bullish | Moving averages are converging, building momentum; a breakout direction is imminent | Volume surge (5.6x)
Price change: 0.4900%
📈 $HK0700 | 30-minute bullish signal
━━━━━━━━━━━━━━━━━━
Technical analysis: ADX(73): very strong trend (watch for an overheated pullback) | MACD DIF broke above the zero line, turning the trend bullish | EMA5 crossed above EMA8, turning bullish in the short term | Volume surge (5.5x)
Price change: 1.8300%
━━━━━━━━━━━━━━━━━━
#技术分析 #CXMT #HK1810 #HK0700
📌 The above content is for reference only and does not constitute investment advice
$CXMT / $HK1810 / $HK0700 30-minute technical indicators are strengthening in sync. Which has more explosive potential?
📈 $CXMT | 30-minute bullish signal
━━━━━━━━━━━━━━━━━━
Technical analysis: ADX(42): clear trending market | MACD DIF broke above the zero line, turning the trend bullish | Moving averages are converging, building momentum; a breakout direction is imminent | Volume surge (2.7x)
Price change: 1.7700%
📈 $HK1810 | 30-minute bullish signal
━━━━━━━━━━━━━━━━━━
Technical analysis: ADX(46): very strong trend (watch for an overheated pullback) | MACD DIF broke above the zero line, turning the trend bullish | Moving averages are converging, building momentum; a breakout direction is imminent | Volume surge (5.6x)
Price change: 0.4900%
📈 $HK0700 | 30-minute bullish signal
━━━━━━━━━━━━━━━━━━
Technical analysis: ADX(73): very strong trend (watch for an overheated pullback) | MACD DIF broke above the zero line, turning the trend bullish | EMA5 crossed above EMA8, turning bullish in the short term | Volume surge (5.5x)
Price change: 1.8300%
━━━━━━━━━━━━━━━━━━
#技术分析 #CXMT #HK1810 #HK0700
📌 The above content is for reference only and does not constitute investment advice
📈 $CXMT | 30-minute bullish signal
━━━━━━━━━━━━━━━━━━
Technical analysis: ADX(42): clear trending market | MACD DIF broke above the zero line, turning the trend bullish | Moving averages are converging, building momentum; a breakout direction is imminent | Volume surge (2.7x)
Price change: 1.7700%
📈 $HK1810 | 30-minute bullish signal
━━━━━━━━━━━━━━━━━━
Technical analysis: ADX(46): very strong trend (watch for an overheated pullback) | MACD DIF broke above the zero line, turning the trend bullish | Moving averages are converging, building momentum; a breakout direction is imminent | Volume surge (5.6x)
Price change: 0.4900%
📈 $HK0700 | 30-minute bullish signal
━━━━━━━━━━━━━━━━━━
Technical analysis: ADX(73): very strong trend (watch for an overheated pullback) | MACD DIF broke above the zero line, turning the trend bullish | EMA5 crossed above EMA8, turning bullish in the short term | Volume surge (5.5x)
Price change: 1.8300%
━━━━━━━━━━━━━━━━━━
#技术分析 #CXMT #HK1810 #HK0700
📌 The above content is for reference only and does not constitute investment advice
18
·
--
3 simultaneous 30-minute bullish signals: $CXMT / $HK1810 / $HK0700🔥
════════════════════
🔴 $CXMT 30-minute bullish signal
⚠️Technical analysis: ADX(42) indicates a clear trend | MACD DIF breaks above zero, signaling a bullish trend | Moving averages are converging, building up for a move and about to choose a direction | Volume surge (2.7x)
════════════════════
🔴 $HK1810 30-minute bullish signal
⚠️Technical analysis: ADX(46) indicates a very strong trend (beware of an overheated pullback) | MACD DIF breaks above zero, signaling a bullish trend | Moving averages are converging, building up for a move and about to choose a direction | Volume surge (5.6x)
════════════════════
🔴 $HK0700 30-minute bullish signal
⚠️Technical analysis: ADX(73) indicates a very strong trend (beware of an overheated pullback) | MACD DIF breaks above zero, signaling a bullish trend | EMA5 crosses above EMA8, signaling a short-term bullish turn | Volume surge (5.5x)
════════════════════
🔔 Follow us for real-time market alerts 🔔
#技术分析 #CXMT #HK1810 #HK0700
📌 When trading, pay attention to whether the candlestick pattern confirms the signal
3 simultaneous 30-minute bullish signals: $CXMT / $HK1810 / $HK0700 🔥
════════════════════
🔴 $CXMT 30-minute bullish signal
⚠️Technical analysis: ADX(42) indicates a clear trend | MACD DIF breaks above zero, signaling a bullish trend | Moving averages are converging, building up for a move and about to choose a direction | Volume surge (2.7x)
════════════════════
🔴 $HK1810 30-minute bullish signal
⚠️Technical analysis: ADX(46) indicates a very strong trend (beware of an overheated pullback) | MACD DIF breaks above zero, signaling a bullish trend | Moving averages are converging, building up for a move and about to choose a direction | Volume surge (5.6x)
════════════════════
🔴 $HK0700 30-minute bullish signal
⚠️Technical analysis: ADX(73) indicates a very strong trend (beware of an overheated pullback) | MACD DIF breaks above zero, signaling a bullish trend | EMA5 crosses above EMA8, signaling a short-term bullish turn | Volume surge (5.5x)
════════════════════
🔔 Follow us for real-time market alerts 🔔
#技术分析 #CXMT #HK1810 #HK0700
📌 When trading, pay attention to whether the candlestick pattern confirms the signal
════════════════════
🔴 $CXMT 30-minute bullish signal
⚠️Technical analysis: ADX(42) indicates a clear trend | MACD DIF breaks above zero, signaling a bullish trend | Moving averages are converging, building up for a move and about to choose a direction | Volume surge (2.7x)
════════════════════
🔴 $HK1810 30-minute bullish signal
⚠️Technical analysis: ADX(46) indicates a very strong trend (beware of an overheated pullback) | MACD DIF breaks above zero, signaling a bullish trend | Moving averages are converging, building up for a move and about to choose a direction | Volume surge (5.6x)
════════════════════
🔴 $HK0700 30-minute bullish signal
⚠️Technical analysis: ADX(73) indicates a very strong trend (beware of an overheated pullback) | MACD DIF breaks above zero, signaling a bullish trend | EMA5 crosses above EMA8, signaling a short-term bullish turn | Volume surge (5.5x)
════════════════════
🔔 Follow us for real-time market alerts 🔔
#技术分析 #CXMT #HK1810 #HK0700
📌 When trading, pay attention to whether the candlestick pattern confirms the signal
2

·
--
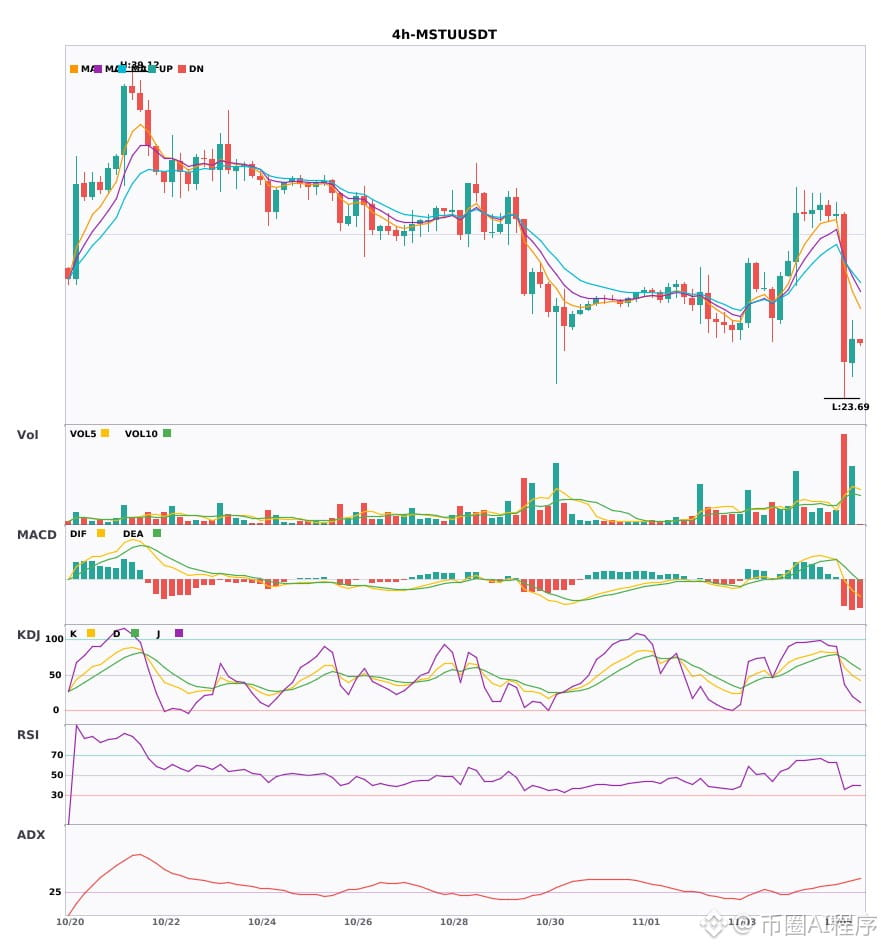
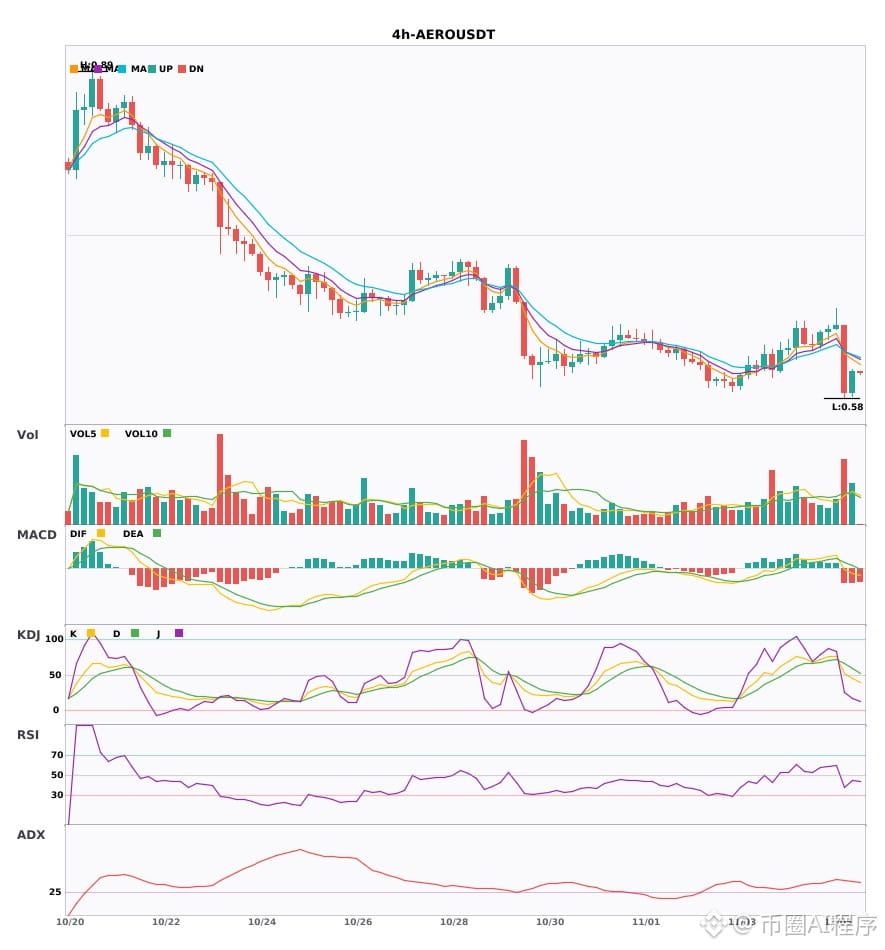
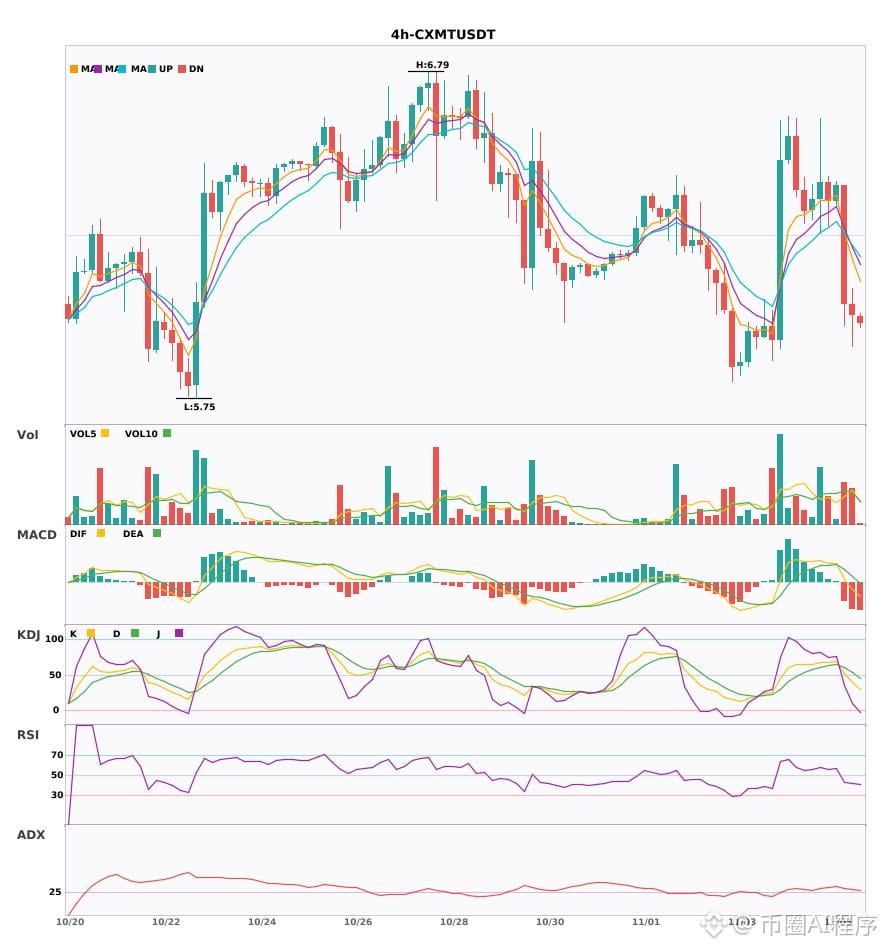
Multi-timeframe confluence: $MSTU / $AERO / $CXMT weakened on the 4-hour timeframe; the daily bearish trend is confirmed 🔥
════════════════════
🟢 $MSTU 4-hour bearish signal
⚠️ Technicals: Daily bearish confluence confirmed | 4-hour entry: MACD bearish, trend weak, momentum strengthening | EMA5 < EMA8 < EMA13, bearish alignment | Volume surge (3.3x)
════════════════════
🟢 $AERO 4-hour bearish signal
⚠️ Technicals: Daily bearish confluence confirmed | 4-hour entry: MACD bearish, trend weak, momentum strengthening | EMA5 < EMA8 < EMA13, bearish alignment | Volume increase (2.0x)
📢 Market update: Binance Will Support the Velodrome Finance (VELODROME) Token Merge to Aerodrome (AERO) and the AERO Contract Swap
════════════════════
🟢 $CXMT 4-hour bearish signal
⚠️ Technicals: Daily bearish confluence confirmed | 4-hour entry: MACD DIF fell below the zero line, trend turned bearish | EMA5 < EMA8 < EMA13, bearish alignment | Volume normal (1.2x)
════════════════════
🔔 Follow for real-time market updates 🔔
#多周期共振 #MSTU #AERO #CXMT
📌 When trading, pay attention to whether the candlestick patterns align
Multi-timeframe confluence: $MSTU / $AERO / $CXMT weakened on the 4-hour timeframe; the daily bearish trend is confirmed 🔥
════════════════════
🟢 $MSTU 4-hour bearish signal
⚠️ Technicals: Daily bearish confluence confirmed | 4-hour entry: MACD bearish, trend weak, momentum strengthening | EMA5 < EMA8 < EMA13, bearish alignment | Volume surge (3.3x)
════════════════════
🟢 $AERO 4-hour bearish signal
⚠️ Technicals: Daily bearish confluence confirmed | 4-hour entry: MACD bearish, trend weak, momentum strengthening | EMA5 < EMA8 < EMA13, bearish alignment | Volume increase (2.0x)
📢 Market update: Binance Will Support the Velodrome Finance (VELODROME) Token Merge to Aerodrome (AERO) and the AERO Contract Swap
════════════════════
🟢 $CXMT 4-hour bearish signal
⚠️ Technicals: Daily bearish confluence confirmed | 4-hour entry: MACD DIF fell below the zero line, trend turned bearish | EMA5 < EMA8 < EMA13, bearish alignment | Volume normal (1.2x)
════════════════════
🔔 Follow for real-time market updates 🔔
#多周期共振 #MSTU #AERO #CXMT
📌 When trading, pay attention to whether the candlestick patterns align
════════════════════
🟢 $MSTU 4-hour bearish signal
⚠️ Technicals: Daily bearish confluence confirmed | 4-hour entry: MACD bearish, trend weak, momentum strengthening | EMA5 < EMA8 < EMA13, bearish alignment | Volume surge (3.3x)
════════════════════
🟢 $AERO 4-hour bearish signal
⚠️ Technicals: Daily bearish confluence confirmed | 4-hour entry: MACD bearish, trend weak, momentum strengthening | EMA5 < EMA8 < EMA13, bearish alignment | Volume increase (2.0x)
📢 Market update: Binance Will Support the Velodrome Finance (VELODROME) Token Merge to Aerodrome (AERO) and the AERO Contract Swap
════════════════════
🟢 $CXMT 4-hour bearish signal
⚠️ Technicals: Daily bearish confluence confirmed | 4-hour entry: MACD DIF fell below the zero line, trend turned bearish | EMA5 < EMA8 < EMA13, bearish alignment | Volume normal (1.2x)
════════════════════
🔔 Follow for real-time market updates 🔔
#多周期共振 #MSTU #AERO #CXMT
📌 When trading, pay attention to whether the candlestick patterns align
13

·
--
I stared at this 20x long on CXMT for half an hour, and the return stayed stuck at -108.0%. Hope the market makers are happy; I’ve already written off this position as tuition.
{future}(CXMTUSDT) #CXMT #Binance Square
I stared at this 20x long on CXMT for half an hour, and the return stayed stuck at -108.0%. Hope the market makers are happy; I’ve already written off this position as tuition.
#CXMT #Binance Square
#CXMT #Binance Square
906
·
--
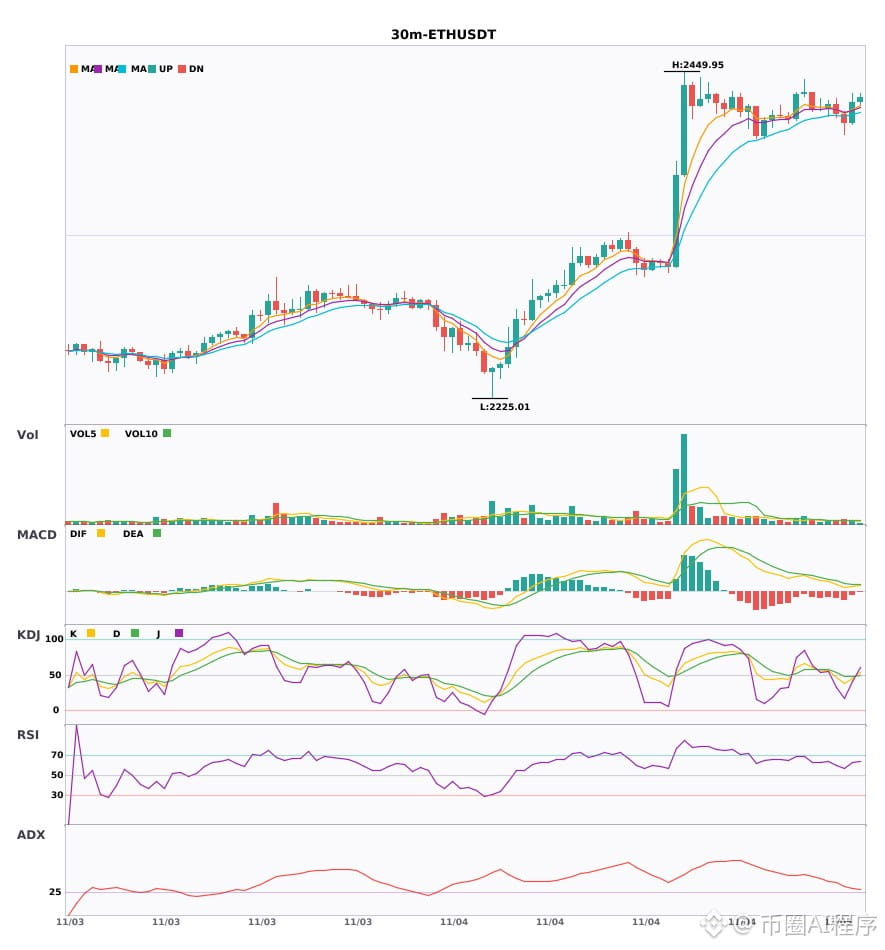
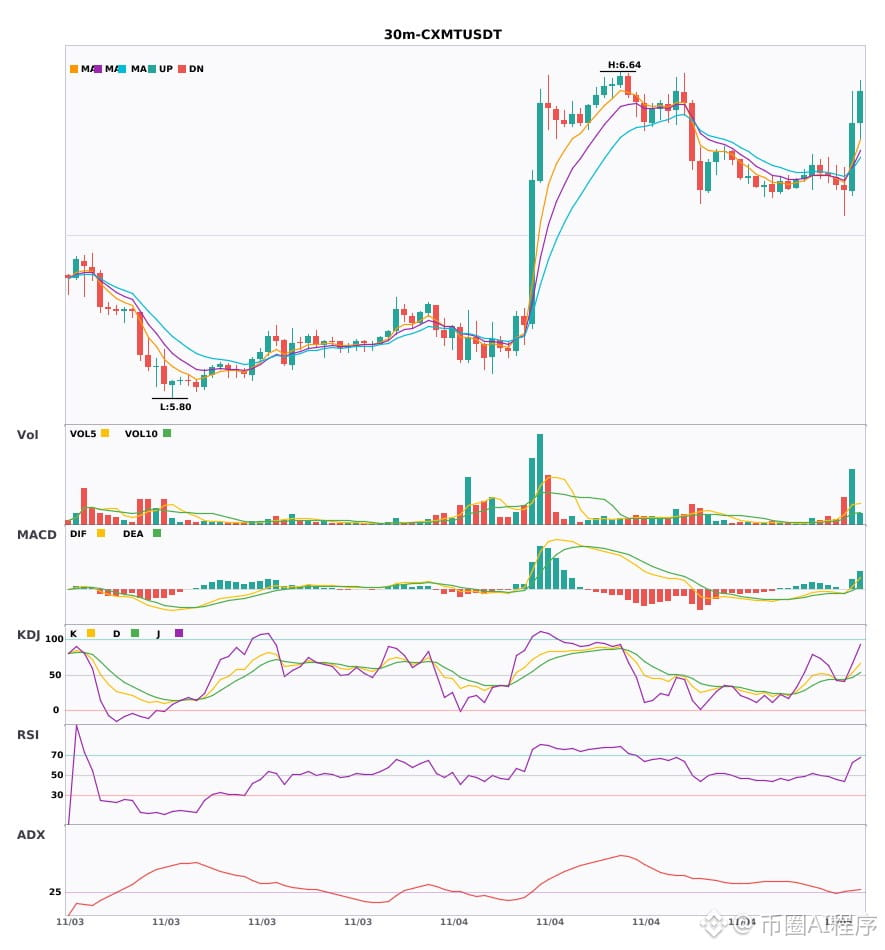
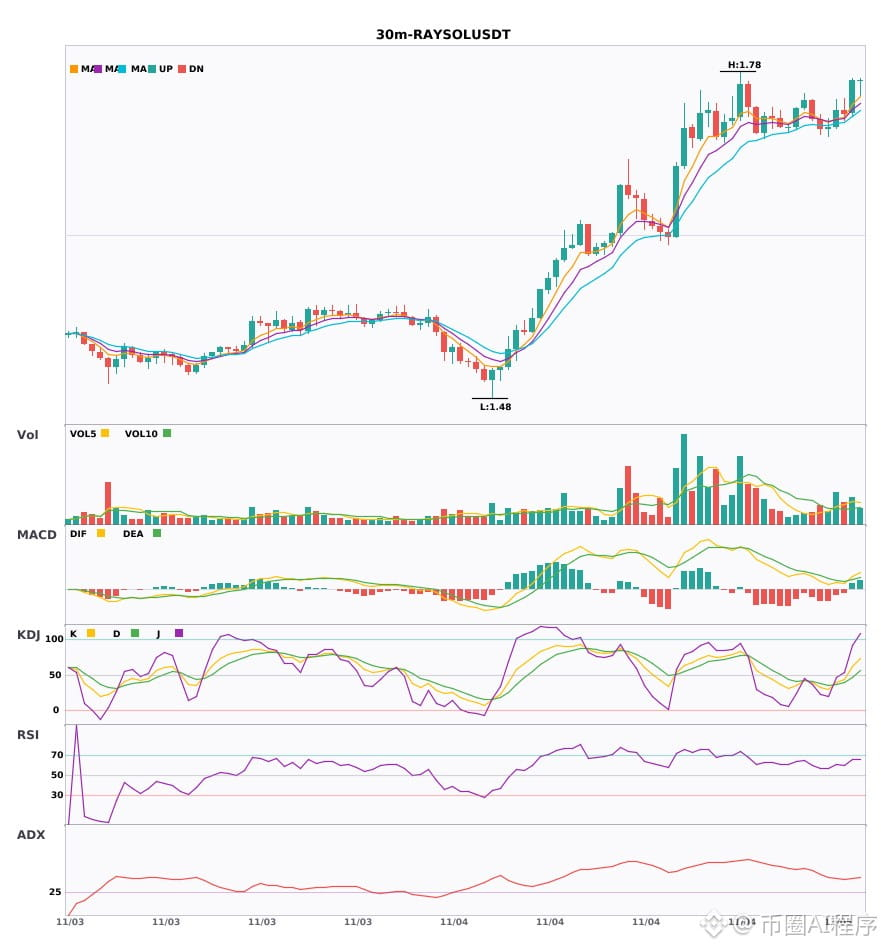
$ETH / $CXMT / $RAYSOL 30-minute bullish signals, 4-hour bullish trend confirmed 🔥
════════════════════
🔴 $ETH 30-minute bullish signal
⚠️Technical analysis: 4-hour bullish confluence confirmed | 30-minute entry: EMA5 crossed above EMA8, short-term trend turns bullish | KDJ is weak, bears have the upper hand (K: 45.2, D: 47.4) | Normal volume (1.3x)
📢Market update: Wallet Maintenance for Ethereum Network (ETH) - 2026-10-28
════════════════════
🔴 $CXMT 30-minute bullish signal
⚠️Technical analysis: 4-hour bullish confluence confirmed | 30-minute entry: MACD bullish crossover above zero, bullish momentum released | EMA5 crossed above EMA8, short-term trend turns bullish | KDJ bullish crossover, short-term outlook is bullish (K: 53.4, D: 46.9) | Volume surge (4.8x)
════════════════════
🔴 $RAYSOL 30-minute bullish signal
⚠️Technical analysis: 4-hour bullish confluence confirmed | 30-minute entry: MACD bullish crossover above zero, bullish momentum released | EMA5 > EMA8 > EMA13, bullish alignment | Increased volume (1.6x)
════════════════════
🔔 Follow for the latest market movements 🔔
#多周期共振 #ETH #CXMT #RAYSOL
📌 When trading, pay attention to whether the candlestick patterns align
$ETH / $CXMT / $RAYSOL 30-minute bullish signals, 4-hour bullish trend confirmed 🔥
════════════════════
🔴 $ETH 30-minute bullish signal
⚠️Technical analysis: 4-hour bullish confluence confirmed | 30-minute entry: EMA5 crossed above EMA8, short-term trend turns bullish | KDJ is weak, bears have the upper hand (K: 45.2, D: 47.4) | Normal volume (1.3x)
📢Market update: Wallet Maintenance for Ethereum Network (ETH) - 2026-10-28
════════════════════
🔴 $CXMT 30-minute bullish signal
⚠️Technical analysis: 4-hour bullish confluence confirmed | 30-minute entry: MACD bullish crossover above zero, bullish momentum released | EMA5 crossed above EMA8, short-term trend turns bullish | KDJ bullish crossover, short-term outlook is bullish (K: 53.4, D: 46.9) | Volume surge (4.8x)
════════════════════
🔴 $RAYSOL 30-minute bullish signal
⚠️Technical analysis: 4-hour bullish confluence confirmed | 30-minute entry: MACD bullish crossover above zero, bullish momentum released | EMA5 > EMA8 > EMA13, bullish alignment | Increased volume (1.6x)
════════════════════
🔔 Follow for the latest market movements 🔔
#多周期共振 #ETH #CXMT #RAYSOL
📌 When trading, pay attention to whether the candlestick patterns align
════════════════════
🔴 $ETH 30-minute bullish signal
⚠️Technical analysis: 4-hour bullish confluence confirmed | 30-minute entry: EMA5 crossed above EMA8, short-term trend turns bullish | KDJ is weak, bears have the upper hand (K: 45.2, D: 47.4) | Normal volume (1.3x)
📢Market update: Wallet Maintenance for Ethereum Network (ETH) - 2026-10-28
════════════════════
🔴 $CXMT 30-minute bullish signal
⚠️Technical analysis: 4-hour bullish confluence confirmed | 30-minute entry: MACD bullish crossover above zero, bullish momentum released | EMA5 crossed above EMA8, short-term trend turns bullish | KDJ bullish crossover, short-term outlook is bullish (K: 53.4, D: 46.9) | Volume surge (4.8x)
════════════════════
🔴 $RAYSOL 30-minute bullish signal
⚠️Technical analysis: 4-hour bullish confluence confirmed | 30-minute entry: MACD bullish crossover above zero, bullish momentum released | EMA5 > EMA8 > EMA13, bullish alignment | Increased volume (1.6x)
════════════════════
🔔 Follow for the latest market movements 🔔
#多周期共振 #ETH #CXMT #RAYSOL
📌 When trading, pay attention to whether the candlestick patterns align
1
·
--
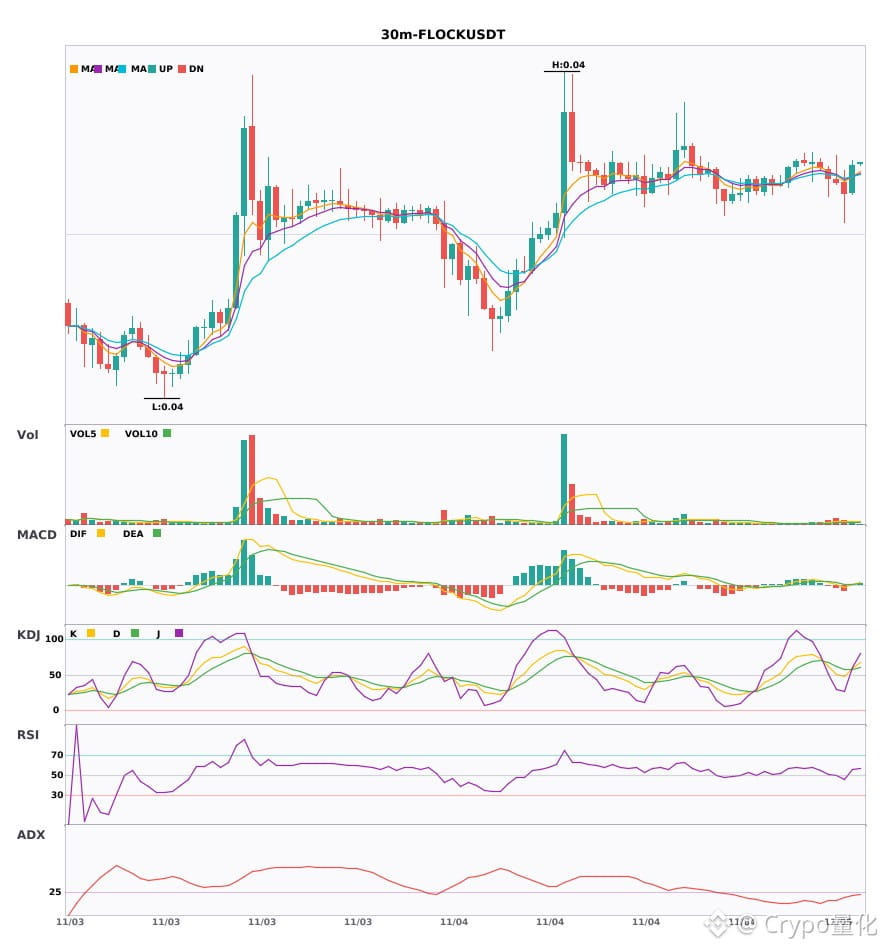
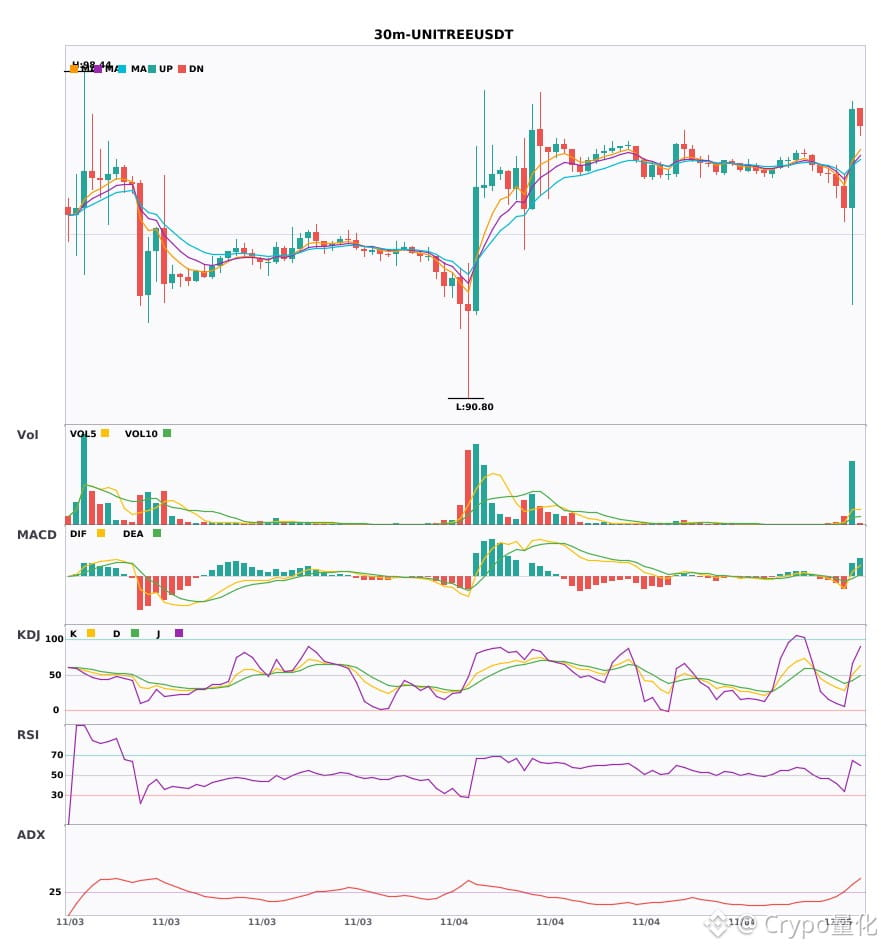
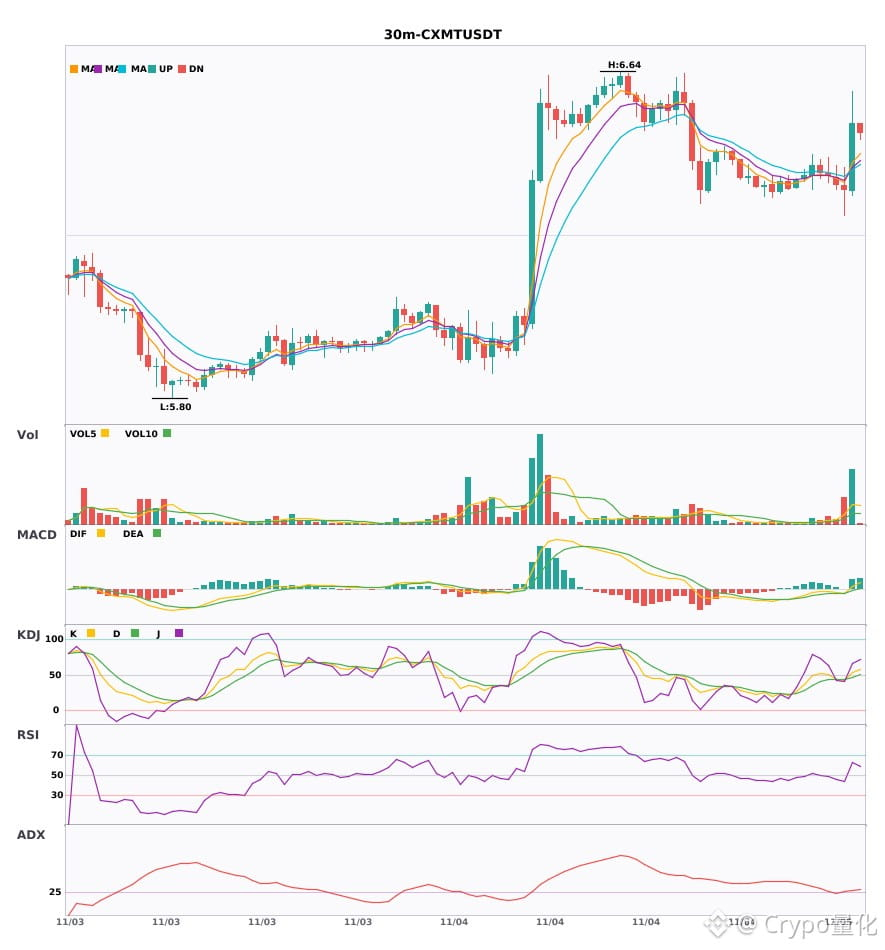
$FLOCK / $UNITREE / $CXMT 30-minute resonance turning bullish, with bullish signals appearing simultaneously 🔥
════════════════════
🔴 $FLOCK 30-minute Bullish Signal
⚠️Technical Analysis: ADX(25) Trend is forming; opportunity to participate | MACD DIF breaks above zero, trend turns bullish | Moving averages are converging and building momentum, direction soon to be chosen | KDJ golden cross, short-term bullish (K: 58.8, D: 57.8) | Volume expands (1.6x)
════════════════════
🔴 $UNITREE 30-minute Bullish Signal
⚠️Technical Analysis: ADX(40) A clear trending market | MACD golden cross above zero, bullish momentum released | EMA5 crosses above EMA8, short-term trend turns bullish | KDJ golden cross, short-term bullish (K: 50.5, D: 42.5) | Volume surges (7.9x)
════════════════════
🔴 $CXMT 30-minute Bullish Signal
⚠️Technical Analysis: ADX(29) Trend is forming; opportunity to participate | MACD golden cross above zero, bullish momentum released | EMA5 crosses above EMA8, short-term trend turns bullish | KDJ golden cross, short-term bullish (K: 53.4, D: 46.9) | Volume surges (4.8x)
════════════════════
🔔 Follow for real-time market movements 🔔
#技术分析 #FLOCK #UNITREE #CXMT
📌 When trading, pay attention to whether the candlestick pattern confirms the signal
$FLOCK / $UNITREE / $CXMT 30-minute resonance turning bullish, with bullish signals appearing simultaneously 🔥
════════════════════
🔴 $FLOCK 30-minute Bullish Signal
⚠️Technical Analysis: ADX(25) Trend is forming; opportunity to participate | MACD DIF breaks above zero, trend turns bullish | Moving averages are converging and building momentum, direction soon to be chosen | KDJ golden cross, short-term bullish (K: 58.8, D: 57.8) | Volume expands (1.6x)
════════════════════
🔴 $UNITREE 30-minute Bullish Signal
⚠️Technical Analysis: ADX(40) A clear trending market | MACD golden cross above zero, bullish momentum released | EMA5 crosses above EMA8, short-term trend turns bullish | KDJ golden cross, short-term bullish (K: 50.5, D: 42.5) | Volume surges (7.9x)
════════════════════
🔴 $CXMT 30-minute Bullish Signal
⚠️Technical Analysis: ADX(29) Trend is forming; opportunity to participate | MACD golden cross above zero, bullish momentum released | EMA5 crosses above EMA8, short-term trend turns bullish | KDJ golden cross, short-term bullish (K: 53.4, D: 46.9) | Volume surges (4.8x)
════════════════════
🔔 Follow for real-time market movements 🔔
#技术分析 #FLOCK #UNITREE #CXMT
📌 When trading, pay attention to whether the candlestick pattern confirms the signal
════════════════════
🔴 $FLOCK 30-minute Bullish Signal
⚠️Technical Analysis: ADX(25) Trend is forming; opportunity to participate | MACD DIF breaks above zero, trend turns bullish | Moving averages are converging and building momentum, direction soon to be chosen | KDJ golden cross, short-term bullish (K: 58.8, D: 57.8) | Volume expands (1.6x)
════════════════════
🔴 $UNITREE 30-minute Bullish Signal
⚠️Technical Analysis: ADX(40) A clear trending market | MACD golden cross above zero, bullish momentum released | EMA5 crosses above EMA8, short-term trend turns bullish | KDJ golden cross, short-term bullish (K: 50.5, D: 42.5) | Volume surges (7.9x)
════════════════════
🔴 $CXMT 30-minute Bullish Signal
⚠️Technical Analysis: ADX(29) Trend is forming; opportunity to participate | MACD golden cross above zero, bullish momentum released | EMA5 crosses above EMA8, short-term trend turns bullish | KDJ golden cross, short-term bullish (K: 53.4, D: 46.9) | Volume surges (4.8x)
════════════════════
🔔 Follow for real-time market movements 🔔
#技术分析 #FLOCK #UNITREE #CXMT
📌 When trading, pay attention to whether the candlestick pattern confirms the signal
14

·
--
CXMT’s chart looks powerful, but counterintuitively, the next pullback is what really matters.
Binance TradFi Perpetuals (traditional finance assets; high gap risk outside trading hours) | CXMT is up 11.20% over the past 24 hours, and momentum remains strong. For the next leg, watch for a pullback first. Current price is around 6.574, with 24h trading volume around 31.2152 million; the 30m volume ratio is only 0.2x, suggesting weak participation. Funding and positioning: 65% of accounts are long; the taker buy/sell ratio is 1.02 (taker activity is close to balanced); 30m open interest is up 0.3%; funding rate is -0.0139%.
Reference indicators: the 30m ATR trend-band level is 6.385778. Price is above it, indicating the structure leans toward trend continuation. The 30m KDJ is 45.47/56.08/24.25, suggesting short-term disagreement remains in the middle range.
The disagreement here is quite specific: some see funds clustering into the trade, while others expect short-term profit-taking. I’m more interested in whether the taker buy/sell ratio of 1.02 can move out of the balance zone around 1. If it can’t, even strong enthusiasm could easily turn into a spike followed by a pullback.
#CXMT #UnusualMoveAlert
CXMT’s chart looks powerful, but counterintuitively, the next pullback is what really matters.
Binance TradFi Perpetuals (traditional finance assets; high gap risk outside trading hours) | CXMT is up 11.20% over the past 24 hours, and momentum remains strong. For the next leg, watch for a pullback first. Current price is around 6.574, with 24h trading volume around 31.2152 million; the 30m volume ratio is only 0.2x, suggesting weak participation. Funding and positioning: 65% of accounts are long; the taker buy/sell ratio is 1.02 (taker activity is close to balanced); 30m open interest is up 0.3%; funding rate is -0.0139%.
Reference indicators: the 30m ATR trend-band level is 6.385778. Price is above it, indicating the structure leans toward trend continuation. The 30m KDJ is 45.47/56.08/24.25, suggesting short-term disagreement remains in the middle range.
The disagreement here is quite specific: some see funds clustering into the trade, while others expect short-term profit-taking. I’m more interested in whether the taker buy/sell ratio of 1.02 can move out of the balance zone around 1. If it can’t, even strong enthusiasm could easily turn into a spike followed by a pullback.
#CXMT #UnusualMoveAlert
Binance TradFi Perpetuals (traditional finance assets; high gap risk outside trading hours) | CXMT is up 11.20% over the past 24 hours, and momentum remains strong. For the next leg, watch for a pullback first. Current price is around 6.574, with 24h trading volume around 31.2152 million; the 30m volume ratio is only 0.2x, suggesting weak participation. Funding and positioning: 65% of accounts are long; the taker buy/sell ratio is 1.02 (taker activity is close to balanced); 30m open interest is up 0.3%; funding rate is -0.0139%.
Reference indicators: the 30m ATR trend-band level is 6.385778. Price is above it, indicating the structure leans toward trend continuation. The 30m KDJ is 45.47/56.08/24.25, suggesting short-term disagreement remains in the middle range.
The disagreement here is quite specific: some see funds clustering into the trade, while others expect short-term profit-taking. I’m more interested in whether the taker buy/sell ratio of 1.02 can move out of the balance zone around 1. If it can’t, even strong enthusiasm could easily turn into a spike followed by a pullback.
#CXMT #UnusualMoveAlert
16
·
--
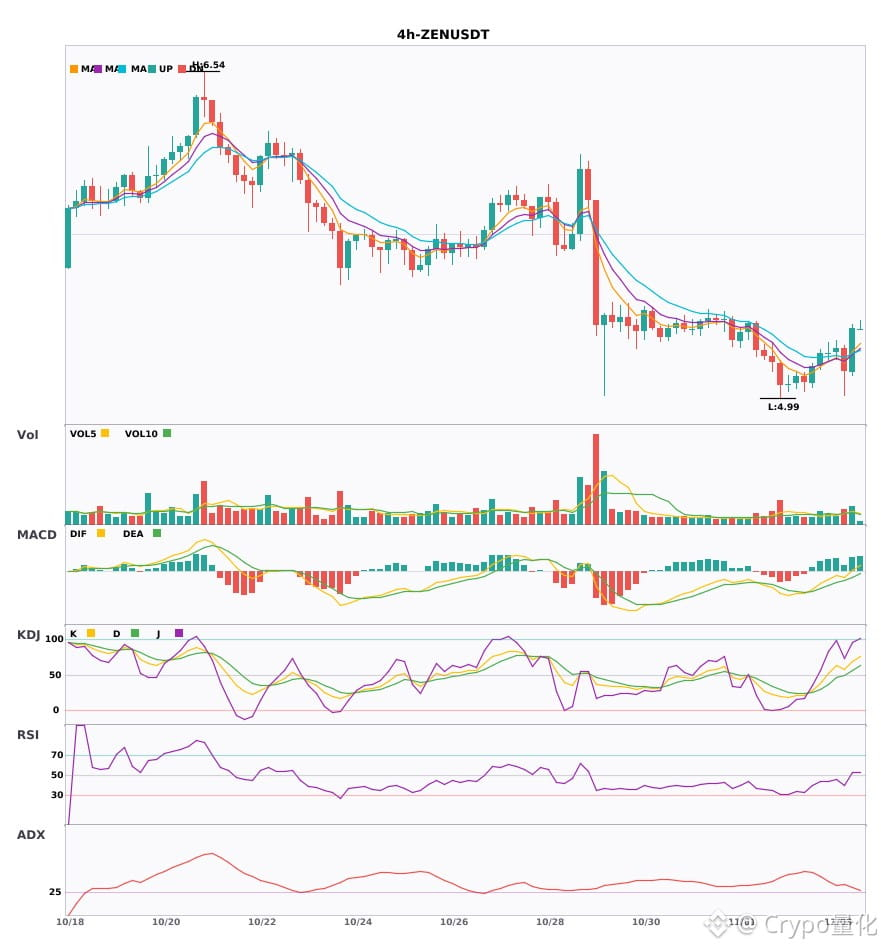
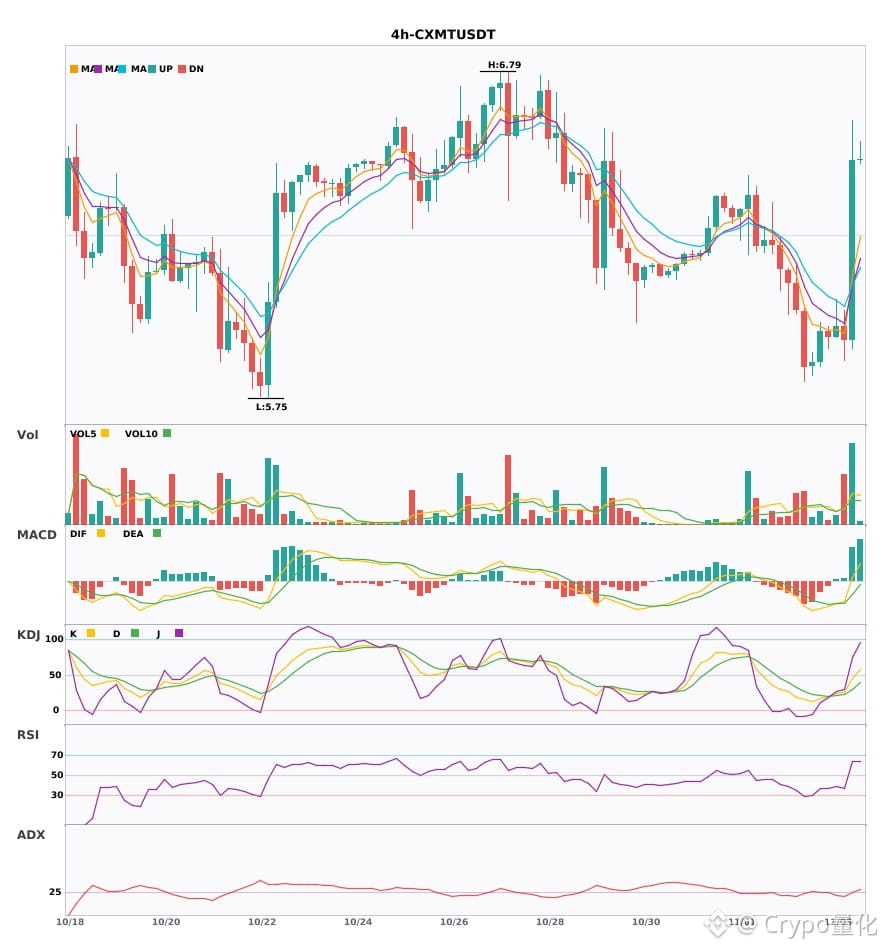
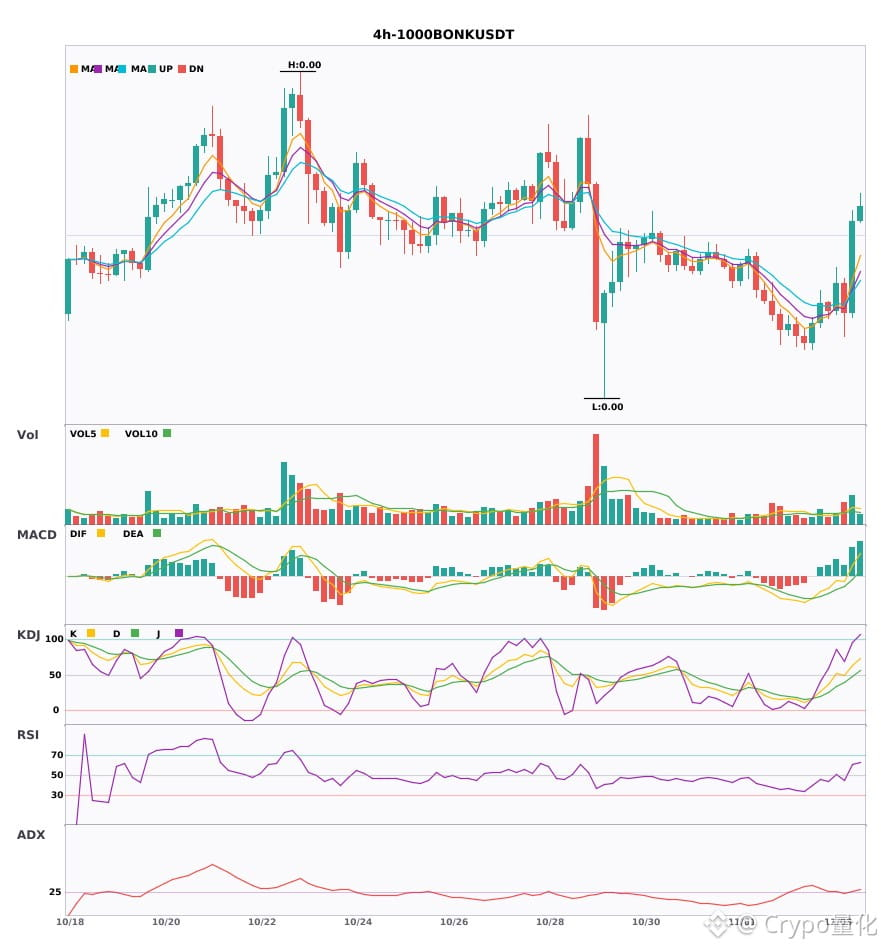
$ZEN / $CXMT / $1000BONK: 4-hour technical indicators are strengthening in sync—which has greater breakout potential? 🔥
════════════════════
🔴 $ZEN 4-hour bullish signal
⚠️Technical analysis: ADX(30): trend is forming, potential entry | MACD DIF breaks above zero, trend turns bullish | EMA5 crosses above EMA8, short-term trend turns bullish | KDJ is strong, bulls have the upper hand (K: 69.5, D: 56.3) | Volume increases (1.5x)
════════════════════
🔴 $CXMT 4-hour bullish signal
⚠️Technical analysis: ADX(27): trend is forming, potential entry | MACD DIF breaks above zero, trend turns bullish | EMA5 crosses above EMA8, short-term trend turns bullish | KDJ is weak, bears have the upper hand (K: 45.0, D: 30.1) | Volume surges (3.3x)
════════════════════
🔴 $1000BONK 4-hour bullish signal
⚠️Technical analysis: ADX(29): trend is forming, potential entry | MACD DIF breaks above zero, trend turns bullish | EMA5 > EMA8 > EMA13, bullish alignment | Volume increases (2.2x)
════════════════════
🔔 Follow for the latest market moves 🔔
#技术分析 #ZEN #CXMT #1000BONK
📌 When trading, pay attention to whether the candlestick pattern meets expectations
$ZEN / $CXMT / $1000BONK: 4-hour technical indicators are strengthening in sync—which has greater breakout potential? 🔥
════════════════════
🔴 $ZEN 4-hour bullish signal
⚠️Technical analysis: ADX(30): trend is forming, potential entry | MACD DIF breaks above zero, trend turns bullish | EMA5 crosses above EMA8, short-term trend turns bullish | KDJ is strong, bulls have the upper hand (K: 69.5, D: 56.3) | Volume increases (1.5x)
════════════════════
🔴 $CXMT 4-hour bullish signal
⚠️Technical analysis: ADX(27): trend is forming, potential entry | MACD DIF breaks above zero, trend turns bullish | EMA5 crosses above EMA8, short-term trend turns bullish | KDJ is weak, bears have the upper hand (K: 45.0, D: 30.1) | Volume surges (3.3x)
════════════════════
🔴 $1000BONK 4-hour bullish signal
⚠️Technical analysis: ADX(29): trend is forming, potential entry | MACD DIF breaks above zero, trend turns bullish | EMA5 > EMA8 > EMA13, bullish alignment | Volume increases (2.2x)
════════════════════
🔔 Follow for the latest market moves 🔔
#技术分析 #ZEN #CXMT #1000BONK
📌 When trading, pay attention to whether the candlestick pattern meets expectations
════════════════════
🔴 $ZEN 4-hour bullish signal
⚠️Technical analysis: ADX(30): trend is forming, potential entry | MACD DIF breaks above zero, trend turns bullish | EMA5 crosses above EMA8, short-term trend turns bullish | KDJ is strong, bulls have the upper hand (K: 69.5, D: 56.3) | Volume increases (1.5x)
════════════════════
🔴 $CXMT 4-hour bullish signal
⚠️Technical analysis: ADX(27): trend is forming, potential entry | MACD DIF breaks above zero, trend turns bullish | EMA5 crosses above EMA8, short-term trend turns bullish | KDJ is weak, bears have the upper hand (K: 45.0, D: 30.1) | Volume surges (3.3x)
════════════════════
🔴 $1000BONK 4-hour bullish signal
⚠️Technical analysis: ADX(29): trend is forming, potential entry | MACD DIF breaks above zero, trend turns bullish | EMA5 > EMA8 > EMA13, bullish alignment | Volume increases (2.2x)
════════════════════
🔔 Follow for the latest market moves 🔔
#技术分析 #ZEN #CXMT #1000BONK
📌 When trading, pay attention to whether the candlestick pattern meets expectations
33
·
--
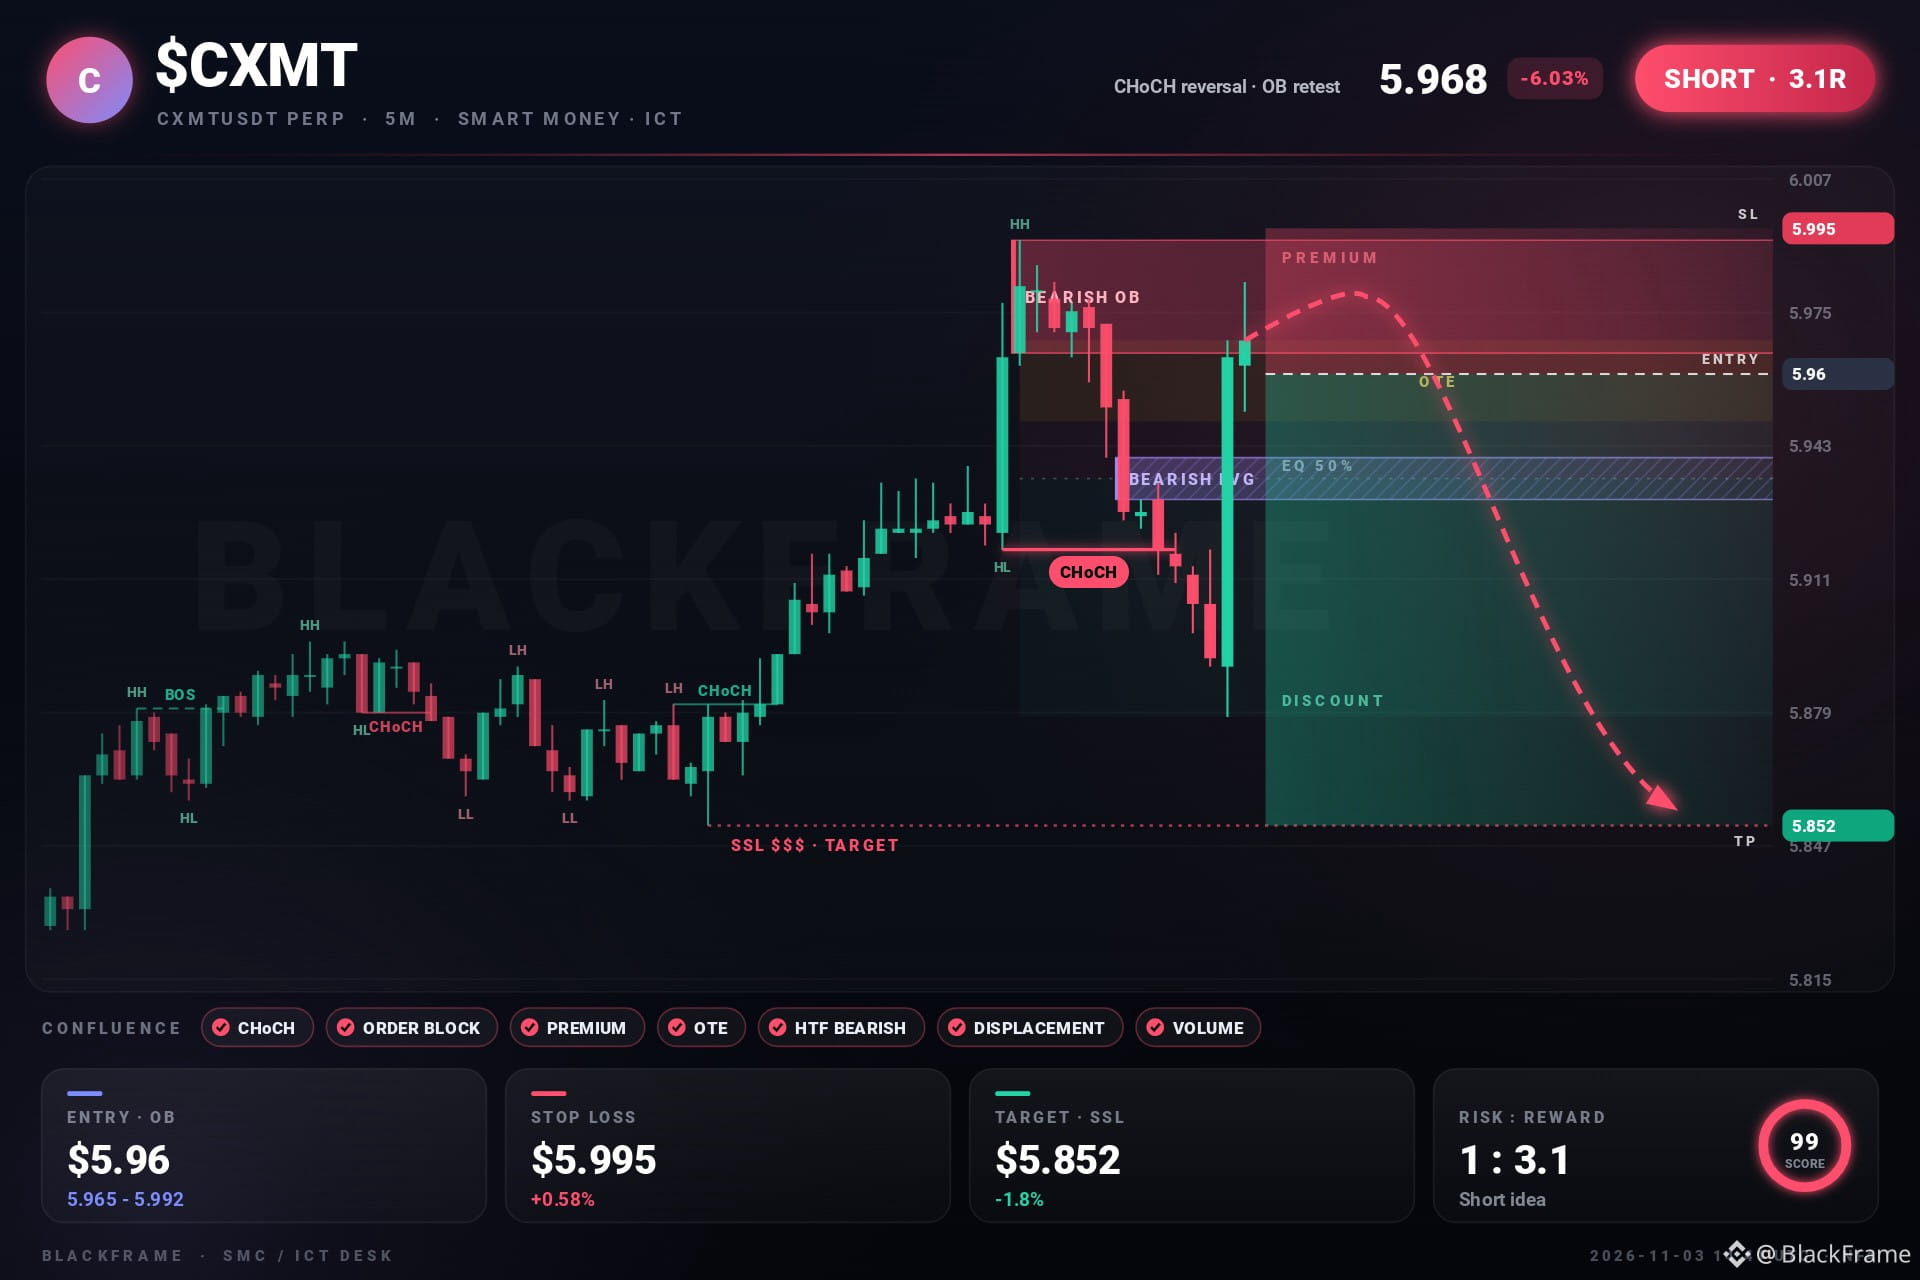
🔴 CHoCH down on $CXMT. Sellers took control
Entry $5.96 | SL $5.995 | TP $5.852
Price is back in the $5.965-5.992 supply zone. That is the entry.
#CXMT #TradingSignals · NFA
🔴 CHoCH down on $CXMT . Sellers took control
Entry $5.96 | SL $5.995 | TP $5.852
Price is back in the $5.965-5.992 supply zone. That is the entry.
#CXMT #TradingSignals · NFA
Entry $5.96 | SL $5.995 | TP $5.852
Price is back in the $5.965-5.992 supply zone. That is the entry.
#CXMT #TradingSignals · NFA
315
·
--
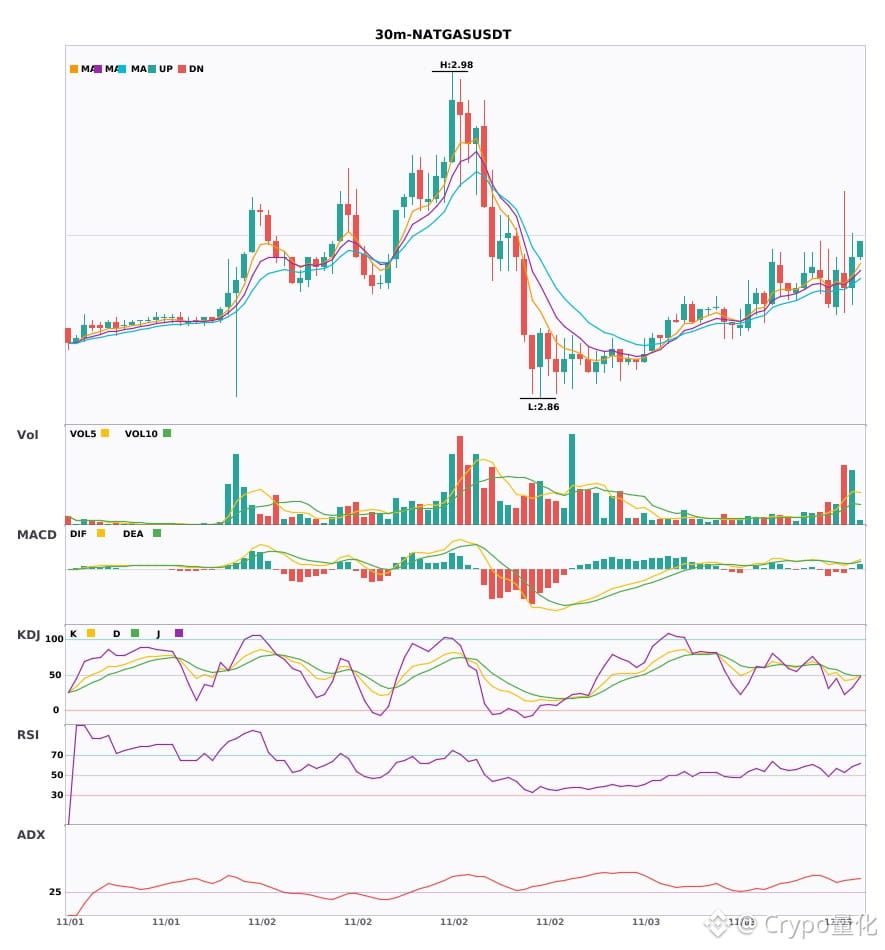
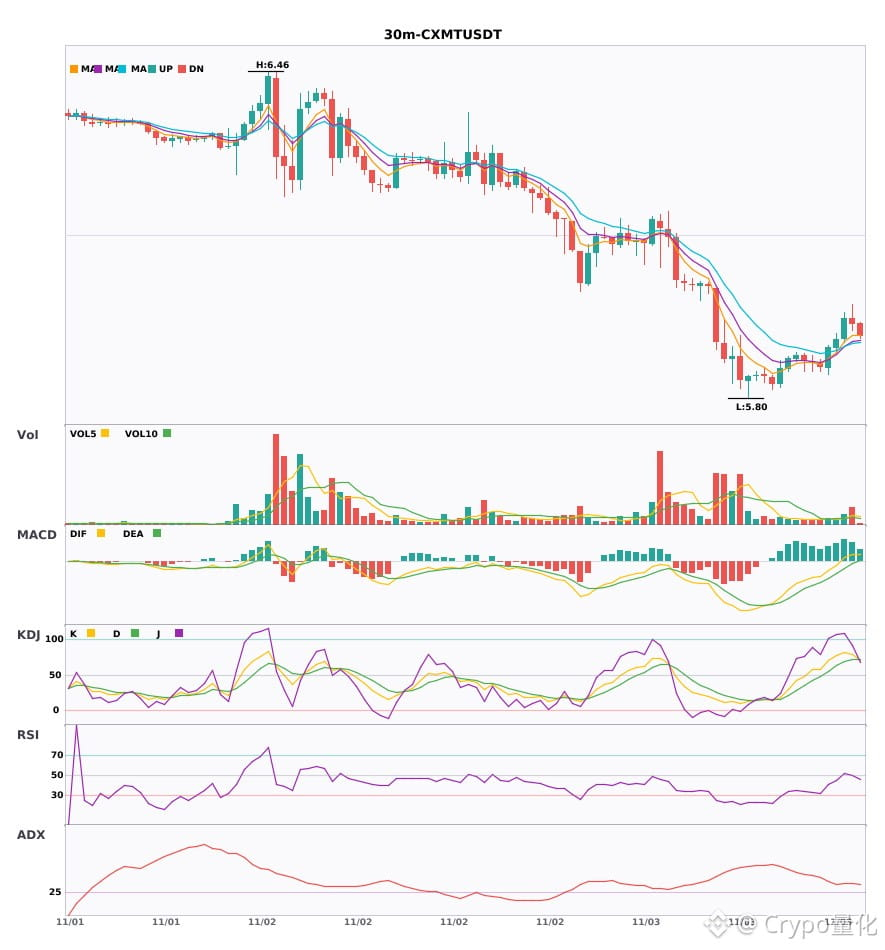
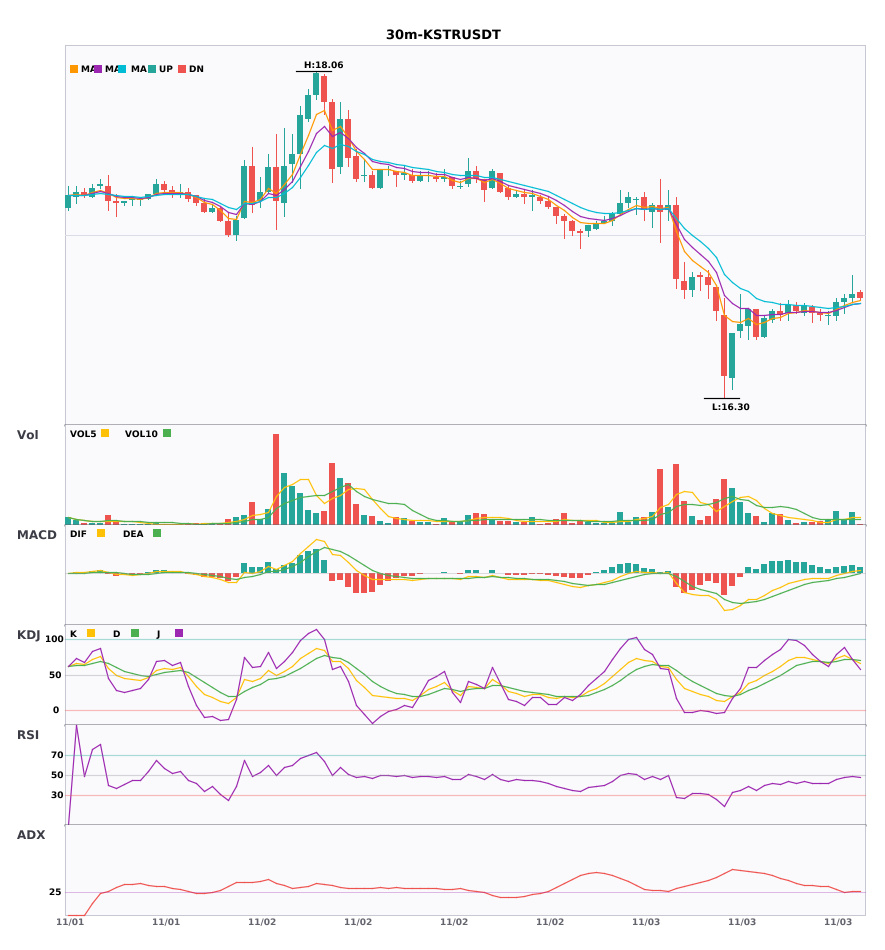
Three 30-minute bullish signals appeared simultaneously: $NATGAS / $CXMT / $KSTR🔥
════════════════════
🔴 $NATGAS 30-minute bullish signal
⚠️Technical analysis: ADX(40): clear trending market | MACD golden cross above zero, bullish momentum released | EMA5 > EMA8 > EMA13: bullish alignment | KDJ moving weakly, bears in control (K: 44.2, D: 49.9) | Volume surge (3.5x)
════════════════════
🔴 $CXMT 30-minute bullish signal
⚠️Technical analysis: ADX(36): clear trending market | MACD trending bullish, strong trend, momentum weakening | EMA5 > EMA8 > EMA13: bullish alignment | KDJ moving strongly, bulls in control (K: 78.4, D: 72.2) | Volume increase (2.4x)
════════════════════
🔴 $KSTR 30-minute bullish signal
⚠️Technical analysis: ADX(25): trend is forming; opportunity to participate | MACD DIF breaks above the zero line, trend turns bullish | Moving averages converging and building momentum, direction about to be chosen | KDJ moving strongly, bulls in control (K: 72.2, D: 72.0) | Volume increase (2.2x)
════════════════════
🔔 Follow for first-hand market updates 🔔
#技术分析 #NATGAS #CXMT #KSTR
📌 When trading, check whether the candlestick pattern confirms the setup
Three 30-minute bullish signals appeared simultaneously: $NATGAS / $CXMT / $KSTR 🔥
════════════════════
🔴 $NATGAS 30-minute bullish signal
⚠️Technical analysis: ADX(40): clear trending market | MACD golden cross above zero, bullish momentum released | EMA5 > EMA8 > EMA13: bullish alignment | KDJ moving weakly, bears in control (K: 44.2, D: 49.9) | Volume surge (3.5x)
════════════════════
🔴 $CXMT 30-minute bullish signal
⚠️Technical analysis: ADX(36): clear trending market | MACD trending bullish, strong trend, momentum weakening | EMA5 > EMA8 > EMA13: bullish alignment | KDJ moving strongly, bulls in control (K: 78.4, D: 72.2) | Volume increase (2.4x)
════════════════════
🔴 $KSTR 30-minute bullish signal
⚠️Technical analysis: ADX(25): trend is forming; opportunity to participate | MACD DIF breaks above the zero line, trend turns bullish | Moving averages converging and building momentum, direction about to be chosen | KDJ moving strongly, bulls in control (K: 72.2, D: 72.0) | Volume increase (2.2x)
════════════════════
🔔 Follow for first-hand market updates 🔔
#技术分析 #NATGAS #CXMT #KSTR
📌 When trading, check whether the candlestick pattern confirms the setup
════════════════════
🔴 $NATGAS 30-minute bullish signal
⚠️Technical analysis: ADX(40): clear trending market | MACD golden cross above zero, bullish momentum released | EMA5 > EMA8 > EMA13: bullish alignment | KDJ moving weakly, bears in control (K: 44.2, D: 49.9) | Volume surge (3.5x)
════════════════════
🔴 $CXMT 30-minute bullish signal
⚠️Technical analysis: ADX(36): clear trending market | MACD trending bullish, strong trend, momentum weakening | EMA5 > EMA8 > EMA13: bullish alignment | KDJ moving strongly, bulls in control (K: 78.4, D: 72.2) | Volume increase (2.4x)
════════════════════
🔴 $KSTR 30-minute bullish signal
⚠️Technical analysis: ADX(25): trend is forming; opportunity to participate | MACD DIF breaks above the zero line, trend turns bullish | Moving averages converging and building momentum, direction about to be chosen | KDJ moving strongly, bulls in control (K: 72.2, D: 72.0) | Volume increase (2.2x)
════════════════════
🔔 Follow for first-hand market updates 🔔
#技术分析 #NATGAS #CXMT #KSTR
📌 When trading, check whether the candlestick pattern confirms the setup
3
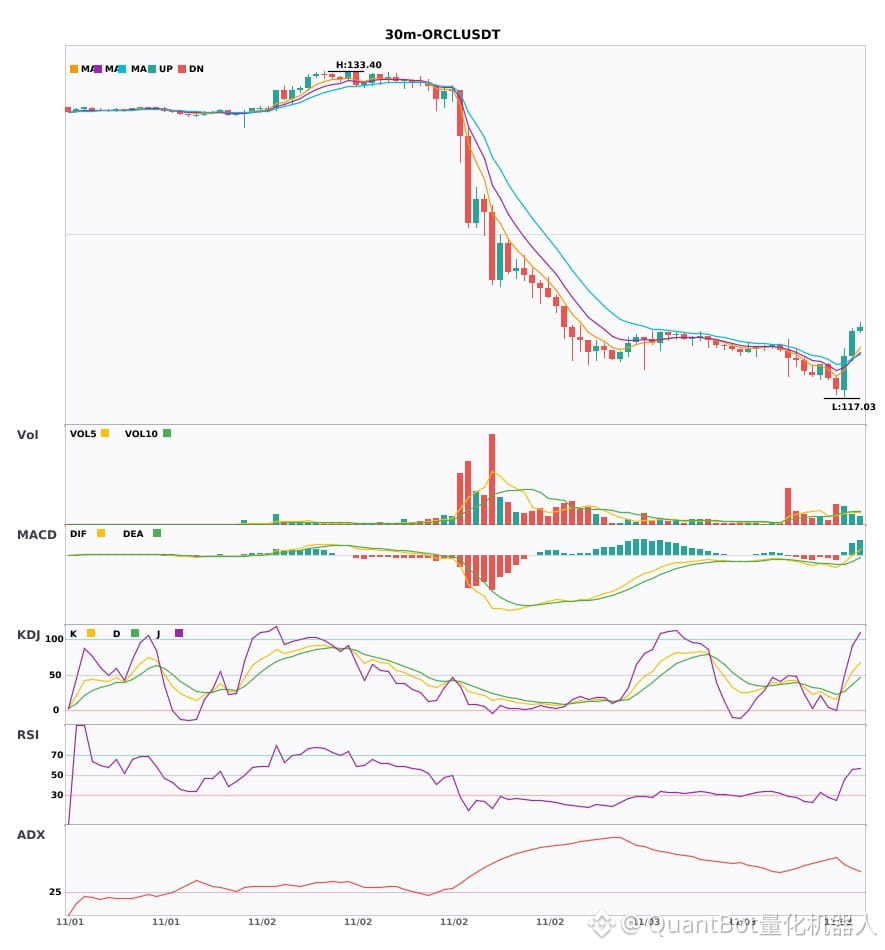
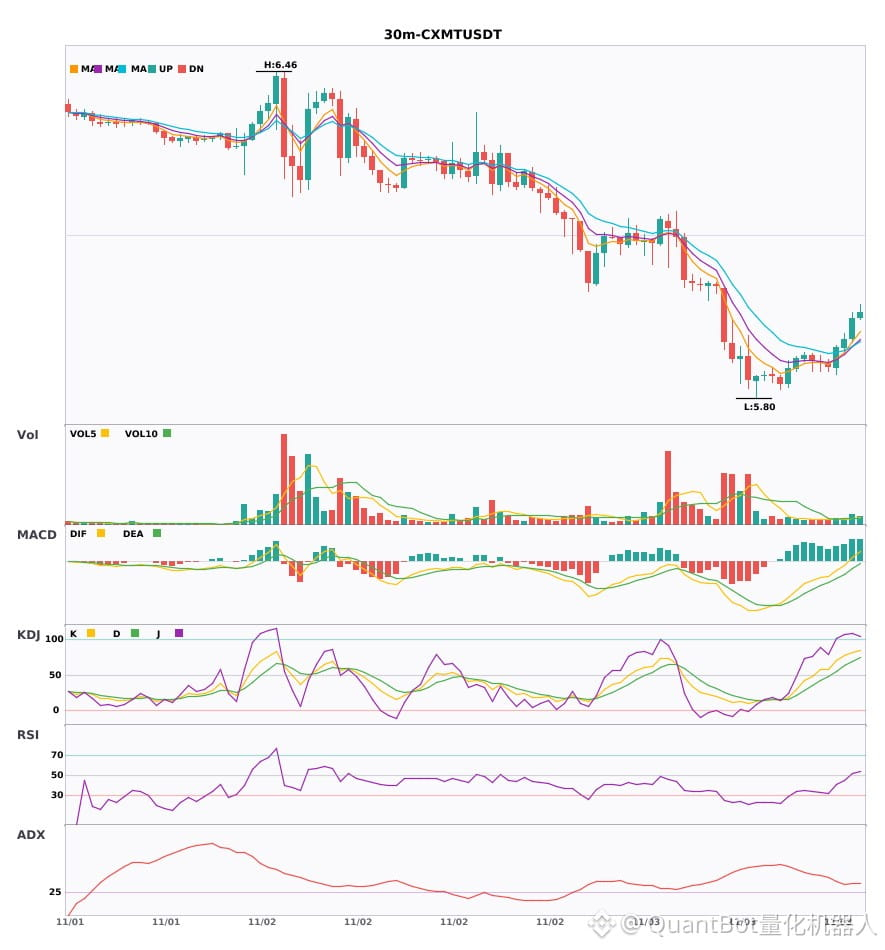
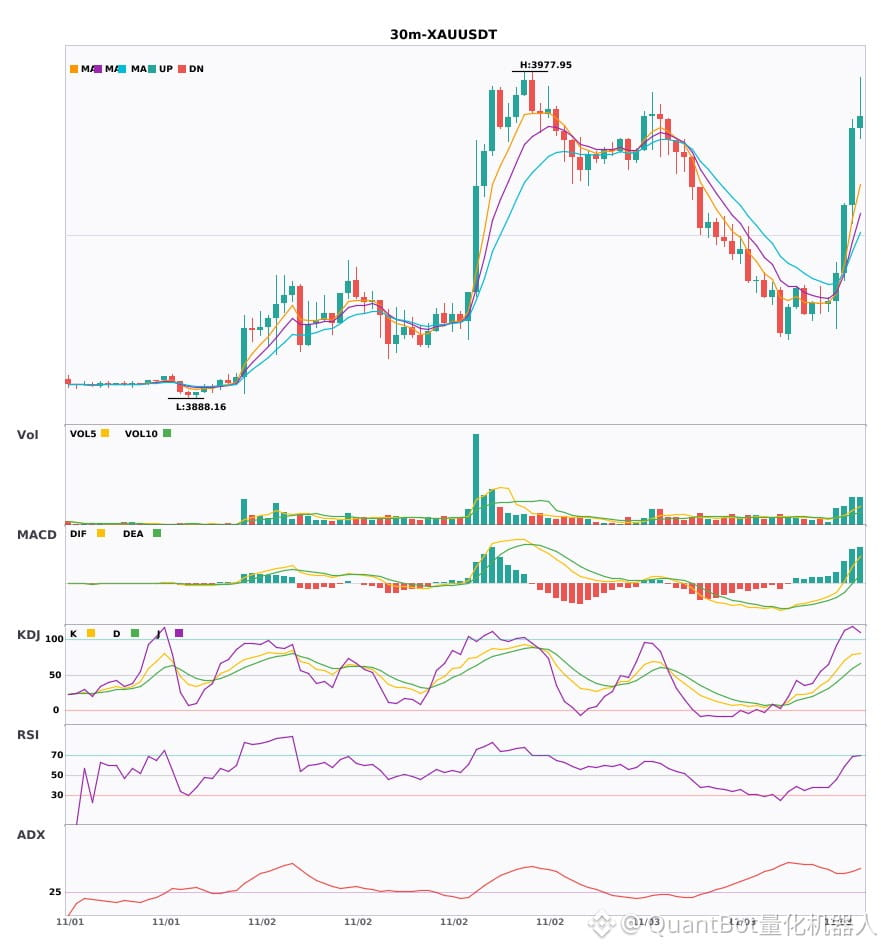
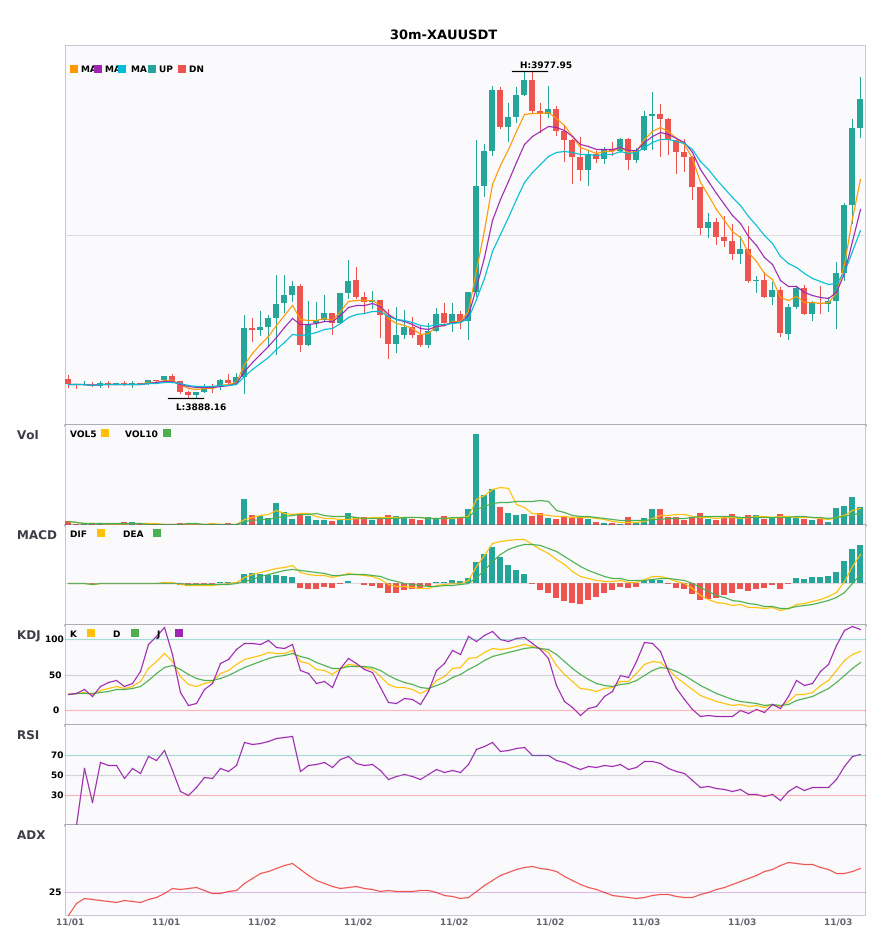
Three 30-minute bullish signals appeared simultaneously: $ORCL / $CXMT / $XAU
📈 $ORCL | 30-minute Bullish Signal
━━━━━━━━━━━━━━━━━━
Technical Analysis: ADX(51) Very strong trend (watch out for an overbought pullback) | MACDDIF broke above the zero line, trend turned bullish | EMA5 crossed above EMA8, short-term trend turned bullish | Volume increased (1.6x)
Price Change: 1.0600%
📈 $CXMT | 30-minute Bullish Signal
━━━━━━━━━━━━━━━━━━
Technical Analysis: ADX(34) Clear trending market | MACDDIF broke above the zero line, trend turned bullish | Moving averages are converging, building momentum; a directional move is imminent | KDJ is running strong, with bulls in control (K: 81.9, D: 69.1) | Volume increased (1.7x)
Price Change: 0.6900%
📈 $XAU | 30-minute Bullish Signal
━━━━━━━━━━━━━━━━━━
Technical Analysis: ADX(51) Very strong trend (watch out for an overbought pullback) | MACD is bullish, trend is strong, and momentum is increasing | EMA5 > EMA8 > EMA13, bullish alignment | KDJ is running strong, with bulls in control (K: 78.9, D: 59.4) | Volume surged (2.6x)
Price Change: 0.5400%
━━━━━━━━━━━━━━━━━━
#技术分析 #ORCL #CXMT #XAU
📌 The above is for reference only and does not constitute investment advice
Three 30-minute bullish signals appeared simultaneously: $ORCL / $CXMT / $XAU
📈 $ORCL | 30-minute Bullish Signal
━━━━━━━━━━━━━━━━━━
Technical Analysis: ADX(51) Very strong trend (watch out for an overbought pullback) | MACDDIF broke above the zero line, trend turned bullish | EMA5 crossed above EMA8, short-term trend turned bullish | Volume increased (1.6x)
Price Change: 1.0600%
📈 $CXMT | 30-minute Bullish Signal
━━━━━━━━━━━━━━━━━━
Technical Analysis: ADX(34) Clear trending market | MACDDIF broke above the zero line, trend turned bullish | Moving averages are converging, building momentum; a directional move is imminent | KDJ is running strong, with bulls in control (K: 81.9, D: 69.1) | Volume increased (1.7x)
Price Change: 0.6900%
📈 $XAU | 30-minute Bullish Signal
━━━━━━━━━━━━━━━━━━
Technical Analysis: ADX(51) Very strong trend (watch out for an overbought pullback) | MACD is bullish, trend is strong, and momentum is increasing | EMA5 > EMA8 > EMA13, bullish alignment | KDJ is running strong, with bulls in control (K: 78.9, D: 59.4) | Volume surged (2.6x)
Price Change: 0.5400%
━━━━━━━━━━━━━━━━━━
#技术分析 #ORCL #CXMT #XAU
📌 The above is for reference only and does not constitute investment advice
📈 $ORCL | 30-minute Bullish Signal
━━━━━━━━━━━━━━━━━━
Technical Analysis: ADX(51) Very strong trend (watch out for an overbought pullback) | MACDDIF broke above the zero line, trend turned bullish | EMA5 crossed above EMA8, short-term trend turned bullish | Volume increased (1.6x)
Price Change: 1.0600%
📈 $CXMT | 30-minute Bullish Signal
━━━━━━━━━━━━━━━━━━
Technical Analysis: ADX(34) Clear trending market | MACDDIF broke above the zero line, trend turned bullish | Moving averages are converging, building momentum; a directional move is imminent | KDJ is running strong, with bulls in control (K: 81.9, D: 69.1) | Volume increased (1.7x)
Price Change: 0.6900%
📈 $XAU | 30-minute Bullish Signal
━━━━━━━━━━━━━━━━━━
Technical Analysis: ADX(51) Very strong trend (watch out for an overbought pullback) | MACD is bullish, trend is strong, and momentum is increasing | EMA5 > EMA8 > EMA13, bullish alignment | KDJ is running strong, with bulls in control (K: 78.9, D: 59.4) | Volume surged (2.6x)
Price Change: 0.5400%
━━━━━━━━━━━━━━━━━━
#技术分析 #ORCL #CXMT #XAU
📌 The above is for reference only and does not constitute investment advice
20
·
--
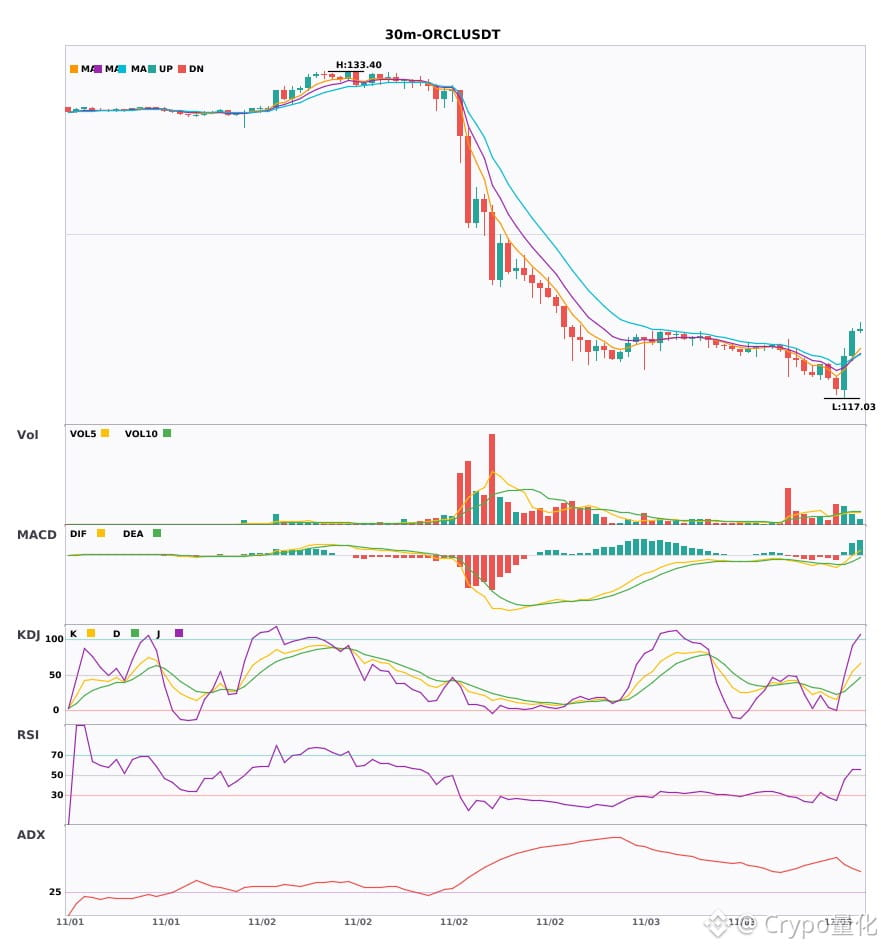
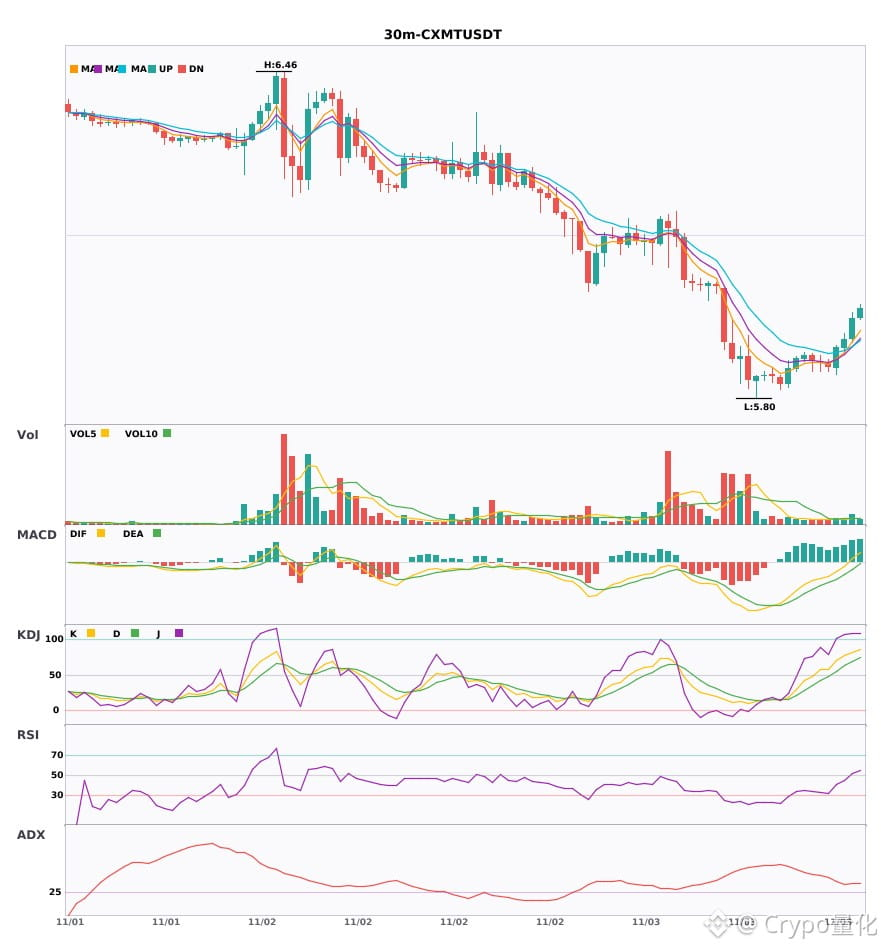
$ORCL / $CXMT / $XAU are all strengthening on the 30-minute technical charts. Which has more explosive potential?🔥
════════════════════
🔴 $ORCL 30-minute bullish signal
⚠️Technical analysis: ADX (51), very strong trend (watch for an overheated pullback) | MACD DIF breaks above zero, trend turns bullish | EMA5 crosses above EMA8, short-term trend turns bullish | Volume increases (1.6x)
════════════════════
🔴 $CXMT 30-minute bullish signal
⚠️Technical analysis: ADX (34), clearly trending market | MACD DIF breaks above zero, trend turns bullish | Moving averages converge and build momentum, direction soon to be chosen | KDJ is running strong, bulls have the upper hand (K: 81.9, D: 69.1) | Volume increases (1.7x)
════════════════════
🔴 $XAU 30-minute bullish signal
⚠️Technical analysis: ADX (51), very strong trend (watch for an overheated pullback) | MACD is bullish, trend is strong, momentum is increasing | EMA5 > EMA8 > EMA13, bullish alignment | KDJ is running strong, bulls have the upper hand (K: 78.9, D: 59.4) | Volume surges (2.6x)
════════════════════
🔔 Follow for first-hand market alerts 🔔
#技术分析 #ORCL #CXMT #XAU
📌 When trading, pay attention to whether the candlestick patterns confirm the setup
$ORCL / $CXMT / $XAU are all strengthening on the 30-minute technical charts. Which has more explosive potential?🔥
════════════════════
🔴 $ORCL 30-minute bullish signal
⚠️Technical analysis: ADX (51), very strong trend (watch for an overheated pullback) | MACD DIF breaks above zero, trend turns bullish | EMA5 crosses above EMA8, short-term trend turns bullish | Volume increases (1.6x)
════════════════════
🔴 $CXMT 30-minute bullish signal
⚠️Technical analysis: ADX (34), clearly trending market | MACD DIF breaks above zero, trend turns bullish | Moving averages converge and build momentum, direction soon to be chosen | KDJ is running strong, bulls have the upper hand (K: 81.9, D: 69.1) | Volume increases (1.7x)
════════════════════
🔴 $XAU 30-minute bullish signal
⚠️Technical analysis: ADX (51), very strong trend (watch for an overheated pullback) | MACD is bullish, trend is strong, momentum is increasing | EMA5 > EMA8 > EMA13, bullish alignment | KDJ is running strong, bulls have the upper hand (K: 78.9, D: 59.4) | Volume surges (2.6x)
════════════════════
🔔 Follow for first-hand market alerts 🔔
#技术分析 #ORCL #CXMT #XAU
📌 When trading, pay attention to whether the candlestick patterns confirm the setup
════════════════════
🔴 $ORCL 30-minute bullish signal
⚠️Technical analysis: ADX (51), very strong trend (watch for an overheated pullback) | MACD DIF breaks above zero, trend turns bullish | EMA5 crosses above EMA8, short-term trend turns bullish | Volume increases (1.6x)
════════════════════
🔴 $CXMT 30-minute bullish signal
⚠️Technical analysis: ADX (34), clearly trending market | MACD DIF breaks above zero, trend turns bullish | Moving averages converge and build momentum, direction soon to be chosen | KDJ is running strong, bulls have the upper hand (K: 81.9, D: 69.1) | Volume increases (1.7x)
════════════════════
🔴 $XAU 30-minute bullish signal
⚠️Technical analysis: ADX (51), very strong trend (watch for an overheated pullback) | MACD is bullish, trend is strong, momentum is increasing | EMA5 > EMA8 > EMA13, bullish alignment | KDJ is running strong, bulls have the upper hand (K: 78.9, D: 59.4) | Volume surges (2.6x)
════════════════════
🔔 Follow for first-hand market alerts 🔔
#技术分析 #ORCL #CXMT #XAU
📌 When trading, pay attention to whether the candlestick patterns confirm the setup
14
·
--
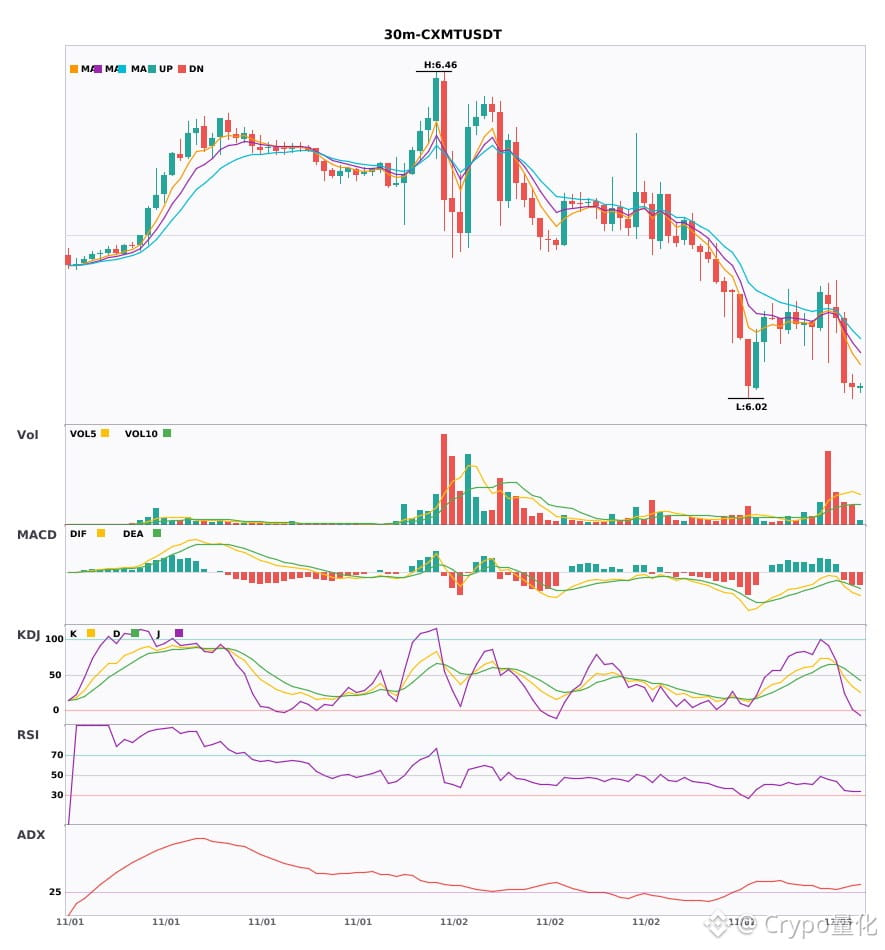
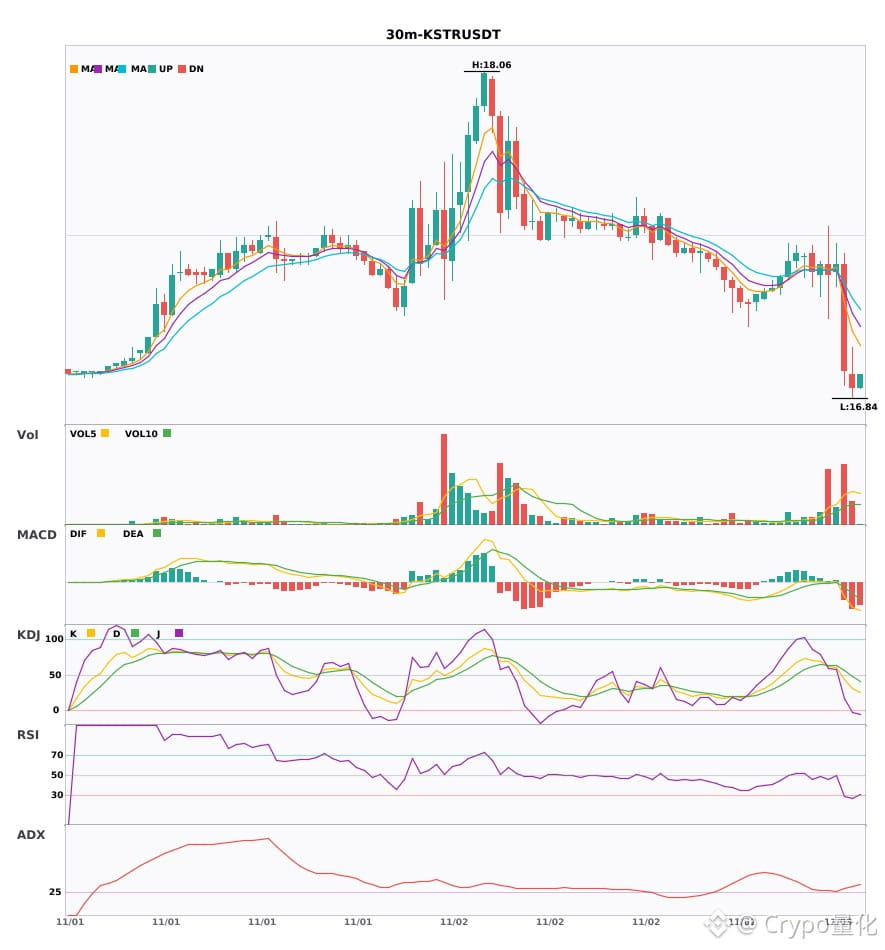
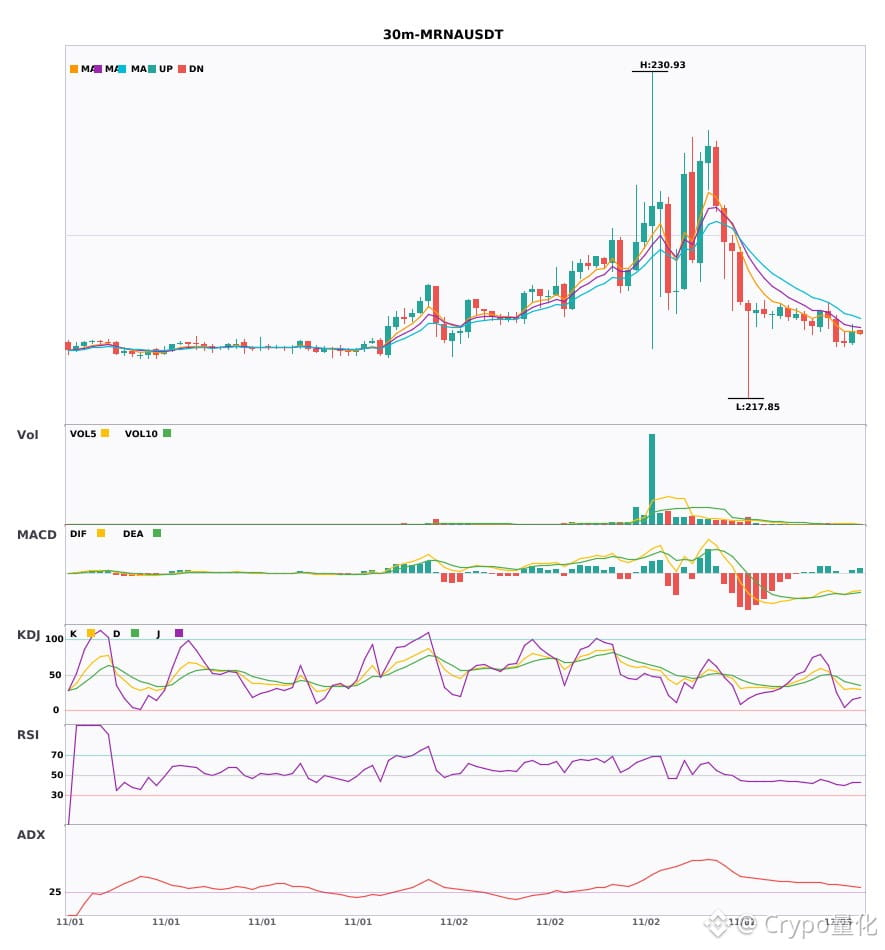
3 30-minute bearish alerts: $CXMT / $KSTR / $MRNA🔥
════════════════════
🟢 $CXMT 30-minute bearish signal
⚠️Technical analysis: ADX(30) Trend is forming; opportunity to participate | MACD bearish crossover below zero; bearish momentum accelerating | EMA5 crossed below EMA8; short-term outlook turns bearish | KDJ bearish crossover; short-term outlook is bearish (K: 47.2, D: 59.1) | Volume increased (1.9x)
════════════════════
🟢 $KSTR 30-minute bearish signal
⚠️Technical analysis: ADX(31) Clear trending market | MACD bearish crossover below zero; bearish momentum accelerating | EMA5 crossed below EMA8; short-term outlook turns bearish | Volume surged (3.3x)
════════════════════
🟢 $MRNA 30-minute bearish signal
⚠️Technical analysis: ADX(36) Clear trending market | MACD bearish crossover below zero; bearish momentum accelerating | EMA5 < EMA8 < EMA13; bearish alignment | KDJ moving in weak territory, with bears in control (K: 29.1, D: 41.4) | Volume increased (1.5x)
════════════════════
🔔 Follow to get firsthand market alerts 🔔
#技术分析 #CXMT #KSTR #MRNA
📌 When trading, pay attention to whether the candlestick pattern confirms the setup
3 30-minute bearish alerts: $CXMT / $KSTR / $MRNA 🔥
════════════════════
🟢 $CXMT 30-minute bearish signal
⚠️Technical analysis: ADX(30) Trend is forming; opportunity to participate | MACD bearish crossover below zero; bearish momentum accelerating | EMA5 crossed below EMA8; short-term outlook turns bearish | KDJ bearish crossover; short-term outlook is bearish (K: 47.2, D: 59.1) | Volume increased (1.9x)
════════════════════
🟢 $KSTR 30-minute bearish signal
⚠️Technical analysis: ADX(31) Clear trending market | MACD bearish crossover below zero; bearish momentum accelerating | EMA5 crossed below EMA8; short-term outlook turns bearish | Volume surged (3.3x)
════════════════════
🟢 $MRNA 30-minute bearish signal
⚠️Technical analysis: ADX(36) Clear trending market | MACD bearish crossover below zero; bearish momentum accelerating | EMA5 < EMA8 < EMA13; bearish alignment | KDJ moving in weak territory, with bears in control (K: 29.1, D: 41.4) | Volume increased (1.5x)
════════════════════
🔔 Follow to get firsthand market alerts 🔔
#技术分析 #CXMT #KSTR #MRNA
📌 When trading, pay attention to whether the candlestick pattern confirms the setup
════════════════════
🟢 $CXMT 30-minute bearish signal
⚠️Technical analysis: ADX(30) Trend is forming; opportunity to participate | MACD bearish crossover below zero; bearish momentum accelerating | EMA5 crossed below EMA8; short-term outlook turns bearish | KDJ bearish crossover; short-term outlook is bearish (K: 47.2, D: 59.1) | Volume increased (1.9x)
════════════════════
🟢 $KSTR 30-minute bearish signal
⚠️Technical analysis: ADX(31) Clear trending market | MACD bearish crossover below zero; bearish momentum accelerating | EMA5 crossed below EMA8; short-term outlook turns bearish | Volume surged (3.3x)
════════════════════
🟢 $MRNA 30-minute bearish signal
⚠️Technical analysis: ADX(36) Clear trending market | MACD bearish crossover below zero; bearish momentum accelerating | EMA5 < EMA8 < EMA13; bearish alignment | KDJ moving in weak territory, with bears in control (K: 29.1, D: 41.4) | Volume increased (1.5x)
════════════════════
🔔 Follow to get firsthand market alerts 🔔
#技术分析 #CXMT #KSTR #MRNA
📌 When trading, pay attention to whether the candlestick pattern confirms the setup
6
Log in to explore more content
Join global crypto users on Binance Square
⚡️ Get latest and useful information about crypto.
💬 Trusted by the world’s largest crypto exchange.
👍 Discover real insights from verified creators.
Email / Phone number
Trending Topics
1
#HuangRisksOusterOverReportedAffairWithSubordinate
44,711 views
689 Discussing
2
#AnthropicRejectsIPODelayValuationinQuestion
499,636 views
4,106 Discussing
3
#CoreWeaveJumps10%On168%RevenueGrowth
78,958 views
1,002 Discussing
4
#ZcashFallsBelow$1000ForFirstTimeSinceSeptember
44,831 views
204 Discussing
5
#MSCIRemovalMayCurbStrategy’sBitcoinBuying
8,178 views
143 Discussing
6
#CanNvidiaEarningsEaseMarketConcerns?
190,589 views
1,917 Discussing
7
#SouthKoreaToLetExchangesSuspendWithdrawalsOnSuspectedHacks
166 views
10 Discussing
8
#PythAddsNYSERealTimeDataToMarketplace
3,238 views
83 Discussing
9
#SolanaCompanyReports$3.4MQ3Revenue
1,244 views
30 Discussing
10
#TradFiForBeginners
486,894 views
3,313 Discussing