
#analisiscrypto
analisiscrypto
20,504 views
79 Discussing
Hot
Latest

·
--
Bitcoin’s weekly close finally fell below the 50-week average — and that changes the bigger picture.
Context: BTC closed the week around $74,824, below the 50-week average of approximately $75,513–$75,560. This is the fifth consecutive red week: from the weekly open of $78,239, BTC fell about 4.4% over the week. Over the past five days, the price managed to hold above that line, but an early-morning flush to $73,436 ended the debate. Galaxy’s late-October thesis — that the bear market had ended because of five consecutive weekly closes above the 50-week average — has now lost its anchor: their invalidation condition, a weekly close below $76,540, has also been breached.
Bullish scenario: reclaiming and closing daily above $75,560 opens the way back to $76,540, then $77,684.
Bearish scenario: failing to hold above $74,500 and breaking below the 200-day average around $73,176–$73,240 opens the way to the $73,000–$72,500 zone.
My conclusion: I’ll wait for US CPI tomorrow at 20:30 WIB before judging whether this is just a brief break below support or the start of a new phase — until then, $75,560 is the level to reclaim.
This is my analysis, not financial advice — always DYOR.
What do you think: is this weekly close below the 50-week average the start of a longer downtrend, or a trap before a bounce?
#Bitcoin #AnalisisCrypto $BTC
Bitcoin’s weekly close finally fell below the 50-week average — and that changes the bigger picture.
Context: BTC closed the week around $74,824, below the 50-week average of approximately $75,513–$75,560. This is the fifth consecutive red week: from the weekly open of $78,239, BTC fell about 4.4% over the week. Over the past five days, the price managed to hold above that line, but an early-morning flush to $73,436 ended the debate. Galaxy’s late-October thesis — that the bear market had ended because of five consecutive weekly closes above the 50-week average — has now lost its anchor: their invalidation condition, a weekly close below $76,540, has also been breached.
Bullish scenario: reclaiming and closing daily above $75,560 opens the way back to $76,540, then $77,684.
Bearish scenario: failing to hold above $74,500 and breaking below the 200-day average around $73,176–$73,240 opens the way to the $73,000–$72,500 zone.
My conclusion: I’ll wait for US CPI tomorrow at 20:30 WIB before judging whether this is just a brief break below support or the start of a new phase — until then, $75,560 is the level to reclaim.
This is my analysis, not financial advice — always DYOR.
What do you think: is this weekly close below the 50-week average the start of a longer downtrend, or a trap before a bounce?
#Bitcoin #AnalisisCrypto $BTC
Context: BTC closed the week around $74,824, below the 50-week average of approximately $75,513–$75,560. This is the fifth consecutive red week: from the weekly open of $78,239, BTC fell about 4.4% over the week. Over the past five days, the price managed to hold above that line, but an early-morning flush to $73,436 ended the debate. Galaxy’s late-October thesis — that the bear market had ended because of five consecutive weekly closes above the 50-week average — has now lost its anchor: their invalidation condition, a weekly close below $76,540, has also been breached.
Bullish scenario: reclaiming and closing daily above $75,560 opens the way back to $76,540, then $77,684.
Bearish scenario: failing to hold above $74,500 and breaking below the 200-day average around $73,176–$73,240 opens the way to the $73,000–$72,500 zone.
My conclusion: I’ll wait for US CPI tomorrow at 20:30 WIB before judging whether this is just a brief break below support or the start of a new phase — until then, $75,560 is the level to reclaim.
This is my analysis, not financial advice — always DYOR.
What do you think: is this weekly close below the 50-week average the start of a longer downtrend, or a trap before a bounce?
#Bitcoin #AnalisisCrypto $BTC
73
·
--
BTC breaks below $75,000 in 15 minutes — $73,440, its lowest since August 21.
Context: after a week moving sideways between $75,500 and $76,200, BTC plunged on the 04:45 WIB candle: from $75,570 to a low of $73,440, then bounced to around $74,240. ETH fell further, briefly hitting $2,059; SOL dropped to $84.82, and XRP to $1.089. No single catalyst has been confirmed this morning — this is a continuation of the same pressure: a hot NFP report (+165K vs. expectations of 65K), the odds of a December rate hike nearing 80%, and ETF outflows of $1.28 billion last week. I think this is a flush, not a reversal: the price fell vertically with no structure, so there’s no clean entry level yet.
Bullish scenario: reclaiming $75,000 and closing above it on the 4H chart opens the way to $75,780–$76,170.
Bearish scenario: a 4H close below $74,780 (Friday’s low) opens the way to $73,000–$72,500, the August breakout zone; if that breaks, $70,000 comes into play.
My conclusion: I’ll wait for the 07:00 WIB 4H close before making a judgment. Tomorrow’s CPI at 20:30 WIB remains the key event.
This is my analysis, not financial advice — always DYOR.
What do you think: does a flush like this more often mark a bottom for a bounce, or the start of the next leg down?
#Bitcoin #AnalisisCrypto $BTC $ETH
BTC breaks below $75,000 in 15 minutes — $73,440, its lowest since August 21.
Context: after a week moving sideways between $75,500 and $76,200, BTC plunged on the 04:45 WIB candle: from $75,570 to a low of $73,440, then bounced to around $74,240. ETH fell further, briefly hitting $2,059; SOL dropped to $84.82, and XRP to $1.089. No single catalyst has been confirmed this morning — this is a continuation of the same pressure: a hot NFP report (+165K vs. expectations of 65K), the odds of a December rate hike nearing 80%, and ETF outflows of $1.28 billion last week. I think this is a flush, not a reversal: the price fell vertically with no structure, so there’s no clean entry level yet.
Bullish scenario: reclaiming $75,000 and closing above it on the 4H chart opens the way to $75,780–$76,170.
Bearish scenario: a 4H close below $74,780 (Friday’s low) opens the way to $73,000–$72,500, the August breakout zone; if that breaks, $70,000 comes into play.
My conclusion: I’ll wait for the 07:00 WIB 4H close before making a judgment. Tomorrow’s CPI at 20:30 WIB remains the key event.
This is my analysis, not financial advice — always DYOR.
What do you think: does a flush like this more often mark a bottom for a bounce, or the start of the next leg down?
#Bitcoin #AnalisisCrypto $BTC $ETH
Context: after a week moving sideways between $75,500 and $76,200, BTC plunged on the 04:45 WIB candle: from $75,570 to a low of $73,440, then bounced to around $74,240. ETH fell further, briefly hitting $2,059; SOL dropped to $84.82, and XRP to $1.089. No single catalyst has been confirmed this morning — this is a continuation of the same pressure: a hot NFP report (+165K vs. expectations of 65K), the odds of a December rate hike nearing 80%, and ETF outflows of $1.28 billion last week. I think this is a flush, not a reversal: the price fell vertically with no structure, so there’s no clean entry level yet.
Bullish scenario: reclaiming $75,000 and closing above it on the 4H chart opens the way to $75,780–$76,170.
Bearish scenario: a 4H close below $74,780 (Friday’s low) opens the way to $73,000–$72,500, the August breakout zone; if that breaks, $70,000 comes into play.
My conclusion: I’ll wait for the 07:00 WIB 4H close before making a judgment. Tomorrow’s CPI at 20:30 WIB remains the key event.
This is my analysis, not financial advice — always DYOR.
What do you think: does a flush like this more often mark a bottom for a bounce, or the start of the next leg down?
#Bitcoin #AnalisisCrypto $BTC $ETH
2
·
--
Bitcoin has swept the lows — but $76,000 will determine whether this is the start of a bounce or just a pause.
Context: BTC is around $75,900–$76,000 tonight, barely moving throughout the weekend after briefly touching ~$75,590. According to analyst Michaël van de Poppe (X, Nov 8), the sweep of the lows has happened — but for BTC to move higher, it has to break through $76,000; below that, this is still consolidation, not a reversal. Glassnode data (Nov 4) helps explain why this level is so pivotal: the price is sitting just above short-term buyers’ cost basis of $75,700, and only around 38% of their supply is still in profit — down from ≥97.5% in early October. The True Market Mean, the average price paid by active investors, is at $77,700, still above the current price.
Bullish scenario: a 4H close above $76,000 opens the way to resistance at $78,000–$80,000, and if momentum continues, the short liquidation cluster around $87,000 (Glassnode) could accelerate the move.
Bearish scenario: failure to hold $75,000 opens the way to the 200-day average around $73,200, and losing the $75,700 cost basis would also put the structure built since August at risk.
My take: I’m waiting for a clear 4H close above $76,000 before taking this bounce seriously. Until then, it’s a watch, not an entry — especially with US CPI on Tuesday, Nov 10, at 20:30 WIB still ahead.
What do you think: will $76,000 be reclaimed first this week, or will $75,000 break first?
This is my analysis, not financial advice — always DYOR.
#Bitcoin #AnalisisCrypto $BTC
Bitcoin has swept the lows — but $76,000 will determine whether this is the start of a bounce or just a pause.
Context: BTC is around $75,900–$76,000 tonight, barely moving throughout the weekend after briefly touching ~$75,590. According to analyst Michaël van de Poppe (X, Nov 8), the sweep of the lows has happened — but for BTC to move higher, it has to break through $76,000; below that, this is still consolidation, not a reversal. Glassnode data (Nov 4) helps explain why this level is so pivotal: the price is sitting just above short-term buyers’ cost basis of $75,700, and only around 38% of their supply is still in profit — down from ≥97.5% in early October. The True Market Mean, the average price paid by active investors, is at $77,700, still above the current price.
Bullish scenario: a 4H close above $76,000 opens the way to resistance at $78,000–$80,000, and if momentum continues, the short liquidation cluster around $87,000 (Glassnode) could accelerate the move.
Bearish scenario: failure to hold $75,000 opens the way to the 200-day average around $73,200, and losing the $75,700 cost basis would also put the structure built since August at risk.
My take: I’m waiting for a clear 4H close above $76,000 before taking this bounce seriously. Until then, it’s a watch, not an entry — especially with US CPI on Tuesday, Nov 10, at 20:30 WIB still ahead.
What do you think: will $76,000 be reclaimed first this week, or will $75,000 break first?
This is my analysis, not financial advice — always DYOR.
#Bitcoin #AnalisisCrypto $BTC
Context: BTC is around $75,900–$76,000 tonight, barely moving throughout the weekend after briefly touching ~$75,590. According to analyst Michaël van de Poppe (X, Nov 8), the sweep of the lows has happened — but for BTC to move higher, it has to break through $76,000; below that, this is still consolidation, not a reversal. Glassnode data (Nov 4) helps explain why this level is so pivotal: the price is sitting just above short-term buyers’ cost basis of $75,700, and only around 38% of their supply is still in profit — down from ≥97.5% in early October. The True Market Mean, the average price paid by active investors, is at $77,700, still above the current price.
Bullish scenario: a 4H close above $76,000 opens the way to resistance at $78,000–$80,000, and if momentum continues, the short liquidation cluster around $87,000 (Glassnode) could accelerate the move.
Bearish scenario: failure to hold $75,000 opens the way to the 200-day average around $73,200, and losing the $75,700 cost basis would also put the structure built since August at risk.
My take: I’m waiting for a clear 4H close above $76,000 before taking this bounce seriously. Until then, it’s a watch, not an entry — especially with US CPI on Tuesday, Nov 10, at 20:30 WIB still ahead.
What do you think: will $76,000 be reclaimed first this week, or will $75,000 break first?
This is my analysis, not financial advice — always DYOR.
#Bitcoin #AnalisisCrypto $BTC
55
·
--
Last night & this morning: BTC briefly slipped below $77,000 this morning and is now around $77,065, after the US session closed lower last night (S&P 500 −0.51%, Nasdaq −1.07%). ETH is around $2,256, SOL around $92.35. This is still a continuation of the grind lower, not a reversal — BTC's 4H highs keep declining, from $78,730 to $77,223.
Levels I'm watching today:
• $BTC: above $78,267 / $78,400 — only a reclaim above those levels would change the read; below $76,690 / $76,721, a break opens up the $76,300s
• $ETH: above $2,304 — below $2,245, the area that held the bounce last night
• $SOL: above $94.94 — below $90.92, the latest 4H low
Today's agenda: RBA interest rate decision at 10:30 WIB — the broad market expects a hike to 4.85% from 4.60%, but that's an expectation, not a decision; what moves the market afterward will be the statement and projections. Tonight: US JOLTS at 22:00 WIB and the US congressional election at 22:16 WIB.
My bias today: cautious while BTC is below $78,400; this read is invalidated by a 4H close above $78,400, and selling pressure will continue if $76,690 breaks. I'm not entering any trades based on this outlook — this is a map, not a signal.
This is my analysis, not financial advice — always DYOR.
Which level do you think gets hit first today — $78,400 or $76,690?
#OutlookPagi #Bitcoin #AnalisisCrypto $BTC $ETH $SOL
Last night & this morning: BTC briefly slipped below $77,000 this morning and is now around $77,065, after the US session closed lower last night (S&P 500 −0.51%, Nasdaq −1.07%). ETH is around $2,256, SOL around $92.35. This is still a continuation of the grind lower, not a reversal — BTC's 4H highs keep declining, from $78,730 to $77,223.
Levels I'm watching today:
• $BTC : above $78,267 / $78,400 — only a reclaim above those levels would change the read; below $76,690 / $76,721, a break opens up the $76,300s
• $ETH : above $2,304 — below $2,245, the area that held the bounce last night
• $SOL : above $94.94 — below $90.92, the latest 4H low
Today's agenda: RBA interest rate decision at 10:30 WIB — the broad market expects a hike to 4.85% from 4.60%, but that's an expectation, not a decision; what moves the market afterward will be the statement and projections. Tonight: US JOLTS at 22:00 WIB and the US congressional election at 22:16 WIB.
My bias today: cautious while BTC is below $78,400; this read is invalidated by a 4H close above $78,400, and selling pressure will continue if $76,690 breaks. I'm not entering any trades based on this outlook — this is a map, not a signal.
This is my analysis, not financial advice — always DYOR.
Which level do you think gets hit first today — $78,400 or $76,690?
#OutlookPagi #Bitcoin #AnalisisCrypto $BTC $ETH $SOL
Levels I'm watching today:
• $BTC : above $78,267 / $78,400 — only a reclaim above those levels would change the read; below $76,690 / $76,721, a break opens up the $76,300s
• $ETH : above $2,304 — below $2,245, the area that held the bounce last night
• $SOL : above $94.94 — below $90.92, the latest 4H low
Today's agenda: RBA interest rate decision at 10:30 WIB — the broad market expects a hike to 4.85% from 4.60%, but that's an expectation, not a decision; what moves the market afterward will be the statement and projections. Tonight: US JOLTS at 22:00 WIB and the US congressional election at 22:16 WIB.
My bias today: cautious while BTC is below $78,400; this read is invalidated by a 4H close above $78,400, and selling pressure will continue if $76,690 breaks. I'm not entering any trades based on this outlook — this is a map, not a signal.
This is my analysis, not financial advice — always DYOR.
Which level do you think gets hit first today — $78,400 or $76,690?
#OutlookPagi #Bitcoin #AnalisisCrypto $BTC $ETH $SOL
137

·
--
🔥 Is the market trapping inexperienced traders, or is this the calm before the final rally? 🚀
Many are falling into the panic trap, but on-chain data and whale movements tell a completely different story. 🐋👀
Let’s take a quick look at the current situation:
1️⃣ Key accumulation zones: Institutions aren’t selling; they’re filling their portfolios at key support levels.
2️⃣ Market sentiment: Extreme fear among retail traders... historically, the best time to position yourself with a cool head. 🧠
3️⃣ Next move: If we break through this resistance with volume, the path to the next target zone will be completely clear. 📈
👉 What are you doing right now?
👇 Let me know in the comments: Are you patiently accumulating, or would you rather wait for confirmation? I’m reading your replies—let’s discuss below! 👇
a#bitcoin #AnalisisCrypto #altcoins #Web3
🔥 Is the market trapping inexperienced traders, or is this the calm before the final rally? 🚀
Many are falling into the panic trap, but on-chain data and whale movements tell a completely different story. 🐋👀
Let’s take a quick look at the current situation:
1️⃣ Key accumulation zones: Institutions aren’t selling; they’re filling their portfolios at key support levels.
2️⃣ Market sentiment: Extreme fear among retail traders... historically, the best time to position yourself with a cool head. 🧠
3️⃣ Next move: If we break through this resistance with volume, the path to the next target zone will be completely clear. 📈
👉 What are you doing right now?
👇 Let me know in the comments: Are you patiently accumulating, or would you rather wait for confirmation? I’m reading your replies—let’s discuss below! 👇
a#bitcoin #AnalisisCrypto #altcoins #Web3
Many are falling into the panic trap, but on-chain data and whale movements tell a completely different story. 🐋👀
Let’s take a quick look at the current situation:
1️⃣ Key accumulation zones: Institutions aren’t selling; they’re filling their portfolios at key support levels.
2️⃣ Market sentiment: Extreme fear among retail traders... historically, the best time to position yourself with a cool head. 🧠
3️⃣ Next move: If we break through this resistance with volume, the path to the next target zone will be completely clear. 📈
👉 What are you doing right now?
👇 Let me know in the comments: Are you patiently accumulating, or would you rather wait for confirmation? I’m reading your replies—let’s discuss below! 👇
a#bitcoin #AnalisisCrypto #altcoins #Web3

108
·
--
ETH was the most liquidated asset last night — $449 million, nearly double BTC — and that’s no coincidence.
Context: ETH fell 5.04% on Sunday, closing at $2,124, and broke through October’s floor at $2,170 (thecryptobasic, Nov 9). The daily RSI dropped to 33 and the 4-hour RSI fell below 30 — oversold, but with no confirmed reversal yet. CoinGlass data (Nov 9): 24-hour ETH liquidations totaled $449 million, 91.8% of them longs, including one $48.16 million long position that was wiped out. Spot ETH ETFs also saw $365.2 million in outflows last week — their sixth consecutive week of outflows (Farside). The price is now around $2,122, still below the floor it just broke through.
Bullish scenario: A 4-hour close back above $2,170 would reclaim October’s floor and open the way to $2,243.
Bearish scenario: Failure to hold $2,081 (today’s low) would open the way to the flush low at $2,059, then $2,000.
My takeaway: I’ll wait for a clear 4-hour close above $2,170 before judging that ETH has stopped falling — and tomorrow’s US CPI release at 20:30 WIB could change the picture in an instant.
This is my analysis, not financial advice — always DYOR.
What do you think: Is ETH being the most liquidated asset a sign that ETH speculators have had enough, or are the liquidations not over yet?
#Ethereum #AnalisisCrypto $ETH
ETH was the most liquidated asset last night — $449 million, nearly double BTC — and that’s no coincidence.
Context: ETH fell 5.04% on Sunday, closing at $2,124, and broke through October’s floor at $2,170 (thecryptobasic, Nov 9). The daily RSI dropped to 33 and the 4-hour RSI fell below 30 — oversold, but with no confirmed reversal yet. CoinGlass data (Nov 9): 24-hour ETH liquidations totaled $449 million, 91.8% of them longs, including one $48.16 million long position that was wiped out. Spot ETH ETFs also saw $365.2 million in outflows last week — their sixth consecutive week of outflows (Farside). The price is now around $2,122, still below the floor it just broke through.
Bullish scenario: A 4-hour close back above $2,170 would reclaim October’s floor and open the way to $2,243.
Bearish scenario: Failure to hold $2,081 (today’s low) would open the way to the flush low at $2,059, then $2,000.
My takeaway: I’ll wait for a clear 4-hour close above $2,170 before judging that ETH has stopped falling — and tomorrow’s US CPI release at 20:30 WIB could change the picture in an instant.
This is my analysis, not financial advice — always DYOR.
What do you think: Is ETH being the most liquidated asset a sign that ETH speculators have had enough, or are the liquidations not over yet?
#Ethereum #AnalisisCrypto $ETH
Context: ETH fell 5.04% on Sunday, closing at $2,124, and broke through October’s floor at $2,170 (thecryptobasic, Nov 9). The daily RSI dropped to 33 and the 4-hour RSI fell below 30 — oversold, but with no confirmed reversal yet. CoinGlass data (Nov 9): 24-hour ETH liquidations totaled $449 million, 91.8% of them longs, including one $48.16 million long position that was wiped out. Spot ETH ETFs also saw $365.2 million in outflows last week — their sixth consecutive week of outflows (Farside). The price is now around $2,122, still below the floor it just broke through.
Bullish scenario: A 4-hour close back above $2,170 would reclaim October’s floor and open the way to $2,243.
Bearish scenario: Failure to hold $2,081 (today’s low) would open the way to the flush low at $2,059, then $2,000.
My takeaway: I’ll wait for a clear 4-hour close above $2,170 before judging that ETH has stopped falling — and tomorrow’s US CPI release at 20:30 WIB could change the picture in an instant.
This is my analysis, not financial advice — always DYOR.
What do you think: Is ETH being the most liquidated asset a sign that ETH speculators have had enough, or are the liquidations not over yet?
#Ethereum #AnalisisCrypto $ETH
164
·
--
BTC is currently around $73,770 — only about $600 above the 200-day average at $73,170. This is the line that determines whether the correction since early October turns into a downtrend or remains just a correction.
Context: since midday, the price has slowly slipped from $74,470 to $73,770, and the latest 4H candle closed at $73,770 — still below the September 15 low of $74,891. Sunday's flush low of $73,436 is only about $340 below the current price. ETH also broke below $2,100 to $2,081, so this pressure isn't just about BTC.
Bullish scenario: the 200-day MA holds, then BTC reclaims $74,891 — that's the first sign of improvement, followed by a daily close above $75,625.
Bearish scenario: a daily close below $73,436 and a break of the 200-day MA — opening the way to $71,995, then the $70,000 zone. Tomorrow's US CPI data at 20:30 WIB will be the deciding factor.
My conclusion: I'll wait for confirmation on either side before taking a stronger stance — at a line like this, guessing is more costly than waiting.
This is my analysis, not financial advice — always DYOR.
What do you think, will the 200-day MA hold or break first?
#Bitcoin #AnalisisCrypto $BTC
BTC is currently around $73,770 — only about $600 above the 200-day average at $73,170. This is the line that determines whether the correction since early October turns into a downtrend or remains just a correction.
Context: since midday, the price has slowly slipped from $74,470 to $73,770, and the latest 4H candle closed at $73,770 — still below the September 15 low of $74,891. Sunday's flush low of $73,436 is only about $340 below the current price. ETH also broke below $2,100 to $2,081, so this pressure isn't just about BTC.
Bullish scenario: the 200-day MA holds, then BTC reclaims $74,891 — that's the first sign of improvement, followed by a daily close above $75,625.
Bearish scenario: a daily close below $73,436 and a break of the 200-day MA — opening the way to $71,995, then the $70,000 zone. Tomorrow's US CPI data at 20:30 WIB will be the deciding factor.
My conclusion: I'll wait for confirmation on either side before taking a stronger stance — at a line like this, guessing is more costly than waiting.
This is my analysis, not financial advice — always DYOR.
What do you think, will the 200-day MA hold or break first?
#Bitcoin #AnalisisCrypto $BTC
Context: since midday, the price has slowly slipped from $74,470 to $73,770, and the latest 4H candle closed at $73,770 — still below the September 15 low of $74,891. Sunday's flush low of $73,436 is only about $340 below the current price. ETH also broke below $2,100 to $2,081, so this pressure isn't just about BTC.
Bullish scenario: the 200-day MA holds, then BTC reclaims $74,891 — that's the first sign of improvement, followed by a daily close above $75,625.
Bearish scenario: a daily close below $73,436 and a break of the 200-day MA — opening the way to $71,995, then the $70,000 zone. Tomorrow's US CPI data at 20:30 WIB will be the deciding factor.
My conclusion: I'll wait for confirmation on either side before taking a stronger stance — at a line like this, guessing is more costly than waiting.
This is my analysis, not financial advice — always DYOR.
What do you think, will the 200-day MA hold or break first?
#Bitcoin #AnalisisCrypto $BTC
3

Want to see how $AAVE is moving today in the middle of the trading session?
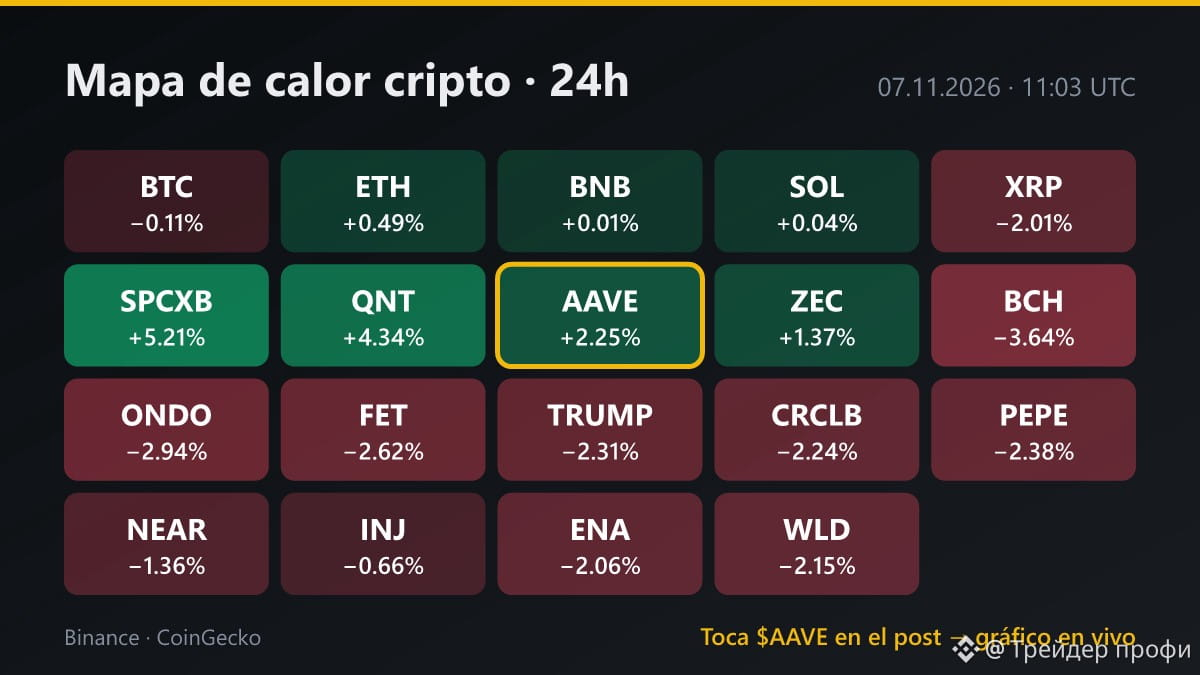
1. The token is up +2.25% over 24 hours, standing at $131.46, with a 24-hour range between $128.49 and $133.56.
2. While the broader market is showing caution, with global market capitalization down -2.84%, $AAVE is holding firm.
3. Compared with $BTC, trading at $76,000 with a change of -0.11%, this asset is looking to maintain its momentum.
🔍 Open $AAVE and compare its performance with the rest of the market's trend right now.
💡 The upper resistance remains the key level to watch on the daily chart.
Just my opinion, not investment advice. DYOR.
#AAVE #AnalisisCrypto #Altcoins
Want to see how $AAVE is moving today in the middle of the trading session?
1. The token is up +2.25% over 24 hours, standing at $131.46, with a 24-hour range between $128.49 and $133.56.
2. While the broader market is showing caution, with global market capitalization down -2.84%, $AAVE is holding firm.
3. Compared with $BTC , trading at $76,000 with a change of -0.11%, this asset is looking to maintain its momentum.
🔍 Open $AAVE and compare its performance with the rest of the market's trend right now.
💡 The upper resistance remains the key level to watch on the daily chart.
Just my opinion, not investment advice. DYOR.
#AAVE #AnalisisCrypto #Altcoins
1. The token is up +2.25% over 24 hours, standing at $131.46, with a 24-hour range between $128.49 and $133.56.
2. While the broader market is showing caution, with global market capitalization down -2.84%, $AAVE is holding firm.
3. Compared with $BTC , trading at $76,000 with a change of -0.11%, this asset is looking to maintain its momentum.
🔍 Open $AAVE and compare its performance with the rest of the market's trend right now.
💡 The upper resistance remains the key level to watch on the daily chart.
Just my opinion, not investment advice. DYOR.
#AAVE #AnalisisCrypto #Altcoins
31
·
--
Today's market in 5 lines: BTC closed the day around $77,350 — bouncing, but not yet breaking its lower-high pattern.
1. BTC briefly slipped to around $76,520 this afternoon, then bounced to around $77,350 tonight; its latest 4H high of $77,486 is still below yesterday's $78,400. In my view, this is a bounce within a downtrend, not a reversal.
2. Today's exception: XRP rose about 2.5% to $1.2814, while ETH at around $2,282, SOL at around $93.06, and BNB at around $700.80 were mostly flat to weaker. When one coin moves on its own, I don't read it as a market signal.
3. The Binance story reversed: from peak withdrawals of around $7 billion, flows shifted to net inflows of around $1.6 billion over 24 hours. But the SAFU fund is now below the $800 million threshold — and the promised top-up still has no deadline.
4. Security concerns haven't eased: a Brazilian exchange pledged to cover losses, South Korean regulators are pushing exchanges to increase their cold-wallet allocation, and the Arbitrum council moved stolen funds via a vote. The market is still digesting that $6.3 billion hack, not forgetting it.
5. What I'm watching tonight: JOLTS at 22:00 WIB and US congressional election results starting at 22:16 WIB, followed by AMD earnings after the US market closes and Friday's jobs report. Tonight's volatility could come from the schedule, not the chart.
My takeaway: a day that ends flat after days of shocks isn't a sign of calm — it's a sign the market is waiting for the next headline before choosing a direction. I'm still waiting for confirmation, not guessing at a breakout.
Which catalyst do you think will move the market first: JOLTS, the election results, or AMD earnings?
This is my analysis, not financial advice — always DYOR.
#PasarHariIni #AnalisisCrypto $BTC $ETH $XRP
Today's market in 5 lines: BTC closed the day around $77,350 — bouncing, but not yet breaking its lower-high pattern.
1. BTC briefly slipped to around $76,520 this afternoon, then bounced to around $77,350 tonight; its latest 4H high of $77,486 is still below yesterday's $78,400. In my view, this is a bounce within a downtrend, not a reversal.
2. Today's exception: XRP rose about 2.5% to $1.2814, while ETH at around $2,282, SOL at around $93.06, and BNB at around $700.80 were mostly flat to weaker. When one coin moves on its own, I don't read it as a market signal.
3. The Binance story reversed: from peak withdrawals of around $7 billion, flows shifted to net inflows of around $1.6 billion over 24 hours. But the SAFU fund is now below the $800 million threshold — and the promised top-up still has no deadline.
4. Security concerns haven't eased: a Brazilian exchange pledged to cover losses, South Korean regulators are pushing exchanges to increase their cold-wallet allocation, and the Arbitrum council moved stolen funds via a vote. The market is still digesting that $6.3 billion hack, not forgetting it.
5. What I'm watching tonight: JOLTS at 22:00 WIB and US congressional election results starting at 22:16 WIB, followed by AMD earnings after the US market closes and Friday's jobs report. Tonight's volatility could come from the schedule, not the chart.
My takeaway: a day that ends flat after days of shocks isn't a sign of calm — it's a sign the market is waiting for the next headline before choosing a direction. I'm still waiting for confirmation, not guessing at a breakout.
Which catalyst do you think will move the market first: JOLTS, the election results, or AMD earnings?
This is my analysis, not financial advice — always DYOR.
#PasarHariIni #AnalisisCrypto $BTC $ETH $XRP
1. BTC briefly slipped to around $76,520 this afternoon, then bounced to around $77,350 tonight; its latest 4H high of $77,486 is still below yesterday's $78,400. In my view, this is a bounce within a downtrend, not a reversal.
2. Today's exception: XRP rose about 2.5% to $1.2814, while ETH at around $2,282, SOL at around $93.06, and BNB at around $700.80 were mostly flat to weaker. When one coin moves on its own, I don't read it as a market signal.
3. The Binance story reversed: from peak withdrawals of around $7 billion, flows shifted to net inflows of around $1.6 billion over 24 hours. But the SAFU fund is now below the $800 million threshold — and the promised top-up still has no deadline.
4. Security concerns haven't eased: a Brazilian exchange pledged to cover losses, South Korean regulators are pushing exchanges to increase their cold-wallet allocation, and the Arbitrum council moved stolen funds via a vote. The market is still digesting that $6.3 billion hack, not forgetting it.
5. What I'm watching tonight: JOLTS at 22:00 WIB and US congressional election results starting at 22:16 WIB, followed by AMD earnings after the US market closes and Friday's jobs report. Tonight's volatility could come from the schedule, not the chart.
My takeaway: a day that ends flat after days of shocks isn't a sign of calm — it's a sign the market is waiting for the next headline before choosing a direction. I'm still waiting for confirmation, not guessing at a breakout.
Which catalyst do you think will move the market first: JOLTS, the election results, or AMD earnings?
This is my analysis, not financial advice — always DYOR.
#PasarHariIni #AnalisisCrypto $BTC $ETH $XRP
3
·
--
Today's market in 5 lines: BTC closed Monday around $78,000 — flat, but the story isn't in the price.
1. $BTC touched $78,846 this morning, then faded to around $78,000 tonight; the 4H highs declined throughout the day. I think this is tired consolidation, not a reversal.
2. $ETH around $2,290 and $SOL around $94.5 were also flat — no major asset took the lead. When everything is uniformly quiet, I don't force a directional call.
3. Today's real theme was security: South Korean regulators are pressuring exchanges to increase their cold wallet holdings following a $6.3 billion hack. The market is still digesting the incident, not forgetting it.
4. The options market is pricing in a brief jolt from the U.S. election: BTC IV for the Nov. 4 expiry is around 43.5%, versus around 36% for later expiries. The market is bracing for a short burst of volatility, not a prolonged one.
5. What I'm watching: ISM Manufacturing PMI tonight at 22:00 WIB, then the U.S. election tomorrow and Apple earnings early the next morning. Three catalysts that could break this lull.
My takeaway: a flat day like this isn't information-free — it says the market is waiting, not feeling confident. I'm still waiting for confirmation, not guessing at a breakout.
Which catalyst do you think will move the market first: tonight's ISM, the election, or Apple earnings?
This is my analysis, not financial advice — always DYOR.
#PasarHariIni #AnalisisCrypto $BTC $ETH $SOL
Today's market in 5 lines: BTC closed Monday around $78,000 — flat, but the story isn't in the price.
1. $BTC touched $78,846 this morning, then faded to around $78,000 tonight; the 4H highs declined throughout the day. I think this is tired consolidation, not a reversal.
2. $ETH around $2,290 and $SOL around $94.5 were also flat — no major asset took the lead. When everything is uniformly quiet, I don't force a directional call.
3. Today's real theme was security: South Korean regulators are pressuring exchanges to increase their cold wallet holdings following a $6.3 billion hack. The market is still digesting the incident, not forgetting it.
4. The options market is pricing in a brief jolt from the U.S. election: BTC IV for the Nov. 4 expiry is around 43.5%, versus around 36% for later expiries. The market is bracing for a short burst of volatility, not a prolonged one.
5. What I'm watching: ISM Manufacturing PMI tonight at 22:00 WIB, then the U.S. election tomorrow and Apple earnings early the next morning. Three catalysts that could break this lull.
My takeaway: a flat day like this isn't information-free — it says the market is waiting, not feeling confident. I'm still waiting for confirmation, not guessing at a breakout.
Which catalyst do you think will move the market first: tonight's ISM, the election, or Apple earnings?
This is my analysis, not financial advice — always DYOR.
#PasarHariIni #AnalisisCrypto $BTC $ETH $SOL
1. $BTC touched $78,846 this morning, then faded to around $78,000 tonight; the 4H highs declined throughout the day. I think this is tired consolidation, not a reversal.
2. $ETH around $2,290 and $SOL around $94.5 were also flat — no major asset took the lead. When everything is uniformly quiet, I don't force a directional call.
3. Today's real theme was security: South Korean regulators are pressuring exchanges to increase their cold wallet holdings following a $6.3 billion hack. The market is still digesting the incident, not forgetting it.
4. The options market is pricing in a brief jolt from the U.S. election: BTC IV for the Nov. 4 expiry is around 43.5%, versus around 36% for later expiries. The market is bracing for a short burst of volatility, not a prolonged one.
5. What I'm watching: ISM Manufacturing PMI tonight at 22:00 WIB, then the U.S. election tomorrow and Apple earnings early the next morning. Three catalysts that could break this lull.
My takeaway: a flat day like this isn't information-free — it says the market is waiting, not feeling confident. I'm still waiting for confirmation, not guessing at a breakout.
Which catalyst do you think will move the market first: tonight's ISM, the election, or Apple earnings?
This is my analysis, not financial advice — always DYOR.
#PasarHariIni #AnalisisCrypto $BTC $ETH $SOL
46
·
--
The market barely moved last night — and this morning is no different. That in itself is information.
Last night & this morning: BTC closed Oct 31 at $77,435 (+0.4%) within a narrow range of $76,974–$77,608 (Basis Desk, Nov 1), and this morning it’s still around $77,620. ETH is around $2,262 (+0.6%), SOL around $95.71 (-1.1%). Gold, meanwhile, fell -3.3% to around $3,899 — weakness outside crypto worth noting, not celebrating.
Levels I’m watching today:
• $BTC: above $77,741 / $78,000 — below $77,061 / $76,300
• $ETH: above $2,267 — below $2,235
• $SOL: above $96.21 — below $95.15
Today’s agenda: no high-impact events are listed on my calendar. What the market is waiting for: Binance’s targeted resumption of withdrawals today, one token at a time (CoinDesk & CryptoBriefing, Oct 31) — that’s a target, not a promise, and it still depends on security testing. The full PoR evidence follows on Nov 3.
My bias today: cautious and waiting. As long as BTC is below $78,000, this still looks like post-drop consolidation, not a recovery. This view is invalidated by a 4H close above $78,000 — or a break below $76,300, which opens the way to $75,718.
This is my analysis, not financial advice — always DYOR.
Do you think reopening withdrawals today will calm the market, or trigger a wave of outflows?
#OutlookPagi #AnalisisCrypto $BTC $ETH $SOL
The market barely moved last night — and this morning is no different. That in itself is information.
Last night & this morning: BTC closed Oct 31 at $77,435 (+0.4%) within a narrow range of $76,974–$77,608 (Basis Desk, Nov 1), and this morning it’s still around $77,620. ETH is around $2,262 (+0.6%), SOL around $95.71 (-1.1%). Gold, meanwhile, fell -3.3% to around $3,899 — weakness outside crypto worth noting, not celebrating.
Levels I’m watching today:
• $BTC : above $77,741 / $78,000 — below $77,061 / $76,300
• $ETH : above $2,267 — below $2,235
• $SOL : above $96.21 — below $95.15
Today’s agenda: no high-impact events are listed on my calendar. What the market is waiting for: Binance’s targeted resumption of withdrawals today, one token at a time (CoinDesk & CryptoBriefing, Oct 31) — that’s a target, not a promise, and it still depends on security testing. The full PoR evidence follows on Nov 3.
My bias today: cautious and waiting. As long as BTC is below $78,000, this still looks like post-drop consolidation, not a recovery. This view is invalidated by a 4H close above $78,000 — or a break below $76,300, which opens the way to $75,718.
This is my analysis, not financial advice — always DYOR.
Do you think reopening withdrawals today will calm the market, or trigger a wave of outflows?
#OutlookPagi #AnalisisCrypto $BTC $ETH $SOL
Last night & this morning: BTC closed Oct 31 at $77,435 (+0.4%) within a narrow range of $76,974–$77,608 (Basis Desk, Nov 1), and this morning it’s still around $77,620. ETH is around $2,262 (+0.6%), SOL around $95.71 (-1.1%). Gold, meanwhile, fell -3.3% to around $3,899 — weakness outside crypto worth noting, not celebrating.
Levels I’m watching today:
• $BTC : above $77,741 / $78,000 — below $77,061 / $76,300
• $ETH : above $2,267 — below $2,235
• $SOL : above $96.21 — below $95.15
Today’s agenda: no high-impact events are listed on my calendar. What the market is waiting for: Binance’s targeted resumption of withdrawals today, one token at a time (CoinDesk & CryptoBriefing, Oct 31) — that’s a target, not a promise, and it still depends on security testing. The full PoR evidence follows on Nov 3.
My bias today: cautious and waiting. As long as BTC is below $78,000, this still looks like post-drop consolidation, not a recovery. This view is invalidated by a 4H close above $78,000 — or a break below $76,300, which opens the way to $75,718.
This is my analysis, not financial advice — always DYOR.
Do you think reopening withdrawals today will calm the market, or trigger a wave of outflows?
#OutlookPagi #AnalisisCrypto $BTC $ETH $SOL
131
·
--
Golden cross three weeks ago, death cross yesterday — DOGE just printed the fastest signal reversal I’ve ever seen on its chart.
The facts: DOGE’s 50-day moving average crossed below its 200-day moving average on the daily chart on October 30 (U.Today, CryptoNews, CoinTurk, Oct. 30–31) — DOGE’s first daily death cross in 2026, following the October 5 golden cross that lasted only about three weeks. The price briefly rose to $0.081 on Oct. 29, then fell to $0.072 on Friday, its lowest since August 2026, and is now around $0.075.
My take: a death cross is a lagging signal — it summarizes the past 50 and 200 days, not a forecast. What’s more interesting is how quickly it happened: a golden cross reversing within three weeks points to volatility, not a mature trend. The last time DOGE printed a daily death cross (November 2025), the price weakened for months — but there’s no guarantee that pattern will repeat, especially as the market is still digesting this week’s major incident.
What I’m watching next: support around $0.069 if pressure continues, and resistance around $0.086 near its daily moving average; reclaiming $0.0806 would weaken this bearish reading.
What do you think — is a death cross this quick better read as a trend warning, or just a whipsaw in a panicking market?
This is my analysis, not financial advice — always DYOR.
#Dogecoin #AnalisisCrypto $DOGE
Golden cross three weeks ago, death cross yesterday — DOGE just printed the fastest signal reversal I’ve ever seen on its chart.
The facts: DOGE’s 50-day moving average crossed below its 200-day moving average on the daily chart on October 30 (U.Today, CryptoNews, CoinTurk, Oct. 30–31) — DOGE’s first daily death cross in 2026, following the October 5 golden cross that lasted only about three weeks. The price briefly rose to $0.081 on Oct. 29, then fell to $0.072 on Friday, its lowest since August 2026, and is now around $0.075.
My take: a death cross is a lagging signal — it summarizes the past 50 and 200 days, not a forecast. What’s more interesting is how quickly it happened: a golden cross reversing within three weeks points to volatility, not a mature trend. The last time DOGE printed a daily death cross (November 2025), the price weakened for months — but there’s no guarantee that pattern will repeat, especially as the market is still digesting this week’s major incident.
What I’m watching next: support around $0.069 if pressure continues, and resistance around $0.086 near its daily moving average; reclaiming $0.0806 would weaken this bearish reading.
What do you think — is a death cross this quick better read as a trend warning, or just a whipsaw in a panicking market?
This is my analysis, not financial advice — always DYOR.
#Dogecoin #AnalisisCrypto $DOGE
The facts: DOGE’s 50-day moving average crossed below its 200-day moving average on the daily chart on October 30 (U.Today, CryptoNews, CoinTurk, Oct. 30–31) — DOGE’s first daily death cross in 2026, following the October 5 golden cross that lasted only about three weeks. The price briefly rose to $0.081 on Oct. 29, then fell to $0.072 on Friday, its lowest since August 2026, and is now around $0.075.
My take: a death cross is a lagging signal — it summarizes the past 50 and 200 days, not a forecast. What’s more interesting is how quickly it happened: a golden cross reversing within three weeks points to volatility, not a mature trend. The last time DOGE printed a daily death cross (November 2025), the price weakened for months — but there’s no guarantee that pattern will repeat, especially as the market is still digesting this week’s major incident.
What I’m watching next: support around $0.069 if pressure continues, and resistance around $0.086 near its daily moving average; reclaiming $0.0806 would weaken this bearish reading.
What do you think — is a death cross this quick better read as a trend warning, or just a whipsaw in a panicking market?
This is my analysis, not financial advice — always DYOR.
#Dogecoin #AnalisisCrypto $DOGE
95

·
--
🔥🐻📉 TIME TO SHORT BTC AND ITS BUDDIES! ALTCOINS, GET READY! 📉🔥
🚨 CRYPTO TRADERS, GET YOUR BEST STRATEGY READY! 🚨
When Bitcoin starts weakening, altcoins often feel the pressure too! 💥 Don’t just hope prices will go up—real traders must be able to spot opportunities in both directions of the market!
🐻 BTC IS FALLING—ALTCOINS, BE ON ALERT!
🔥 Bitcoin (BTC)
🔥 Ethereum (ETH)
🔥 BNB, SOL, XRP
🔥 DOGE, ADA, AVAX
🔥 PEPE, LINK, TON, and the rest!
💣 A RED MARKET DOESN’T MEAN OPPORTUNITIES ARE OVER! For Futures traders, a downward move can present an opportunity through a SHORT position, if the analysis supports it.
⚔️ Don’t blindly hit the SHORT button! Wait for trend confirmation, set a Stop Loss, manage your capital, and don’t let emotions control your decisions!
🎯 REMEMBER THE PRINCIPLES OF A REAL TRADER:
✅ Patiently wait for the right moment.
✅ Follow your strategy with discipline.
✅ Don’t FOMO, and don’t get greedy.
✅ Protect your capital before chasing profits.
🚀 THE MARKET MAY BE VOLATILE, BUT YOUR STRATEGY MUST STAY ON TRACK!
🔥 BTC AND ALTCOINS—LET’S READ THE DIRECTION!
🐻 SHORT WHEN THERE’S CONFIRMATION!
💰 PROFIT TARGETS, WITH RISK KEPT UNDER CONTROL!
⚠️ SHORTING does not guarantee profit. Crypto prices can quickly reverse and rise, and leverage can magnify losses.
#Bitcoin #BTC #Altcoin #ShortBTC #CryptoFutures #TraderIndonesia #AnalisisCrypto $BTC $ETH $BNB
{future}(BNBUSDT)
{future}(ETHUSDT)
🔥🐻📉 TIME TO SHORT BTC AND ITS BUDDIES! ALTCOINS, GET READY! 📉🔥
🚨 CRYPTO TRADERS, GET YOUR BEST STRATEGY READY! 🚨
When Bitcoin starts weakening, altcoins often feel the pressure too! 💥 Don’t just hope prices will go up—real traders must be able to spot opportunities in both directions of the market!
🐻 BTC IS FALLING—ALTCOINS, BE ON ALERT!
🔥 Bitcoin (BTC)
🔥 Ethereum (ETH)
🔥 BNB, SOL, XRP
🔥 DOGE, ADA, AVAX
🔥 PEPE, LINK, TON, and the rest!
💣 A RED MARKET DOESN’T MEAN OPPORTUNITIES ARE OVER! For Futures traders, a downward move can present an opportunity through a SHORT position, if the analysis supports it.
⚔️ Don’t blindly hit the SHORT button! Wait for trend confirmation, set a Stop Loss, manage your capital, and don’t let emotions control your decisions!
🎯 REMEMBER THE PRINCIPLES OF A REAL TRADER:
✅ Patiently wait for the right moment.
✅ Follow your strategy with discipline.
✅ Don’t FOMO, and don’t get greedy.
✅ Protect your capital before chasing profits.
🚀 THE MARKET MAY BE VOLATILE, BUT YOUR STRATEGY MUST STAY ON TRACK!
🔥 BTC AND ALTCOINS—LET’S READ THE DIRECTION!
🐻 SHORT WHEN THERE’S CONFIRMATION!
💰 PROFIT TARGETS, WITH RISK KEPT UNDER CONTROL!
⚠️ SHORTING does not guarantee profit. Crypto prices can quickly reverse and rise, and leverage can magnify losses.
#Bitcoin #BTC #Altcoin #ShortBTC #CryptoFutures #TraderIndonesia #AnalisisCrypto $BTC $ETH $BNB
🚨 CRYPTO TRADERS, GET YOUR BEST STRATEGY READY! 🚨
When Bitcoin starts weakening, altcoins often feel the pressure too! 💥 Don’t just hope prices will go up—real traders must be able to spot opportunities in both directions of the market!
🐻 BTC IS FALLING—ALTCOINS, BE ON ALERT!
🔥 Bitcoin (BTC)
🔥 Ethereum (ETH)
🔥 BNB, SOL, XRP
🔥 DOGE, ADA, AVAX
🔥 PEPE, LINK, TON, and the rest!
💣 A RED MARKET DOESN’T MEAN OPPORTUNITIES ARE OVER! For Futures traders, a downward move can present an opportunity through a SHORT position, if the analysis supports it.
⚔️ Don’t blindly hit the SHORT button! Wait for trend confirmation, set a Stop Loss, manage your capital, and don’t let emotions control your decisions!
🎯 REMEMBER THE PRINCIPLES OF A REAL TRADER:
✅ Patiently wait for the right moment.
✅ Follow your strategy with discipline.
✅ Don’t FOMO, and don’t get greedy.
✅ Protect your capital before chasing profits.
🚀 THE MARKET MAY BE VOLATILE, BUT YOUR STRATEGY MUST STAY ON TRACK!
🔥 BTC AND ALTCOINS—LET’S READ THE DIRECTION!
🐻 SHORT WHEN THERE’S CONFIRMATION!
💰 PROFIT TARGETS, WITH RISK KEPT UNDER CONTROL!
⚠️ SHORTING does not guarantee profit. Crypto prices can quickly reverse and rise, and leverage can magnify losses.
#Bitcoin #BTC #Altcoin #ShortBTC #CryptoFutures #TraderIndonesia #AnalisisCrypto $BTC $ETH $BNB

1
1
255
·
--
What’s interesting about BTC tonight isn’t the number, but how it got back above $80,000 after briefly slipping to $79,631.
Context: BTC had dropped to $79,321 this morning, then bounced to around $80,540 tonight. In my view, this is not yet a confirmed reversal — the latest 4H close at $80,382 is still right below $80,392, even though price is now above that level intraday. ETH also edged higher to around $2,334, while SOL was flat around $102.
Bullish scenario: a 4H close (23:00 WIB) above $80,392 opens the way to $80,548, then $80,700.
Bearish scenario: failing to hold above $80,000 and falling back below $79,631 opens the way to $79,321.
My conclusion: I’m waiting for a clear 4H close at 23:00 WIB before judging whether $80,000 has truly become support again.
This is my analysis, not financial advice — always DYOR.
What do you all think, is this bounce the start of a recovery or just a pause before another drop?
#Bitcoin #AnalisisCrypto $BTC
What’s interesting about BTC tonight isn’t the number, but how it got back above $80,000 after briefly slipping to $79,631.
Context: BTC had dropped to $79,321 this morning, then bounced to around $80,540 tonight. In my view, this is not yet a confirmed reversal — the latest 4H close at $80,382 is still right below $80,392, even though price is now above that level intraday. ETH also edged higher to around $2,334, while SOL was flat around $102.
Bullish scenario: a 4H close (23:00 WIB) above $80,392 opens the way to $80,548, then $80,700.
Bearish scenario: failing to hold above $80,000 and falling back below $79,631 opens the way to $79,321.
My conclusion: I’m waiting for a clear 4H close at 23:00 WIB before judging whether $80,000 has truly become support again.
This is my analysis, not financial advice — always DYOR.
What do you all think, is this bounce the start of a recovery or just a pause before another drop?
#Bitcoin #AnalisisCrypto $BTC
Context: BTC had dropped to $79,321 this morning, then bounced to around $80,540 tonight. In my view, this is not yet a confirmed reversal — the latest 4H close at $80,382 is still right below $80,392, even though price is now above that level intraday. ETH also edged higher to around $2,334, while SOL was flat around $102.
Bullish scenario: a 4H close (23:00 WIB) above $80,392 opens the way to $80,548, then $80,700.
Bearish scenario: failing to hold above $80,000 and falling back below $79,631 opens the way to $79,321.
My conclusion: I’m waiting for a clear 4H close at 23:00 WIB before judging whether $80,000 has truly become support again.
This is my analysis, not financial advice — always DYOR.
What do you all think, is this bounce the start of a recovery or just a pause before another drop?
#Bitcoin #AnalisisCrypto $BTC
1
51

·
--
$XEC $XEC Explosion +29%! $DODO Risk of Correction? Here’s the Analysis
Today’s Top Gainers Update 👇
{spot}(XECUSDT)
{spot}(DODOUSDT)
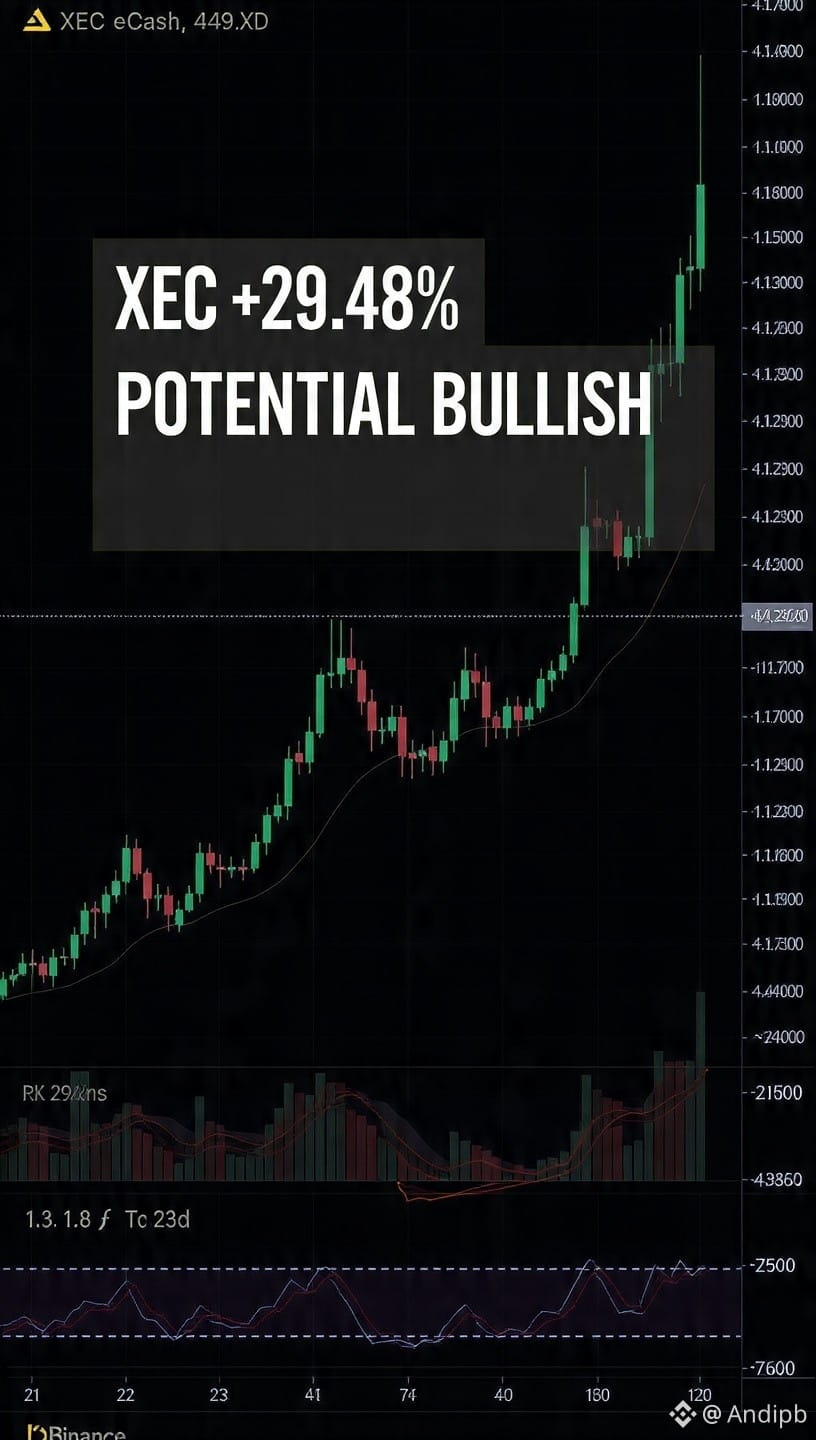
1. $XEC +29.48% - POTENTIAL FOR FURTHER UPSIDE 🚀
Price: $0.00000817
Reason: Breakout resistance + high volume. Next target $0.0000095
But be careful—RSI is already overbought. A small pullback could happen first
2. $DODO +11.01% - WATCH OUT FOR A CORRECTION 📉
Price: $0.02379
Reason: It’s already up for 2 days. Many people are taking profit in this area. Strong support at $0.021
If support breaks, it could drop to $0.019
What’s your strategy? Hold or take profit first?
Disclaimer: This is not financial advice. Always DYOR
Want to trade XEC or DODO? Click the "Buy/Sell" button below 👇
#XECHalving #DODO/BUSD #Gainer #AnalisisCrypto #BinanceSquare
$XEC $XEC Explosion +29%! $DODO Risk of Correction? Here’s the Analysis
Today’s Top Gainers Update 👇
1. $XEC +29.48% - POTENTIAL FOR FURTHER UPSIDE 🚀
Price: $0.00000817
Reason: Breakout resistance + high volume. Next target $0.0000095
But be careful—RSI is already overbought. A small pullback could happen first
2. $DODO +11.01% - WATCH OUT FOR A CORRECTION 📉
Price: $0.02379
Reason: It’s already up for 2 days. Many people are taking profit in this area. Strong support at $0.021
If support breaks, it could drop to $0.019
What’s your strategy? Hold or take profit first?
Disclaimer: This is not financial advice. Always DYOR
Want to trade XEC or DODO? Click the "Buy/Sell" button below 👇
#XECHalving #DODO/BUSD #Gainer #AnalisisCrypto #BinanceSquare
Today’s Top Gainers Update 👇
1. $XEC +29.48% - POTENTIAL FOR FURTHER UPSIDE 🚀
Price: $0.00000817
Reason: Breakout resistance + high volume. Next target $0.0000095
But be careful—RSI is already overbought. A small pullback could happen first
2. $DODO +11.01% - WATCH OUT FOR A CORRECTION 📉
Price: $0.02379
Reason: It’s already up for 2 days. Many people are taking profit in this area. Strong support at $0.021
If support breaks, it could drop to $0.019
What’s your strategy? Hold or take profit first?
Disclaimer: This is not financial advice. Always DYOR
Want to trade XEC or DODO? Click the "Buy/Sell" button below 👇
#XECHalving #DODO/BUSD #Gainer #AnalisisCrypto #BinanceSquare
148


$BTC Market Update: How Is Bitcoin Moving Today?
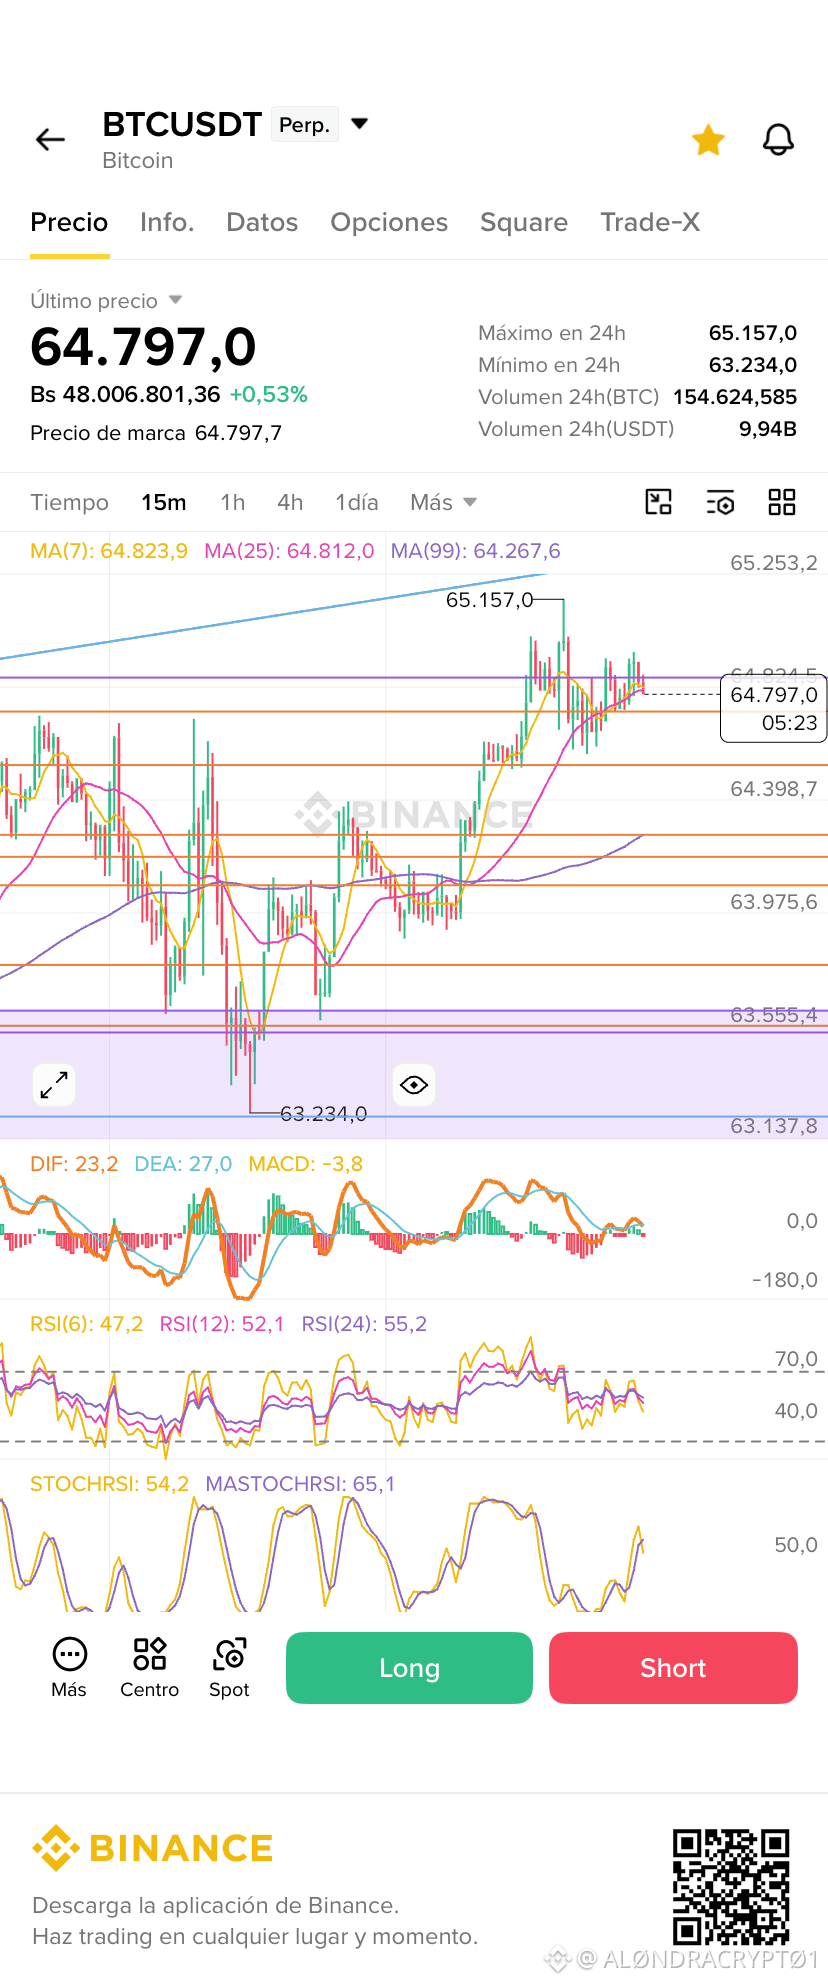
The spot price of $BTC is currently trading above $64,885.06 USDT, showing a slight positive rebound of +0.72% over the last 24 hours.
During this session, we saw a relatively wide range that tested key market levels:
📈 24h High: $65,176.60
📉 24h Low: $63,267.34
Even with a positive intraday bias, the price is still moving within a volatility-sensitive zone where patience and risk management are essential to avoid traps.
👇 How are you trading this move? Do you see Bitcoin consolidating to push for new highs, or do you prefer to wait out the noise zone? I’m reading your comments!
#bitcoin #BTC #AnalisisCrypto
{future}(BTCUSDT)
$BTC Market Update: How Is Bitcoin Moving Today?
The spot price of $BTC is currently trading above $64,885.06 USDT, showing a slight positive rebound of +0.72% over the last 24 hours.
During this session, we saw a relatively wide range that tested key market levels:
📈 24h High: $65,176.60
📉 24h Low: $63,267.34
Even with a positive intraday bias, the price is still moving within a volatility-sensitive zone where patience and risk management are essential to avoid traps.
👇 How are you trading this move? Do you see Bitcoin consolidating to push for new highs, or do you prefer to wait out the noise zone? I’m reading your comments!
#bitcoin #BTC #AnalisisCrypto
The spot price of $BTC is currently trading above $64,885.06 USDT, showing a slight positive rebound of +0.72% over the last 24 hours.
During this session, we saw a relatively wide range that tested key market levels:
📈 24h High: $65,176.60
📉 24h Low: $63,267.34
Even with a positive intraday bias, the price is still moving within a volatility-sensitive zone where patience and risk management are essential to avoid traps.
👇 How are you trading this move? Do you see Bitcoin consolidating to push for new highs, or do you prefer to wait out the noise zone? I’m reading your comments!
#bitcoin #BTC #AnalisisCrypto
Sourced by user sharing on Binance
3
4
3.6k

📉 What’s happening with $LAB?
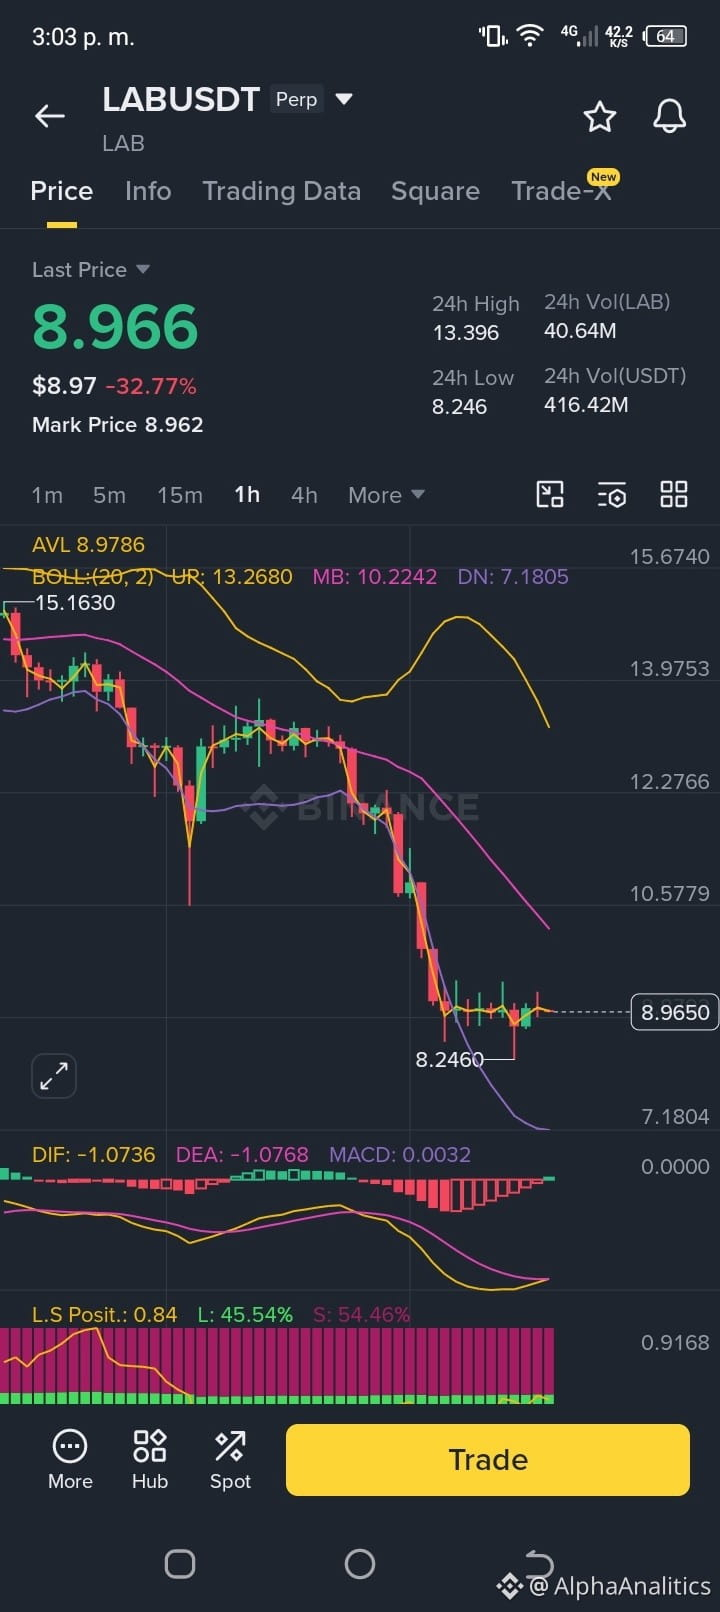
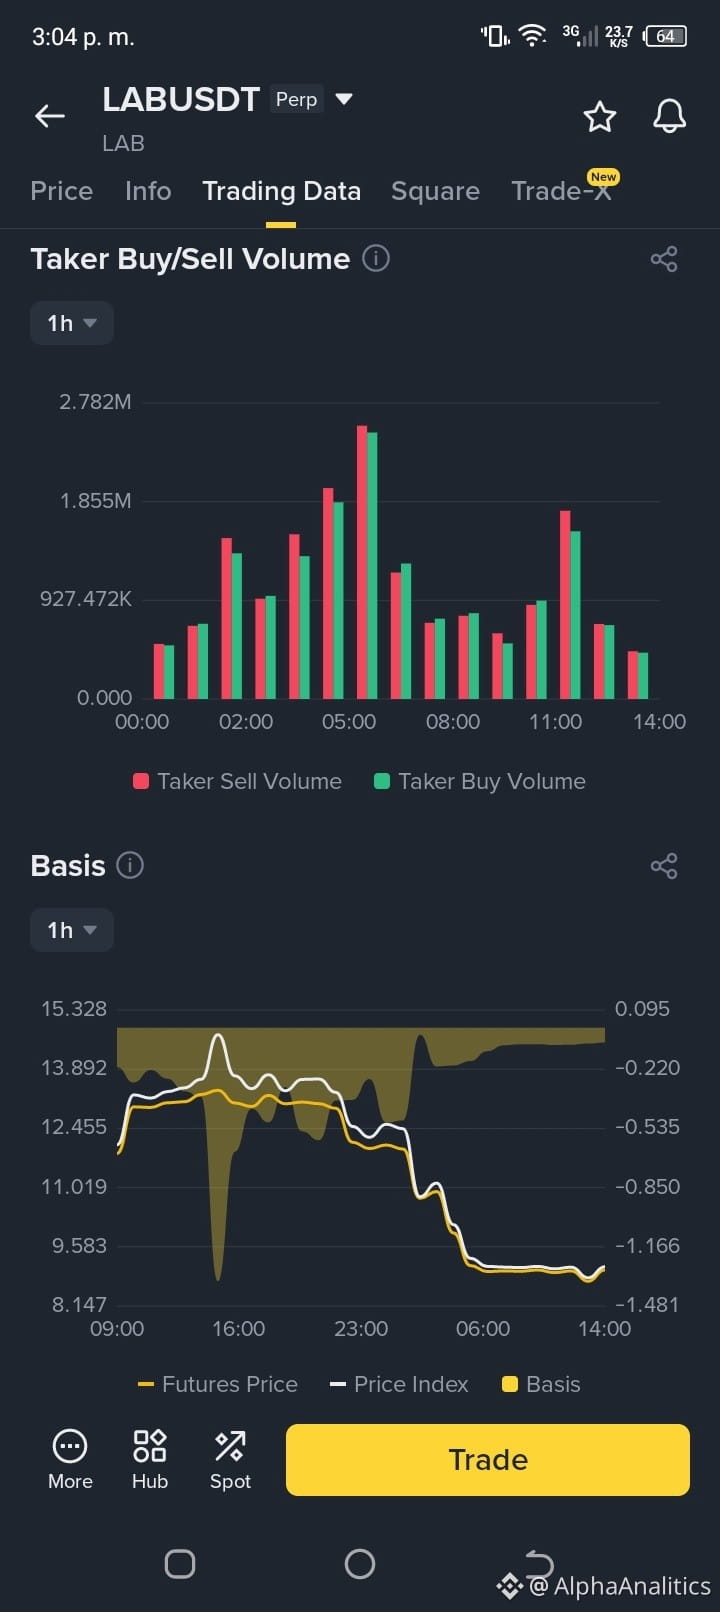
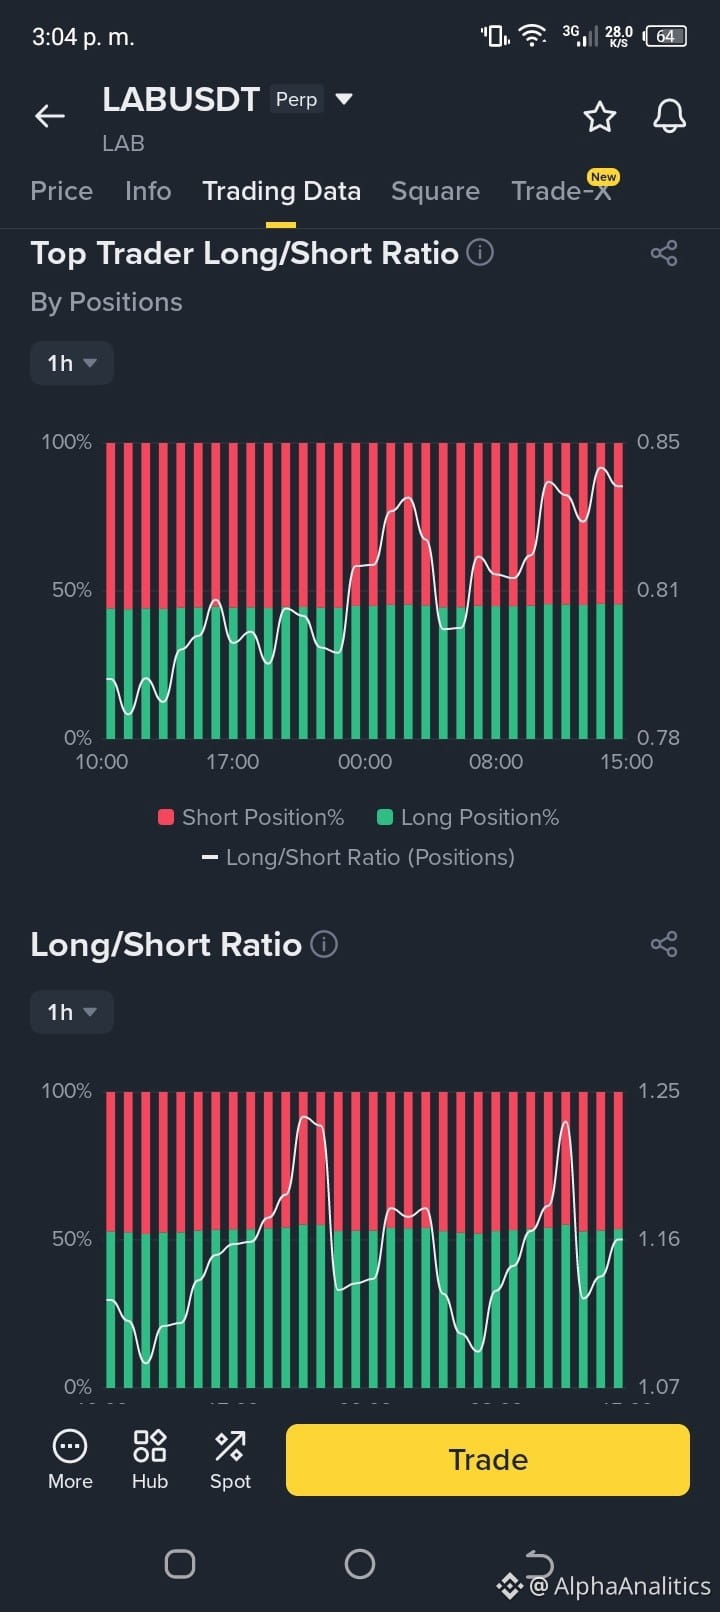
I’ve been analyzing the data flow of $LAB zUSDT and the situation is pretty clear: the asset is under significant selling pressure. Here’s what the numbers are telling us right now:
Trend: The price is trading below the 4h moving average, which is a clear sign of technical weakness.
Sentiment: Open Interest has increased, suggesting that fresh money is actively betting that the drop has the momentum to continue.
Funding Rate: It remains in negative territory, confirming that traders are paying to hold their short positions.
“Whales” positioning: The ratio of major traders by positions remains tilted toward the short side.
My stance:
Be careful is key, especially since we’re talking about an early-stage project with extreme fluctuations. The current structure shows selling dominance, so for now I’d rather stay out of impulsive buys and watch how the price reacts around support zones.
Remember: in assets with this much volatility, data analysis is the only thing that keeps us grounded! 📊
What do you think? Do you believe it will find a bottom soon, or is there still more downside ahead? I’m reading your thoughts! 👇
#LAB #CryptoTrading #BinanceSquare #DataDriven #AnalisisCrypto
📉 What’s happening with $LAB ?
I’ve been analyzing the data flow of $LAB zUSDT and the situation is pretty clear: the asset is under significant selling pressure. Here’s what the numbers are telling us right now:
Trend: The price is trading below the 4h moving average, which is a clear sign of technical weakness.
Sentiment: Open Interest has increased, suggesting that fresh money is actively betting that the drop has the momentum to continue.
Funding Rate: It remains in negative territory, confirming that traders are paying to hold their short positions.
“Whales” positioning: The ratio of major traders by positions remains tilted toward the short side.
My stance:
Be careful is key, especially since we’re talking about an early-stage project with extreme fluctuations. The current structure shows selling dominance, so for now I’d rather stay out of impulsive buys and watch how the price reacts around support zones.
Remember: in assets with this much volatility, data analysis is the only thing that keeps us grounded! 📊
What do you think? Do you believe it will find a bottom soon, or is there still more downside ahead? I’m reading your thoughts! 👇
#LAB #CryptoTrading #BinanceSquare #DataDriven #AnalisisCrypto
I’ve been analyzing the data flow of $LAB zUSDT and the situation is pretty clear: the asset is under significant selling pressure. Here’s what the numbers are telling us right now:
Trend: The price is trading below the 4h moving average, which is a clear sign of technical weakness.
Sentiment: Open Interest has increased, suggesting that fresh money is actively betting that the drop has the momentum to continue.
Funding Rate: It remains in negative territory, confirming that traders are paying to hold their short positions.
“Whales” positioning: The ratio of major traders by positions remains tilted toward the short side.
My stance:
Be careful is key, especially since we’re talking about an early-stage project with extreme fluctuations. The current structure shows selling dominance, so for now I’d rather stay out of impulsive buys and watch how the price reacts around support zones.
Remember: in assets with this much volatility, data analysis is the only thing that keeps us grounded! 📊
What do you think? Do you believe it will find a bottom soon, or is there still more downside ahead? I’m reading your thoughts! 👇
#LAB #CryptoTrading #BinanceSquare #DataDriven #AnalisisCrypto
117
·
--
Vitalik just revamped the ETH value thesis — and this matters to anyone still holding ETH.
The facts: On X, on Nov. 8, 2026, Vitalik Buterin said ETH should be valued as a store of value, not as a “fee-burning token.” EIP-1559 and its burn mechanism will remain, but in his view, the burn isn’t the foundation of ETH’s value: so far, the burn has amounted to only ~2.07% of new issuance, and ETH can still have value even if the burn stays below 10% of the breakeven level forever. Supporting a ~$270 billion market cap through in-protocol funding alone would require ~700,000 ETH per year. Sources: @VitalikButerin’s X post on Nov. 8, 2026, covered by Crypto Briefing, crypto.news, and KuCoin.
My take: this is an honest admission from the inside. The “ultrasound money” thesis that once anchored the ETH narrative turns out to be fragile when activity is low and L2s siphon fees away from mainnet. Vitalik is shifting the foundation to decentralization and CROPS — censorship resistance, capture resistance, open source, privacy, and security. To me, this actually strengthens ETH’s long-term prospects: its value no longer depends on how busy the network is today. But let’s be honest, this new narrative may not move the price tomorrow — ETH is still down 17% over the past month, and the ETH/BTC ratio is at 0.0295.
What I’m watching next: whether the market responds to this narrative or keeps waiting for U.S. CPI on Nov. 10; and whether ETH can hold above $2,200.
This is my analysis, not financial advice — always DYOR.
What do you think: should ETH be valued more as a store of value or remain a productive asset that generates fees?
#Ethereum #AnalisisCrypto $ETH
Vitalik just revamped the ETH value thesis — and this matters to anyone still holding ETH.
The facts: On X, on Nov. 8, 2026, Vitalik Buterin said ETH should be valued as a store of value, not as a “fee-burning token.” EIP-1559 and its burn mechanism will remain, but in his view, the burn isn’t the foundation of ETH’s value: so far, the burn has amounted to only ~2.07% of new issuance, and ETH can still have value even if the burn stays below 10% of the breakeven level forever. Supporting a ~$270 billion market cap through in-protocol funding alone would require ~700,000 ETH per year. Sources: @VitalikButerin’s X post on Nov. 8, 2026, covered by Crypto Briefing, crypto.news, and KuCoin.
My take: this is an honest admission from the inside. The “ultrasound money” thesis that once anchored the ETH narrative turns out to be fragile when activity is low and L2s siphon fees away from mainnet. Vitalik is shifting the foundation to decentralization and CROPS — censorship resistance, capture resistance, open source, privacy, and security. To me, this actually strengthens ETH’s long-term prospects: its value no longer depends on how busy the network is today. But let’s be honest, this new narrative may not move the price tomorrow — ETH is still down 17% over the past month, and the ETH/BTC ratio is at 0.0295.
What I’m watching next: whether the market responds to this narrative or keeps waiting for U.S. CPI on Nov. 10; and whether ETH can hold above $2,200.
This is my analysis, not financial advice — always DYOR.
What do you think: should ETH be valued more as a store of value or remain a productive asset that generates fees?
#Ethereum #AnalisisCrypto $ETH
The facts: On X, on Nov. 8, 2026, Vitalik Buterin said ETH should be valued as a store of value, not as a “fee-burning token.” EIP-1559 and its burn mechanism will remain, but in his view, the burn isn’t the foundation of ETH’s value: so far, the burn has amounted to only ~2.07% of new issuance, and ETH can still have value even if the burn stays below 10% of the breakeven level forever. Supporting a ~$270 billion market cap through in-protocol funding alone would require ~700,000 ETH per year. Sources: @VitalikButerin’s X post on Nov. 8, 2026, covered by Crypto Briefing, crypto.news, and KuCoin.
My take: this is an honest admission from the inside. The “ultrasound money” thesis that once anchored the ETH narrative turns out to be fragile when activity is low and L2s siphon fees away from mainnet. Vitalik is shifting the foundation to decentralization and CROPS — censorship resistance, capture resistance, open source, privacy, and security. To me, this actually strengthens ETH’s long-term prospects: its value no longer depends on how busy the network is today. But let’s be honest, this new narrative may not move the price tomorrow — ETH is still down 17% over the past month, and the ETH/BTC ratio is at 0.0295.
What I’m watching next: whether the market responds to this narrative or keeps waiting for U.S. CPI on Nov. 10; and whether ETH can hold above $2,200.
This is my analysis, not financial advice — always DYOR.
What do you think: should ETH be valued more as a store of value or remain a productive asset that generates fees?
#Ethereum #AnalisisCrypto $ETH
88

$SOXLB at 103.1: Do we break 105.6 or fall to 94.1?
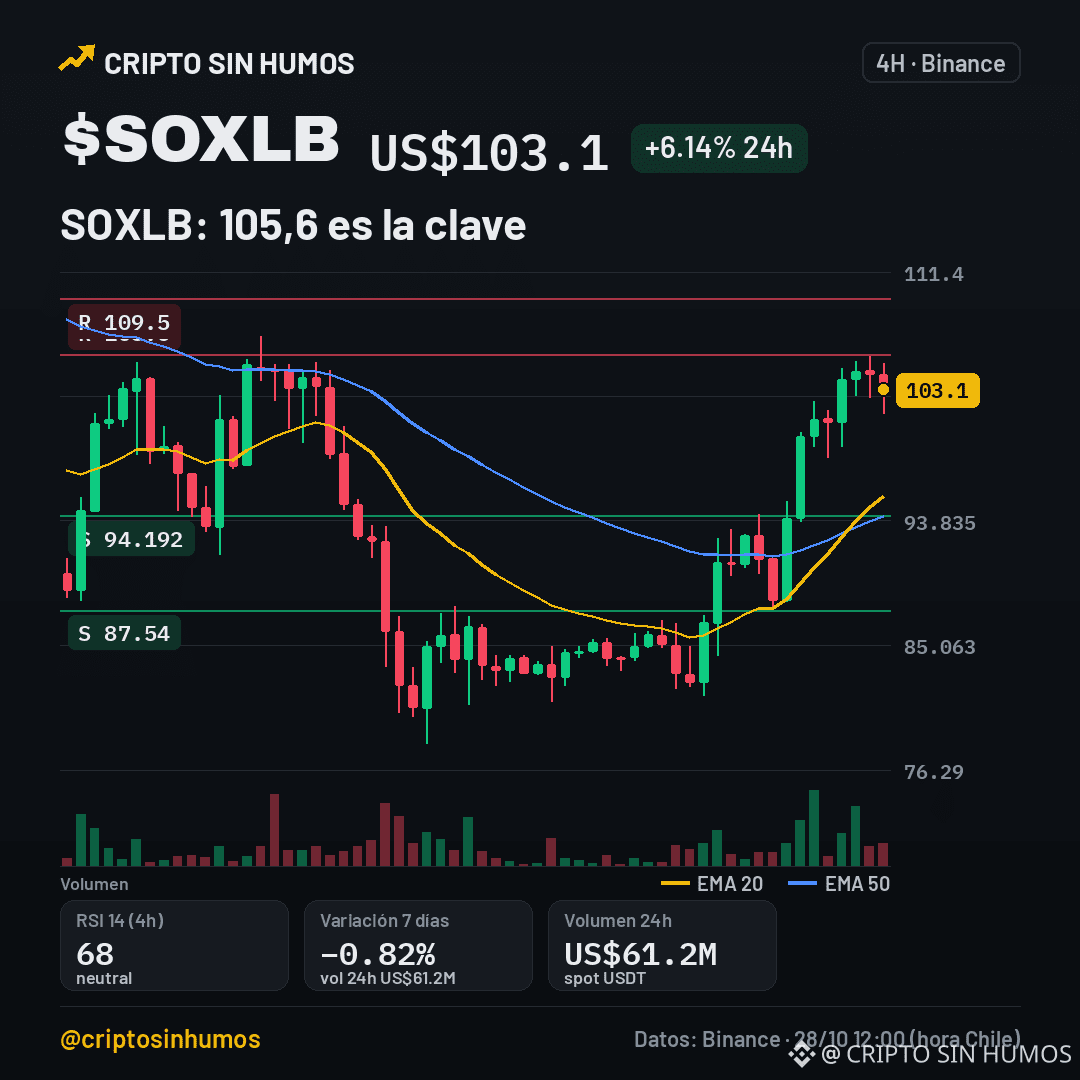
$SOXLB trades at US$103.1 after a +6.14% gain in 24h. The price remains above the EMA20 (95.572), confirming the 4h uptrend.
However, the RSI at 68.1 indicates overbought conditions. With US$61 million in volume, there’s not enough real momentum to break through the resistance at 105.6.
Bullish scenario: a 4h candle closes above 105.6. Target: 109.5. Bearish scenario: it loses 94.192. That would invalidate the structure and point to 87.54. My take: be careful about chasing the rally.
$PEPE (+10.2%) and $NEAR (+1.6%) are also moving.
Does it break 105.6 today or drop to 94.19? 🟢/🔴
#SOXLB #AnalisisCrypto #Trading4h
This is not financial advice. Verify before investing.
$SOXLB at 103.1: Do we break 105.6 or fall to 94.1?
$SOXLB trades at US$103.1 after a +6.14% gain in 24h. The price remains above the EMA20 (95.572), confirming the 4h uptrend.
However, the RSI at 68.1 indicates overbought conditions. With US$61 million in volume, there’s not enough real momentum to break through the resistance at 105.6.
Bullish scenario: a 4h candle closes above 105.6. Target: 109.5. Bearish scenario: it loses 94.192. That would invalidate the structure and point to 87.54. My take: be careful about chasing the rally.
$PEPE (+10.2%) and $NEAR (+1.6%) are also moving.
Does it break 105.6 today or drop to 94.19? 🟢/🔴
#SOXLB #AnalisisCrypto #Trading4h
This is not financial advice. Verify before investing.
$SOXLB trades at US$103.1 after a +6.14% gain in 24h. The price remains above the EMA20 (95.572), confirming the 4h uptrend.
However, the RSI at 68.1 indicates overbought conditions. With US$61 million in volume, there’s not enough real momentum to break through the resistance at 105.6.
Bullish scenario: a 4h candle closes above 105.6. Target: 109.5. Bearish scenario: it loses 94.192. That would invalidate the structure and point to 87.54. My take: be careful about chasing the rally.
$PEPE (+10.2%) and $NEAR (+1.6%) are also moving.
Does it break 105.6 today or drop to 94.19? 🟢/🔴
#SOXLB #AnalisisCrypto #Trading4h
This is not financial advice. Verify before investing.
116

·
--
📉 XRP Weakens as Whale Selling Pressure Draws Attention!
XRP fell 0.50% to $1.32 over the past 24 hours, while the broader crypto market edged slightly higher. The weakness is thought to have been driven by profit-taking from large holders.
🔎 Factors Affecting XRP:
🐋 Whale Pressure: Large XRP deposits to Binance reached $112.4 million, the highest level since March, indicating potential selling pressure.
📊 Weak Momentum: The RSI stands at 46.7, suggesting bullish momentum is not yet strong enough.
💰 Limited ETF Inflows: Inflows into XRP ETFs are still insufficient to offset selling pressure.
🎯 Key Levels to Watch:
Support: $1.30
Resistance: $1.37
Downside target: $1.25 if support breaks.
📌 Summary: XRP is still facing short-term bearish pressure. If it manages to hold above $1.30, the price could consolidate. However, if that support gives way, the risk of a drop toward $1.25 should be watched.
Do you think XRP can hold at $1.30, or will it continue to fall? 👇
#XRP #Ripple #Crypto #BinanceSquare #AnalisisCrypto 💥$XRP $BTC $SOL
📉 XRP Weakens as Whale Selling Pressure Draws Attention!
XRP fell 0.50% to $1.32 over the past 24 hours, while the broader crypto market edged slightly higher. The weakness is thought to have been driven by profit-taking from large holders.
🔎 Factors Affecting XRP:
🐋 Whale Pressure: Large XRP deposits to Binance reached $112.4 million, the highest level since March, indicating potential selling pressure.
📊 Weak Momentum: The RSI stands at 46.7, suggesting bullish momentum is not yet strong enough.
💰 Limited ETF Inflows: Inflows into XRP ETFs are still insufficient to offset selling pressure.
🎯 Key Levels to Watch:
Support: $1.30
Resistance: $1.37
Downside target: $1.25 if support breaks.
📌 Summary: XRP is still facing short-term bearish pressure. If it manages to hold above $1.30, the price could consolidate. However, if that support gives way, the risk of a drop toward $1.25 should be watched.
Do you think XRP can hold at $1.30, or will it continue to fall? 👇
#XRP #Ripple #Crypto #BinanceSquare #AnalisisCrypto 💥$XRP $BTC $SOL
XRP fell 0.50% to $1.32 over the past 24 hours, while the broader crypto market edged slightly higher. The weakness is thought to have been driven by profit-taking from large holders.
🔎 Factors Affecting XRP:
🐋 Whale Pressure: Large XRP deposits to Binance reached $112.4 million, the highest level since March, indicating potential selling pressure.
📊 Weak Momentum: The RSI stands at 46.7, suggesting bullish momentum is not yet strong enough.
💰 Limited ETF Inflows: Inflows into XRP ETFs are still insufficient to offset selling pressure.
🎯 Key Levels to Watch:
Support: $1.30
Resistance: $1.37
Downside target: $1.25 if support breaks.
📌 Summary: XRP is still facing short-term bearish pressure. If it manages to hold above $1.30, the price could consolidate. However, if that support gives way, the risk of a drop toward $1.25 should be watched.
Do you think XRP can hold at $1.30, or will it continue to fall? 👇
#XRP #Ripple #Crypto #BinanceSquare #AnalisisCrypto 💥$XRP $BTC $SOL
1
22
Log in to explore more content
Join global crypto users on Binance Square
⚡️ Get latest and useful information about crypto.
💬 Trusted by the world’s largest crypto exchange.
👍 Discover real insights from verified creators.
Email / Phone number
Trending Topics
1
#HuangExitNvidiaStrategyInFocus
104,050 views
1,143 Discussing
2
#AnthropicRejectsIPODelayValuationinQuestion
711,644 views
5,367 Discussing
3
#HedgeFundsCMEBitcoinNetShortsFall89%
308 views
24 Discussing
4
#BitMineReports$6.3BNetLossForFiscal2026
13,372 views
134 Discussing
5
#AnthropicIPOAboutSixTimesOversubscribed
87 views
14 Discussing
6
#SoFiExpandsSoFiUSDStablecoinToPolygon
1,892 views
47 Discussing
7
#TetherGoldXAUTCompletesKPMGAudit
1,646 views
48 Discussing
8
#ChipStocksExtendLossesAfterNvidiaCEOChange
41,908 views
488 Discussing
9
#TrezorConfirmsMaliciousImplantsIn3Safe5Devices
440 views
21 Discussing
10
#TradFiForBeginners
538,349 views
3,751 Discussing