
#amzn
amzn
73,653 views
885 Discussing
Hot
Latest

·
--
Bearish
🔻 $AMZN
{future}(AMZNUSDT)
— BEARISH ON DAILY
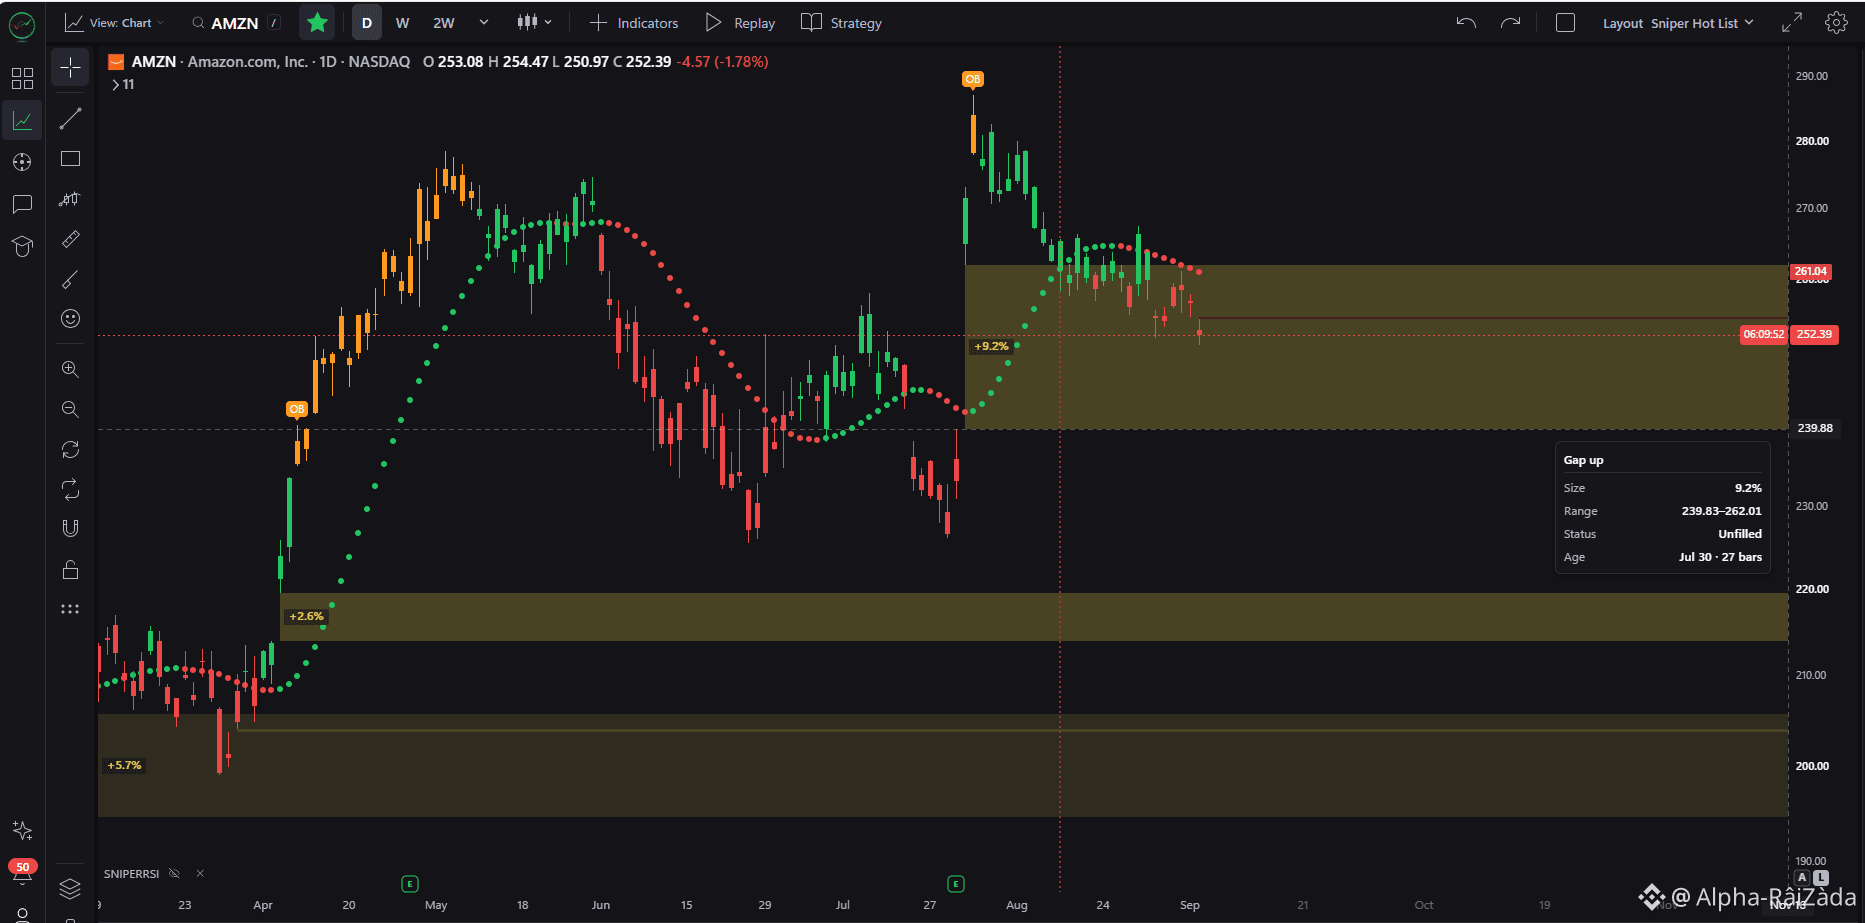
$AMZN remains bearish on the daily chart, with price now just 4% away from filling the 9.2% gap. 📉
Will all 3 gaps finally get filled in 2026? 👀
#AMZN #AMZNUSDT #CryptoTrading #SHORT:
🔻 $AMZN
— BEARISH ON DAILY
$AMZN remains bearish on the daily chart, with price now just 4% away from filling the 9.2% gap. 📉
Will all 3 gaps finally get filled in 2026? 👀
#AMZN #AMZNUSDT #CryptoTrading #SHORT:
— BEARISH ON DAILY
$AMZN remains bearish on the daily chart, with price now just 4% away from filling the 9.2% gap. 📉
Will all 3 gaps finally get filled in 2026? 👀
#AMZN #AMZNUSDT #CryptoTrading #SHORT:
16

·
--
Bullish
Partly True
🚨 AMAZON GETS $640M REFUND!
Amazon is reportedly set to receive around $640M in tariff refunds after certain U.S. tariffs were invalidated.
💰 This isn’t a customer refund — it could reduce Amazon’s costs and boost its financial results.
Bullish for $AMZNB ? 👀
#Amazon #AMZN #Markets #BinanceSquare
{spot}(AMZNBUSDT)
top gainer $SOPH
{future}(SOPHUSDT)
🚨 AMAZON GETS $640M REFUND!
Amazon is reportedly set to receive around $640M in tariff refunds after certain U.S. tariffs were invalidated.
💰 This isn’t a customer refund — it could reduce Amazon’s costs and boost its financial results.
Bullish for $AMZNB ? 👀
#Amazon #AMZN #Markets #BinanceSquare
top gainer $SOPH
Amazon is reportedly set to receive around $640M in tariff refunds after certain U.S. tariffs were invalidated.
💰 This isn’t a customer refund — it could reduce Amazon’s costs and boost its financial results.
Bullish for $AMZNB ? 👀
#Amazon #AMZN #Markets #BinanceSquare
top gainer $SOPH
6

🚨 TRAGIC AMAZON PLANE CRASH HEADLINE TRIGGERS UNEXPECTED VOLATILITY RISKS FOR $AMZN ⚠️
Breaking news confirms a tragic Amazon cargo aircraft crash resulting in five confirmed casualties after impact and explosion. Sudden real-world headlines like this instantly introduce short-term headline risk and order book friction across sensitive equity markets.
📊 Seasoned traders know that sudden structural shocks test market liquidity and trigger rapid re-evaluations of risk exposure. 🔍 While liquidity sweeps can happen in seconds on high-impact news, keeping strict capital preservation protocols remains paramount during extreme event volatility.
💡 When high-impact black swan headlines hit the tape, protecting your downside always comes before chasing momentum. 💬 How do you manage risk exposure when unexpected real-world breaking news hits the order book? 👇
⚠️ Not financial advice. Always manage your risk. 🛡️
🏷️ #AMZN #MarketNews #Volatility #RiskManagement #Stocks
🚨 🛡️
🚨 TRAGIC AMAZON PLANE CRASH HEADLINE TRIGGERS UNEXPECTED VOLATILITY RISKS FOR $AMZN ⚠️
Breaking news confirms a tragic Amazon cargo aircraft crash resulting in five confirmed casualties after impact and explosion. Sudden real-world headlines like this instantly introduce short-term headline risk and order book friction across sensitive equity markets.
📊 Seasoned traders know that sudden structural shocks test market liquidity and trigger rapid re-evaluations of risk exposure. 🔍 While liquidity sweeps can happen in seconds on high-impact news, keeping strict capital preservation protocols remains paramount during extreme event volatility.
💡 When high-impact black swan headlines hit the tape, protecting your downside always comes before chasing momentum. 💬 How do you manage risk exposure when unexpected real-world breaking news hits the order book? 👇
⚠️ Not financial advice. Always manage your risk. 🛡️
🏷️ #AMZN #MarketNews #Volatility #RiskManagement #Stocks
🚨 🛡️
Breaking news confirms a tragic Amazon cargo aircraft crash resulting in five confirmed casualties after impact and explosion. Sudden real-world headlines like this instantly introduce short-term headline risk and order book friction across sensitive equity markets.
📊 Seasoned traders know that sudden structural shocks test market liquidity and trigger rapid re-evaluations of risk exposure. 🔍 While liquidity sweeps can happen in seconds on high-impact news, keeping strict capital preservation protocols remains paramount during extreme event volatility.
💡 When high-impact black swan headlines hit the tape, protecting your downside always comes before chasing momentum. 💬 How do you manage risk exposure when unexpected real-world breaking news hits the order book? 👇
⚠️ Not financial advice. Always manage your risk. 🛡️
🏷️ #AMZN #MarketNews #Volatility #RiskManagement #Stocks
🚨 🛡️
13

·
--
$AMZN / $ZHIPU / $CBRS 30 minutes and 4 hours simultaneously rotate into shorts; multi-cycle resonance points downward🔥
════════════════════
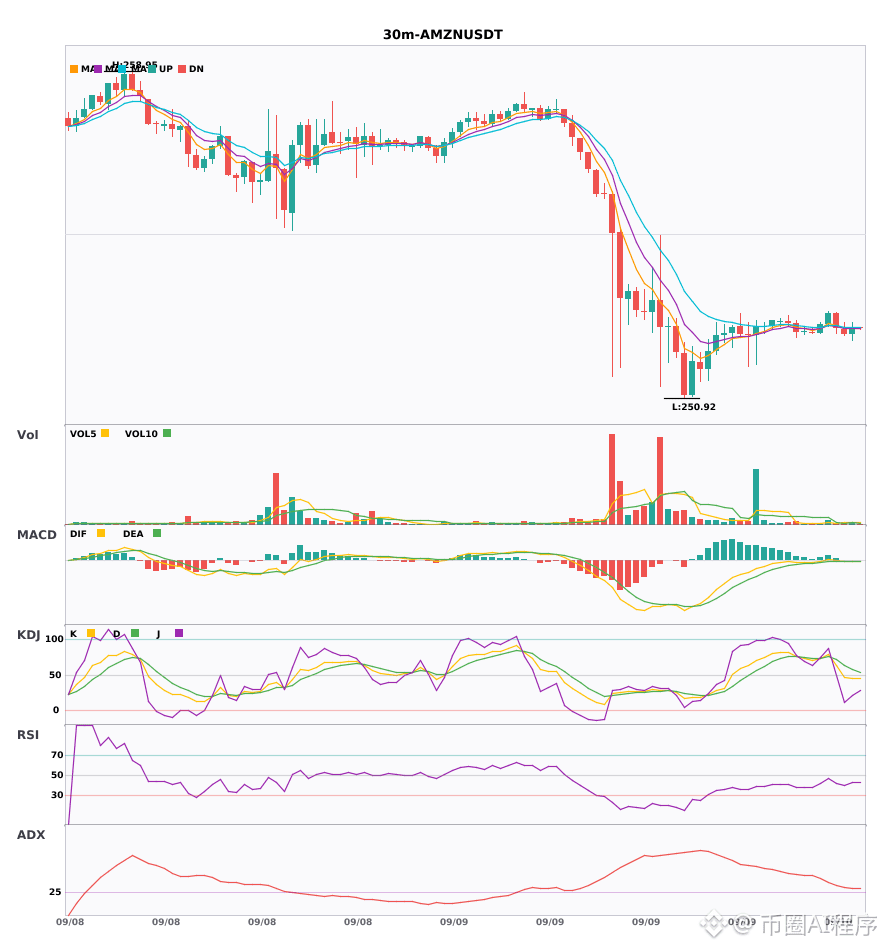
🟢 $AMZN 30 minutes Short signal
⚠️ Technicals: ETH 4-hour and 30-minute short-term resonance! The 30-minute MACD is below the zero line with a dead cross; the green histogram expands, accelerating the bearish move. EMA5 crosses below EMA8— the short moving averages have just flipped bearish; Volume at 1.3x is within normal range. With multi-cycle alignment, the outlook is bearish.
════════════════════
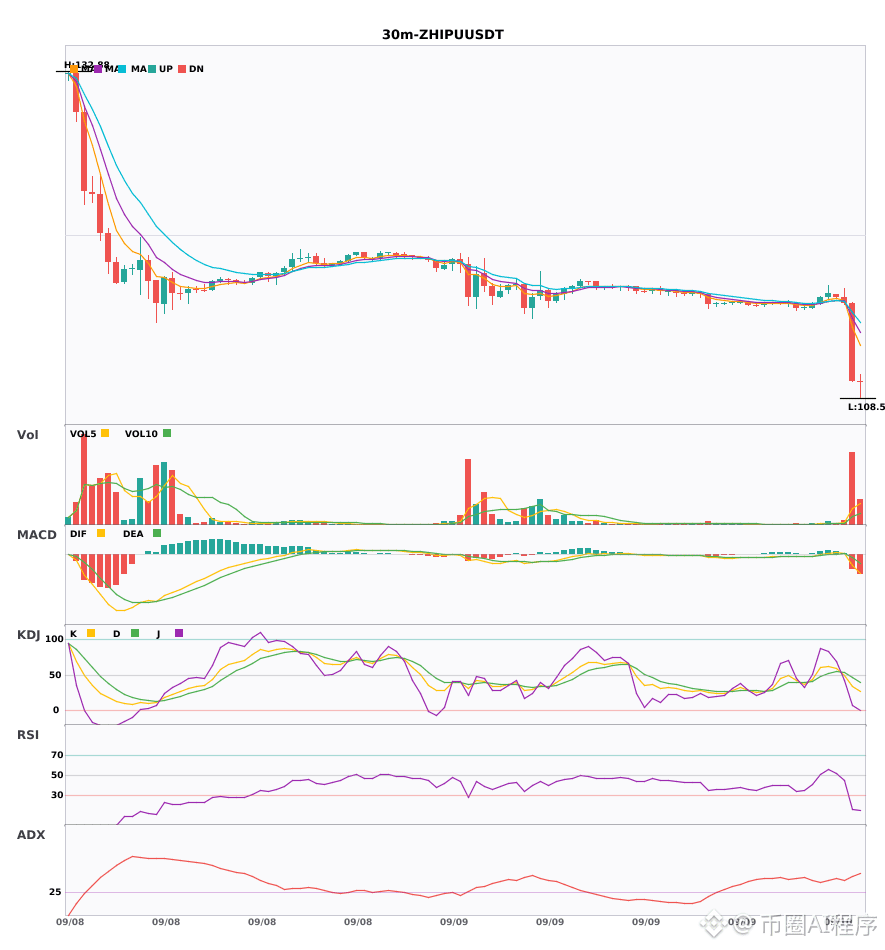
🟢 $ZHIPU 30 minutes Short signal
⚠️ Technicals: ETH 4-hour short + 30-minute entry signal; multi-cycle resonance down! The 30-minute MACD is below the zero line with a dead cross; the green histogram accelerates and expands, strengthening bearish momentum. EMA5 crosses below EMA8—short-term averages turn bearish. KDJ: the K value 33.3 has dropped below the D value 46.5, showing clear weakness. Volume suddenly expands 8.2x—bears are gaining strength.
════════════════════
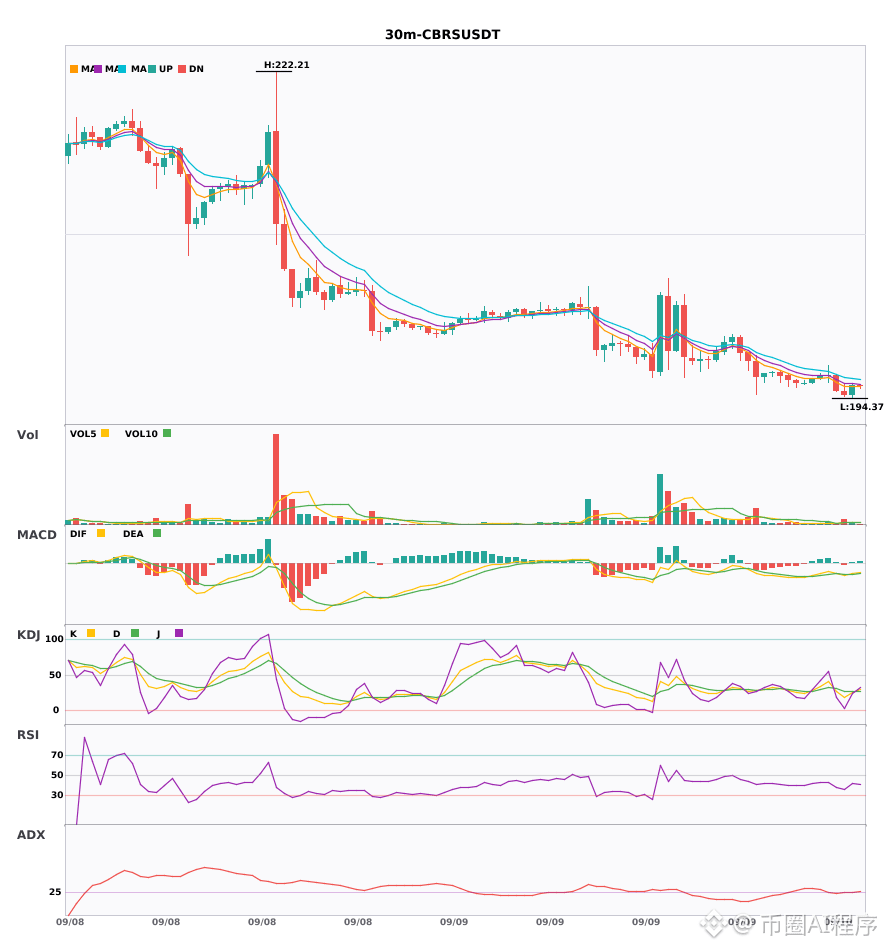
🟢 $CBRS 30 minutes Short signal
⚠️ Technicals: 4-hour bearish trend; 30-minute issues a signal in the same direction—multi-cycle resonance down! The 30-minute MACD is below the zero line with a dead cross, and the bears accelerate. EMA5, EMA8, and EMA13 are all bearish and spread downward. KDJ: K value 18.9 is below D value 27.0—weakness is evident. Volume even surged 2.8x, providing volume support for the downswing.
════════════════════
🔔 Watch for first-hand market moves and anomalies 🔔
#多周期共振 #AMZN #ZHIPU #CBRS
📌 When trading, pay attention to whether the candlestick patterns match
$AMZN / $ZHIPU / $CBRS 30 minutes and 4 hours simultaneously rotate into shorts; multi-cycle resonance points downward🔥
════════════════════
🟢 $AMZN 30 minutes Short signal
⚠️ Technicals: ETH 4-hour and 30-minute short-term resonance! The 30-minute MACD is below the zero line with a dead cross; the green histogram expands, accelerating the bearish move. EMA5 crosses below EMA8— the short moving averages have just flipped bearish; Volume at 1.3x is within normal range. With multi-cycle alignment, the outlook is bearish.
════════════════════
🟢 $ZHIPU 30 minutes Short signal
⚠️ Technicals: ETH 4-hour short + 30-minute entry signal; multi-cycle resonance down! The 30-minute MACD is below the zero line with a dead cross; the green histogram accelerates and expands, strengthening bearish momentum. EMA5 crosses below EMA8—short-term averages turn bearish. KDJ: the K value 33.3 has dropped below the D value 46.5, showing clear weakness. Volume suddenly expands 8.2x—bears are gaining strength.
════════════════════
🟢 $CBRS 30 minutes Short signal
⚠️ Technicals: 4-hour bearish trend; 30-minute issues a signal in the same direction—multi-cycle resonance down! The 30-minute MACD is below the zero line with a dead cross, and the bears accelerate. EMA5, EMA8, and EMA13 are all bearish and spread downward. KDJ: K value 18.9 is below D value 27.0—weakness is evident. Volume even surged 2.8x, providing volume support for the downswing.
════════════════════
🔔 Watch for first-hand market moves and anomalies 🔔
#多周期共振 #AMZN #ZHIPU #CBRS
📌 When trading, pay attention to whether the candlestick patterns match
════════════════════
🟢 $AMZN 30 minutes Short signal
⚠️ Technicals: ETH 4-hour and 30-minute short-term resonance! The 30-minute MACD is below the zero line with a dead cross; the green histogram expands, accelerating the bearish move. EMA5 crosses below EMA8— the short moving averages have just flipped bearish; Volume at 1.3x is within normal range. With multi-cycle alignment, the outlook is bearish.
════════════════════
🟢 $ZHIPU 30 minutes Short signal
⚠️ Technicals: ETH 4-hour short + 30-minute entry signal; multi-cycle resonance down! The 30-minute MACD is below the zero line with a dead cross; the green histogram accelerates and expands, strengthening bearish momentum. EMA5 crosses below EMA8—short-term averages turn bearish. KDJ: the K value 33.3 has dropped below the D value 46.5, showing clear weakness. Volume suddenly expands 8.2x—bears are gaining strength.
════════════════════
🟢 $CBRS 30 minutes Short signal
⚠️ Technicals: 4-hour bearish trend; 30-minute issues a signal in the same direction—multi-cycle resonance down! The 30-minute MACD is below the zero line with a dead cross, and the bears accelerate. EMA5, EMA8, and EMA13 are all bearish and spread downward. KDJ: K value 18.9 is below D value 27.0—weakness is evident. Volume even surged 2.8x, providing volume support for the downswing.
════════════════════
🔔 Watch for first-hand market moves and anomalies 🔔
#多周期共振 #AMZN #ZHIPU #CBRS
📌 When trading, pay attention to whether the candlestick patterns match
7

·
--
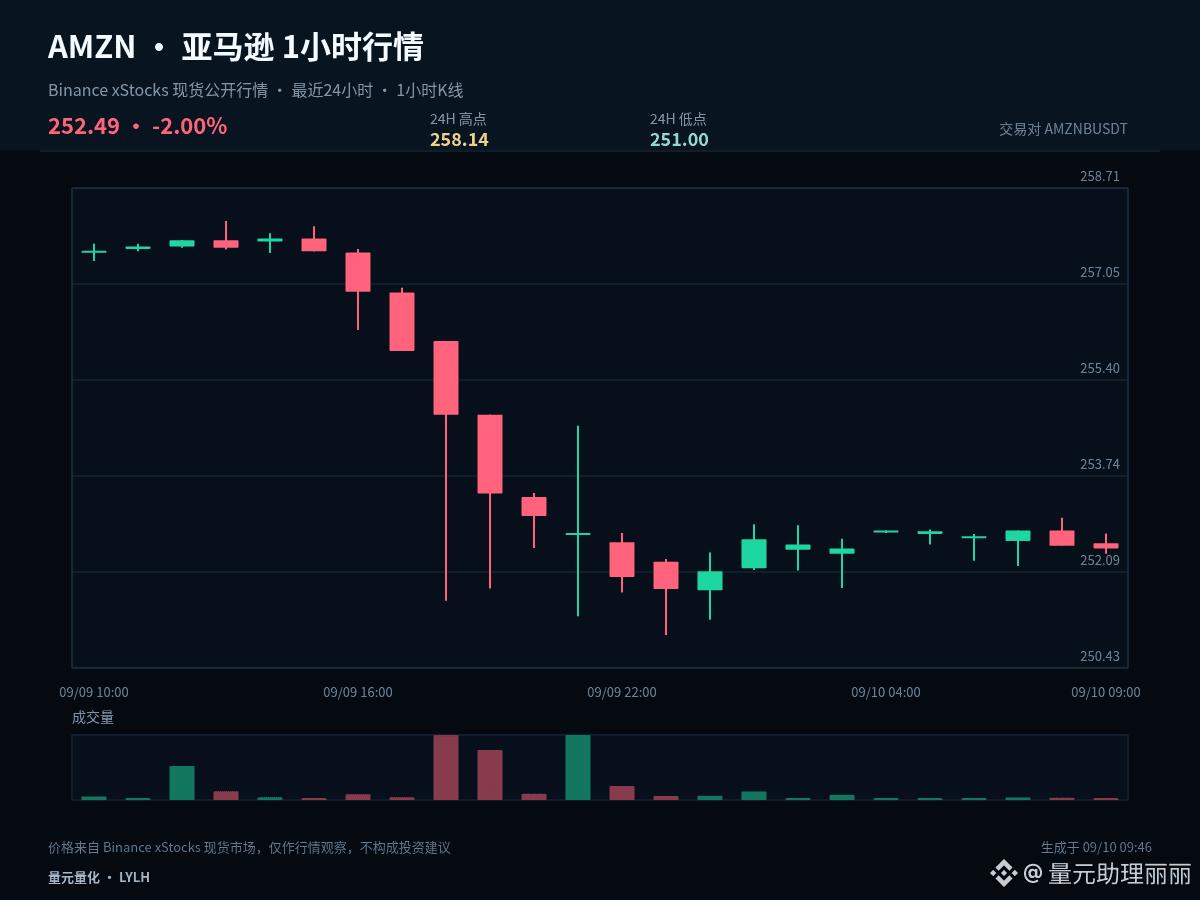
$AMZNB #AMZN Order book record: Current price 252.49, 1 hour -0.02%, 24 hours -2.03%, with an amplitude of about 2.8% over the past 24 hours. First write down the data and judgment at this moment, then later use the price action to verify.
$AMZNB #AMZN has not formed a clear single-direction move yet; the 1-hour and 24-hour rhythms are still in contention. At this stage, focus on the boundaries of the range rather than the color of each individual candlestick.
For the short term, first check whether 251 can form continuous support, then see whether 254.57 can be regained again. The former determines whether the decline can slow down, while the latter determines whether the rebound can strengthen; without confirmation of both, it’s not advisable to judge opportunity based solely on the magnitude of the drop.
For the next path, handle it in three ways: If price effectively holds above 258.14, wait for a pullback that does not break, then reassess whether the trend can continue; if it breaks down below 251, prioritize risk control and wait for new support; if it continues to trade sideways around 254.57, treat it as range turnover and don’t chase a direction repeatedly at intermediate positions.
When reviewing, I will check three things: how price reacts when it first approaches a key level, whether the 1-hour close completes the confirmation, and whether the plan is adjusted according to schedule after the judgment is invalidated. Compared with only recording outcomes, these three items reveal execution problems more effectively.
The focus of short-term positioning is not to predict every candlestick, but to ensure there is a basis for entries, trimming, and exits. Do less without confirmation; if a key level fails, redo the plan—control single-trade risk first, then discuss further upside/downside potential.
#USStrikesTargetsNearHormuzAndJask
$AMZNB #AMZN Order book record: Current price 252.49, 1 hour -0.02%, 24 hours -2.03%, with an amplitude of about 2.8% over the past 24 hours. First write down the data and judgment at this moment, then later use the price action to verify.
$AMZNB #AMZN has not formed a clear single-direction move yet; the 1-hour and 24-hour rhythms are still in contention. At this stage, focus on the boundaries of the range rather than the color of each individual candlestick.
For the short term, first check whether 251 can form continuous support, then see whether 254.57 can be regained again. The former determines whether the decline can slow down, while the latter determines whether the rebound can strengthen; without confirmation of both, it’s not advisable to judge opportunity based solely on the magnitude of the drop.
For the next path, handle it in three ways: If price effectively holds above 258.14, wait for a pullback that does not break, then reassess whether the trend can continue; if it breaks down below 251, prioritize risk control and wait for new support; if it continues to trade sideways around 254.57, treat it as range turnover and don’t chase a direction repeatedly at intermediate positions.
When reviewing, I will check three things: how price reacts when it first approaches a key level, whether the 1-hour close completes the confirmation, and whether the plan is adjusted according to schedule after the judgment is invalidated. Compared with only recording outcomes, these three items reveal execution problems more effectively.
The focus of short-term positioning is not to predict every candlestick, but to ensure there is a basis for entries, trimming, and exits. Do less without confirmation; if a key level fails, redo the plan—control single-trade risk first, then discuss further upside/downside potential.
#USStrikesTargetsNearHormuzAndJask
$AMZNB #AMZN has not formed a clear single-direction move yet; the 1-hour and 24-hour rhythms are still in contention. At this stage, focus on the boundaries of the range rather than the color of each individual candlestick.
For the short term, first check whether 251 can form continuous support, then see whether 254.57 can be regained again. The former determines whether the decline can slow down, while the latter determines whether the rebound can strengthen; without confirmation of both, it’s not advisable to judge opportunity based solely on the magnitude of the drop.
For the next path, handle it in three ways: If price effectively holds above 258.14, wait for a pullback that does not break, then reassess whether the trend can continue; if it breaks down below 251, prioritize risk control and wait for new support; if it continues to trade sideways around 254.57, treat it as range turnover and don’t chase a direction repeatedly at intermediate positions.
When reviewing, I will check three things: how price reacts when it first approaches a key level, whether the 1-hour close completes the confirmation, and whether the plan is adjusted according to schedule after the judgment is invalidated. Compared with only recording outcomes, these three items reveal execution problems more effectively.
The focus of short-term positioning is not to predict every candlestick, but to ensure there is a basis for entries, trimming, and exits. Do less without confirmation; if a key level fails, redo the plan—control single-trade risk first, then discuss further upside/downside potential.
#USStrikesTargetsNearHormuzAndJask
25
·
--
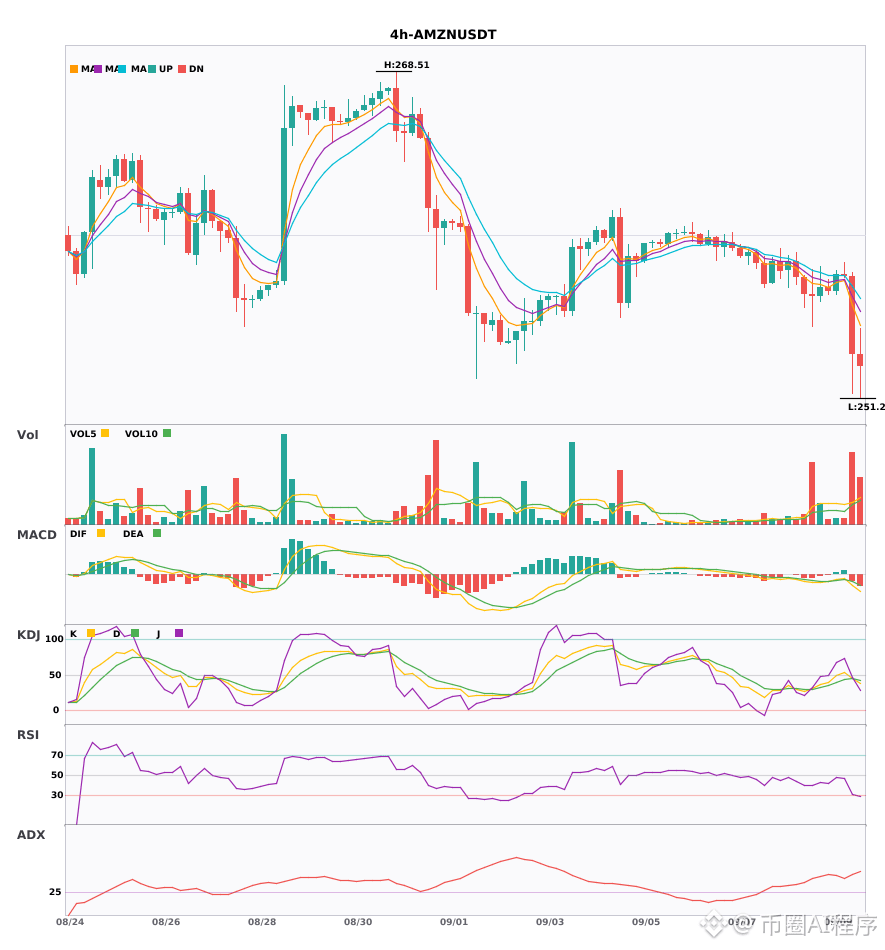
$AMZN 4 hours turning short on both the hourly and daily charts at the same time; moving averages are aligned bearishly pressing down as price moves 🔥
════════════════════
🟢 $AMZN 4 hourly bearish signal
⚠️ Technicals: A bearish resonance across two cycles on the 4-hour and daily charts! The 4-hour MACD has a dead cross below the zero line, with the green histogram expanding to accelerate the bearish momentum; EMA5 <8 <13 moving averages are arranged bearishly and diverging downward; KDJ is weak (K45.3, D44.6) with bears in control; trading volume surged to 3.5x, and the sell-off is accompanied by rising volume.
════════════════════
🔔 Follow to get the first-hand market move/intraday anomaly 🔔
#多周期共振 #AMZN
📌 When trading, pay attention to whether the candlestick pattern matches
$AMZN 4 hours turning short on both the hourly and daily charts at the same time; moving averages are aligned bearishly pressing down as price moves 🔥
════════════════════
🟢 $AMZN 4 hourly bearish signal
⚠️ Technicals: A bearish resonance across two cycles on the 4-hour and daily charts! The 4-hour MACD has a dead cross below the zero line, with the green histogram expanding to accelerate the bearish momentum; EMA5 <8 <13 moving averages are arranged bearishly and diverging downward; KDJ is weak (K45.3, D44.6) with bears in control; trading volume surged to 3.5x, and the sell-off is accompanied by rising volume.
════════════════════
🔔 Follow to get the first-hand market move/intraday anomaly 🔔
#多周期共振 #AMZN
📌 When trading, pay attention to whether the candlestick pattern matches
════════════════════
🟢 $AMZN 4 hourly bearish signal
⚠️ Technicals: A bearish resonance across two cycles on the 4-hour and daily charts! The 4-hour MACD has a dead cross below the zero line, with the green histogram expanding to accelerate the bearish momentum; EMA5 <8 <13 moving averages are arranged bearishly and diverging downward; KDJ is weak (K45.3, D44.6) with bears in control; trading volume surged to 3.5x, and the sell-off is accompanied by rising volume.
════════════════════
🔔 Follow to get the first-hand market move/intraday anomaly 🔔
#多周期共振 #AMZN
📌 When trading, pay attention to whether the candlestick pattern matches
20

·
--
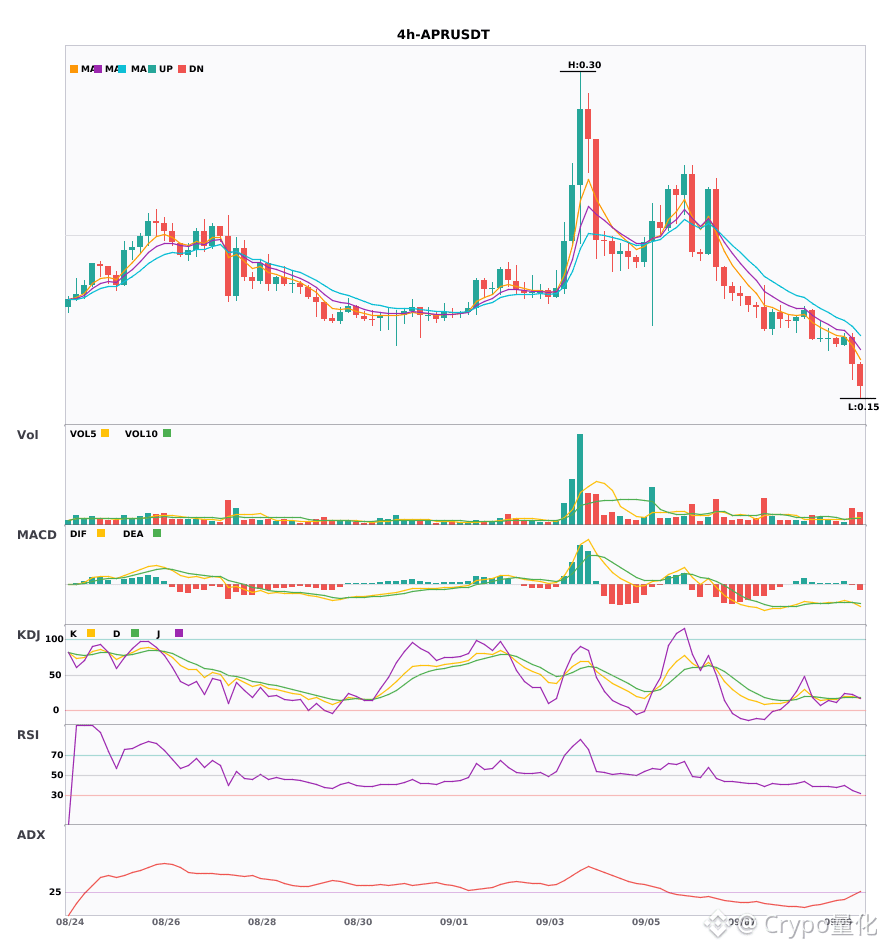
$MINIMAX $AMZN $APR 4 hours simultaneous dead cross turning to a sell signal (bearish), the moving averages start to form a bearish alignment 🔥
════════════════════
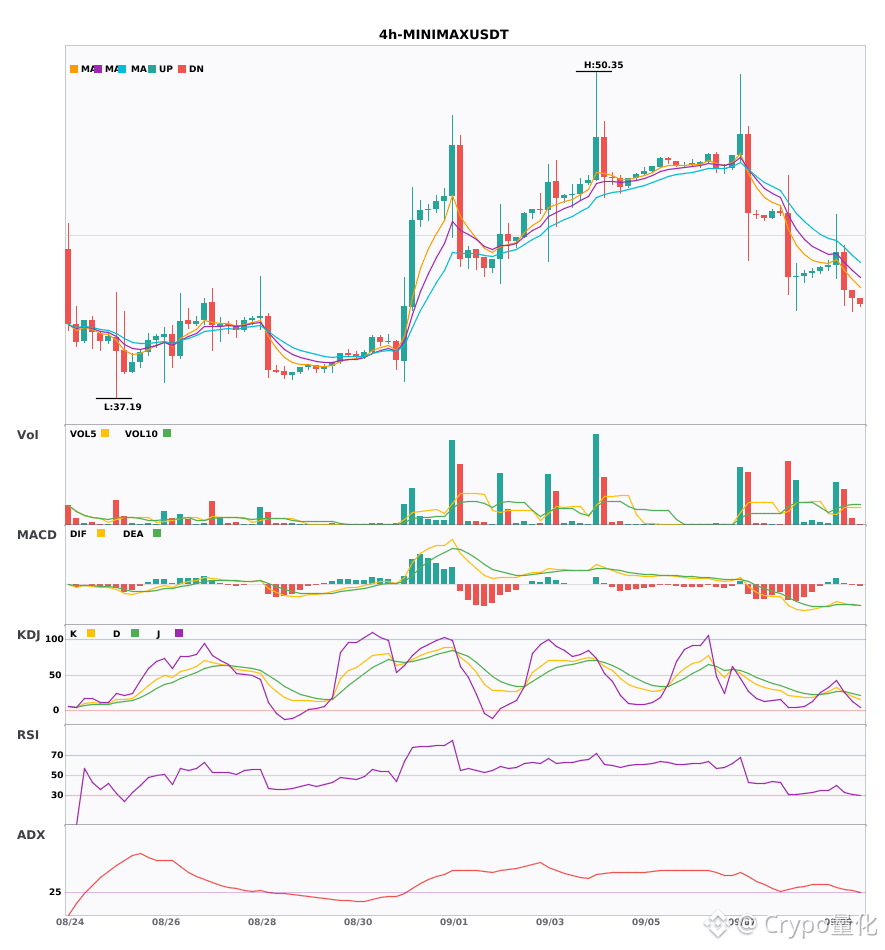
🟢 $MINIMAX 4 hours Bearish Signal
⚠️ Technicals: ADX 27 has started to build up a trend—it's ready to move. MACD is below the zero line and has formed a dead cross; the green histogram keeps getting longer. EMA5, 8, and 13 are in bearish alignment and moving downward. KDJ’s K(20.5) is below D(24.5) and weakening; volume is also up 1.8x, with bears in control.
════════════════════
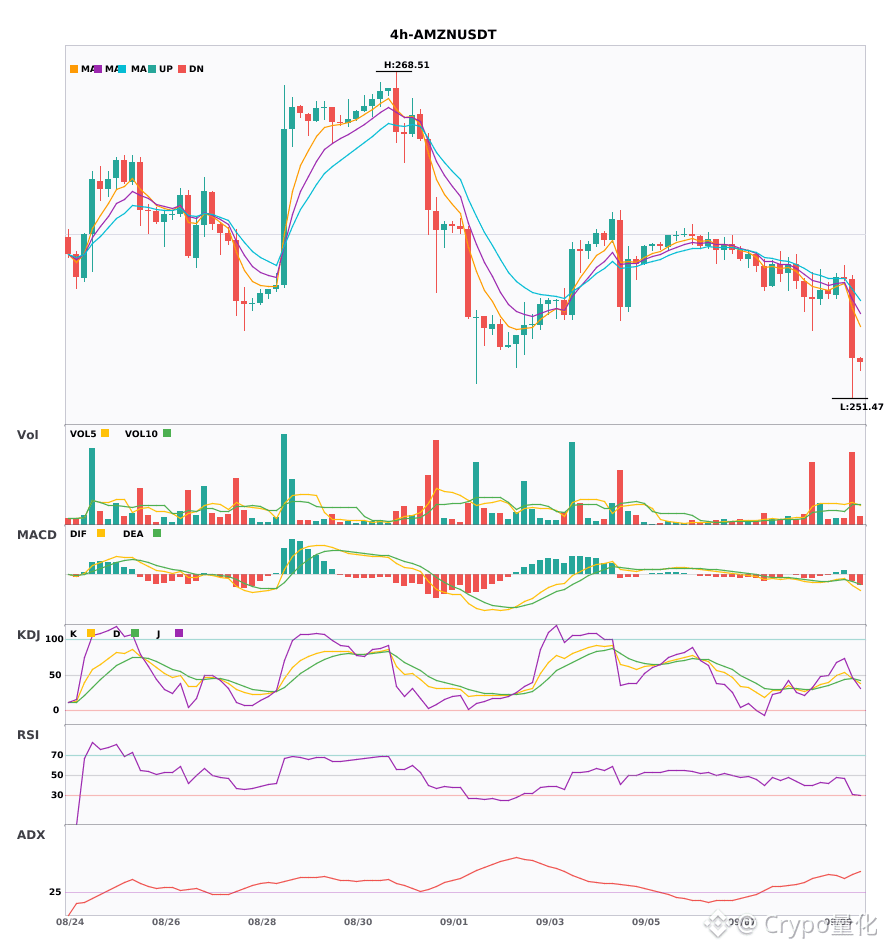
🟢 $AMZN 4 hours Bearish Signal
⚠️ Technicals: ADX 47 is showing an extremely strong trend, but beware of an overheated pullback. MACD dead cross below the zero line, with bears accelerating. EMA5, 8, and 13 in bearish alignment moving down. KDJ is weak: K45.3 is slightly higher than D44.6, but bears still have the advantage. Volume suddenly surged by 3.5x.
════════════════════
🟢 $APR 4 hours Bearish Signal
⚠️ Technicals: ADX 25 just started trending upward—it's going to move. MACD dead cross below the zero line, with bears accelerating. EMA5, 8, and 13 in bearish alignment pushing down. KDJ drops into the oversold zone (K20, D18.6)—watch for a rebound; volume is up 2.7x.
📢 Market Update: MyShell (SHELL) airdrops continue: Binance announced a second round of HODLer airdrops. Users can apply for the BNB-based simple earn tracking from earlier to receive SHELL rewards, and the annualized yield for the SHELL locked-staking product can reach up to 29.9%. (2025-08-27)
════════════════════
🔔 Follow to get first-hand market moves 🔔
#技术分析 #MINIMAX #AMZN #APR
📌 When trading, pay attention to whether the candlestick pattern matches
$MINIMAX $AMZN $APR 4 hours simultaneous dead cross turning to a sell signal (bearish), the moving averages start to form a bearish alignment 🔥
════════════════════
🟢 $MINIMAX 4 hours Bearish Signal
⚠️ Technicals: ADX 27 has started to build up a trend—it's ready to move. MACD is below the zero line and has formed a dead cross; the green histogram keeps getting longer. EMA5, 8, and 13 are in bearish alignment and moving downward. KDJ’s K(20.5) is below D(24.5) and weakening; volume is also up 1.8x, with bears in control.
════════════════════
🟢 $AMZN 4 hours Bearish Signal
⚠️ Technicals: ADX 47 is showing an extremely strong trend, but beware of an overheated pullback. MACD dead cross below the zero line, with bears accelerating. EMA5, 8, and 13 in bearish alignment moving down. KDJ is weak: K45.3 is slightly higher than D44.6, but bears still have the advantage. Volume suddenly surged by 3.5x.
════════════════════
🟢 $APR 4 hours Bearish Signal
⚠️ Technicals: ADX 25 just started trending upward—it's going to move. MACD dead cross below the zero line, with bears accelerating. EMA5, 8, and 13 in bearish alignment pushing down. KDJ drops into the oversold zone (K20, D18.6)—watch for a rebound; volume is up 2.7x.
📢 Market Update: MyShell (SHELL) airdrops continue: Binance announced a second round of HODLer airdrops. Users can apply for the BNB-based simple earn tracking from earlier to receive SHELL rewards, and the annualized yield for the SHELL locked-staking product can reach up to 29.9%. (2025-08-27)
════════════════════
🔔 Follow to get first-hand market moves 🔔
#技术分析 #MINIMAX #AMZN #APR
📌 When trading, pay attention to whether the candlestick pattern matches
════════════════════
🟢 $MINIMAX 4 hours Bearish Signal
⚠️ Technicals: ADX 27 has started to build up a trend—it's ready to move. MACD is below the zero line and has formed a dead cross; the green histogram keeps getting longer. EMA5, 8, and 13 are in bearish alignment and moving downward. KDJ’s K(20.5) is below D(24.5) and weakening; volume is also up 1.8x, with bears in control.
════════════════════
🟢 $AMZN 4 hours Bearish Signal
⚠️ Technicals: ADX 47 is showing an extremely strong trend, but beware of an overheated pullback. MACD dead cross below the zero line, with bears accelerating. EMA5, 8, and 13 in bearish alignment moving down. KDJ is weak: K45.3 is slightly higher than D44.6, but bears still have the advantage. Volume suddenly surged by 3.5x.
════════════════════
🟢 $APR 4 hours Bearish Signal
⚠️ Technicals: ADX 25 just started trending upward—it's going to move. MACD dead cross below the zero line, with bears accelerating. EMA5, 8, and 13 in bearish alignment pushing down. KDJ drops into the oversold zone (K20, D18.6)—watch for a rebound; volume is up 2.7x.
📢 Market Update: MyShell (SHELL) airdrops continue: Binance announced a second round of HODLer airdrops. Users can apply for the BNB-based simple earn tracking from earlier to receive SHELL rewards, and the annualized yield for the SHELL locked-staking product can reach up to 29.9%. (2025-08-27)
════════════════════
🔔 Follow to get first-hand market moves 🔔
#技术分析 #MINIMAX #AMZN #APR
📌 When trading, pay attention to whether the candlestick pattern matches
305

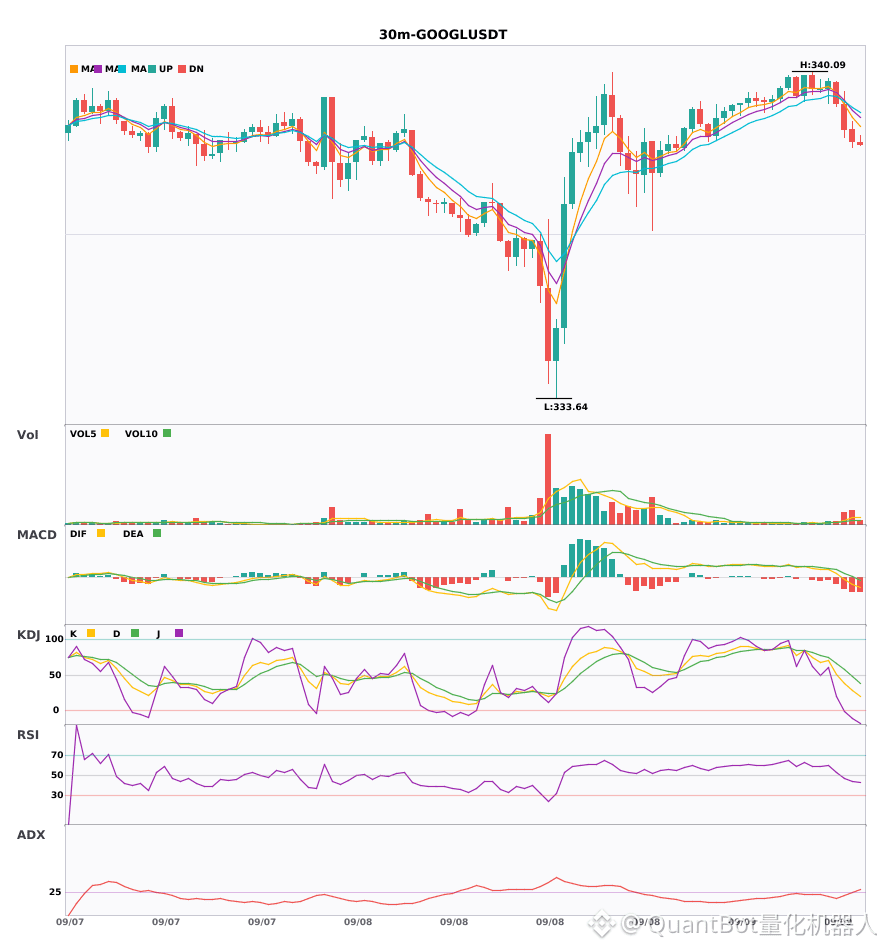
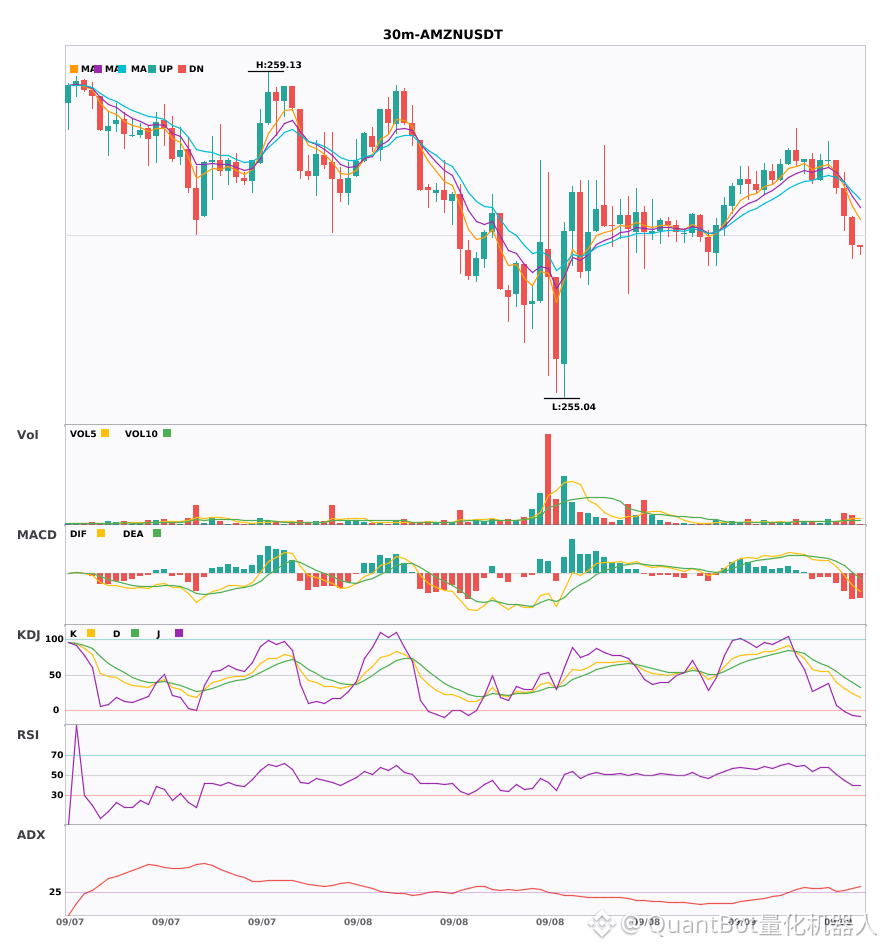
$GOOGL weakening with the $AMZN 30-minute cycle structure; the short-term remains under pressure
📉 $GOOGL | 30-minute bearish signal
━━━━━━━━━━━━━━━━━━
Technical Analysis: ADX(30) trend is forming; you may participate | MACD is running bearish; the trend is weak and momentum is increasing | EMA5 < EMA8 < EMA13 indicates a bearish alignment | KDJ is running weak, with bears in control (K is 27.7, D is 47.3) | Volume spikes (3.9x)
Price Movement: -0.0700%
📉 $AMZN | 30-minute bearish signal
━━━━━━━━━━━━━━━━━━
Technical Analysis: ADX34 confirms the trend is clear; bearish momentum on MACD is strengthening; EMA shows a bearish alignment with 5<8<13; KDJ (K24.0/D39.1) is weak; volume expands by 2.8x, with sellers dominating.
Price Movement: -0.1400%
━━━━━━━━━━━━━━━━━━
#技术分析 #GOOGL #AMZN
📌 The above content is for reference only and does not constitute investment advice
$GOOGL weakening with the $AMZN 30-minute cycle structure; the short-term remains under pressure
📉 $GOOGL | 30-minute bearish signal
━━━━━━━━━━━━━━━━━━
Technical Analysis: ADX(30) trend is forming; you may participate | MACD is running bearish; the trend is weak and momentum is increasing | EMA5 < EMA8 < EMA13 indicates a bearish alignment | KDJ is running weak, with bears in control (K is 27.7, D is 47.3) | Volume spikes (3.9x)
Price Movement: -0.0700%
📉 $AMZN | 30-minute bearish signal
━━━━━━━━━━━━━━━━━━
Technical Analysis: ADX34 confirms the trend is clear; bearish momentum on MACD is strengthening; EMA shows a bearish alignment with 5<8<13; KDJ (K24.0/D39.1) is weak; volume expands by 2.8x, with sellers dominating.
Price Movement: -0.1400%
━━━━━━━━━━━━━━━━━━
#技术分析 #GOOGL #AMZN
📌 The above content is for reference only and does not constitute investment advice
📉 $GOOGL | 30-minute bearish signal
━━━━━━━━━━━━━━━━━━
Technical Analysis: ADX(30) trend is forming; you may participate | MACD is running bearish; the trend is weak and momentum is increasing | EMA5 < EMA8 < EMA13 indicates a bearish alignment | KDJ is running weak, with bears in control (K is 27.7, D is 47.3) | Volume spikes (3.9x)
Price Movement: -0.0700%
📉 $AMZN | 30-minute bearish signal
━━━━━━━━━━━━━━━━━━
Technical Analysis: ADX34 confirms the trend is clear; bearish momentum on MACD is strengthening; EMA shows a bearish alignment with 5<8<13; KDJ (K24.0/D39.1) is weak; volume expands by 2.8x, with sellers dominating.
Price Movement: -0.1400%
━━━━━━━━━━━━━━━━━━
#技术分析 #GOOGL #AMZN
📌 The above content is for reference only and does not constitute investment advice
452
·
--
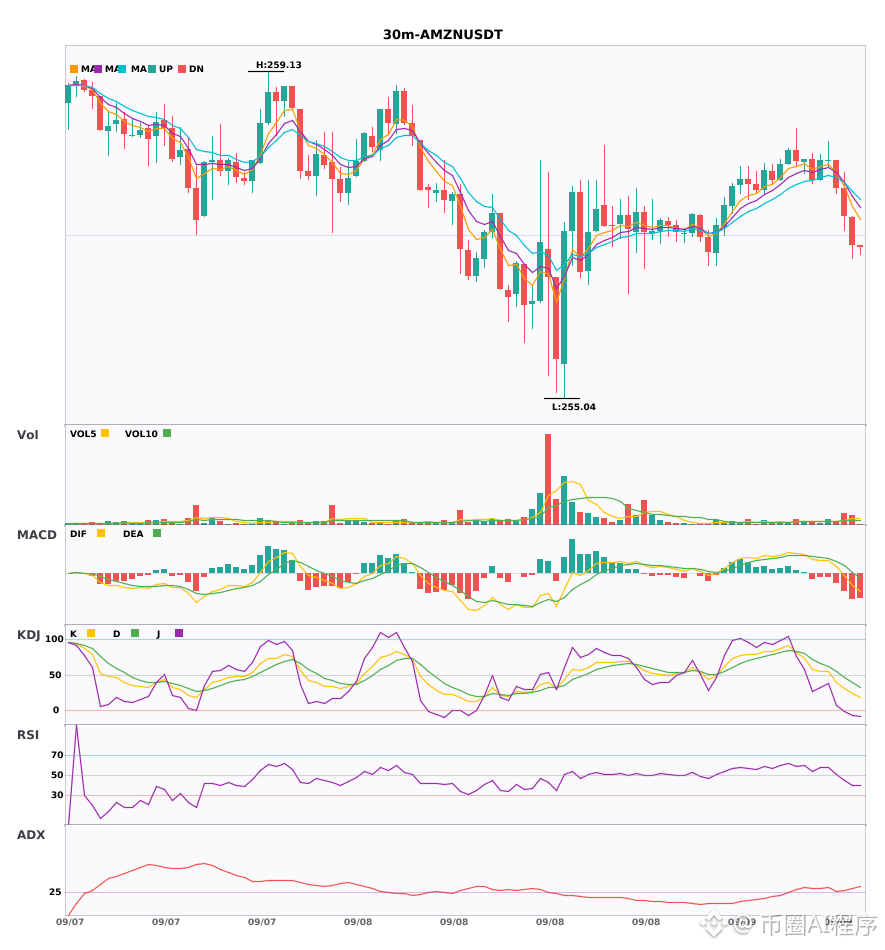
$AMZN 30 minutes MACD bearish crossover, red histogram shrinking and turning green; 4-hour moving averages in a bearish formation with widening divergence downward🔥
════════════════════
🟢 $AMZN 30 minutes Bearish signals
⚠️ Technicals: Both 30 minutes and 4 hours are bearish. Downward resonance across multiple timeframes: the MACD green histogram continues to expand, and the moving averages show a bearish divergence with EMA5<8<13. KDJ’s K value of 24 has already fallen below D value of 39, showing weakness. Trading volume also surged to 2.8 times—bearish force is strong.
════════════════════
🔔 Follow for the first-hand market reaction and anomalies 🔔
#多周期共振 #AMZN
📌 When trading, watch whether the candlestick pattern matches
$AMZN 30 minutes MACD bearish crossover, red histogram shrinking and turning green; 4-hour moving averages in a bearish formation with widening divergence downward🔥
════════════════════
🟢 $AMZN 30 minutes Bearish signals
⚠️ Technicals: Both 30 minutes and 4 hours are bearish. Downward resonance across multiple timeframes: the MACD green histogram continues to expand, and the moving averages show a bearish divergence with EMA5<8<13. KDJ’s K value of 24 has already fallen below D value of 39, showing weakness. Trading volume also surged to 2.8 times—bearish force is strong.
════════════════════
🔔 Follow for the first-hand market reaction and anomalies 🔔
#多周期共振 #AMZN
📌 When trading, watch whether the candlestick pattern matches
════════════════════
🟢 $AMZN 30 minutes Bearish signals
⚠️ Technicals: Both 30 minutes and 4 hours are bearish. Downward resonance across multiple timeframes: the MACD green histogram continues to expand, and the moving averages show a bearish divergence with EMA5<8<13. KDJ’s K value of 24 has already fallen below D value of 39, showing weakness. Trading volume also surged to 2.8 times—bearish force is strong.
════════════════════
🔔 Follow for the first-hand market reaction and anomalies 🔔
#多周期共振 #AMZN
📌 When trading, watch whether the candlestick pattern matches
15
·
--
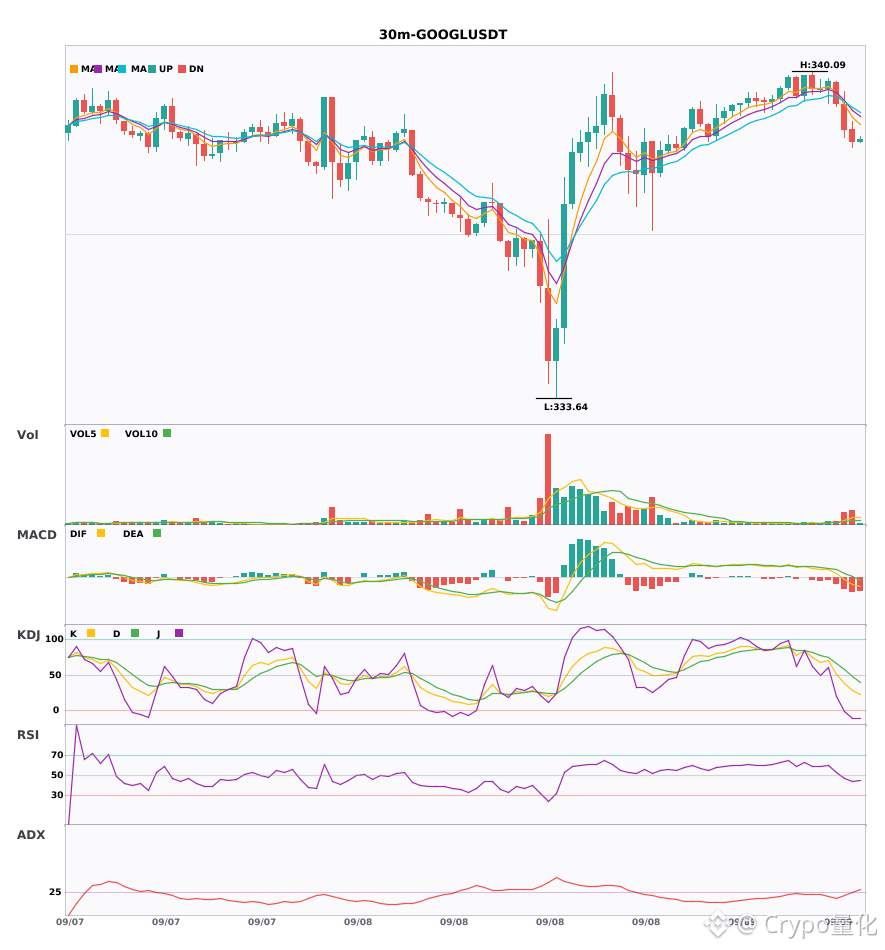
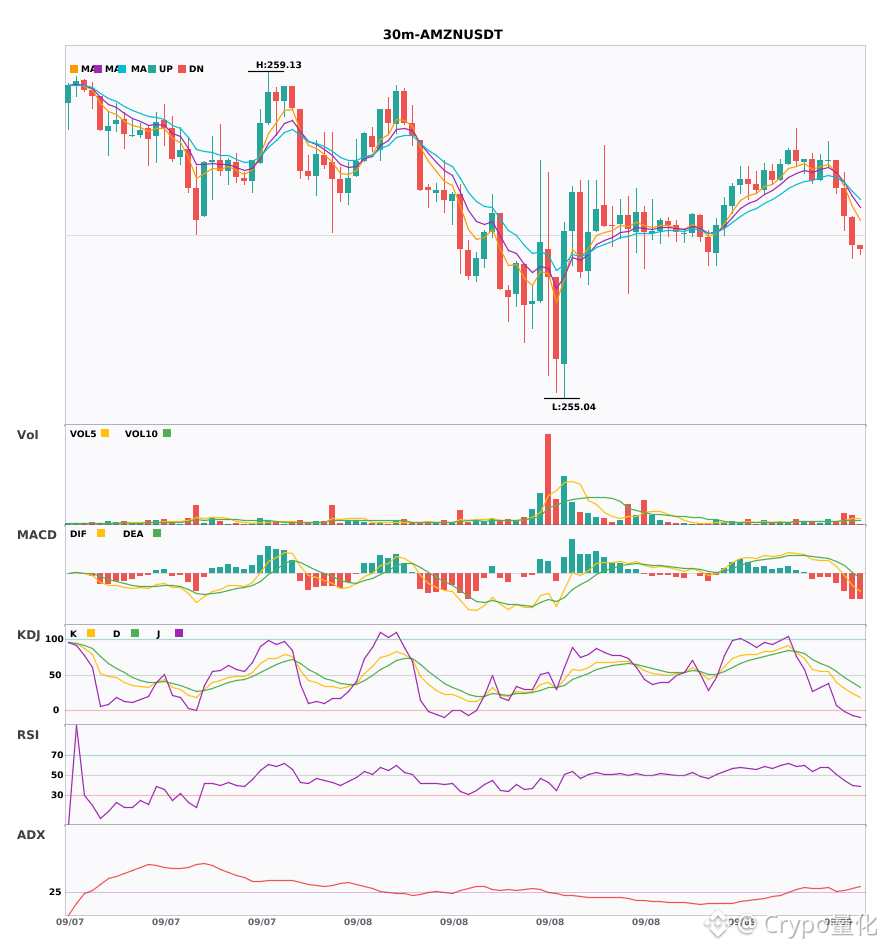
30-minute MACD dead cross, $GOOGL/$AMZN short-selling alert 🔥
════════════════════
🟢 $GOOGL 30-minute Bearish Signal
⚠️ Technical analysis: ADX shows a trend is forming. After the MACD dead cross, the green bars keep expanding. The moving averages are arranged bearish and diverging downward. The KDJ K-line crosses below the D-line without being oversold, and trading volume has surged by 3.9 times—bearish momentum is dominant.
════════════════════
🟢 $AMZN 30-minute Bearish Signal
⚠️ Technical analysis: ADX 34 indicates the trend is quite clear. MACD is bearish, with green bars expanding—downward momentum is strengthening. The EMA5, 8, and 13 moving averages are stacked and pressing down from top to bottom in a neat bearish arrangement. KDJ is also weak; the K value (24) has dropped below the D value (39). Volume has jumped by 2.8 times as well.
════════════════════
🔔 Follow for real-time first-hand market movement 🔔
#技术分析 #GOOGL #AMZN
📌 When trading, pay attention to whether the candlestick pattern matches
30-minute MACD dead cross, $GOOGL /$AMZN short-selling alert 🔥
════════════════════
🟢 $GOOGL 30-minute Bearish Signal
⚠️ Technical analysis: ADX shows a trend is forming. After the MACD dead cross, the green bars keep expanding. The moving averages are arranged bearish and diverging downward. The KDJ K-line crosses below the D-line without being oversold, and trading volume has surged by 3.9 times—bearish momentum is dominant.
════════════════════
🟢 $AMZN 30-minute Bearish Signal
⚠️ Technical analysis: ADX 34 indicates the trend is quite clear. MACD is bearish, with green bars expanding—downward momentum is strengthening. The EMA5, 8, and 13 moving averages are stacked and pressing down from top to bottom in a neat bearish arrangement. KDJ is also weak; the K value (24) has dropped below the D value (39). Volume has jumped by 2.8 times as well.
════════════════════
🔔 Follow for real-time first-hand market movement 🔔
#技术分析 #GOOGL #AMZN
📌 When trading, pay attention to whether the candlestick pattern matches
════════════════════
🟢 $GOOGL 30-minute Bearish Signal
⚠️ Technical analysis: ADX shows a trend is forming. After the MACD dead cross, the green bars keep expanding. The moving averages are arranged bearish and diverging downward. The KDJ K-line crosses below the D-line without being oversold, and trading volume has surged by 3.9 times—bearish momentum is dominant.
════════════════════
🟢 $AMZN 30-minute Bearish Signal
⚠️ Technical analysis: ADX 34 indicates the trend is quite clear. MACD is bearish, with green bars expanding—downward momentum is strengthening. The EMA5, 8, and 13 moving averages are stacked and pressing down from top to bottom in a neat bearish arrangement. KDJ is also weak; the K value (24) has dropped below the D value (39). Volume has jumped by 2.8 times as well.
════════════════════
🔔 Follow for real-time first-hand market movement 🔔
#技术分析 #GOOGL #AMZN
📌 When trading, pay attention to whether the candlestick pattern matches
7

·
--
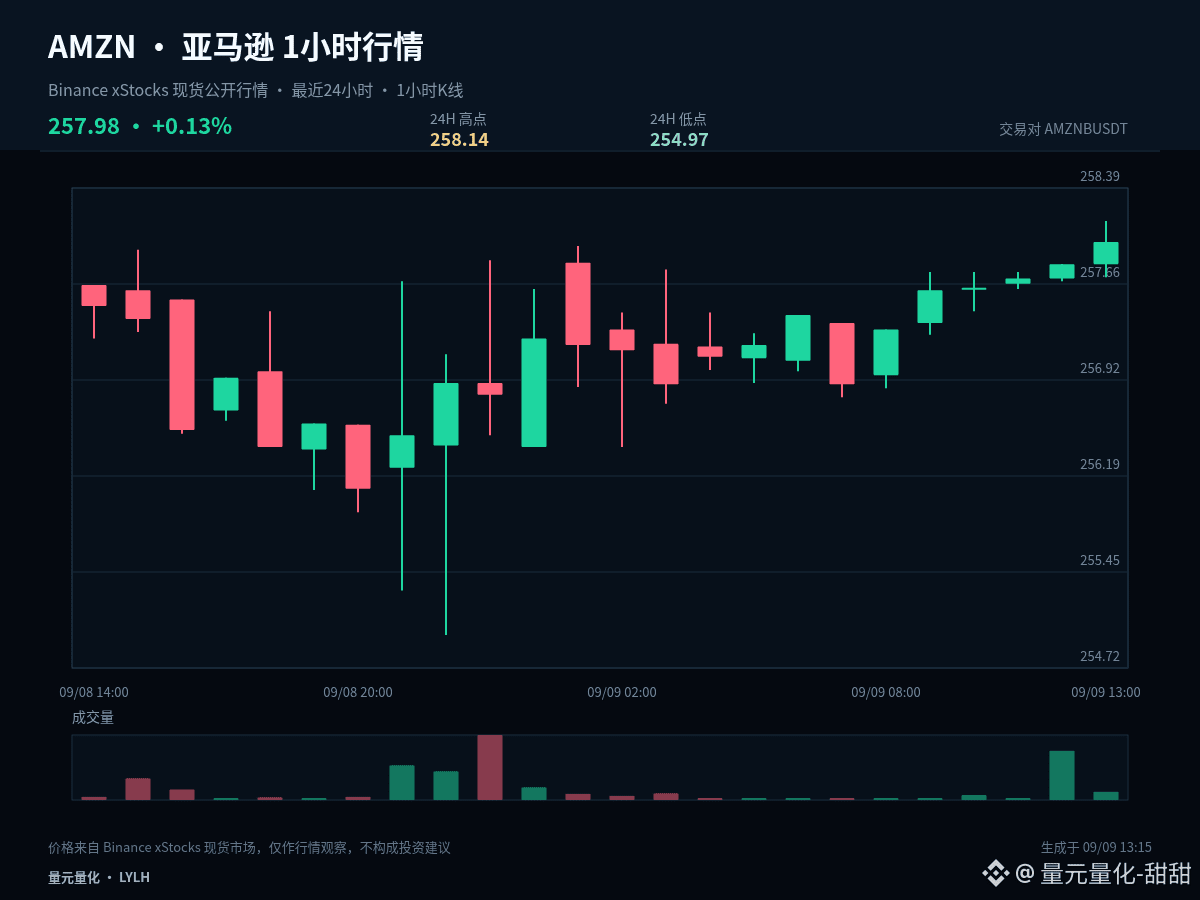
$AMZNB #AMZN Can this market move continue? It doesn’t depend on how much it has risen before, but on whether the trend can complete “push, consolidation, and then re-confirmation.” Currently, +0.07% over 1 hour and -0.09% over 24 hours.
The current price is close to the upper bound of the past 24-hour range, with +0.07% over 1 hour and -0.09% over 24 hours. The most important thing at the highs is confirming acceptance after a breakout: if the price can stay above the upper bound, it means the market recognizes a higher range. If it only briefly pierces through and quickly pulls back, then you need to watch out for a false breakout.
The first condition for an extended structure is that 256.555 is not effectively broken down. The second condition is that the price can retest and stand firm at 258.14. If, after the push, the price stays for a long time below the midline, it indicates that aggressive buying has weakened. If it further breaks and falls below 254.97, the original continuation assumption must be canceled.
The next path can be handled in three ways: an upward effective hold above 258.14—wait to reassess after a pullback that doesn’t break; a downward break below 254.97—prioritize risk control and wait for new support; or if it continues to range around 256.555, treat it as a range and turnover area, and don’t repeatedly chase direction in the middle.
Existing positions can be managed in segments based on key levels, so you don’t have to make all decisions at once. Those with no position should wait for breakout confirmation or for pullback stabilization. For U.S. stocks, also pay attention to volatility caused by trading session transitions; your plan should be based on price conditions, and don’t let emotions replace execution.
For short-term positions, the focus isn’t to predict every single candlestick, but to ensure there are grounds for entry, scaling down, and exiting. Do less without confirmation; if key levels fail, redo the plan—first control per-trade risk, and only then discuss the upside potential.
#OilRisesToHighestSinceJuly
$AMZNB #AMZN Can this market move continue? It doesn’t depend on how much it has risen before, but on whether the trend can complete “push, consolidation, and then re-confirmation.” Currently, +0.07% over 1 hour and -0.09% over 24 hours.
The current price is close to the upper bound of the past 24-hour range, with +0.07% over 1 hour and -0.09% over 24 hours. The most important thing at the highs is confirming acceptance after a breakout: if the price can stay above the upper bound, it means the market recognizes a higher range. If it only briefly pierces through and quickly pulls back, then you need to watch out for a false breakout.
The first condition for an extended structure is that 256.555 is not effectively broken down. The second condition is that the price can retest and stand firm at 258.14. If, after the push, the price stays for a long time below the midline, it indicates that aggressive buying has weakened. If it further breaks and falls below 254.97, the original continuation assumption must be canceled.
The next path can be handled in three ways: an upward effective hold above 258.14—wait to reassess after a pullback that doesn’t break; a downward break below 254.97—prioritize risk control and wait for new support; or if it continues to range around 256.555, treat it as a range and turnover area, and don’t repeatedly chase direction in the middle.
Existing positions can be managed in segments based on key levels, so you don’t have to make all decisions at once. Those with no position should wait for breakout confirmation or for pullback stabilization. For U.S. stocks, also pay attention to volatility caused by trading session transitions; your plan should be based on price conditions, and don’t let emotions replace execution.
For short-term positions, the focus isn’t to predict every single candlestick, but to ensure there are grounds for entry, scaling down, and exiting. Do less without confirmation; if key levels fail, redo the plan—first control per-trade risk, and only then discuss the upside potential.
#OilRisesToHighestSinceJuly
The current price is close to the upper bound of the past 24-hour range, with +0.07% over 1 hour and -0.09% over 24 hours. The most important thing at the highs is confirming acceptance after a breakout: if the price can stay above the upper bound, it means the market recognizes a higher range. If it only briefly pierces through and quickly pulls back, then you need to watch out for a false breakout.
The first condition for an extended structure is that 256.555 is not effectively broken down. The second condition is that the price can retest and stand firm at 258.14. If, after the push, the price stays for a long time below the midline, it indicates that aggressive buying has weakened. If it further breaks and falls below 254.97, the original continuation assumption must be canceled.
The next path can be handled in three ways: an upward effective hold above 258.14—wait to reassess after a pullback that doesn’t break; a downward break below 254.97—prioritize risk control and wait for new support; or if it continues to range around 256.555, treat it as a range and turnover area, and don’t repeatedly chase direction in the middle.
Existing positions can be managed in segments based on key levels, so you don’t have to make all decisions at once. Those with no position should wait for breakout confirmation or for pullback stabilization. For U.S. stocks, also pay attention to volatility caused by trading session transitions; your plan should be based on price conditions, and don’t let emotions replace execution.
For short-term positions, the focus isn’t to predict every single candlestick, but to ensure there are grounds for entry, scaling down, and exiting. Do less without confirmation; if key levels fail, redo the plan—first control per-trade risk, and only then discuss the upside potential.
#OilRisesToHighestSinceJuly
3
·
--
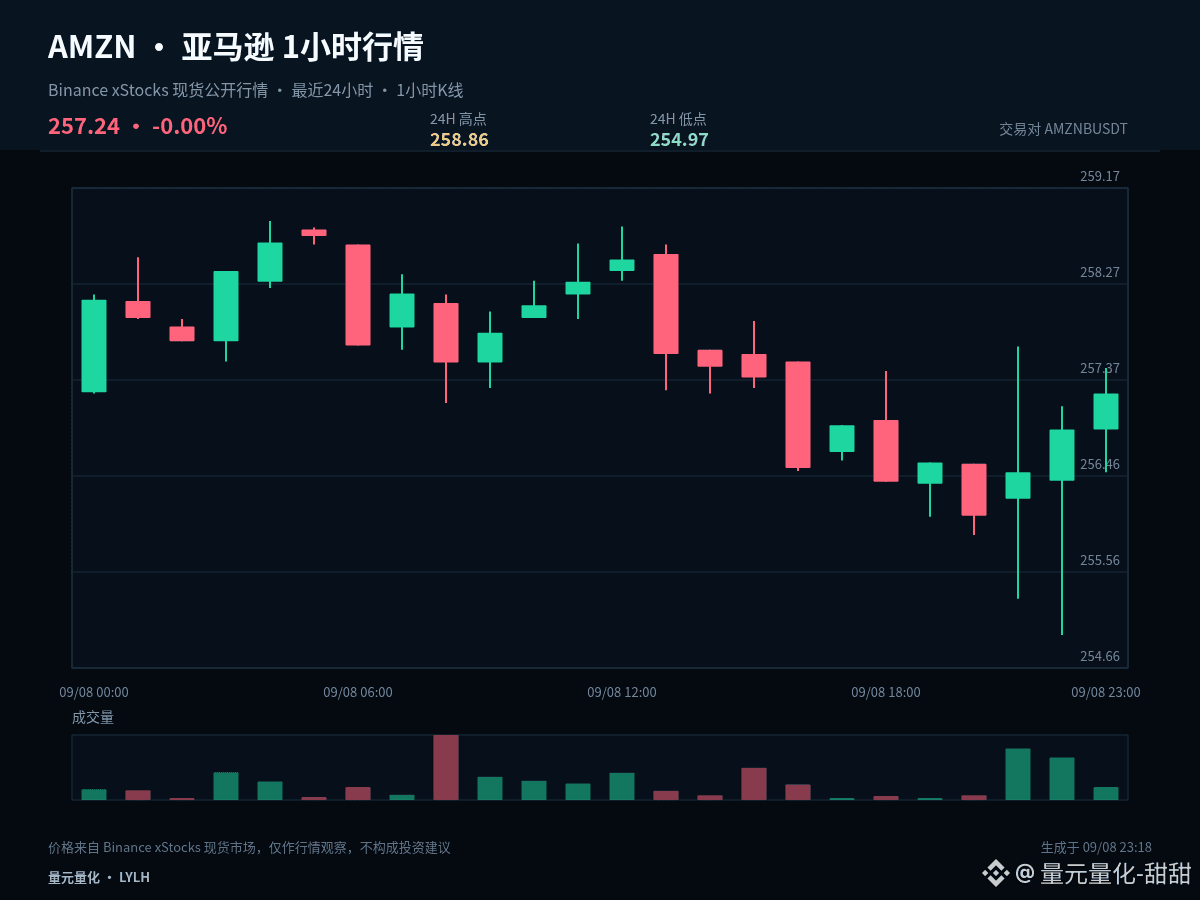
$AMZNB #AMZN Order book notes: current price 257.24, 1 hour +0.13%, 24 hours -0.27%, and the recent 24-hour trading range amplitude is about 1.5%. First write down the data and judgments at this moment, and later verify with the price action.
$AMZNB #AMZN is still repeatedly changing hands within the range over the past 24 hours, and there is no clear directional advantage. The mid-zone is the most testing for patience—waiting for boundary signals is usually more effective.
For key levels: 256.915 is the structural mid-axis currently, and it is the first benchmark for judging whether a pullback is healthy. As long as the price can stay steadily above it, the bulls still hold the initiative. The next target above is 258.86. If the price falls back below the mid-axis, then attention should shift to the secondary support/holding level at 254.97.
There are three ways to handle the next path: (1) If price effectively holds and stabilizes above 258.86, wait for the pullback to not break, then reassess whether the move can continue. (2) If price breaks down below 254.97, prioritize risk control and wait for new support. (3) If price continues to oscillate around 256.915, treat it as a range-and-handling situation and don’t chase a direction repeatedly when it’s in the middle.
During review, I will check three things: how price reacts when it first approaches a key level, whether the 1-hour close completes confirmation, and whether adjustments are made according to the plan after a judgment becomes invalid. Compared with only recording outcomes, these three items are better at revealing execution problems.
A trading plan must include invalidation conditions. A correct judgment can be realized step by step, but if the judgment is wrong you must allow yourself to exit as planned—you can’t use adding to positions to mask the fact that the original logic has changed. The market will update, and viewpoints should follow the price evidence as it emerges.
#SaudiHaltsSouthernEnergySitesAfterAttacks
$AMZNB #AMZN Order book notes: current price 257.24, 1 hour +0.13%, 24 hours -0.27%, and the recent 24-hour trading range amplitude is about 1.5%. First write down the data and judgments at this moment, and later verify with the price action.
$AMZNB #AMZN is still repeatedly changing hands within the range over the past 24 hours, and there is no clear directional advantage. The mid-zone is the most testing for patience—waiting for boundary signals is usually more effective.
For key levels: 256.915 is the structural mid-axis currently, and it is the first benchmark for judging whether a pullback is healthy. As long as the price can stay steadily above it, the bulls still hold the initiative. The next target above is 258.86. If the price falls back below the mid-axis, then attention should shift to the secondary support/holding level at 254.97.
There are three ways to handle the next path: (1) If price effectively holds and stabilizes above 258.86, wait for the pullback to not break, then reassess whether the move can continue. (2) If price breaks down below 254.97, prioritize risk control and wait for new support. (3) If price continues to oscillate around 256.915, treat it as a range-and-handling situation and don’t chase a direction repeatedly when it’s in the middle.
During review, I will check three things: how price reacts when it first approaches a key level, whether the 1-hour close completes confirmation, and whether adjustments are made according to the plan after a judgment becomes invalid. Compared with only recording outcomes, these three items are better at revealing execution problems.
A trading plan must include invalidation conditions. A correct judgment can be realized step by step, but if the judgment is wrong you must allow yourself to exit as planned—you can’t use adding to positions to mask the fact that the original logic has changed. The market will update, and viewpoints should follow the price evidence as it emerges.
#SaudiHaltsSouthernEnergySitesAfterAttacks
$AMZNB #AMZN is still repeatedly changing hands within the range over the past 24 hours, and there is no clear directional advantage. The mid-zone is the most testing for patience—waiting for boundary signals is usually more effective.
For key levels: 256.915 is the structural mid-axis currently, and it is the first benchmark for judging whether a pullback is healthy. As long as the price can stay steadily above it, the bulls still hold the initiative. The next target above is 258.86. If the price falls back below the mid-axis, then attention should shift to the secondary support/holding level at 254.97.
There are three ways to handle the next path: (1) If price effectively holds and stabilizes above 258.86, wait for the pullback to not break, then reassess whether the move can continue. (2) If price breaks down below 254.97, prioritize risk control and wait for new support. (3) If price continues to oscillate around 256.915, treat it as a range-and-handling situation and don’t chase a direction repeatedly when it’s in the middle.
During review, I will check three things: how price reacts when it first approaches a key level, whether the 1-hour close completes confirmation, and whether adjustments are made according to the plan after a judgment becomes invalid. Compared with only recording outcomes, these three items are better at revealing execution problems.
A trading plan must include invalidation conditions. A correct judgment can be realized step by step, but if the judgment is wrong you must allow yourself to exit as planned—you can’t use adding to positions to mask the fact that the original logic has changed. The market will update, and viewpoints should follow the price evidence as it emerges.
#SaudiHaltsSouthernEnergySitesAfterAttacks
7
·
--
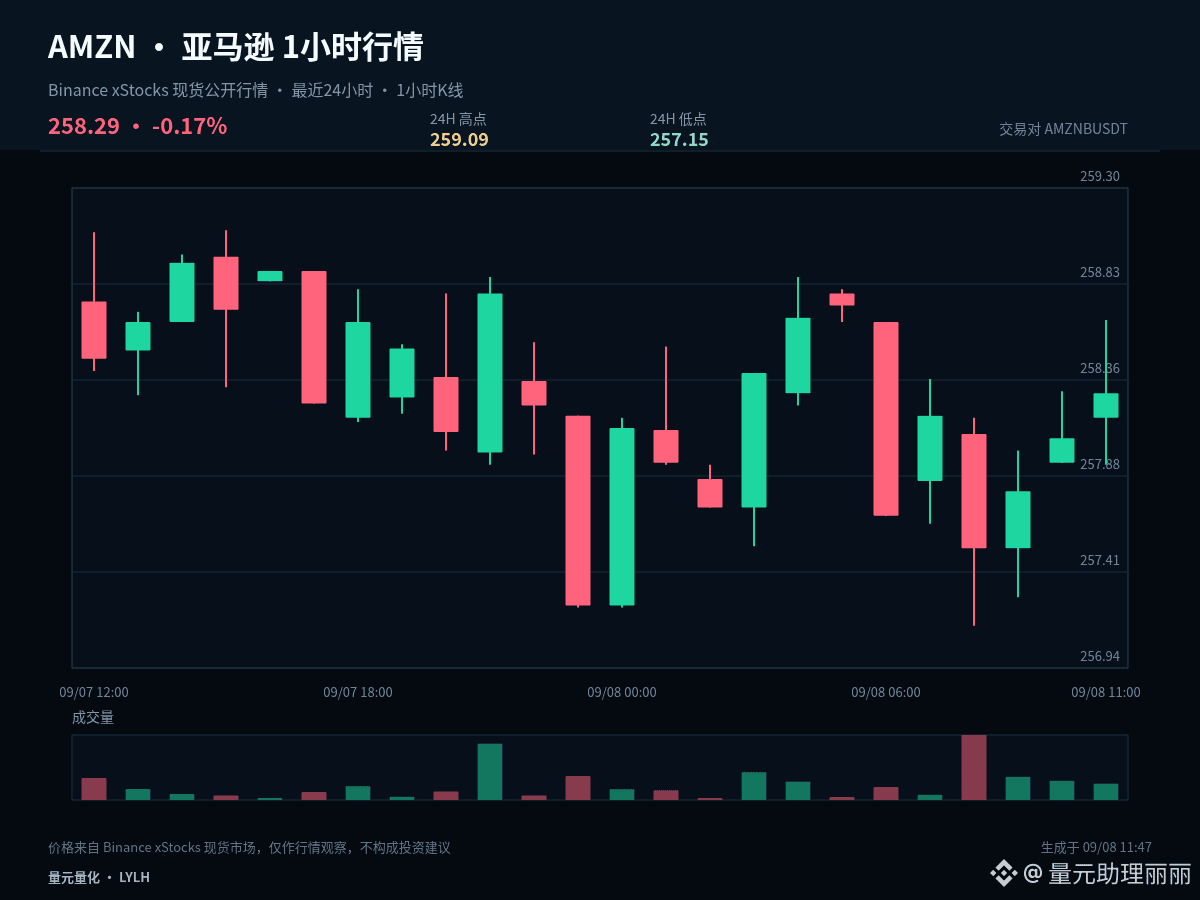
$AMZNB #AMZN heat has picked up before preparing to enter; you still need to first assess the position. Over the current 1 hour: +0.09%, and over 24 hours: -0.18%. The space that has already been traveled cannot be directly treated as the next segment with room that can be copied.
$AMZNB #AMZN is still repeatedly being traded back and forth within the past-24-hours range. Directional advantage is not obvious. The middle section is the most demanding for patience; waiting for boundary signals is usually more effective.
The pace that favors the longs is: after returning to around 258.12, selling pressure weakens, then try again at 259.09. If it doesn’t pull back and instead accelerates directly, the risk-reward ratio of chasing the price will decline.
For execution, set clear conditions: after a break above 259.09, you need confirmation—don’t chase just because of a sudden spike. After dipping to 257.15, you need to see whether price can quickly recover—don’t enter just because you see a drop. In the middle zone, if there isn’t sufficient payout, waiting itself is also part of the strategy.
Position management should distinguish between swing (mid-term) and day-trading (short-term). For existing swing positions, first check whether the structure is broken; don’t let repeated fluctuations on a single 1-hour candlestick disturb you. For short-term positions, execute around support, resistance, and closing confirmations. If you’re in cash (no position), there’s no need to chase in the middle of the range; waiting for a clearer location usually offers an advantage.
Missing a segment of the market doesn’t automatically cause losses. Only chasing at the end of volatility without a plan will cause your position to become passive. Your trading plan must include invalidation conditions. If your judgment is correct, you can realize profits in stages. If your judgment is wrong, you must also allow yourself to exit—don’t use averaging down/add-ons to cover up the fact that the original logic has changed. The market will update, and your viewpoint should adjust along with price evidence.
#IMFSaysElSalvadorBTCNoPublicFunds
$AMZNB #AMZN heat has picked up before preparing to enter; you still need to first assess the position. Over the current 1 hour: +0.09%, and over 24 hours: -0.18%. The space that has already been traveled cannot be directly treated as the next segment with room that can be copied.
$AMZNB #AMZN is still repeatedly being traded back and forth within the past-24-hours range. Directional advantage is not obvious. The middle section is the most demanding for patience; waiting for boundary signals is usually more effective.
The pace that favors the longs is: after returning to around 258.12, selling pressure weakens, then try again at 259.09. If it doesn’t pull back and instead accelerates directly, the risk-reward ratio of chasing the price will decline.
For execution, set clear conditions: after a break above 259.09, you need confirmation—don’t chase just because of a sudden spike. After dipping to 257.15, you need to see whether price can quickly recover—don’t enter just because you see a drop. In the middle zone, if there isn’t sufficient payout, waiting itself is also part of the strategy.
Position management should distinguish between swing (mid-term) and day-trading (short-term). For existing swing positions, first check whether the structure is broken; don’t let repeated fluctuations on a single 1-hour candlestick disturb you. For short-term positions, execute around support, resistance, and closing confirmations. If you’re in cash (no position), there’s no need to chase in the middle of the range; waiting for a clearer location usually offers an advantage.
Missing a segment of the market doesn’t automatically cause losses. Only chasing at the end of volatility without a plan will cause your position to become passive. Your trading plan must include invalidation conditions. If your judgment is correct, you can realize profits in stages. If your judgment is wrong, you must also allow yourself to exit—don’t use averaging down/add-ons to cover up the fact that the original logic has changed. The market will update, and your viewpoint should adjust along with price evidence.
#IMFSaysElSalvadorBTCNoPublicFunds
$AMZNB #AMZN is still repeatedly being traded back and forth within the past-24-hours range. Directional advantage is not obvious. The middle section is the most demanding for patience; waiting for boundary signals is usually more effective.
The pace that favors the longs is: after returning to around 258.12, selling pressure weakens, then try again at 259.09. If it doesn’t pull back and instead accelerates directly, the risk-reward ratio of chasing the price will decline.
For execution, set clear conditions: after a break above 259.09, you need confirmation—don’t chase just because of a sudden spike. After dipping to 257.15, you need to see whether price can quickly recover—don’t enter just because you see a drop. In the middle zone, if there isn’t sufficient payout, waiting itself is also part of the strategy.
Position management should distinguish between swing (mid-term) and day-trading (short-term). For existing swing positions, first check whether the structure is broken; don’t let repeated fluctuations on a single 1-hour candlestick disturb you. For short-term positions, execute around support, resistance, and closing confirmations. If you’re in cash (no position), there’s no need to chase in the middle of the range; waiting for a clearer location usually offers an advantage.
Missing a segment of the market doesn’t automatically cause losses. Only chasing at the end of volatility without a plan will cause your position to become passive. Your trading plan must include invalidation conditions. If your judgment is correct, you can realize profits in stages. If your judgment is wrong, you must also allow yourself to exit—don’t use averaging down/add-ons to cover up the fact that the original logic has changed. The market will update, and your viewpoint should adjust along with price evidence.
#IMFSaysElSalvadorBTCNoPublicFunds
6
·
--
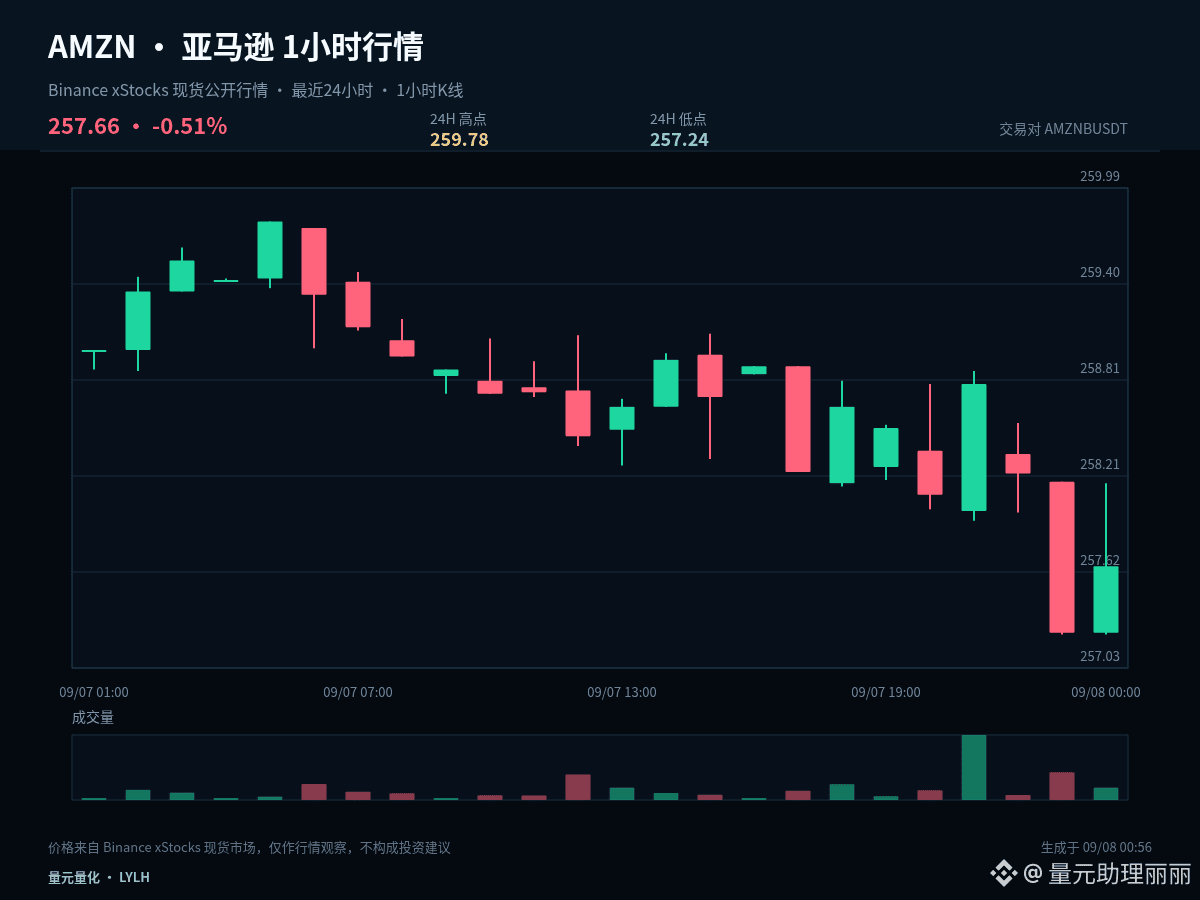
$AMZNB #AMZN This time, we break down the market from the position perspective. In the same chart, the key focus differs for existing positions versus those on the sidelines. Current price: 257.66, 1-hour +0.16%, 24-hour -0.51%.
The current price is near the lower edge of the past 24 hours’ range: 1-hour +0.16%, 24-hour -0.51%. The core of low-level analysis is not trying to bottom-fish early; it’s to observe whether price can quickly reclaim after a breakdown. Being able to reclaim indicates that sell pressure is being absorbed. If price keeps lingering below the lower edge, it means the weakness hasn’t ended yet.
For those already in positions, first watch whether there is continuous rejection around 259.78, using 258.51 as the protective structure. Those on the sidelines should not chase near the resistance area; instead, wait for pullbacks to the midline for confirmation of support, or for a second confirmation after a breakout of resistance.
When executing, set clear conditions: after a break above 259.78, you need confirmation—not to chase just because of a sudden spike. After a dip to 257.24, you need to see whether price can quickly reclaim—not to buy just because it’s falling. If the mid-range does not offer sufficient reward-to-risk, waiting itself is also part of the strategy.
Position management must distinguish between swing trades and short-term trades. For existing swing positions, first check whether the structure is broken; don’t let repeated fluctuations of a single 1-hour candlestick disrupt your view. For short-term positions, execute around support, resistance, and end-of-candle confirmation. Those with no position need not chase at the middle of the range; waiting for clearer levels often offers an advantage.
Your trading plan must include invalidation conditions. If your judgment is correct, you can take profits in stages. If your judgment is wrong, you must also allow yourself to exit—don’t use adding positions to cover up the fact that the original logic has changed. The market will update, and your viewpoint should adjust according to price evidence.
#SideSwapSuspendsLiquidServices
$AMZNB #AMZN This time, we break down the market from the position perspective. In the same chart, the key focus differs for existing positions versus those on the sidelines. Current price: 257.66, 1-hour +0.16%, 24-hour -0.51%.
The current price is near the lower edge of the past 24 hours’ range: 1-hour +0.16%, 24-hour -0.51%. The core of low-level analysis is not trying to bottom-fish early; it’s to observe whether price can quickly reclaim after a breakdown. Being able to reclaim indicates that sell pressure is being absorbed. If price keeps lingering below the lower edge, it means the weakness hasn’t ended yet.
For those already in positions, first watch whether there is continuous rejection around 259.78, using 258.51 as the protective structure. Those on the sidelines should not chase near the resistance area; instead, wait for pullbacks to the midline for confirmation of support, or for a second confirmation after a breakout of resistance.
When executing, set clear conditions: after a break above 259.78, you need confirmation—not to chase just because of a sudden spike. After a dip to 257.24, you need to see whether price can quickly reclaim—not to buy just because it’s falling. If the mid-range does not offer sufficient reward-to-risk, waiting itself is also part of the strategy.
Position management must distinguish between swing trades and short-term trades. For existing swing positions, first check whether the structure is broken; don’t let repeated fluctuations of a single 1-hour candlestick disrupt your view. For short-term positions, execute around support, resistance, and end-of-candle confirmation. Those with no position need not chase at the middle of the range; waiting for clearer levels often offers an advantage.
Your trading plan must include invalidation conditions. If your judgment is correct, you can take profits in stages. If your judgment is wrong, you must also allow yourself to exit—don’t use adding positions to cover up the fact that the original logic has changed. The market will update, and your viewpoint should adjust according to price evidence.
#SideSwapSuspendsLiquidServices
The current price is near the lower edge of the past 24 hours’ range: 1-hour +0.16%, 24-hour -0.51%. The core of low-level analysis is not trying to bottom-fish early; it’s to observe whether price can quickly reclaim after a breakdown. Being able to reclaim indicates that sell pressure is being absorbed. If price keeps lingering below the lower edge, it means the weakness hasn’t ended yet.
For those already in positions, first watch whether there is continuous rejection around 259.78, using 258.51 as the protective structure. Those on the sidelines should not chase near the resistance area; instead, wait for pullbacks to the midline for confirmation of support, or for a second confirmation after a breakout of resistance.
When executing, set clear conditions: after a break above 259.78, you need confirmation—not to chase just because of a sudden spike. After a dip to 257.24, you need to see whether price can quickly reclaim—not to buy just because it’s falling. If the mid-range does not offer sufficient reward-to-risk, waiting itself is also part of the strategy.
Position management must distinguish between swing trades and short-term trades. For existing swing positions, first check whether the structure is broken; don’t let repeated fluctuations of a single 1-hour candlestick disrupt your view. For short-term positions, execute around support, resistance, and end-of-candle confirmation. Those with no position need not chase at the middle of the range; waiting for clearer levels often offers an advantage.
Your trading plan must include invalidation conditions. If your judgment is correct, you can take profits in stages. If your judgment is wrong, you must also allow yourself to exit—don’t use adding positions to cover up the fact that the original logic has changed. The market will update, and your viewpoint should adjust according to price evidence.
#SideSwapSuspendsLiquidServices
10
·
--
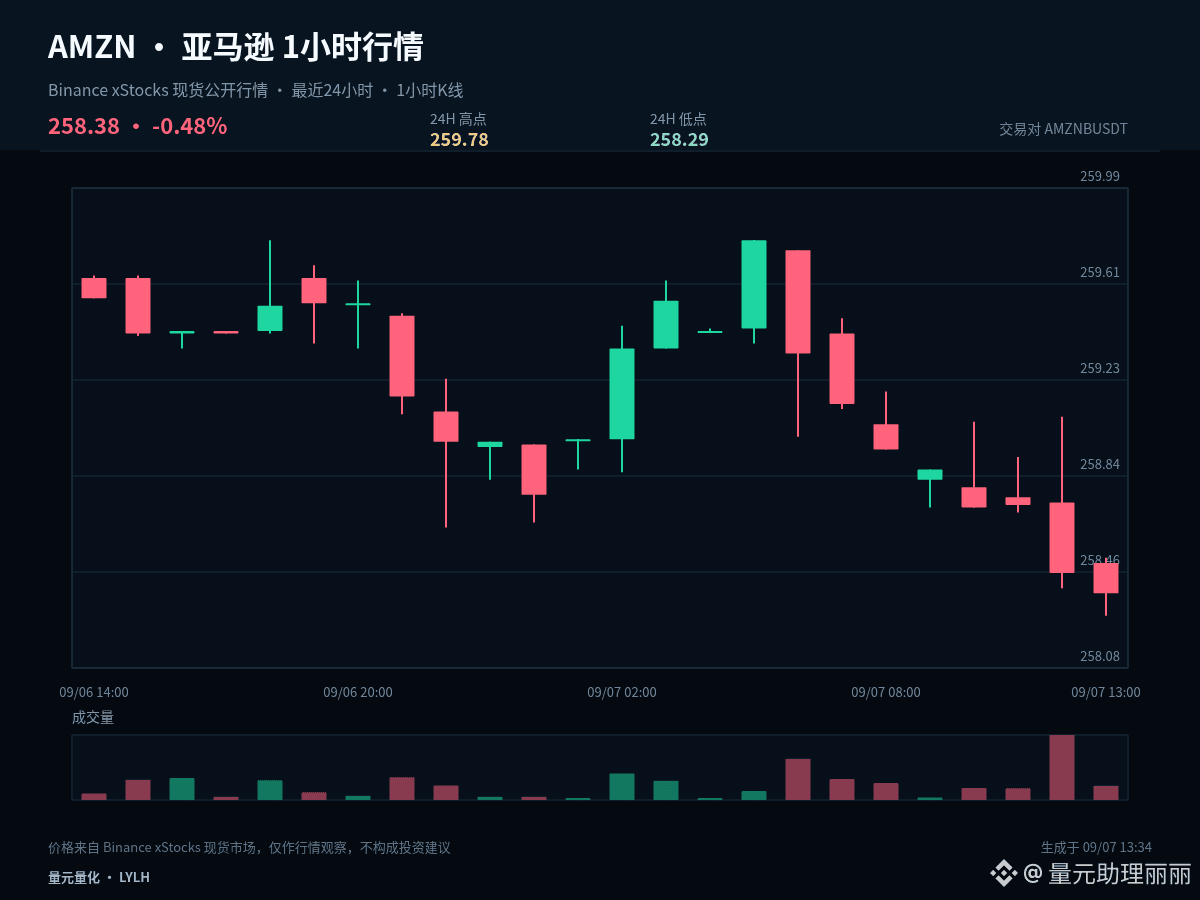
$AMZNB #AMZN Record an intraday market observation: current price 258.38, 1 hour -0.03%, 24 hours -0.50%, and the high-low range over the past 24 hours is about 0.6%.
The current price is close to the lower end of the past 24-hour range, with 1 hour -0.03% and 24 hours -0.50%. The core of low-level analysis is not to buy the dip in advance, but to observe whether it can quickly recover after breaking down; a recovery indicates that selling pressure has been absorbed, while staying below the lower boundary for a prolonged period means the weakness has not ended.
The three price levels to track together are: midpoint 259.035, upper confirmation level 259.78, and lower defense level 258.29. The midpoint determines short-term initiative, while the upper and lower boundaries determine whether the market has truly broken away from the original range.
My outlook is not a one-way bet. If price breaks above 259.78 and holds there, it means the upside room has been reopened; if it falls below 258.29 and rebounds but fails to reclaim it, it means the structure is weakening further; if it moves between the two, continue watching the closing behavior on both sides of 259.035.
Position management should distinguish between medium-term and short-term holdings. Existing medium-term positions should first assess whether the structure has been damaged, without being repeatedly affected by a single 1-hour candlestick; short-term positions, on the other hand, should be executed around support, resistance, and closing confirmation. Those with no position do not need to chase prices in the middle of the range; waiting for a clearer entry point is usually more advantageous.
The trading plan must include invalidation conditions. If the judgment is correct, profits can be taken in stages; if the judgment is wrong, you must also allow yourself to exit, and not use adding to the position to cover up the fact that the original logic has changed. The market will update, and views should also adjust with price evidence.
If the next 1-hour candle closes above 259.035, the structure will be more proactive; if it closes below, remain cautious. Which path do you currently lean toward?
#USStrikesIranTankersTehranRestrictsHormuz
$AMZNB #AMZN Record an intraday market observation: current price 258.38, 1 hour -0.03%, 24 hours -0.50%, and the high-low range over the past 24 hours is about 0.6%.
The current price is close to the lower end of the past 24-hour range, with 1 hour -0.03% and 24 hours -0.50%. The core of low-level analysis is not to buy the dip in advance, but to observe whether it can quickly recover after breaking down; a recovery indicates that selling pressure has been absorbed, while staying below the lower boundary for a prolonged period means the weakness has not ended.
The three price levels to track together are: midpoint 259.035, upper confirmation level 259.78, and lower defense level 258.29. The midpoint determines short-term initiative, while the upper and lower boundaries determine whether the market has truly broken away from the original range.
My outlook is not a one-way bet. If price breaks above 259.78 and holds there, it means the upside room has been reopened; if it falls below 258.29 and rebounds but fails to reclaim it, it means the structure is weakening further; if it moves between the two, continue watching the closing behavior on both sides of 259.035.
Position management should distinguish between medium-term and short-term holdings. Existing medium-term positions should first assess whether the structure has been damaged, without being repeatedly affected by a single 1-hour candlestick; short-term positions, on the other hand, should be executed around support, resistance, and closing confirmation. Those with no position do not need to chase prices in the middle of the range; waiting for a clearer entry point is usually more advantageous.
The trading plan must include invalidation conditions. If the judgment is correct, profits can be taken in stages; if the judgment is wrong, you must also allow yourself to exit, and not use adding to the position to cover up the fact that the original logic has changed. The market will update, and views should also adjust with price evidence.
If the next 1-hour candle closes above 259.035, the structure will be more proactive; if it closes below, remain cautious. Which path do you currently lean toward?
#USStrikesIranTankersTehranRestrictsHormuz
The current price is close to the lower end of the past 24-hour range, with 1 hour -0.03% and 24 hours -0.50%. The core of low-level analysis is not to buy the dip in advance, but to observe whether it can quickly recover after breaking down; a recovery indicates that selling pressure has been absorbed, while staying below the lower boundary for a prolonged period means the weakness has not ended.
The three price levels to track together are: midpoint 259.035, upper confirmation level 259.78, and lower defense level 258.29. The midpoint determines short-term initiative, while the upper and lower boundaries determine whether the market has truly broken away from the original range.
My outlook is not a one-way bet. If price breaks above 259.78 and holds there, it means the upside room has been reopened; if it falls below 258.29 and rebounds but fails to reclaim it, it means the structure is weakening further; if it moves between the two, continue watching the closing behavior on both sides of 259.035.
Position management should distinguish between medium-term and short-term holdings. Existing medium-term positions should first assess whether the structure has been damaged, without being repeatedly affected by a single 1-hour candlestick; short-term positions, on the other hand, should be executed around support, resistance, and closing confirmation. Those with no position do not need to chase prices in the middle of the range; waiting for a clearer entry point is usually more advantageous.
The trading plan must include invalidation conditions. If the judgment is correct, profits can be taken in stages; if the judgment is wrong, you must also allow yourself to exit, and not use adding to the position to cover up the fact that the original logic has changed. The market will update, and views should also adjust with price evidence.
If the next 1-hour candle closes above 259.035, the structure will be more proactive; if it closes below, remain cautious. Which path do you currently lean toward?
#USStrikesIranTankersTehranRestrictsHormuz
15
·
--
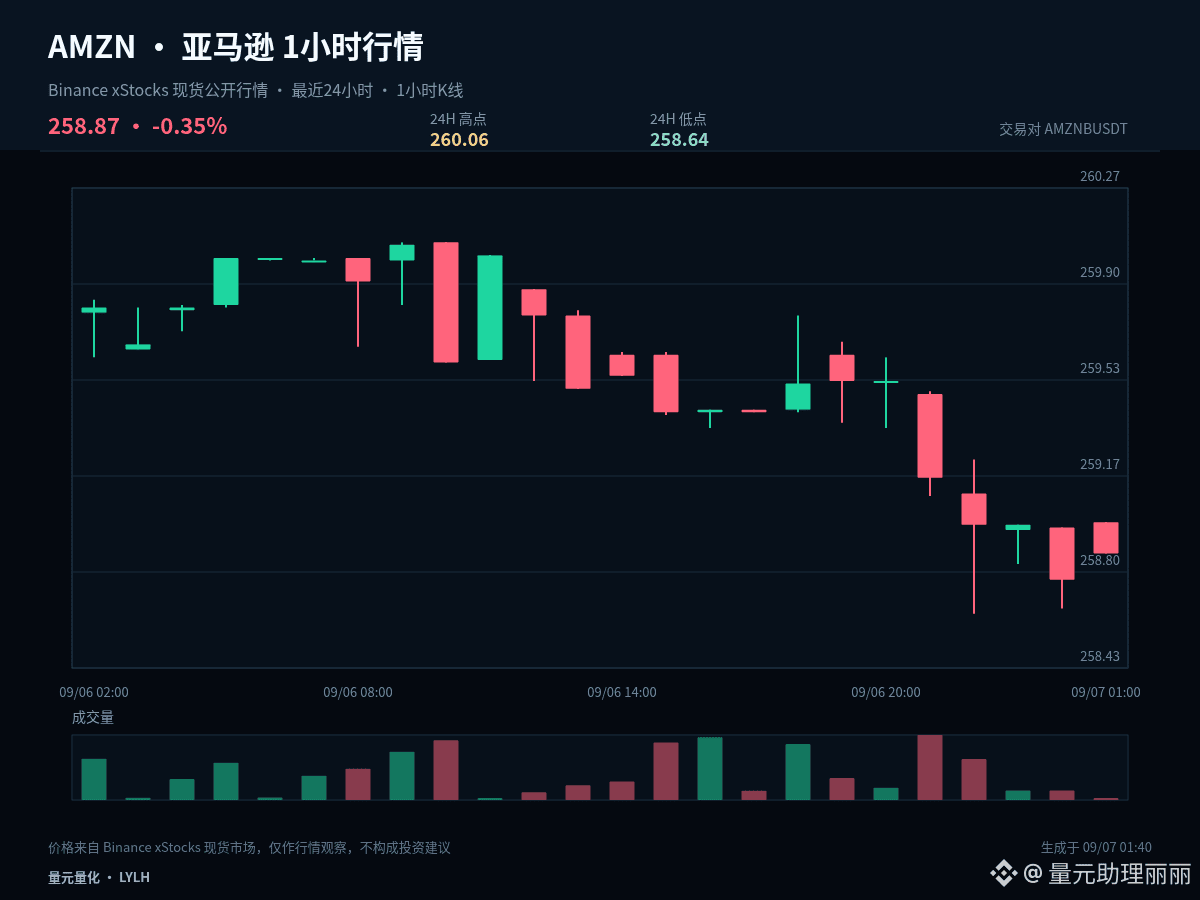
$AMZNB #AMZN Pullbacks in a strong trend often reveal the true underlying support more clearly than accelerated rallies. The current 1-hour change is +0.04%, and the 24-hour change is -0.40%. The key is to judge whether this is normal cooling-off or a sign of weakening structure.
The current price is near the lower end of the past 24-hour range, with the 1-hour change at +0.04% and the 24-hour change at -0.40%. The core of low-level analysis is not to buy the dip in advance, but to observe whether the price can quickly reclaim after breaking lower; a quick reclaim means selling pressure has been absorbed, while staying below the lower band suggests weakness has not yet ended.
The short-term initiative has not been clearly broken. 259.35 is the primary standard for assessing pullback quality. Holding above it and then retesting 260.06 would indicate relatively strong consolidation; if it breaks below the midpoint and stays there, the focus should shift down to 258.64.
There are three possible follow-up paths: if price breaks above and firmly holds 260.06, wait for a pullback that does not break support before assessing continuation; if it falls below 258.64, prioritize risk control and wait for new support; if it continues to fluctuate around 259.35, treat it as range turnover and avoid repeatedly chasing direction in the middle of the range.
Position management should distinguish between medium-term and short-term holdings. Existing medium-term positions should first assess whether the structure has been damaged, without being overly influenced by a single 1-hour candlestick; short-term positions should be managed around support, resistance, and close confirmation. Those with no position do not need to chase prices in the middle of the range; waiting for a clearer location is usually more advantageous.
The key for short-term positions is not to predict every candlestick, but to ensure that entry, reduction, and exit all have a basis. Do less when there is no confirmation, redo the plan when key levels fail, and first control single-trade risk before discussing further upside or downside room.
#BitcoinETFsBiggestDailyInflowSinceJanuary
$AMZNB #AMZN Pullbacks in a strong trend often reveal the true underlying support more clearly than accelerated rallies. The current 1-hour change is +0.04%, and the 24-hour change is -0.40%. The key is to judge whether this is normal cooling-off or a sign of weakening structure.
The current price is near the lower end of the past 24-hour range, with the 1-hour change at +0.04% and the 24-hour change at -0.40%. The core of low-level analysis is not to buy the dip in advance, but to observe whether the price can quickly reclaim after breaking lower; a quick reclaim means selling pressure has been absorbed, while staying below the lower band suggests weakness has not yet ended.
The short-term initiative has not been clearly broken. 259.35 is the primary standard for assessing pullback quality. Holding above it and then retesting 260.06 would indicate relatively strong consolidation; if it breaks below the midpoint and stays there, the focus should shift down to 258.64.
There are three possible follow-up paths: if price breaks above and firmly holds 260.06, wait for a pullback that does not break support before assessing continuation; if it falls below 258.64, prioritize risk control and wait for new support; if it continues to fluctuate around 259.35, treat it as range turnover and avoid repeatedly chasing direction in the middle of the range.
Position management should distinguish between medium-term and short-term holdings. Existing medium-term positions should first assess whether the structure has been damaged, without being overly influenced by a single 1-hour candlestick; short-term positions should be managed around support, resistance, and close confirmation. Those with no position do not need to chase prices in the middle of the range; waiting for a clearer location is usually more advantageous.
The key for short-term positions is not to predict every candlestick, but to ensure that entry, reduction, and exit all have a basis. Do less when there is no confirmation, redo the plan when key levels fail, and first control single-trade risk before discussing further upside or downside room.
#BitcoinETFsBiggestDailyInflowSinceJanuary
The current price is near the lower end of the past 24-hour range, with the 1-hour change at +0.04% and the 24-hour change at -0.40%. The core of low-level analysis is not to buy the dip in advance, but to observe whether the price can quickly reclaim after breaking lower; a quick reclaim means selling pressure has been absorbed, while staying below the lower band suggests weakness has not yet ended.
The short-term initiative has not been clearly broken. 259.35 is the primary standard for assessing pullback quality. Holding above it and then retesting 260.06 would indicate relatively strong consolidation; if it breaks below the midpoint and stays there, the focus should shift down to 258.64.
There are three possible follow-up paths: if price breaks above and firmly holds 260.06, wait for a pullback that does not break support before assessing continuation; if it falls below 258.64, prioritize risk control and wait for new support; if it continues to fluctuate around 259.35, treat it as range turnover and avoid repeatedly chasing direction in the middle of the range.
Position management should distinguish between medium-term and short-term holdings. Existing medium-term positions should first assess whether the structure has been damaged, without being overly influenced by a single 1-hour candlestick; short-term positions should be managed around support, resistance, and close confirmation. Those with no position do not need to chase prices in the middle of the range; waiting for a clearer location is usually more advantageous.
The key for short-term positions is not to predict every candlestick, but to ensure that entry, reduction, and exit all have a basis. Do less when there is no confirmation, redo the plan when key levels fail, and first control single-trade risk before discussing further upside or downside room.
#BitcoinETFsBiggestDailyInflowSinceJanuary
21
·
--
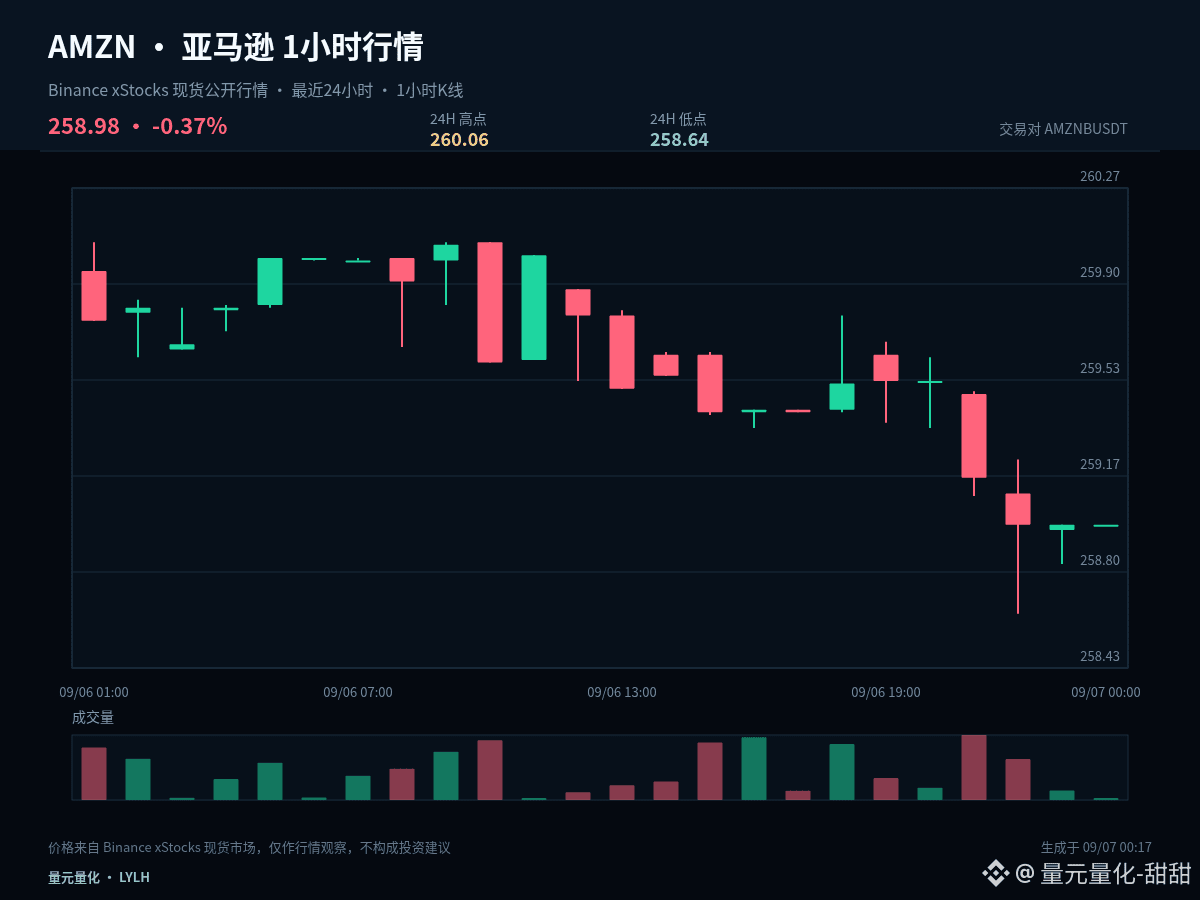
$AMZNB #AMZN If I had to keep only one reference price in this round, I would choose 259.35. The current price is 258.98, with 1-hour at 0.00% and 24-hour at -0.37%. Whether the midpoint is held or lost can help filter out a lot of intraday noise.
If the price stays above 259.35, it means the pullback is still being controlled by the bulls, and the next target is to test the resistance at 260.06; if it falls back below the midpoint, the earlier strength will be discounted, and further decline back toward 258.64 should be guarded against.
The current 1-hour 0.00% and 24-hour -0.37% readings show that the two timeframes have not yet formed a sufficiently clear alignment in the same direction. In a range-bound market, chasing rallies or selling into weakness has a lower margin for error. It is better to use the upper boundary to confirm direction, the lower boundary to confirm support, and the midpoint only as the dividing line between strength and weakness.
In execution, set clear conditions: after breaking above 260.06, confirmation is needed rather than chasing an instant surge; after dipping below 258.64, watch whether it can quickly recover instead of blindly buying the drop; when the middle zone does not offer enough risk-reward, waiting itself is part of the strategy.
Existing positions can be managed in stages according to key levels to avoid making one all-or-nothing decision at once; those with no positions should wait for breakout confirmation or for a pullback to stabilize. For U.S. stock instruments, also pay attention to volatility caused by trading session changes. The plan should be based on price conditions, not emotions.
The market will ultimately validate the view with price. Do you think the most critical level right now is the break above 260.06, or the defense of 258.64? Let’s track the follow-up results together.
#USAugustJobGrowthNearlyTriplesForecast
$AMZNB #AMZN If I had to keep only one reference price in this round, I would choose 259.35. The current price is 258.98, with 1-hour at 0.00% and 24-hour at -0.37%. Whether the midpoint is held or lost can help filter out a lot of intraday noise.
If the price stays above 259.35, it means the pullback is still being controlled by the bulls, and the next target is to test the resistance at 260.06; if it falls back below the midpoint, the earlier strength will be discounted, and further decline back toward 258.64 should be guarded against.
The current 1-hour 0.00% and 24-hour -0.37% readings show that the two timeframes have not yet formed a sufficiently clear alignment in the same direction. In a range-bound market, chasing rallies or selling into weakness has a lower margin for error. It is better to use the upper boundary to confirm direction, the lower boundary to confirm support, and the midpoint only as the dividing line between strength and weakness.
In execution, set clear conditions: after breaking above 260.06, confirmation is needed rather than chasing an instant surge; after dipping below 258.64, watch whether it can quickly recover instead of blindly buying the drop; when the middle zone does not offer enough risk-reward, waiting itself is part of the strategy.
Existing positions can be managed in stages according to key levels to avoid making one all-or-nothing decision at once; those with no positions should wait for breakout confirmation or for a pullback to stabilize. For U.S. stock instruments, also pay attention to volatility caused by trading session changes. The plan should be based on price conditions, not emotions.
The market will ultimately validate the view with price. Do you think the most critical level right now is the break above 260.06, or the defense of 258.64? Let’s track the follow-up results together.
#USAugustJobGrowthNearlyTriplesForecast
If the price stays above 259.35, it means the pullback is still being controlled by the bulls, and the next target is to test the resistance at 260.06; if it falls back below the midpoint, the earlier strength will be discounted, and further decline back toward 258.64 should be guarded against.
The current 1-hour 0.00% and 24-hour -0.37% readings show that the two timeframes have not yet formed a sufficiently clear alignment in the same direction. In a range-bound market, chasing rallies or selling into weakness has a lower margin for error. It is better to use the upper boundary to confirm direction, the lower boundary to confirm support, and the midpoint only as the dividing line between strength and weakness.
In execution, set clear conditions: after breaking above 260.06, confirmation is needed rather than chasing an instant surge; after dipping below 258.64, watch whether it can quickly recover instead of blindly buying the drop; when the middle zone does not offer enough risk-reward, waiting itself is part of the strategy.
Existing positions can be managed in stages according to key levels to avoid making one all-or-nothing decision at once; those with no positions should wait for breakout confirmation or for a pullback to stabilize. For U.S. stock instruments, also pay attention to volatility caused by trading session changes. The plan should be based on price conditions, not emotions.
The market will ultimately validate the view with price. Do you think the most critical level right now is the break above 260.06, or the defense of 258.64? Let’s track the follow-up results together.
#USAugustJobGrowthNearlyTriplesForecast
6
·
--
$AMZNB #AMZN Current price 259.65, 1 hour -0.05%, 24 hours +0.20%. Rather than first deciding whether to be bullish or bearish, it is better to lay out the possible paths and corresponding actions clearly.
The current 1 hour -0.05% and 24 hours +0.20% readings show that the two timeframes have not yet formed a sufficiently clear alignment in the same direction. In a range-bound market, chasing strength or selling weakness has a lower margin for error. It is more suitable to use the upper boundary to confirm direction, the lower boundary to confirm support, and the midpoint only as a strength-weakness dividing line.
The first path is upward: price needs to break above 260.06 and form a stable close above it, then a pullback that does not break down would count as valid confirmation. The second path is downward: once 259.12 is lost and a rebound fails to recover it, it indicates insufficient support, and defense should take priority over rushing to add to positions.
If price continues to stay between 260.06 and 259.12, 259.59 should only be used as a reference for short-term initiative. There is no clear advantage in the middle of the range, so do not force an entry just for the sake of participation; wait for the market to reveal its direction.
Existing positions can be handled in stages according to key levels to avoid making all-or-nothing judgments at once; those with no position should wait for breakout confirmation or a successful hold after a pullback. For U.S. stock symbols, also pay attention to volatility caused by trading-session transitions. The plan should be based on price conditions, not emotions.
The key point for short-term positions is not to predict every candlestick, but to ensure that entry, reduction, and exit all have a basis. Do less when there is no confirmation, remake the plan when key levels fail, first control single-trade risk, then discuss the remaining room.
#USAugustJobGrowthNearlyTriplesForecast
$AMZNB #AMZN Current price 259.65, 1 hour -0.05%, 24 hours +0.20%. Rather than first deciding whether to be bullish or bearish, it is better to lay out the possible paths and corresponding actions clearly.
The current 1 hour -0.05% and 24 hours +0.20% readings show that the two timeframes have not yet formed a sufficiently clear alignment in the same direction. In a range-bound market, chasing strength or selling weakness has a lower margin for error. It is more suitable to use the upper boundary to confirm direction, the lower boundary to confirm support, and the midpoint only as a strength-weakness dividing line.
The first path is upward: price needs to break above 260.06 and form a stable close above it, then a pullback that does not break down would count as valid confirmation. The second path is downward: once 259.12 is lost and a rebound fails to recover it, it indicates insufficient support, and defense should take priority over rushing to add to positions.
If price continues to stay between 260.06 and 259.12, 259.59 should only be used as a reference for short-term initiative. There is no clear advantage in the middle of the range, so do not force an entry just for the sake of participation; wait for the market to reveal its direction.
Existing positions can be handled in stages according to key levels to avoid making all-or-nothing judgments at once; those with no position should wait for breakout confirmation or a successful hold after a pullback. For U.S. stock symbols, also pay attention to volatility caused by trading-session transitions. The plan should be based on price conditions, not emotions.
The key point for short-term positions is not to predict every candlestick, but to ensure that entry, reduction, and exit all have a basis. Do less when there is no confirmation, remake the plan when key levels fail, first control single-trade risk, then discuss the remaining room.
#USAugustJobGrowthNearlyTriplesForecast
The current 1 hour -0.05% and 24 hours +0.20% readings show that the two timeframes have not yet formed a sufficiently clear alignment in the same direction. In a range-bound market, chasing strength or selling weakness has a lower margin for error. It is more suitable to use the upper boundary to confirm direction, the lower boundary to confirm support, and the midpoint only as a strength-weakness dividing line.
The first path is upward: price needs to break above 260.06 and form a stable close above it, then a pullback that does not break down would count as valid confirmation. The second path is downward: once 259.12 is lost and a rebound fails to recover it, it indicates insufficient support, and defense should take priority over rushing to add to positions.
If price continues to stay between 260.06 and 259.12, 259.59 should only be used as a reference for short-term initiative. There is no clear advantage in the middle of the range, so do not force an entry just for the sake of participation; wait for the market to reveal its direction.
Existing positions can be handled in stages according to key levels to avoid making all-or-nothing judgments at once; those with no position should wait for breakout confirmation or a successful hold after a pullback. For U.S. stock symbols, also pay attention to volatility caused by trading-session transitions. The plan should be based on price conditions, not emotions.
The key point for short-term positions is not to predict every candlestick, but to ensure that entry, reduction, and exit all have a basis. Do less when there is no confirmation, remake the plan when key levels fail, first control single-trade risk, then discuss the remaining room.
#USAugustJobGrowthNearlyTriplesForecast
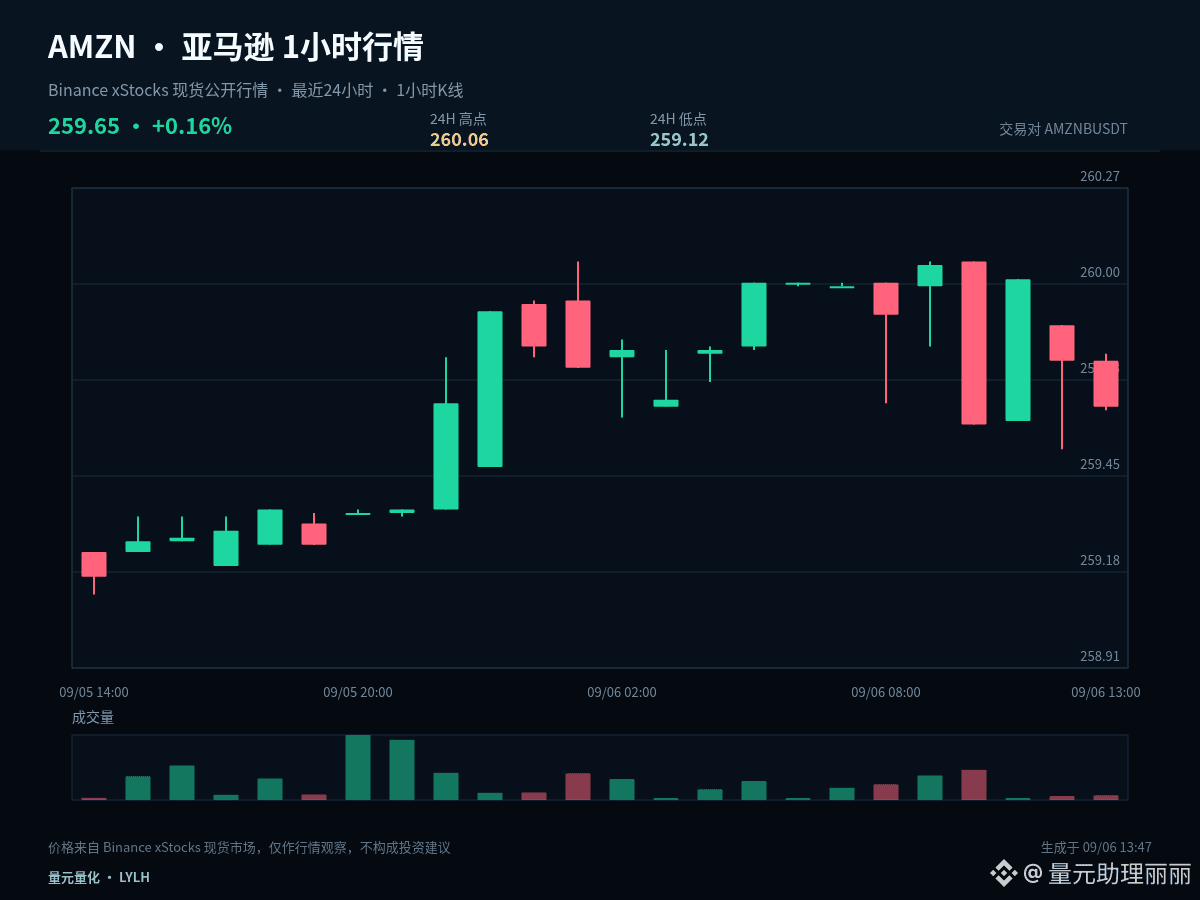
11
·
--
$AMZNB #AMZN Current price 259.89, 1-hour -0.01%, 24-hour +0.97%. Instead of deciding bullish or bearish first, it is better to lay out the possible paths and corresponding actions clearly.
The current price is close to the upper end of the recent 24-hour range, with 1-hour -0.01% and 24-hour +0.97%. At elevated levels, the most important thing is to confirm acceptance after a breakout: if price can stay above the upper band, it shows the market recognizes a higher range; if it only briefly pierces through and then quickly falls back, a false breakout needs to be guarded against.
The first path is upward: price needs to break above 259.95 and form a stable close above it, then a retest that does not break down would count as a valid confirmation. The second path is downward: if 256.93 is lost and any rebound fails to recover it, that indicates insufficient support, and defense should come first rather than rushing to add positions.
If price continues to stay between 259.95 and 256.93, then 258.44 is only a reference for short-term initiative. There is no clear advantage in the middle of the range, so do not force an entry for the sake of participation; wait for the market to reveal its direction.
Position management should distinguish between medium-term and short-term holdings. Existing medium-term positions should first assess whether the structure has been damaged, without being repeatedly influenced by a single 1-hour candlestick; short-term positions should be managed around support, resistance, and close confirmation. Those with no position do not need to chase price in the middle of the range; waiting for a clearer location is usually more advantageous.
The focus of short-term positions is not to predict every candlestick, but to ensure that entry, reduction, and exit all have a basis. If there is no confirmation, do less; if a key level fails, remake the plan. First control the risk of each trade, then talk about the remaining room.
#USAugustJobGrowthNearlyTriplesForecast
$AMZNB #AMZN Current price 259.89, 1-hour -0.01%, 24-hour +0.97%. Instead of deciding bullish or bearish first, it is better to lay out the possible paths and corresponding actions clearly.
The current price is close to the upper end of the recent 24-hour range, with 1-hour -0.01% and 24-hour +0.97%. At elevated levels, the most important thing is to confirm acceptance after a breakout: if price can stay above the upper band, it shows the market recognizes a higher range; if it only briefly pierces through and then quickly falls back, a false breakout needs to be guarded against.
The first path is upward: price needs to break above 259.95 and form a stable close above it, then a retest that does not break down would count as a valid confirmation. The second path is downward: if 256.93 is lost and any rebound fails to recover it, that indicates insufficient support, and defense should come first rather than rushing to add positions.
If price continues to stay between 259.95 and 256.93, then 258.44 is only a reference for short-term initiative. There is no clear advantage in the middle of the range, so do not force an entry for the sake of participation; wait for the market to reveal its direction.
Position management should distinguish between medium-term and short-term holdings. Existing medium-term positions should first assess whether the structure has been damaged, without being repeatedly influenced by a single 1-hour candlestick; short-term positions should be managed around support, resistance, and close confirmation. Those with no position do not need to chase price in the middle of the range; waiting for a clearer location is usually more advantageous.
The focus of short-term positions is not to predict every candlestick, but to ensure that entry, reduction, and exit all have a basis. If there is no confirmation, do less; if a key level fails, remake the plan. First control the risk of each trade, then talk about the remaining room.
#USAugustJobGrowthNearlyTriplesForecast
The current price is close to the upper end of the recent 24-hour range, with 1-hour -0.01% and 24-hour +0.97%. At elevated levels, the most important thing is to confirm acceptance after a breakout: if price can stay above the upper band, it shows the market recognizes a higher range; if it only briefly pierces through and then quickly falls back, a false breakout needs to be guarded against.
The first path is upward: price needs to break above 259.95 and form a stable close above it, then a retest that does not break down would count as a valid confirmation. The second path is downward: if 256.93 is lost and any rebound fails to recover it, that indicates insufficient support, and defense should come first rather than rushing to add positions.
If price continues to stay between 259.95 and 256.93, then 258.44 is only a reference for short-term initiative. There is no clear advantage in the middle of the range, so do not force an entry for the sake of participation; wait for the market to reveal its direction.
Position management should distinguish between medium-term and short-term holdings. Existing medium-term positions should first assess whether the structure has been damaged, without being repeatedly influenced by a single 1-hour candlestick; short-term positions should be managed around support, resistance, and close confirmation. Those with no position do not need to chase price in the middle of the range; waiting for a clearer location is usually more advantageous.
The focus of short-term positions is not to predict every candlestick, but to ensure that entry, reduction, and exit all have a basis. If there is no confirmation, do less; if a key level fails, remake the plan. First control the risk of each trade, then talk about the remaining room.
#USAugustJobGrowthNearlyTriplesForecast
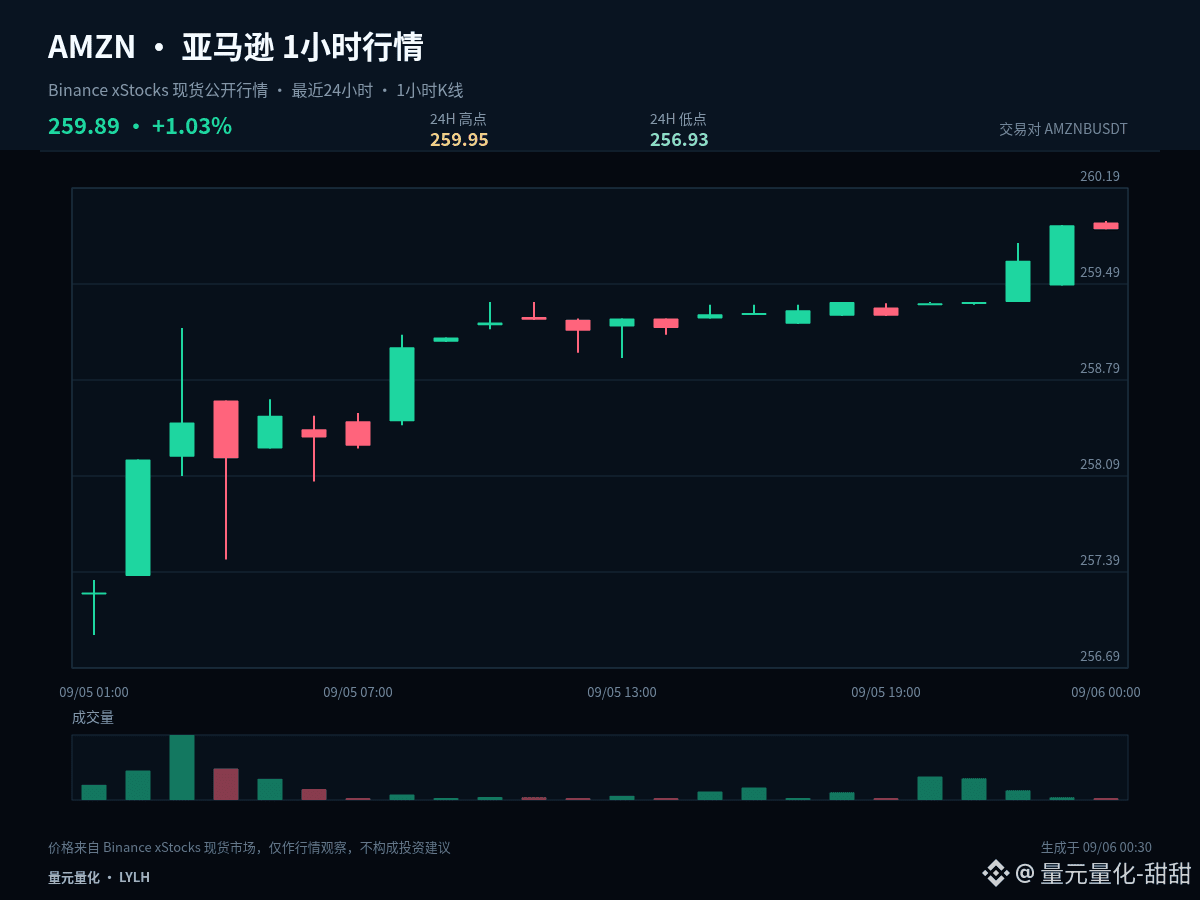
23
·
--
$AMZNB #AMZN The current situation is more suitable for first confirming a rebound, rather than prematurely defining a reversal. The current price is 259.92, 1-hour 0.00%, 24-hour +1.09%. Whether the two timeframes realign in the same direction again is the key focus ahead.
The current price is close to the upper bound of the recent 24-hour range, with 1-hour 0.00% and 24-hour +1.09%. At higher levels, the most important thing is to confirm the acceptance after a breakout: if the price can stay above the upper bound, it shows the market recognizes a higher range; if it only briefly pierces through and then quickly falls back, be alert to a false breakout.
If the rebound can recover 258.44 and further hold above 259.95, it would indicate that buying pressure is beginning to change the existing weakness; if it rises to the midpoint and then falls back again, especially if it drops back toward 256.93, it looks more like a failed repair, and the expectation of strengthening should not be continued.
Evidence is also needed to confirm a failed rebound; do not chase a short position just because of one rise-and-fall move. A more reasonable sequence is to observe resistance being blocked, lows moving lower again, and then decide based on whether subsequent pullbacks can reclaim key levels.
Existing positions can be handled in stages according to key levels to avoid making all judgments at once; those with no position should wait for breakout confirmation or a successful retest and stabilization. For U.S. stock symbols, also pay attention to volatility caused by trading-session transitions. The plan should be based on price conditions, not emotions.
The focus of short-term positions is not to predict every candlestick, but to ensure entries, reductions, and exits all have a basis. If there is no confirmation, trade less; if a key level fails, remake the plan. First control single-trade risk, then talk about subsequent room.
#BitcoinETFsBiggestDailyInflowSinceJanuary
$AMZNB #AMZN The current situation is more suitable for first confirming a rebound, rather than prematurely defining a reversal. The current price is 259.92, 1-hour 0.00%, 24-hour +1.09%. Whether the two timeframes realign in the same direction again is the key focus ahead.
The current price is close to the upper bound of the recent 24-hour range, with 1-hour 0.00% and 24-hour +1.09%. At higher levels, the most important thing is to confirm the acceptance after a breakout: if the price can stay above the upper bound, it shows the market recognizes a higher range; if it only briefly pierces through and then quickly falls back, be alert to a false breakout.
If the rebound can recover 258.44 and further hold above 259.95, it would indicate that buying pressure is beginning to change the existing weakness; if it rises to the midpoint and then falls back again, especially if it drops back toward 256.93, it looks more like a failed repair, and the expectation of strengthening should not be continued.
Evidence is also needed to confirm a failed rebound; do not chase a short position just because of one rise-and-fall move. A more reasonable sequence is to observe resistance being blocked, lows moving lower again, and then decide based on whether subsequent pullbacks can reclaim key levels.
Existing positions can be handled in stages according to key levels to avoid making all judgments at once; those with no position should wait for breakout confirmation or a successful retest and stabilization. For U.S. stock symbols, also pay attention to volatility caused by trading-session transitions. The plan should be based on price conditions, not emotions.
The focus of short-term positions is not to predict every candlestick, but to ensure entries, reductions, and exits all have a basis. If there is no confirmation, trade less; if a key level fails, remake the plan. First control single-trade risk, then talk about subsequent room.
#BitcoinETFsBiggestDailyInflowSinceJanuary
The current price is close to the upper bound of the recent 24-hour range, with 1-hour 0.00% and 24-hour +1.09%. At higher levels, the most important thing is to confirm the acceptance after a breakout: if the price can stay above the upper bound, it shows the market recognizes a higher range; if it only briefly pierces through and then quickly falls back, be alert to a false breakout.
If the rebound can recover 258.44 and further hold above 259.95, it would indicate that buying pressure is beginning to change the existing weakness; if it rises to the midpoint and then falls back again, especially if it drops back toward 256.93, it looks more like a failed repair, and the expectation of strengthening should not be continued.
Evidence is also needed to confirm a failed rebound; do not chase a short position just because of one rise-and-fall move. A more reasonable sequence is to observe resistance being blocked, lows moving lower again, and then decide based on whether subsequent pullbacks can reclaim key levels.
Existing positions can be handled in stages according to key levels to avoid making all judgments at once; those with no position should wait for breakout confirmation or a successful retest and stabilization. For U.S. stock symbols, also pay attention to volatility caused by trading-session transitions. The plan should be based on price conditions, not emotions.
The focus of short-term positions is not to predict every candlestick, but to ensure entries, reductions, and exits all have a basis. If there is no confirmation, trade less; if a key level fails, remake the plan. First control single-trade risk, then talk about subsequent room.
#BitcoinETFsBiggestDailyInflowSinceJanuary
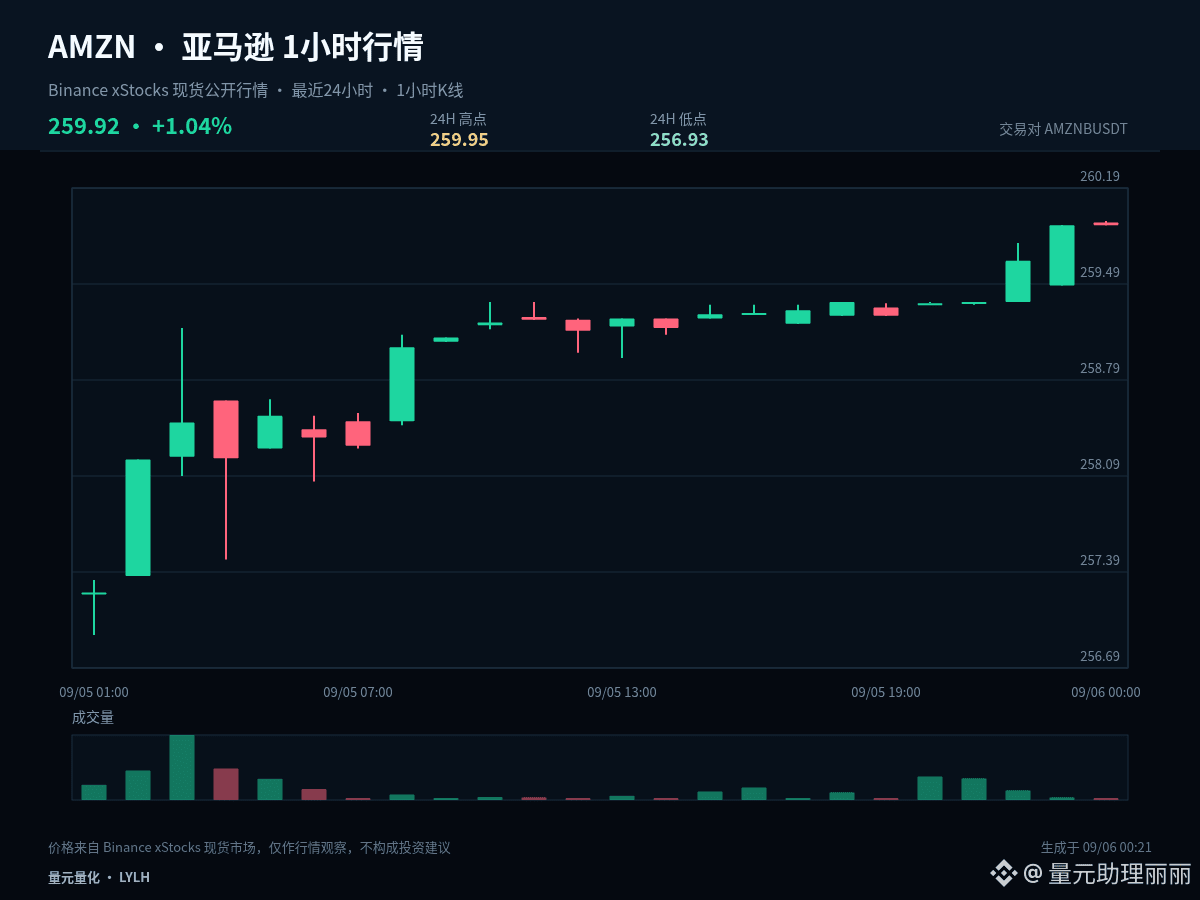
9
Log in to explore more content
Join global crypto users on Binance Square
⚡️ Get latest and useful information about crypto.
💬 Trusted by the world’s largest crypto exchange.
👍 Discover real insights from verified creators.
Email / Phone number
Trending Topics
1
#US10YTreasuryYieldHitsHighestSinceNov2023
498 views
48 Discussing
2
#USTreasuryToBuyBackUpTo$6BLongDatedDebt
7,538 views
122 Discussing
3
#BitcoinSurpasses$79K
50,484 views
244 Discussing
4
#BrentCrudeTops$100
106,872 views
368 Discussing
5
#USADPWeeklyEmploymentRises12000
75,404 views
986 Discussing
6
#BankOfAmericaGroupPilotsUSBDCStablecoin
58,807 views
787 Discussing
7
#RippleLobbiesToAdvanceCLARITYActVote
89,963 views
1,051 Discussing
8
#GrayscaleZcashETFTops$500M
14,073 views
122 Discussing
9
#LAPTOPFoundationXAccountSuspended
1,946 views
35 Discussing
10
#ChinaAugustCPIRises0.8%YoY
63,406 views
1,091 Discussing