RamadanWithBinance
1.1M views
556 Posts
Hot
Latest
$RUNE USDT 4H Chart
Price is ranging in an ascending channel and it is currently retracing towards a discounted area. MACD is not clear and EMAs are bullish. Price is expected to tap into the 4h demand at $8.8 before moving up again aiming to create a new high.
#RamadanWithBinance #SignalAlert #Signal #signals #BTC
Price is ranging in an ascending channel and it is currently retracing towards a discounted area. MACD is not clear and EMAs are bullish. Price is expected to tap into the 4h demand at $8.8 before moving up again aiming to create a new high.
#RamadanWithBinance #SignalAlert #Signal #signals #BTC

ETH/USDT 4HInterval Chart
Hello everyone, let's look at the 4H ETH to USDT chart, as we can see, the price cannot break through the uptrend line, remaining in the downtrend.
Let's start by setting goals for the near future that we can include:
T1 = $3,705
T2 = $4098
and
T3 = $4734
Now let's move on to the stop loss in case of further market declines:
SL1 = $3,354
SL2 = $2,902
AND
SL3 = $2,581
Looking at the RSI and STOCH indicators, we can see an attempt at a deeper recovery, just as the BTC price is currently recovering.
#RamadanWithBinance #BTC #Signal #SignalAlert #signals
$ETH

#HalvingHorizons $SEI Buy LONG
Buy Spot Future 10x Leverage
Buy 0.8250 to 0.8560
T p 0.8660
T p 0.8750
T p 0.8880
T p 0.8950
T p 0.9020
T p 0.9130
S.L 0.7620 or according to yourself
💰 Remember: Your Generous Tips would Empower our Mission and help us to work even Harder for you to give Best Investment Advice. 💫 Just $1 Usdt is Enough for Supporting me Guys 💵💵
#HotTrends #TrendingTopic: #TrendingArticle #RamadanWithBinance
$BTC $BNB
🌙 Ramadan Kareem! 🌟
Spread the light of hope this blessed month by joining hands with us! 🤝
As we embrace the spirit of giving during Ramadan, let's remember those less fortunate. Your generosity can change lives. 💖
🎁 Be a beacon of kindness - donate today and help provide iftar meals, essential supplies, and support to those in need. Every contribution counts! ✨
Together, let's make this Ramadan a beacon of hope for all. Join us in making a difference! 🌟
#RamadanWithBinance #GivingBack #HotTrends #MakeADifference
Follow | Like ❤️ | Quote 🔄 | Comment
Bullish Algorand Idea
Looking at the weekly chart for Algorand, it's worth paying attention to a developing huge head & shoulders pattern, which usually indicates the market bottom, creating a fresh higher high.
Since Algorand peaked back in November 2021, it entered a mean downtrend which lasted for approximately 700 days.
We can also see that the market developed a bit of diagonal resistance, and bears followed it all the way down.
Now, what we also see is that the market showed significant respect toward the $0.30 zone for approximately 1600 days.
Should the bulls take the opportunity to break through the key horizontal resistance and fully develop the H&S pattern, I’m expecting #Algorand to pump to approximately $0.80, which is a key horizontal resistance previously respected by buyers and sellers.
#RamadanWithBinance #TrendingTopic #Signal #SignalAlert #signals

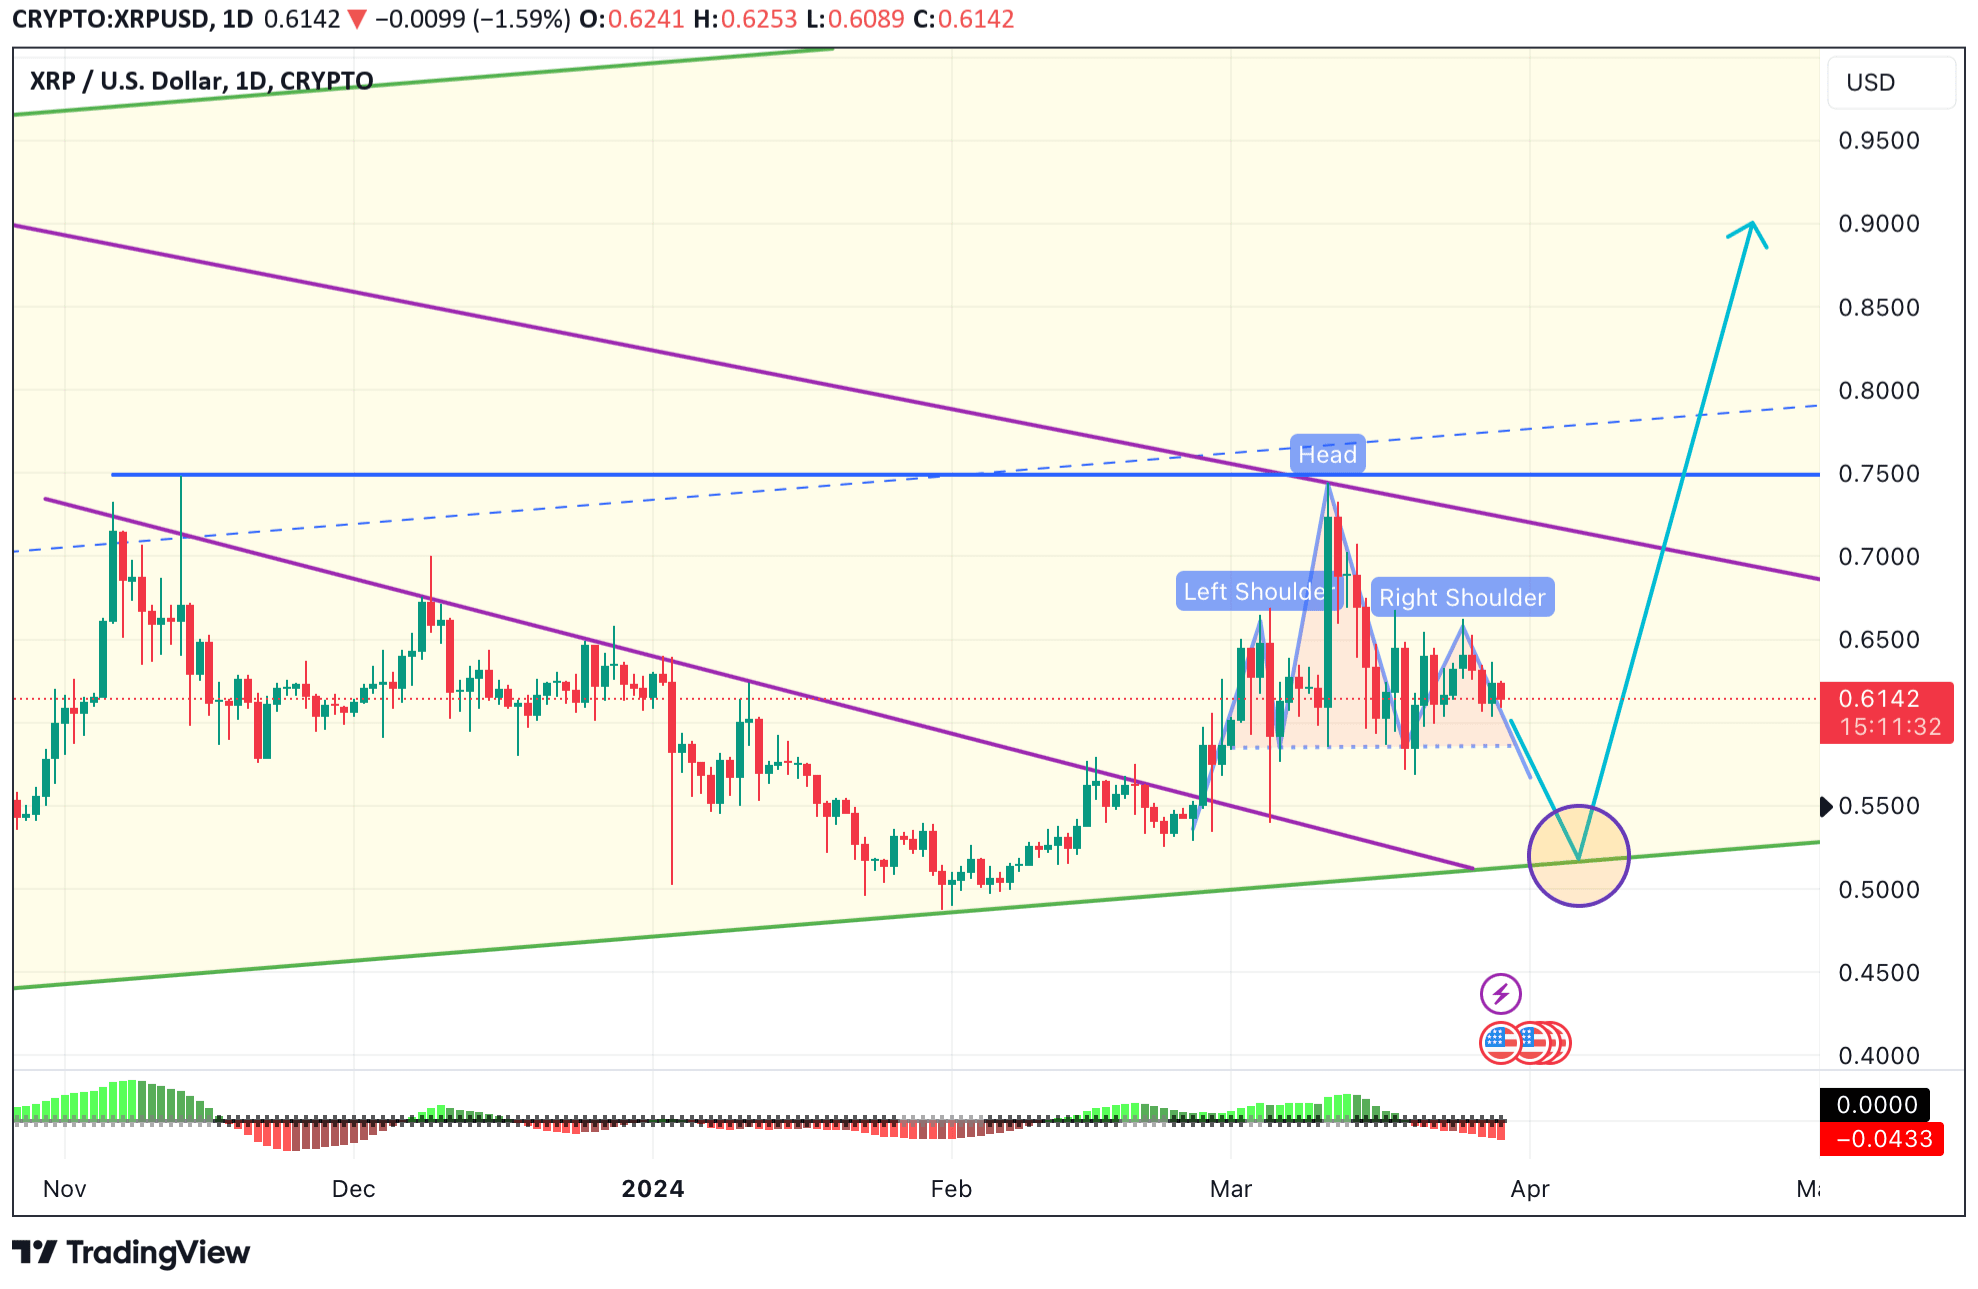
Head and shoulder almost complete
Ripple is going to complete an head and shoulder that will push price down a last time to touch long term support trendline
This will be a good entry point to catch the long waited upside move
$XRP
#BinancePIXEL #RamadanWithBinance #SignalAlert #Signal #signals
Ripple is going to complete an head and shoulder that will push price down a last time to touch long term support trendline
This will be a good entry point to catch the long waited upside move
$XRP
#BinancePIXEL #RamadanWithBinance #SignalAlert #Signal #signals
$UNI UPDATE
DISCLAIMER, PLEASE ALWAYS DO YOUR OWN
RESEARCH *
The information contained herein is for informational purposes only.
I do not guarantee any particular outcome. performance does not indicate future results.
#RamadanWithBinance #BTC #Signal #SignalAlert #signals
DISCLAIMER, PLEASE ALWAYS DO YOUR OWN
RESEARCH *
The information contained herein is for informational purposes only.
I do not guarantee any particular outcome. performance does not indicate future results.
#RamadanWithBinance #BTC #Signal #SignalAlert #signals

#TrendingTopic: $SHIB Buy LONG
Buy Spot Future 10x Leverage
Buy 0.⁴02990 to 0.⁴03189
T p 0.⁴03240
T p 0.⁴03280
T p 0.⁴03310
T p 0.⁴03350
T p 0.⁴03410
S.L 0.⁴02670 or according to yourself
🙏 Please use Low Leverage
💰 Remember: Your Generous Tips would Empower our Mission and help us to work even Harder for you to give Best Investment Advice. 💫 Just $1 Usdt is Enough for Supporting me Guys 💵💵
#TrendingArticle #RamadanWithBinance #HalvingHorizons #Write2Earn
$BTC $BNB
Binance started Ramadan Send Compaign Activity Participate in it and get a chance to Win 100 FBUSD in Reward.
Click on the link in the comment to participate or scan the Attached Image. #activity #RamadanWithBinance #Ramadansendcompaign #HotTrends #followmeformore
Click on the link in the comment to participate or scan the Attached Image. #activity #RamadanWithBinance #Ramadansendcompaign #HotTrends #followmeformore

Dear Crypto Investors,
#btchalving2024 834,213 Current Block Height.!
Get another new Reward Here 💸
more people competitive purchase for get huge profit this time. Yes! that people high intelligence for wise investors in Crypto world. Don't think over buy & hold #BTC #PEPE #SHIBA✅🚀 actually you can be a Billionaire end of the month.
congratulations all traders and investors
#RamadanWithBinance #HotTrends $BTC $ETH $BNB


Claim free 100 FDUSD.
Remadan pay mission.
just follow these instructions given below.
#RamadanWithBinance #Ramadan2024 #RamadanCalendar #HotTrends
Remadan pay mission.
just follow these instructions given below.
#RamadanWithBinance #Ramadan2024 #RamadanCalendar #HotTrends

Riddle Me This Ramadan: Share Community Rewards Worth $15,000 in FDUSD!
Fellow Binancians,
This Ramadan, Binance is launching an exclusive “Riddle Me This Ramadan” community activity. Delve into daily Ramadan-themed riddles, connect with the global Binance community, and stand to share $15,000 in FDUSD token vouchers!
Activity Period: 2024-03-11 09:00 (UTC) to 2024-03-21 23:59 (UTC)
How to Participate:
Join any of these communities: Binance Discord, Binance English, Binance Arabic, Binance Pakistan or Binance Indonesian.
Solve the daily riddles and submit your answers through the form that is shared daily in the corresponding community group(s) during the Activity Period.
Discuss the daily riddles in the aforementioned community group(s) using the #RamadanWithBinance hashtag.
Please note that the daily riddles and respective forms will only be released in the aforementioned community groups on weekdays during the Activity Period. Eligible participants who fulfill all the aforementioned requirements and answer at least six out of nine daily riddles correctly during the Activity Period, will each qualify for an equal share of $15,000 in FDUSD token vouchers.
Have fun, win rewards, and connect with our community during this special month!
Terms & Conditions:
Only users who complete KYC by the end of the Activity Period will be eligible for any rewards.
To be considered an eligible participant, users must fulfill all the following requirements during the Activity Period:
Join any of these communities: Binance Discord, Binance English, Binance Arabic, Binance Pakistan or Binance Indonesian.
Solve the daily riddles and submit your answers through the form that is shared daily in the corresponding community group(s).
Answer at least six out of the nine daily riddles correctly.
#HotTrends #Aevo #BinanceFuturesNEXT

VIP NEWS
Tether Assists US Government in Seizing $1.4 Million From Unhosted Wallet
Tether, the company behind the issuance of USDT, the largest stablecoin in the cryptocurrency market, announced that it helped the U.S. government to seize $1.4 million linked to an alleged fraud scheme. According to the Northern District of Illinois U.S. Attorney’s Office, the seizure marks one of the first times that the U.S. has recovered USDT from an unhosted wallet.
➖➖➖➖➖
#HotTrends #RamadanWithBinance

#HalvingHorizons Btc 60k or 80k ❓ ❓
🚨 Btc New Support Zone is 65250 if break and not recover Within 5 Minutes then our next Buying is 63500
🔋 Btc Safe Zone is 65950 if resist 45 Minutes completely then Ready to Fly and Next Resistance is 68550
Buy Spot Future 10x Leverage
Buy 65250
T p 65350
T p 65500
T p 65650
T p 65900 if resist 45 Minutes then Ready to Next Level 🚀🚀🚀
T p 66250
T p 66800
T p 66950 Need Resistance
T p 67250
T p 67500 Need Resistance
T p 67950 if Resist 45 Minutes Completely then Flying 🚀🚀🚀
T p 68500
T p 69250 if resist 45 Minutes completely then wait for 72k to 74k
S.L 64850 or According to yourself
⚠️ Remember ‼️ Btc Next Support Zone is 63500 if break this Level and not recover within 5 Minutes then Dump to 60k Level
💰 Remember: Your Generous Tips would Empower our Mission and help us to work even Harder for you to give Best Investment Advice. 💫 Just $1 Usdt is Enough for Supporting me Guys 💵💵
#HotTrends #RamadanWithBinance #TrendingTopic: #TrendingArticle
$SOL
$SEI
$BTC
LINKUSDT RISE
LINK appears to be in a favorable buying zone, with a new fresh supply zone identified between 17 to 18.4. The decision to enter the market aligns with multiple technical indicators suggesting a buying opportunity.
Firstly, the technical rating is classified as 'buy', indicating a positive sentiment towards the asset's performance. This rating suggests that various indicators, such as moving averages (MA), Relative Strength Index (RSI), Momentum (MOM), and Commodity Channel Index (CCI), are showing signs conducive to buying.
The MA, a widely used trend-following indicator, is strongly signaling a buy, indicating a bullish trend in the market. This suggests that the price of LINK is likely to continue rising in the near term.
The RSI, currently at 52.2, is in a neutral position, neither overbought nor oversold. This suggests that there is room for further upward movement before the asset becomes overbought, supporting the notion of a potential buying opportunity.
MOM, at -17.2, indicates a negative momentum, but it's important to note that momentum indicators like MOM can often lag behind price movements. The fact that the price is within the identified buying zone suggests that momentum may shift upwards soon.
Similarly, the CCI, at -13, indicates a slight downward pressure, but it's relatively close to the zero line, suggesting a potential reversal or consolidation in the near future.
Managing risk is crucial in trading, and it's commendable that you've emphasized this aspect. When entering a trade, it's essential to have a clear risk management strategy in place. This could include setting stop-loss orders to limit potential losses and ensuring proper position sizing to protect your capital.
In conclusion, the technical analysis indicates a favorable buying opportunity for LINKUSDT within the identified zone. However, it's important to monitor the market closely and manage risk effectively to navigate potential fluctuations in price. By incorporating these technical insights into your trading strategy, you can make informed decisions and potentially capitalize on favorable market conditions.
#HotTrends #RamadanWithBinance #TrendingTopic #Signal #SignalAlert

