
#mub
mub
65,320 views
1,599 Discussing
Hot
Latest

Orderflow on $MUB is getting crowded near the $717.27 level.
Where does $MUB close today?
[A] Break above $758.51 cleanly
[B] Flush down to $717.27 liquidity
[C] Choppy sideways bleed
$MUB $ETH $BNB #MUB #Write2Earn #BinanceSquare
Orderflow on $MUB is getting crowded near the $717.27 level.
Where does $MUB close today?
[A] Break above $758.51 cleanly
[B] Flush down to $717.27 liquidity
[C] Choppy sideways bleed
$MUB $ETH $BNB #MUB #Write2Earn #BinanceSquare
Where does $MUB close today?
[A] Break above $758.51 cleanly
[B] Flush down to $717.27 liquidity
[C] Choppy sideways bleed
$MUB $ETH $BNB #MUB #Write2Earn #BinanceSquare

·
--
$MUB Price Revisits Swing Low Following Recent Pullback
$MUB trades at 720.59 USD, down 5.8% over the past 24 hours, with 4H RSI at 35.7 (neutral).
Downward movement over the past twenty-four hours has brought price to test its twenty-candle swing low. On the four-hour chart, the relative strength index remains in the neutral zone, reflecting balanced momentum at this key level.
WHY IT IS ON THE RADAR
▪️ 24h move: -5.8%
▪️ 24h volume: 41M USDT (#13 among liquid USDT pairs)
KEY LEVELS
▪️ Resistance: 807.00 USD (20-candle 4H swing high)
▪️ Support: 718.28 USD (20-candle 4H swing low)
WHAT WOULD CONFIRM A HOLD
▪️ 4H candles defending 718.28 USD with a recovery above EMA 20 (752.62 USD)
WHAT WOULD INVALIDATE IT
▪️ A 4H close below 718.28 USD
Do you expect this swing low to hold or break on the four-hour chart?
Not financial advice. Always DYOR.
Like & Follow for Daily Trade Analytics & Insider News. @MistralAK
#MUB #Trending #TrendingTopic
{spot}(MUBUSDT)
$MUB Price Revisits Swing Low Following Recent Pullback
$MUB trades at 720.59 USD, down 5.8% over the past 24 hours, with 4H RSI at 35.7 (neutral).
Downward movement over the past twenty-four hours has brought price to test its twenty-candle swing low. On the four-hour chart, the relative strength index remains in the neutral zone, reflecting balanced momentum at this key level.
WHY IT IS ON THE RADAR
▪️ 24h move: -5.8%
▪️ 24h volume: 41M USDT (#13 among liquid USDT pairs)
KEY LEVELS
▪️ Resistance: 807.00 USD (20-candle 4H swing high)
▪️ Support: 718.28 USD (20-candle 4H swing low)
WHAT WOULD CONFIRM A HOLD
▪️ 4H candles defending 718.28 USD with a recovery above EMA 20 (752.62 USD)
WHAT WOULD INVALIDATE IT
▪️ A 4H close below 718.28 USD
Do you expect this swing low to hold or break on the four-hour chart?
Not financial advice. Always DYOR.
Like & Follow for Daily Trade Analytics & Insider News. @MistralAK
#MUB #Trending #TrendingTopic
$MUB trades at 720.59 USD, down 5.8% over the past 24 hours, with 4H RSI at 35.7 (neutral).
Downward movement over the past twenty-four hours has brought price to test its twenty-candle swing low. On the four-hour chart, the relative strength index remains in the neutral zone, reflecting balanced momentum at this key level.
WHY IT IS ON THE RADAR
▪️ 24h move: -5.8%
▪️ 24h volume: 41M USDT (#13 among liquid USDT pairs)
KEY LEVELS
▪️ Resistance: 807.00 USD (20-candle 4H swing high)
▪️ Support: 718.28 USD (20-candle 4H swing low)
WHAT WOULD CONFIRM A HOLD
▪️ 4H candles defending 718.28 USD with a recovery above EMA 20 (752.62 USD)
WHAT WOULD INVALIDATE IT
▪️ A 4H close below 718.28 USD
Do you expect this swing low to hold or break on the four-hour chart?
Not financial advice. Always DYOR.
Like & Follow for Daily Trade Analytics & Insider News. @MistralAK
#MUB #Trending #TrendingTopic

18

·
--
$MUB is cooling off as hourly volume drops to 0.62x average.
Trading at $739.12, the asset is currently testing the lower bound of its recent $740.65 to $792.84 range. The low volume suggests a consolidation phase rather than aggressive distribution.
A bullish reclaim of the $740.65 mark could signal stabilization for a move back toward the range highs. Conversely, failing to hold the current support could invite further downside toward recent lows.
If $740.65 acts as a pivot, do you see this as a healthy reset or the start of a deeper correction?
Tap $MUB for the live chart. #MUB #BinanceSquare
$MUB is cooling off as hourly volume drops to 0.62x average.
Trading at $739.12, the asset is currently testing the lower bound of its recent $740.65 to $792.84 range. The low volume suggests a consolidation phase rather than aggressive distribution.
A bullish reclaim of the $740.65 mark could signal stabilization for a move back toward the range highs. Conversely, failing to hold the current support could invite further downside toward recent lows.
If $740.65 acts as a pivot, do you see this as a healthy reset or the start of a deeper correction?
Tap $MUB for the live chart. #MUB #BinanceSquare
Trading at $739.12, the asset is currently testing the lower bound of its recent $740.65 to $792.84 range. The low volume suggests a consolidation phase rather than aggressive distribution.
A bullish reclaim of the $740.65 mark could signal stabilization for a move back toward the range highs. Conversely, failing to hold the current support could invite further downside toward recent lows.
If $740.65 acts as a pivot, do you see this as a healthy reset or the start of a deeper correction?
Tap $MUB for the live chart. #MUB #BinanceSquare
1

·
--
$MUB trading volume is surging while the price softens.
Despite a 1.45% decline to $745.4, the latest hourly volume hit 1.74x the 23-hour average. This suggests aggressive activity as the price trades below the recent range low of 749.44.
If the price reclaims 749.44, it may signal a return of buyers. However, failing to recover this level keeps the bearish pressure in focus.
Does this high-volume dip represent an accumulation phase or a distribution signal before further downside?
Tap $MUB for the live chart. #MUB #BinanceSquare
$MUB trading volume is surging while the price softens.
Despite a 1.45% decline to $745.4, the latest hourly volume hit 1.74x the 23-hour average. This suggests aggressive activity as the price trades below the recent range low of 749.44.
If the price reclaims 749.44, it may signal a return of buyers. However, failing to recover this level keeps the bearish pressure in focus.
Does this high-volume dip represent an accumulation phase or a distribution signal before further downside?
Tap $MUB for the live chart. #MUB #BinanceSquare
Despite a 1.45% decline to $745.4, the latest hourly volume hit 1.74x the 23-hour average. This suggests aggressive activity as the price trades below the recent range low of 749.44.
If the price reclaims 749.44, it may signal a return of buyers. However, failing to recover this level keeps the bearish pressure in focus.
Does this high-volume dip represent an accumulation phase or a distribution signal before further downside?
Tap $MUB for the live chart. #MUB #BinanceSquare
·
--
$MUB volume spike suggests buyers are testing the 750 support zone.
Recent data shows a 2.56x volume surge during the last hour, indicating active re-accumulation after the price dipped toward the 750.64 floor. Stability here is key for potential recovery.
If the price climbs back above the 792.84 high, momentum could shift toward a broader reversal. Conversely, a sustained breakdown below 750.64 would signal a loss of current buyer interest.
Does the high relative volume at these levels suggest a firm bottom or just a temporary pause in the trend?
Tap $MUB for the live chart. #MUB #BinanceSquare
$MUB volume spike suggests buyers are testing the 750 support zone.
Recent data shows a 2.56x volume surge during the last hour, indicating active re-accumulation after the price dipped toward the 750.64 floor. Stability here is key for potential recovery.
If the price climbs back above the 792.84 high, momentum could shift toward a broader reversal. Conversely, a sustained breakdown below 750.64 would signal a loss of current buyer interest.
Does the high relative volume at these levels suggest a firm bottom or just a temporary pause in the trend?
Tap $MUB for the live chart. #MUB #BinanceSquare
Recent data shows a 2.56x volume surge during the last hour, indicating active re-accumulation after the price dipped toward the 750.64 floor. Stability here is key for potential recovery.
If the price climbs back above the 792.84 high, momentum could shift toward a broader reversal. Conversely, a sustained breakdown below 750.64 would signal a loss of current buyer interest.
Does the high relative volume at these levels suggest a firm bottom or just a temporary pause in the trend?
Tap $MUB for the live chart. #MUB #BinanceSquare

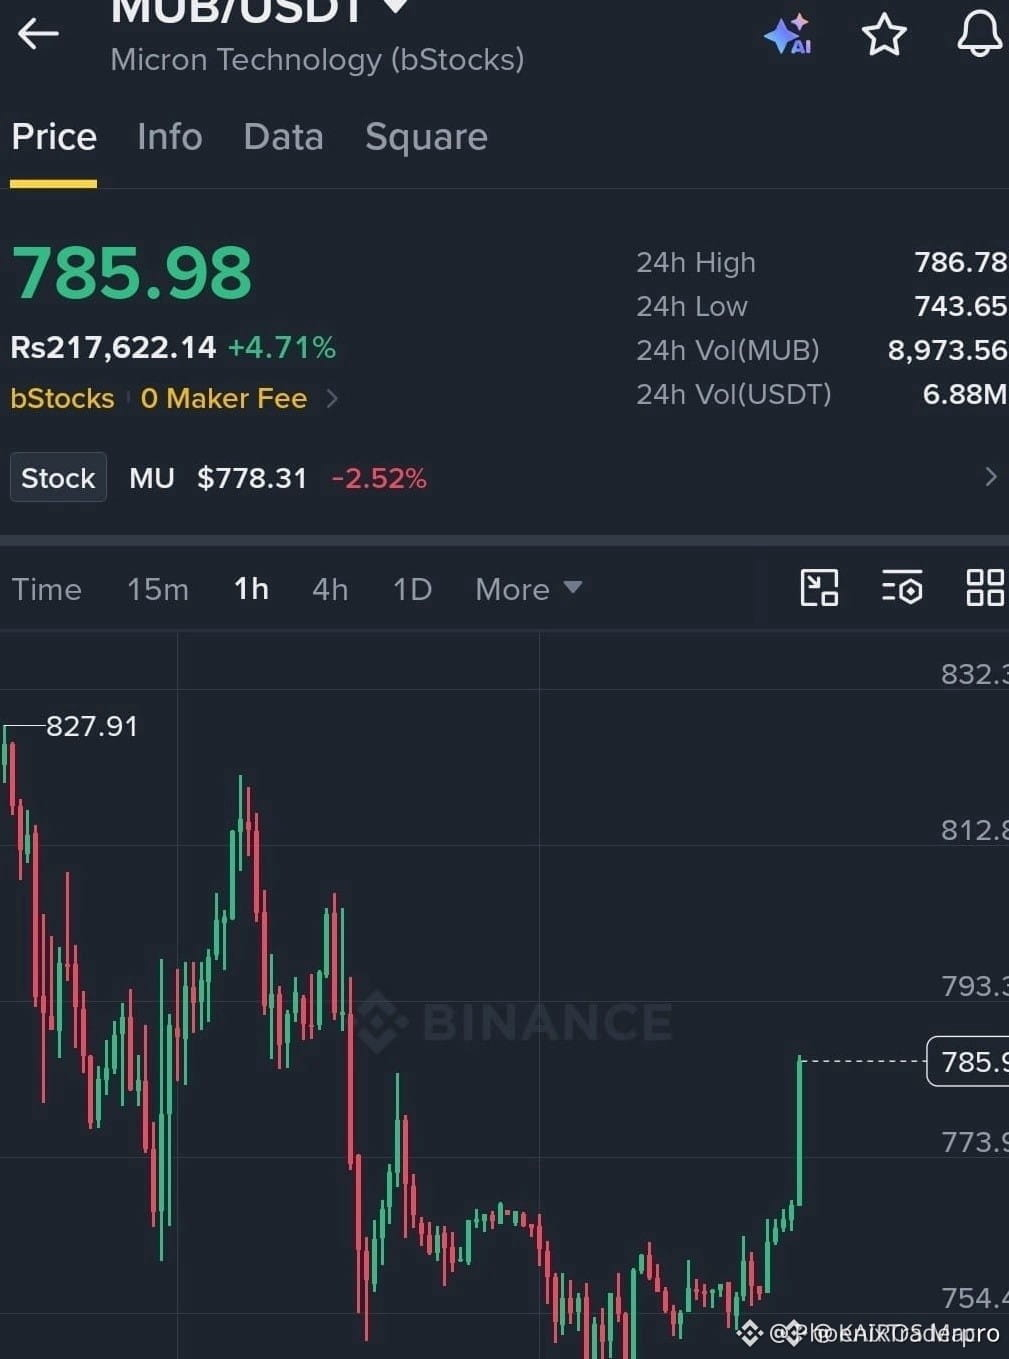
🚀 $MUB SHATTERS KEY RESISTANCE AS BUYERS STORM THE ORDER BOOK! 💥
Entry: 774 - 782 ⚡
Target: 800, 812, 827 🚀
Stop Loss: 764 ⚠️
The clean breakout over 773.90 just triggered a massive liquidity influx, catching aggressive sellers flat-footed as momentum accelerates. ⚡ Order flow shows heavy institutional bidding stepping in right at support to fuel this explosive leg higher. 📊
Managing risk while riding a high-conviction trend continuation requires absolute discipline as volatility expands across the board. 💡 Are you holding your position here or waiting for a cleaner retest? 👇
⚠️ Not financial advice. Always manage your risk. 🛡️
🏷️ #MUB #LongSetup #Breakout #Crypto
🔥 💎
🚀 $MUB SHATTERS KEY RESISTANCE AS BUYERS STORM THE ORDER BOOK! 💥
Entry: 774 - 782 ⚡
Target: 800, 812, 827 🚀
Stop Loss: 764 ⚠️
The clean breakout over 773.90 just triggered a massive liquidity influx, catching aggressive sellers flat-footed as momentum accelerates. ⚡ Order flow shows heavy institutional bidding stepping in right at support to fuel this explosive leg higher. 📊
Managing risk while riding a high-conviction trend continuation requires absolute discipline as volatility expands across the board. 💡 Are you holding your position here or waiting for a cleaner retest? 👇
⚠️ Not financial advice. Always manage your risk. 🛡️
🏷️ #MUB #LongSetup #Breakout #Crypto
🔥 💎
Entry: 774 - 782 ⚡
Target: 800, 812, 827 🚀
Stop Loss: 764 ⚠️
The clean breakout over 773.90 just triggered a massive liquidity influx, catching aggressive sellers flat-footed as momentum accelerates. ⚡ Order flow shows heavy institutional bidding stepping in right at support to fuel this explosive leg higher. 📊
Managing risk while riding a high-conviction trend continuation requires absolute discipline as volatility expands across the board. 💡 Are you holding your position here or waiting for a cleaner retest? 👇
⚠️ Not financial advice. Always manage your risk. 🛡️
🏷️ #MUB #LongSetup #Breakout #Crypto
🔥 💎
84

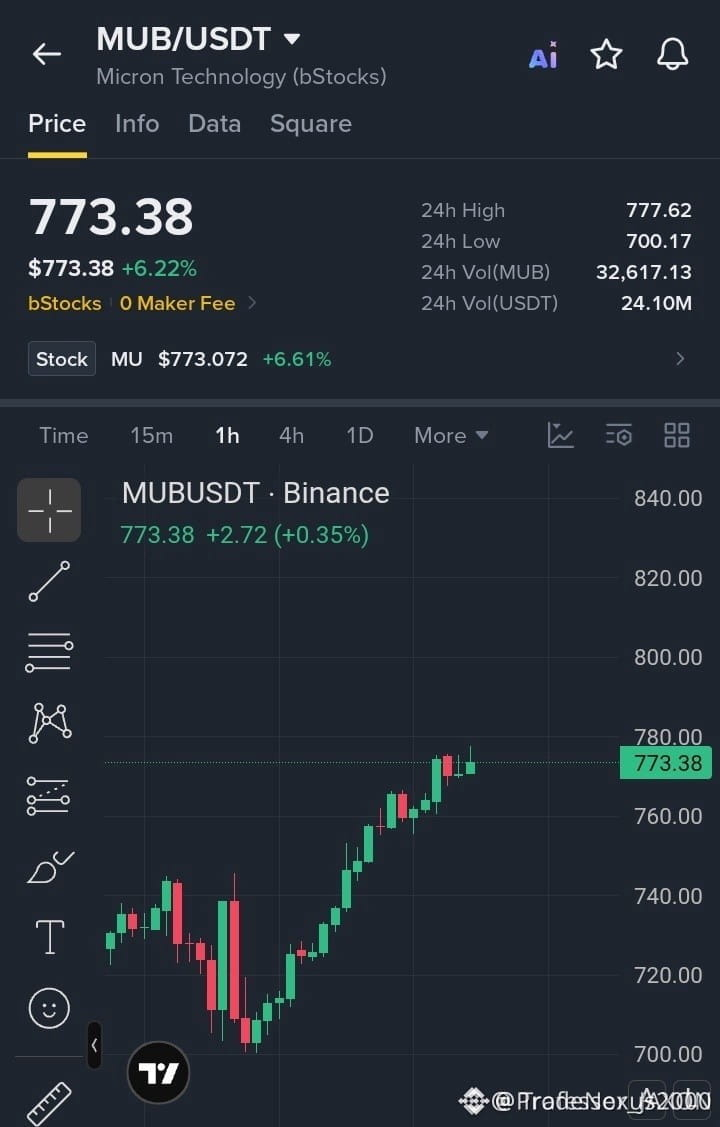
🦈 $MUB IS COMPRESSING BENEATH RESISTANCE AS SMART MONEY PREPARES FOR EXPANSION! 💥
Entry: 768.00–774.00 ⚡
Target: 800.00 🚀
Stop Loss: 758.00 ⚠️
Institutional order flow is currently absorbing supply near the 773 threshold following a decisive recovery off the 700 structural demand base. 📊 Price compression directly under the 777-778 overhead resistance indicates trapped liquidity ready to fuel an impulsive breakout continuation. ⚡
We are tracking a textbook accumulation phase where patient bids are being filled inside the optimal entry zone. 💡 Are you positioned for the sweep toward higher distribution levels, or waiting for confirmation? 👇
⚠️ Not financial advice. Always manage your risk. 🛡️
🏷️ #MUB #SmartMoney #Breakout #LongSetup #Crypto
🦈 ⚖️
🦈 $MUB IS COMPRESSING BENEATH RESISTANCE AS SMART MONEY PREPARES FOR EXPANSION! 💥
Entry: 768.00–774.00 ⚡
Target: 800.00 🚀
Stop Loss: 758.00 ⚠️
Institutional order flow is currently absorbing supply near the 773 threshold following a decisive recovery off the 700 structural demand base. 📊 Price compression directly under the 777-778 overhead resistance indicates trapped liquidity ready to fuel an impulsive breakout continuation. ⚡
We are tracking a textbook accumulation phase where patient bids are being filled inside the optimal entry zone. 💡 Are you positioned for the sweep toward higher distribution levels, or waiting for confirmation? 👇
⚠️ Not financial advice. Always manage your risk. 🛡️
🏷️ #MUB #SmartMoney #Breakout #LongSetup #Crypto
🦈 ⚖️
Entry: 768.00–774.00 ⚡
Target: 800.00 🚀
Stop Loss: 758.00 ⚠️
Institutional order flow is currently absorbing supply near the 773 threshold following a decisive recovery off the 700 structural demand base. 📊 Price compression directly under the 777-778 overhead resistance indicates trapped liquidity ready to fuel an impulsive breakout continuation. ⚡
We are tracking a textbook accumulation phase where patient bids are being filled inside the optimal entry zone. 💡 Are you positioned for the sweep toward higher distribution levels, or waiting for confirmation? 👇
⚠️ Not financial advice. Always manage your risk. 🛡️
🏷️ #MUB #SmartMoney #Breakout #LongSetup #Crypto
🦈 ⚖️
3

·
--
Silicon Surge: $MUB Gains Traction on Binance Spot 🌐
Micron Technology’s bStock ($MUB) trades on Binance Spot as MUB/USDT. Price action – $MUB is at $757.33, down 1.08 % over the past 24 hours on modest volume. The dip comes as broader memory stocks pause, but rising AI‑driven data‑center demand keeps the sector upbeat, making the move a potential entry point.
Key levels – Immediate support sits near $750, a floor that held during last week’s sell‑off. Resistance clusters around $770, where sellers previously capped upside. The mid‑range lies at roughly $760, aligning closely with today’s price and serving as a pivot for short‑term traders.
Short outlook – With momentum building and the dip presenting a buyable risk‑reward, the bullish continuation case is intact. Expect the price to test the $770 barrier; a break could open a path toward $785, while a retest of $750 would likely be absorbed before the next leg up.
#MUB #bStocks #BinanceSquare
Silicon Surge: $MUB Gains Traction on Binance Spot 🌐
Micron Technology’s bStock ($MUB ) trades on Binance Spot as MUB/USDT. Price action – $MUB is at $757.33, down 1.08 % over the past 24 hours on modest volume. The dip comes as broader memory stocks pause, but rising AI‑driven data‑center demand keeps the sector upbeat, making the move a potential entry point.
Key levels – Immediate support sits near $750, a floor that held during last week’s sell‑off. Resistance clusters around $770, where sellers previously capped upside. The mid‑range lies at roughly $760, aligning closely with today’s price and serving as a pivot for short‑term traders.
Short outlook – With momentum building and the dip presenting a buyable risk‑reward, the bullish continuation case is intact. Expect the price to test the $770 barrier; a break could open a path toward $785, while a retest of $750 would likely be absorbed before the next leg up.
#MUB #bStocks #BinanceSquare
Micron Technology’s bStock ($MUB ) trades on Binance Spot as MUB/USDT. Price action – $MUB is at $757.33, down 1.08 % over the past 24 hours on modest volume. The dip comes as broader memory stocks pause, but rising AI‑driven data‑center demand keeps the sector upbeat, making the move a potential entry point.
Key levels – Immediate support sits near $750, a floor that held during last week’s sell‑off. Resistance clusters around $770, where sellers previously capped upside. The mid‑range lies at roughly $760, aligning closely with today’s price and serving as a pivot for short‑term traders.
Short outlook – With momentum building and the dip presenting a buyable risk‑reward, the bullish continuation case is intact. Expect the price to test the $770 barrier; a break could open a path toward $785, while a retest of $750 would likely be absorbed before the next leg up.
#MUB #bStocks #BinanceSquare
3

·
--
$MUB -1.62% | $TSLAB -1.69% | $TRX -1.75%
#MUB slipped to $755.12, down 1.62% on $3.7 M of volume. The modest flow hints the dip may be a short‑term pullback rather than a broader sell‑off.
#TSLAB traded at $385.15, down 1.69% with $1.1 M changing hands. Its lighter volume makes the move a bit more fragile.
#TRX sits at $0.3083, down 1.75% on a robust $29.2 M of volume. 📈 The strong turnover suggests interest remains despite the slide.
Watch the contrast: TRX’s heavy volume could cushion further downside, while the other two tokens lack similar support.
#Write2Earn #Binance
$MUB -1.62% | $TSLAB -1.69% | $TRX -1.75%
#MUB slipped to $755.12, down 1.62% on $3.7 M of volume. The modest flow hints the dip may be a short‑term pullback rather than a broader sell‑off.
#TSLAB traded at $385.15, down 1.69% with $1.1 M changing hands. Its lighter volume makes the move a bit more fragile.
#TRX sits at $0.3083, down 1.75% on a robust $29.2 M of volume. 📈 The strong turnover suggests interest remains despite the slide.
Watch the contrast: TRX’s heavy volume could cushion further downside, while the other two tokens lack similar support.
#Write2Earn #Binance
#MUB slipped to $755.12, down 1.62% on $3.7 M of volume. The modest flow hints the dip may be a short‑term pullback rather than a broader sell‑off.
#TSLAB traded at $385.15, down 1.69% with $1.1 M changing hands. Its lighter volume makes the move a bit more fragile.
#TRX sits at $0.3083, down 1.75% on a robust $29.2 M of volume. 📈 The strong turnover suggests interest remains despite the slide.
Watch the contrast: TRX’s heavy volume could cushion further downside, while the other two tokens lack similar support.
#Write2Earn #Binance
5
·
--
A 6.71% daily dip to $765.54 cools heavy volatility.
Volume sits at $14.41M, while the latest hourly close at $764.38 shows a modest 0.18% drop. Trading activity has slowed to 0.75x of the preceding 23-hour average, signaling a temporary pause after an 821.66 high and 751.1 low range.
If $MUB stabilizes and reclaims the upper boundary, momentum could return toward prior highs. Conversely, a sustained break below the 751.1 low would invalidate the setup and signal deeper downside risk.
Will you wait for a confirmed reclaim of the upper range, or does a drop below the 751.1 low invalidate your interest entirely?
Tap $MUB for the live chart. #MUB #BinanceSquare
A 6.71% daily dip to $765.54 cools heavy volatility.
Volume sits at $14.41M, while the latest hourly close at $764.38 shows a modest 0.18% drop. Trading activity has slowed to 0.75x of the preceding 23-hour average, signaling a temporary pause after an 821.66 high and 751.1 low range.
If $MUB stabilizes and reclaims the upper boundary, momentum could return toward prior highs. Conversely, a sustained break below the 751.1 low would invalidate the setup and signal deeper downside risk.
Will you wait for a confirmed reclaim of the upper range, or does a drop below the 751.1 low invalidate your interest entirely?
Tap $MUB for the live chart. #MUB #BinanceSquare
Volume sits at $14.41M, while the latest hourly close at $764.38 shows a modest 0.18% drop. Trading activity has slowed to 0.75x of the preceding 23-hour average, signaling a temporary pause after an 821.66 high and 751.1 low range.
If $MUB stabilizes and reclaims the upper boundary, momentum could return toward prior highs. Conversely, a sustained break below the 751.1 low would invalidate the setup and signal deeper downside risk.
Will you wait for a confirmed reclaim of the upper range, or does a drop below the 751.1 low invalidate your interest entirely?
Tap $MUB for the live chart. #MUB #BinanceSquare
72
·
--
Trading $MUB at $769.77 means navigating a 4.05% daily dip on $14.68M volume.
The latest hourly close at $770.68 sits inside a broader 24-hour range spanning from a low of $751.10 to a high of $821.66. While volume remains near its hourly baseline, the recent pullback requires careful risk management.
If buyers reclaim momentum above the mid-range, continuation toward the upper boundary becomes a scenario to watch. Conversely, a sustained break below the $751.10 low invalidates this setup.
Will you wait for a confirmed break above the upper range boundary, or does dipping near support signal too much risk?
Tap $MUB for the live chart. #MUB #BinanceSquare
Trading $MUB at $769.77 means navigating a 4.05% daily dip on $14.68M volume.
The latest hourly close at $770.68 sits inside a broader 24-hour range spanning from a low of $751.10 to a high of $821.66. While volume remains near its hourly baseline, the recent pullback requires careful risk management.
If buyers reclaim momentum above the mid-range, continuation toward the upper boundary becomes a scenario to watch. Conversely, a sustained break below the $751.10 low invalidates this setup.
Will you wait for a confirmed break above the upper range boundary, or does dipping near support signal too much risk?
Tap $MUB for the live chart. #MUB #BinanceSquare
The latest hourly close at $770.68 sits inside a broader 24-hour range spanning from a low of $751.10 to a high of $821.66. While volume remains near its hourly baseline, the recent pullback requires careful risk management.
If buyers reclaim momentum above the mid-range, continuation toward the upper boundary becomes a scenario to watch. Conversely, a sustained break below the $751.10 low invalidates this setup.
Will you wait for a confirmed break above the upper range boundary, or does dipping near support signal too much risk?
Tap $MUB for the live chart. #MUB #BinanceSquare
2

·
--
Token $MUB is down 7.8% over the past 24 hours! The price is hovering around 719.76 USDT, with a low of 707.83 USDT and a high of 780.79 USDT, on a trading volume of 35.2 million USDT. The market is stormy, and buyers are finding it far from easy to hold on to the initiative. It looks like some very volatile hours lie ahead, so it’s best to stay alert and watch the key support zones. Be mindful of the risks and don’t give in to panic.
Source: Binance Market
#MUB #Crypto #Trading
📊 $MUB: 719.76 USDT (-7.53% in 24h)
Token $MUB is down 7.8% over the past 24 hours! The price is hovering around 719.76 USDT, with a low of 707.83 USDT and a high of 780.79 USDT, on a trading volume of 35.2 million USDT. The market is stormy, and buyers are finding it far from easy to hold on to the initiative. It looks like some very volatile hours lie ahead, so it’s best to stay alert and watch the key support zones. Be mindful of the risks and don’t give in to panic.
Source: Binance Market
#MUB #Crypto #Trading
📊 $MUB : 719.76 USDT (-7.53% in 24h)
Source: Binance Market
#MUB #Crypto #Trading
📊 $MUB : 719.76 USDT (-7.53% in 24h)

·
--
That drop probably woke a lot of people up. $MUB fell 7.69% in a day to 718.55, just a few steps above its 24-hour low of 707.83. Yesterday, it was still at 782.86.
Those holding it are probably struggling with the same question: sell or stay? Sell, and you’re afraid of selling near the bottom; hold, and you’re afraid another drop is coming. This is the kind of situation that really wears you down.
I’d lean toward waiting to see if it stabilizes around 707.83 before deciding anything else. If it holds, we can talk about what comes next; if it breaks below 707.83, that means this slide isn’t over, and I’ll change my mind immediately.
Those holding $MUB , be honest: are you more tempted to buy the dip or get out right now?
$MUB
#行情分析 #MUB
That drop probably woke a lot of people up. $MUB fell 7.69% in a day to 718.55, just a few steps above its 24-hour low of 707.83. Yesterday, it was still at 782.86.
Those holding it are probably struggling with the same question: sell or stay? Sell, and you’re afraid of selling near the bottom; hold, and you’re afraid another drop is coming. This is the kind of situation that really wears you down.
I’d lean toward waiting to see if it stabilizes around 707.83 before deciding anything else. If it holds, we can talk about what comes next; if it breaks below 707.83, that means this slide isn’t over, and I’ll change my mind immediately.
Those holding $MUB , be honest: are you more tempted to buy the dip or get out right now?
$MUB
#行情分析 #MUB
Those holding it are probably struggling with the same question: sell or stay? Sell, and you’re afraid of selling near the bottom; hold, and you’re afraid another drop is coming. This is the kind of situation that really wears you down.
I’d lean toward waiting to see if it stabilizes around 707.83 before deciding anything else. If it holds, we can talk about what comes next; if it breaks below 707.83, that means this slide isn’t over, and I’ll change my mind immediately.
Those holding $MUB , be honest: are you more tempted to buy the dip or get out right now?
$MUB
#行情分析 #MUB

·
--
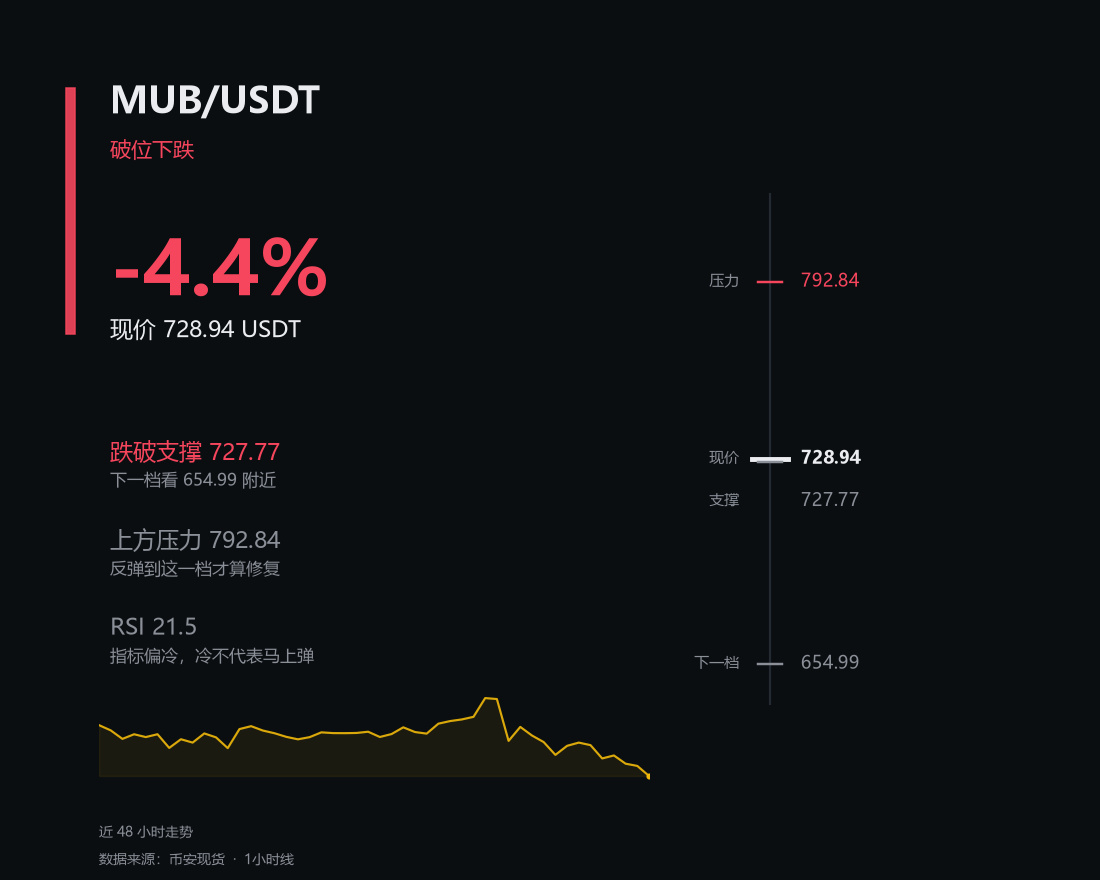
$MUB Down 4.4% today—softer than Bitcoin, with the current price at 728.94.
Look at it another way: if you were the market maker, what would you do at this level?
Push it up to 792.84 to lure in some long buyers, then turn around and sweep the stop-losses below 727.77. You can profit from both sides.
An RSI of 21.5 is just enough to stir up some emotions.
Are you waiting for a signal, or have you already jumped in?
What the market says matters more than stubborn talk.
#币圈 #MUB
$MUB Down 4.4% today—softer than Bitcoin, with the current price at 728.94.
Look at it another way: if you were the market maker, what would you do at this level?
Push it up to 792.84 to lure in some long buyers, then turn around and sweep the stop-losses below 727.77. You can profit from both sides.
An RSI of 21.5 is just enough to stir up some emotions.
Are you waiting for a signal, or have you already jumped in?
What the market says matters more than stubborn talk.
#币圈 #MUB
Look at it another way: if you were the market maker, what would you do at this level?
Push it up to 792.84 to lure in some long buyers, then turn around and sweep the stop-losses below 727.77. You can profit from both sides.
An RSI of 21.5 is just enough to stir up some emotions.
Are you waiting for a signal, or have you already jumped in?
What the market says matters more than stubborn talk.
#币圈 #MUB
137
·
--
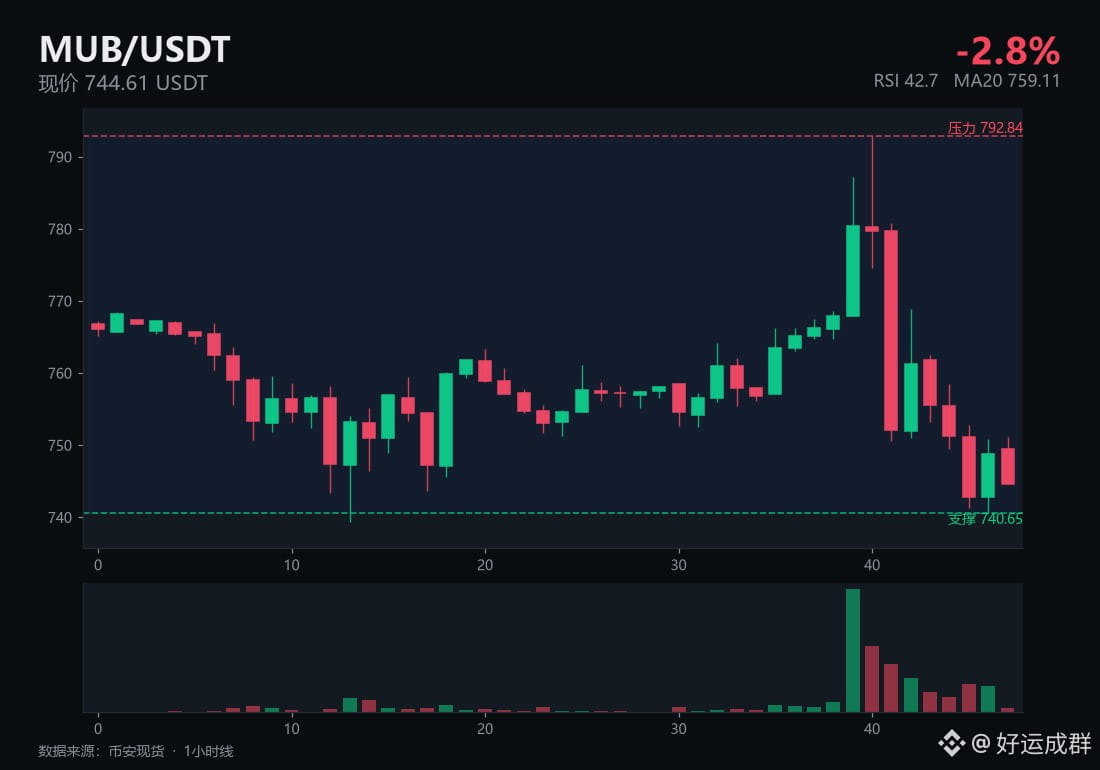
$MUB Today: -2.8%, grinding along with Bitcoin, current price 744.61.
At 792.84, who's selling? At 740.65, who's buying?
RSI 42.7—is this number telling us someone is panicking, or just pretending to?
If the market gaps up or down at tomorrow's open, can your position handle it?
What do you think?
When the market wears you down, it's easiest to see who's sticking to a plan.
#币圈 #MUB
$MUB Today: -2.8%, grinding along with Bitcoin, current price 744.61.
At 792.84, who's selling? At 740.65, who's buying?
RSI 42.7—is this number telling us someone is panicking, or just pretending to?
If the market gaps up or down at tomorrow's open, can your position handle it?
What do you think?
When the market wears you down, it's easiest to see who's sticking to a plan.
#币圈 #MUB
At 792.84, who's selling? At 740.65, who's buying?
RSI 42.7—is this number telling us someone is panicking, or just pretending to?
If the market gaps up or down at tomorrow's open, can your position handle it?
What do you think?
When the market wears you down, it's easiest to see who's sticking to a plan.
#币圈 #MUB
99

·
--
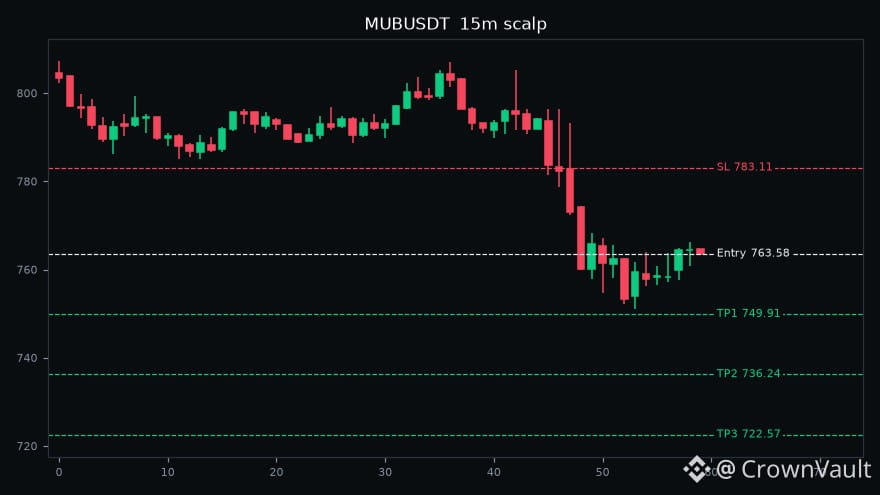
🔴 $MUB SHORT with clear levels (15m scalp)
Entry: 763.58
SL: 783.11
TP1: 749.91
TP2: 736.24
TP3: 722.57
EMA20 < EMA50, RSI 33
Scalp: quick in and out, don't hold if it stalls.
#Futures #MUB #BinanceSquare #Trading
⚠️ For education only. Trade at your own risk.
🔴 $MUB SHORT with clear levels (15m scalp)
Entry: 763.58
SL: 783.11
TP1: 749.91
TP2: 736.24
TP3: 722.57
EMA20 < EMA50, RSI 33
Scalp: quick in and out, don't hold if it stalls.
#Futures #MUB #BinanceSquare #Trading
⚠️ For education only. Trade at your own risk.
Entry: 763.58
SL: 783.11
TP1: 749.91
TP2: 736.24
TP3: 722.57
EMA20 < EMA50, RSI 33
Scalp: quick in and out, don't hold if it stalls.
#Futures #MUB #BinanceSquare #Trading
⚠️ For education only. Trade at your own risk.
5

·
--
🔥 It’s picking back up—$MUB is at it again: +3.01% in 24 hours, current price 774.04 USDT.
📊 Data snapshot
· Current price: 774.04 USDT
· 24h: +3.01%
· Range: 743.65 — 776.35
· Trading volume: 5002882.79 USDT
As usual, check the data before picking a side. Volume matters more than price, and the bulls and bears are battling it out right now.
Let’s talk in the comments 👇
#市场观察 #MUB #Binance
🔥 It’s picking back up—$MUB is at it again: +3.01% in 24 hours, current price 774.04 USDT.
📊 Data snapshot
· Current price: 774.04 USDT
· 24h: +3.01%
· Range: 743.65 — 776.35
· Trading volume: 5002882.79 USDT
As usual, check the data before picking a side. Volume matters more than price, and the bulls and bears are battling it out right now.
Let’s talk in the comments 👇
#市场观察 #MUB #Binance
📊 Data snapshot
· Current price: 774.04 USDT
· 24h: +3.01%
· Range: 743.65 — 776.35
· Trading volume: 5002882.79 USDT
As usual, check the data before picking a side. Volume matters more than price, and the bulls and bears are battling it out right now.
Let’s talk in the comments 👇
#市场观察 #MUB #Binance


·
--
Just thinking out loud: $MUB saw a sudden volume surge over the past 5 minutes, with trading volume 10.3 times the usual level and the price up 0.46%.
My approach is not to watch the first candle, but the second one after the volume spike: if it holds, that’s a real signal; if not, it was a one-off.
How do you usually handle a volume surge?
#MUB
Just thinking out loud: $MUB saw a sudden volume surge over the past 5 minutes, with trading volume 10.3 times the usual level and the price up 0.46%.
My approach is not to watch the first candle, but the second one after the volume spike: if it holds, that’s a real signal; if not, it was a one-off.
How do you usually handle a volume surge?
#MUB
My approach is not to watch the first candle, but the second one after the volume spike: if it holds, that’s a real signal; if not, it was a one-off.
How do you usually handle a volume surge?
#MUB
1

·
--
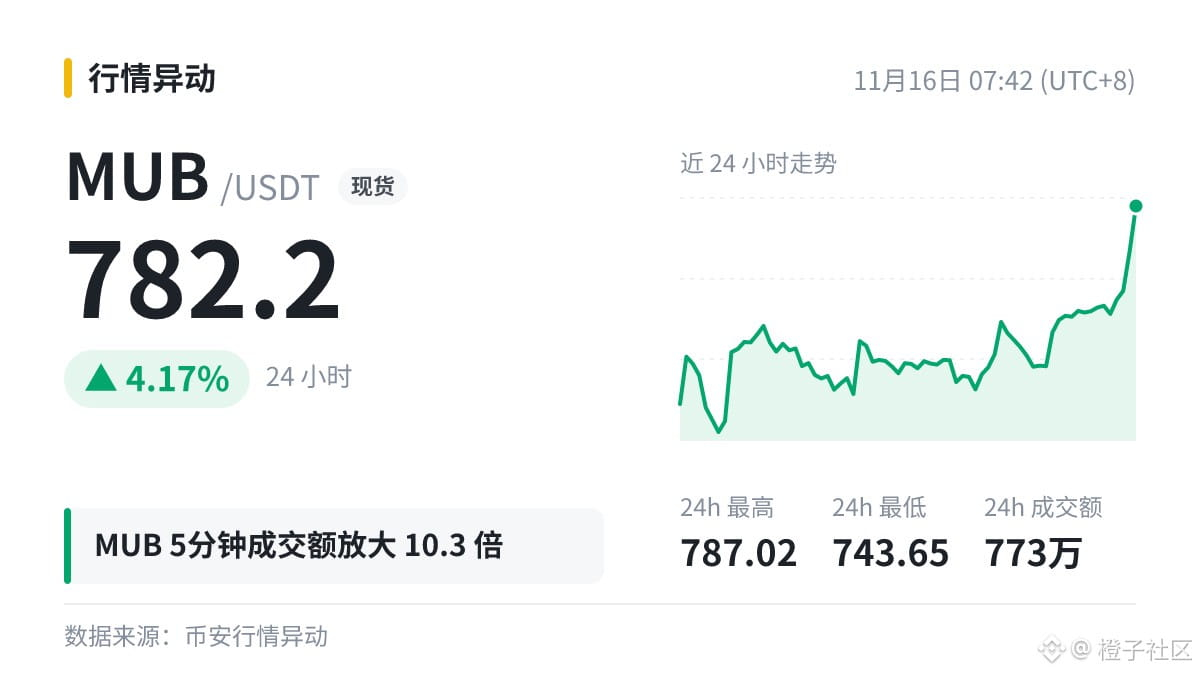
A real-time trading diary while slacking off: $MUB 5-minute volume ratio 10.3; trading looks like it’s been injected with adrenaline.
Price +0.46%, current price 782.2.
Volume more than ten times higher—the order book looks like a party.
A sharp rise doesn’t mean it’ll go far; a healthy structure matters more.
#MUB
A real-time trading diary while slacking off: $MUB 5-minute volume ratio 10.3; trading looks like it’s been injected with adrenaline.
Price +0.46%, current price 782.2.
Volume more than ten times higher—the order book looks like a party.
A sharp rise doesn’t mean it’ll go far; a healthy structure matters more.
#MUB
Price +0.46%, current price 782.2.
Volume more than ten times higher—the order book looks like a party.
A sharp rise doesn’t mean it’ll go far; a healthy structure matters more.
#MUB
17

·
--
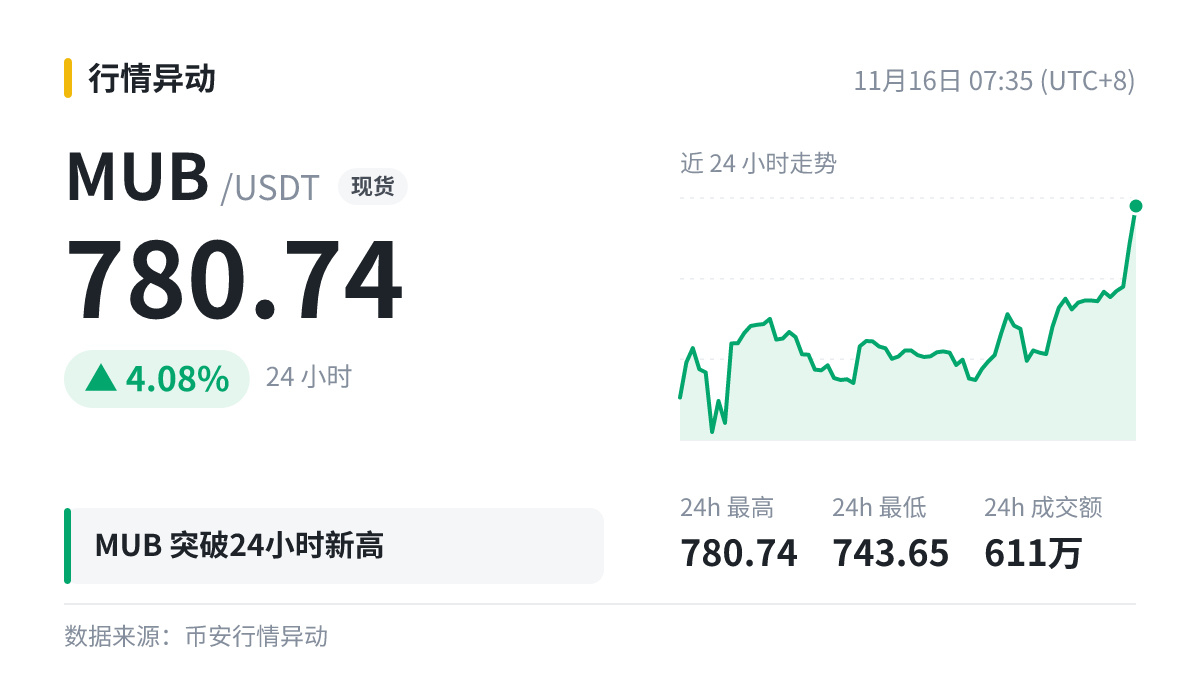
$MUB has reached a new 24-hour high: current price 780.74, previous high 768.64.
After the breakout, two key things to watch:
· Can the previous high of 768.64 turn from resistance into support (hold on a retest)?
· Was the breakout accompanied by high volume? Breakouts on low volume often turn out to be false breakouts.
Bullish or bearish?
#MUB
$MUB has reached a new 24-hour high: current price 780.74, previous high 768.64.
After the breakout, two key things to watch:
· Can the previous high of 768.64 turn from resistance into support (hold on a retest)?
· Was the breakout accompanied by high volume? Breakouts on low volume often turn out to be false breakouts.
Bullish or bearish?
#MUB
After the breakout, two key things to watch:
· Can the previous high of 768.64 turn from resistance into support (hold on a retest)?
· Was the breakout accompanied by high volume? Breakouts on low volume often turn out to be false breakouts.
Bullish or bearish?
#MUB
1
3
Log in to explore more content
Join global crypto users on Binance Square
⚡️ Get latest and useful information about crypto.
💬 Trusted by the world’s largest crypto exchange.
👍 Discover real insights from verified creators.
Email / Phone number
Trending Topics
1
#A Packed Week of Earnings and Data Tests Markets
63,388 views
399 Discussing
2
#AnthropicIPOTestsInvestorAppetiteForAI
118,739 views
1,372 Discussing
3
#BitcoinExtendsLosingStreakToSixWeeks
92,728 views
735 Discussing
4
#XRPFallsTo$0.89LowestSinceNovember2024
14,710 views
74 Discussing
5
#HuangReportedlyConsidersReturnToNvidia
125,154 views
1,242 Discussing
6
#SP500AndNasdaqFuturesHitQuarterlyLows
26,741 views
240 Discussing
7
#CaliforniaVotersBackProp42BarringNewCryptoTaxes
18,568 views
227 Discussing
8
#HKPlansDigitalAssetRegulatoryBillByYearEnd
16,833 views
165 Discussing
9
#MUFGSMFGMizuhoPlanYenBackedStablecoin
32,805 views
297 Discussing
10
#HKMAAndSwiftExploreTokenizedDepositInteroperability
2,619 views
19 Discussing