

#meme
meme
17.5M views
31,028 Discussing
Hot
Latest

·
--
$MEME.ETF — Latest Analysis
Uses a capsule model where trading fees fund purchases of the assets inside each capsule. Every trade carries a 1% fee, with 70% allocated to the capsule mechanism.
memeetf.fun +1
📊 Key things to watch:
• Trading volume 🔥
• Liquidity 💧
• Holder activity 👥
• Sustained buying pressure 📈
MEMEETF itself states that it is not an ETF and that the coin can be highly volatile, including the possibility of going to zero.
memeetf.fun
#MEMEETF #MEME #Crypto #MemeCoin #BinanceSquare
{etf_us}(MEME.ETF)
$MEME.ETF — Latest Analysis
Uses a capsule model where trading fees fund purchases of the assets inside each capsule. Every trade carries a 1% fee, with 70% allocated to the capsule mechanism.
memeetf.fun +1
📊 Key things to watch:
• Trading volume 🔥
• Liquidity 💧
• Holder activity 👥
• Sustained buying pressure 📈
MEMEETF itself states that it is not an ETF and that the coin can be highly volatile, including the possibility of going to zero.
memeetf.fun
#MEMEETF #MEME #Crypto #MemeCoin #BinanceSquare
Uses a capsule model where trading fees fund purchases of the assets inside each capsule. Every trade carries a 1% fee, with 70% allocated to the capsule mechanism.
memeetf.fun +1
📊 Key things to watch:
• Trading volume 🔥
• Liquidity 💧
• Holder activity 👥
• Sustained buying pressure 📈
MEMEETF itself states that it is not an ETF and that the coin can be highly volatile, including the possibility of going to zero.
memeetf.fun
#MEMEETF #MEME #Crypto #MemeCoin #BinanceSquare

MEMEETF+3.38%
75

·
--
Article
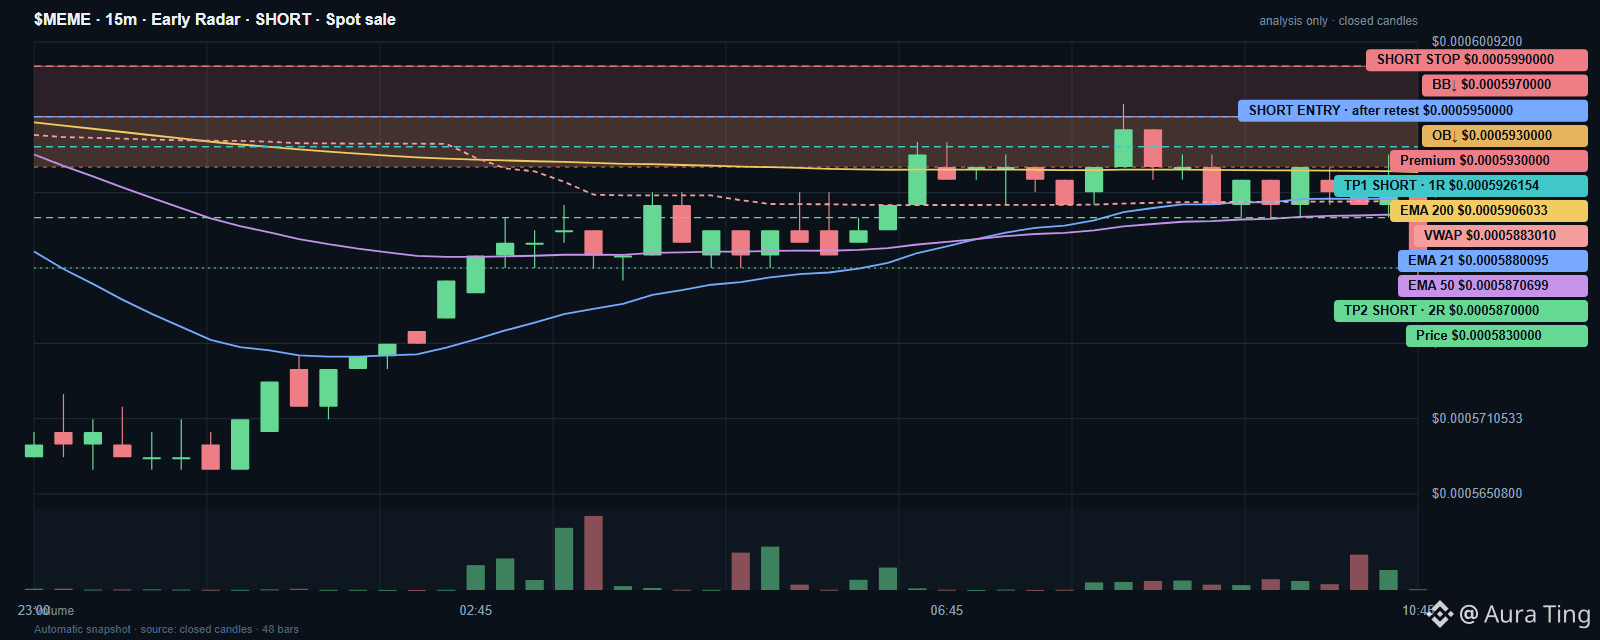
MEME · Early Radar⚡ SHORT scenario target reached.
close 0.000585 / level 0.000595 · volume 2.42× / reference 1.25×
📉 SHORT · $MEME (MEME/USDT) · downside scenario · context 15m, indicators 15m, trigger 5m
📍 Scenario: scenario is not confirmed yet.
📊 MARKET
💵 Price: $0.000585 · 1h -0.85% · 24h -2.98%.
💧 1h volume: $862,854.2205 · trades 3,151.
📊 M5 activity: volume $136,425.2744 · trades 438 · activity score 75/100.
📚 Order book ±1%: depth $49,501.729 · spread 0.17%.
🛡️ DATA CHECKS AND MARKET TYPE
✅ Data audit: passed · 5m/15m closed-candle checks are passed.
✅ Market quality: passed.
🛡️ Risk assessment: BLOCKED · mandatory checks did not pass ❗
🏷️ Context: Spot analytical hypothesis; no short position is opened automatically.
🧭 TECHNICAL PICTURE
🧭 Trigger state: scenario is not confirmed yet ❗
📉 Structural downside breakout recorded.
🔎 Trigger checks:
↩️ Retest: no ❗
🕯️ 5m bearish close: no ❗
💧 Volume filter: 7.02× median · not passed ❗
🔵 Trigger level: $0.000595.
🕯️ 5m candle context: confirmation is not available ❗
📉 SHORT context: price is below EMA50 and VWAP (15m).
📊 Indicators:
〽️ EMA 21: $0.00058801 · price below
〽️ EMA 50: $0.00058707 · price below
〽️ EMA 200: $0.0005906 · price below
⚖️ VWAP: $0.0005883 · price below
🌡️ RSI 14: 41.9
🧱 STRUCTURE AND PD ARRAY
📐 24h dealing range: $0.000561–$0.000616 · EQ $0.0005885 · price is in Discount.
🧱 bearish Breaker Block: $0.000595–$0.000599
🧱 bearish Order Block: $0.000591–$0.000595
💎 Premium PD Array: $0.000591–$0.000595 · observation ❗
💎 SHORT analysis uses the Premium half of the range; Discount alone does not strengthen a sell scenario. ❗
🎯 OBSERVATION PLAN
🔻 SHORT entry: a 5m close below $0.000595 · confirmation pending.
🛑 SHORT stop/invalidation: a 5m close above $0.000599.
🎯 SHORT TP1 · 1R: $0.00059262.
🏁 SHORT TP2 · 2R: $0.000587 · theoretical level.
🧪 STATISTICS
📈 Confirmed downside impulses in 24h: 1.
🎲 Probability: no calibrated percentage yet; retest outcomes are still insufficient.
⚠️ Analytical draft only, not a trading recommendation or order. Verify levels on the chart and account for your own risk ❗
#MEME #CryptoAnalysis #Earlyradar #BinanceSquare #UnrecognizedTag
MEME · Early Radar
⚡ SHORT scenario target reached.
close 0.000585 / level 0.000595 · volume 2.42× / reference 1.25×
📉 SHORT · $MEME (MEME/USDT) · downside scenario · context 15m, indicators 15m, trigger 5m
📍 Scenario: scenario is not confirmed yet.
📊 MARKET
💵 Price: $0.000585 · 1h -0.85% · 24h -2.98%.
💧 1h volume: $862,854.2205 · trades 3,151.
📊 M5 activity: volume $136,425.2744 · trades 438 · activity score 75/100.
📚 Order book ±1%: depth $49,501.729 · spread 0.17%.
🛡️ DATA CHECKS AND MARKET TYPE
✅ Data audit: passed · 5m/15m closed-candle checks are passed.
✅ Market quality: passed.
🛡️ Risk assessment: BLOCKED · mandatory checks did not pass ❗
🏷️ Context: Spot analytical hypothesis; no short position is opened automatically.
🧭 TECHNICAL PICTURE
🧭 Trigger state: scenario is not confirmed yet ❗
📉 Structural downside breakout recorded.
🔎 Trigger checks:
↩️ Retest: no ❗
🕯️ 5m bearish close: no ❗
💧 Volume filter: 7.02× median · not passed ❗
🔵 Trigger level: $0.000595.
🕯️ 5m candle context: confirmation is not available ❗
📉 SHORT context: price is below EMA50 and VWAP (15m).
📊 Indicators:
〽️ EMA 21: $0.00058801 · price below
〽️ EMA 50: $0.00058707 · price below
〽️ EMA 200: $0.0005906 · price below
⚖️ VWAP: $0.0005883 · price below
🌡️ RSI 14: 41.9
🧱 STRUCTURE AND PD ARRAY
📐 24h dealing range: $0.000561–$0.000616 · EQ $0.0005885 · price is in Discount.
🧱 bearish Breaker Block: $0.000595–$0.000599
🧱 bearish Order Block: $0.000591–$0.000595
💎 Premium PD Array: $0.000591–$0.000595 · observation ❗
💎 SHORT analysis uses the Premium half of the range; Discount alone does not strengthen a sell scenario. ❗
🎯 OBSERVATION PLAN
🔻 SHORT entry: a 5m close below $0.000595 · confirmation pending.
🛑 SHORT stop/invalidation: a 5m close above $0.000599.
🎯 SHORT TP1 · 1R: $0.00059262.
🏁 SHORT TP2 · 2R: $0.000587 · theoretical level.
🧪 STATISTICS
📈 Confirmed downside impulses in 24h: 1.
🎲 Probability: no calibrated percentage yet; retest outcomes are still insufficient.
⚠️ Analytical draft only, not a trading recommendation or order. Verify levels on the chart and account for your own risk ❗
#MEME #CryptoAnalysis #Earlyradar #BinanceSquare #UnrecognizedTag
close 0.000585 / level 0.000595 · volume 2.42× / reference 1.25×
📉 SHORT · $MEME (MEME/USDT) · downside scenario · context 15m, indicators 15m, trigger 5m
📍 Scenario: scenario is not confirmed yet.
📊 MARKET
💵 Price: $0.000585 · 1h -0.85% · 24h -2.98%.
💧 1h volume: $862,854.2205 · trades 3,151.
📊 M5 activity: volume $136,425.2744 · trades 438 · activity score 75/100.
📚 Order book ±1%: depth $49,501.729 · spread 0.17%.
🛡️ DATA CHECKS AND MARKET TYPE
✅ Data audit: passed · 5m/15m closed-candle checks are passed.
✅ Market quality: passed.
🛡️ Risk assessment: BLOCKED · mandatory checks did not pass ❗
🏷️ Context: Spot analytical hypothesis; no short position is opened automatically.
🧭 TECHNICAL PICTURE
🧭 Trigger state: scenario is not confirmed yet ❗
📉 Structural downside breakout recorded.
🔎 Trigger checks:
↩️ Retest: no ❗
🕯️ 5m bearish close: no ❗
💧 Volume filter: 7.02× median · not passed ❗
🔵 Trigger level: $0.000595.
🕯️ 5m candle context: confirmation is not available ❗
📉 SHORT context: price is below EMA50 and VWAP (15m).
📊 Indicators:
〽️ EMA 21: $0.00058801 · price below
〽️ EMA 50: $0.00058707 · price below
〽️ EMA 200: $0.0005906 · price below
⚖️ VWAP: $0.0005883 · price below
🌡️ RSI 14: 41.9
🧱 STRUCTURE AND PD ARRAY
📐 24h dealing range: $0.000561–$0.000616 · EQ $0.0005885 · price is in Discount.
🧱 bearish Breaker Block: $0.000595–$0.000599
🧱 bearish Order Block: $0.000591–$0.000595
💎 Premium PD Array: $0.000591–$0.000595 · observation ❗
💎 SHORT analysis uses the Premium half of the range; Discount alone does not strengthen a sell scenario. ❗
🎯 OBSERVATION PLAN
🔻 SHORT entry: a 5m close below $0.000595 · confirmation pending.
🛑 SHORT stop/invalidation: a 5m close above $0.000599.
🎯 SHORT TP1 · 1R: $0.00059262.
🏁 SHORT TP2 · 2R: $0.000587 · theoretical level.
🧪 STATISTICS
📈 Confirmed downside impulses in 24h: 1.
🎲 Probability: no calibrated percentage yet; retest outcomes are still insufficient.
⚠️ Analytical draft only, not a trading recommendation or order. Verify levels on the chart and account for your own risk ❗
#MEME #CryptoAnalysis #Earlyradar #BinanceSquare #UnrecognizedTag
14

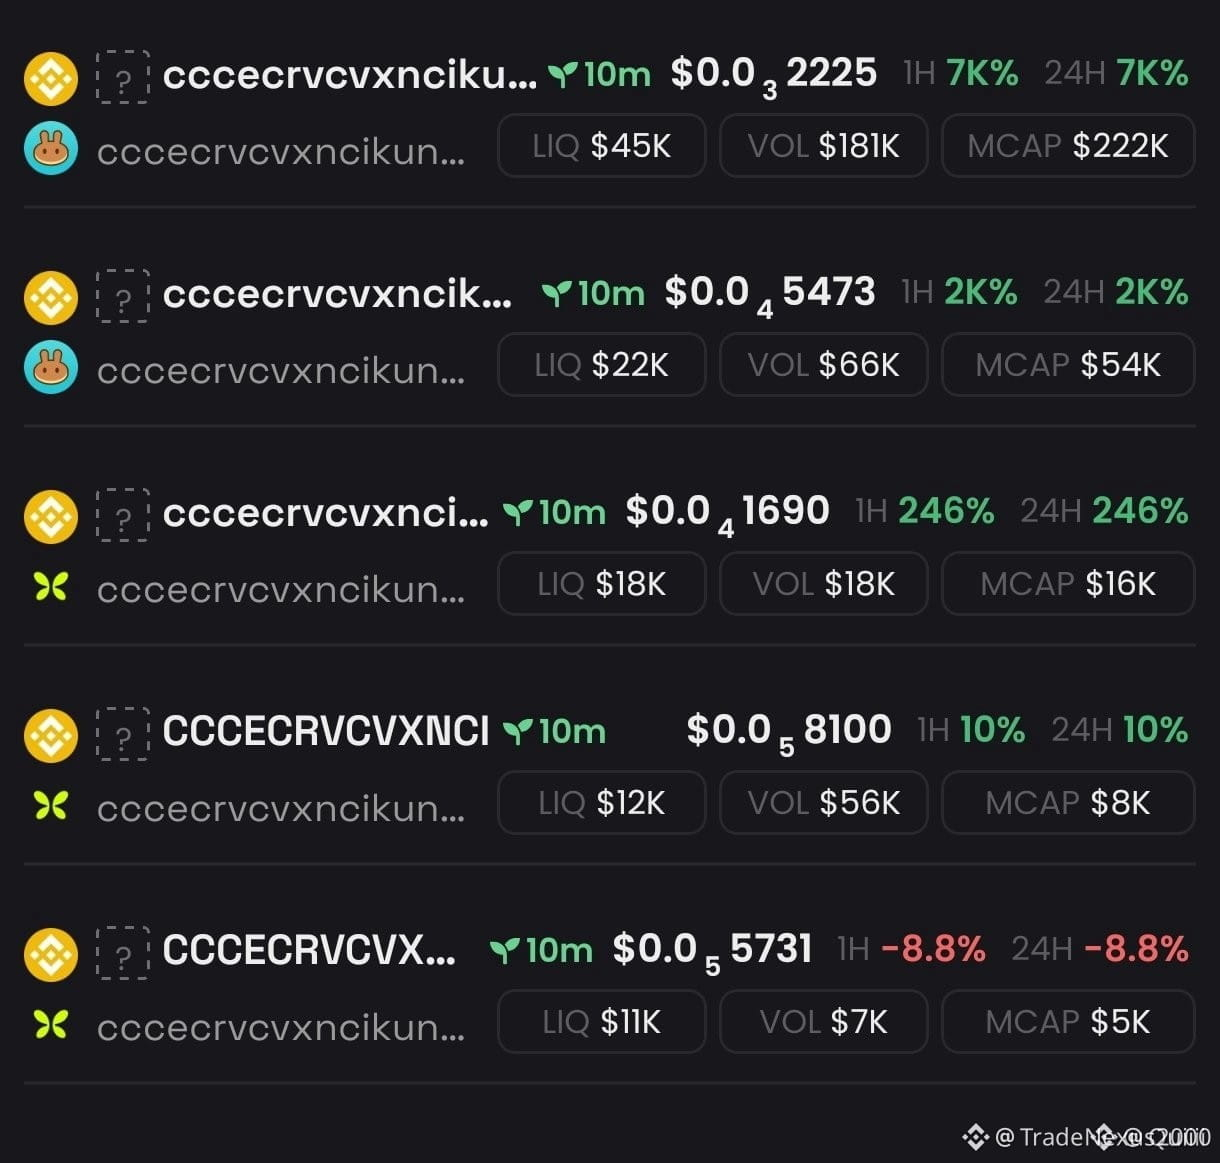
🚨 EXCHANGE SOCIAL CATALYSTS SPARK $MEME LIQUIDITY ROTATION ACROSS RETAIL MARKETS! 💥
When structural liquidity migrates into social-driven catalysts, we observe sharp efficiency gaps forming across speculative assets. 📊 Smart money tracks order flow absorption while retail chases superficial headlines, leaving structural order blocks vulnerable to sweeps. 🌊
Rather than gambling on emotion-driven spikes without defined invalidation levels, institutional discipline requires waiting for high-confluence discount zones and volume confirmation. 💡 Navigating this volatility demands strict risk management over FOMO entries. 💬 Are you hunting structural reclaims today or chasing the speculative meme order flow? 👇
⚠️ Not financial advice. Always manage your risk. 🛡️
🏷️ #MEME #MarketStructure #SmartMoney #Crypto #Trading
🎯 🦈
🚨 EXCHANGE SOCIAL CATALYSTS SPARK $MEME LIQUIDITY ROTATION ACROSS RETAIL MARKETS! 💥
When structural liquidity migrates into social-driven catalysts, we observe sharp efficiency gaps forming across speculative assets. 📊 Smart money tracks order flow absorption while retail chases superficial headlines, leaving structural order blocks vulnerable to sweeps. 🌊
Rather than gambling on emotion-driven spikes without defined invalidation levels, institutional discipline requires waiting for high-confluence discount zones and volume confirmation. 💡 Navigating this volatility demands strict risk management over FOMO entries. 💬 Are you hunting structural reclaims today or chasing the speculative meme order flow? 👇
⚠️ Not financial advice. Always manage your risk. 🛡️
🏷️ #MEME #MarketStructure #SmartMoney #Crypto #Trading
🎯 🦈
When structural liquidity migrates into social-driven catalysts, we observe sharp efficiency gaps forming across speculative assets. 📊 Smart money tracks order flow absorption while retail chases superficial headlines, leaving structural order blocks vulnerable to sweeps. 🌊
Rather than gambling on emotion-driven spikes without defined invalidation levels, institutional discipline requires waiting for high-confluence discount zones and volume confirmation. 💡 Navigating this volatility demands strict risk management over FOMO entries. 💬 Are you hunting structural reclaims today or chasing the speculative meme order flow? 👇
⚠️ Not financial advice. Always manage your risk. 🛡️
🏷️ #MEME #MarketStructure #SmartMoney #Crypto #Trading
🎯 🦈
30

·
--
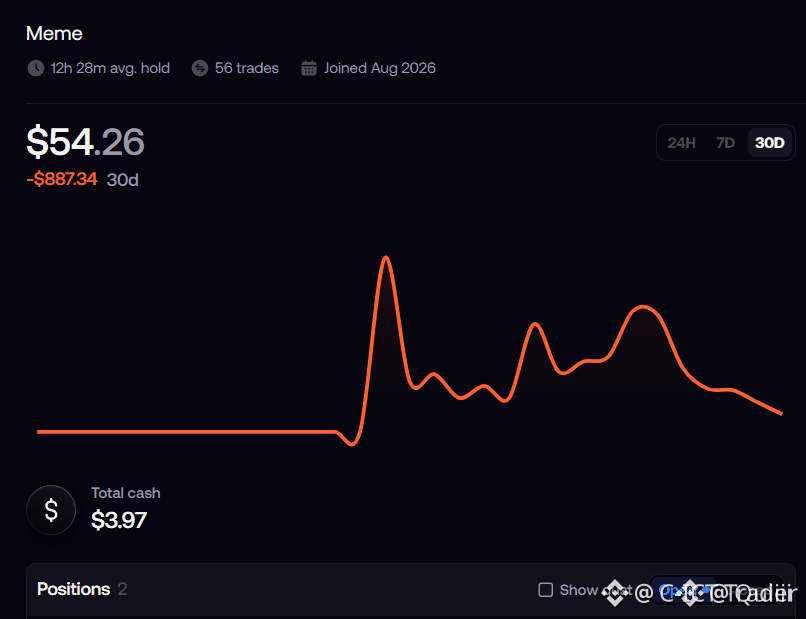
🚨 10 DAYS OF SIDEWAYS COMPRESSION IN $MEME : ACCUMULATION OR INSIDER LIQUIDITY TRAP? ⚡
Chasing speculative multi-bagger hype based on social engagement often leads straight into retail distribution zones. 📊 When a low-cap asset consolidates sideways for ten days, smart money is either quietly building institutional positions or preparing to sweep sell-side liquidity from impatient market participants. 🔍
True market structure requires confirmed breaks of high-timeframe order blocks, not whisper tips and viral commentary. ⚡ Without clear volume expansion and systematic reclamation of structural highs, sideways ranging remains a high-risk compression zone. 💡
Before allocating capital to rumors, always verify whether order flow shows genuine institutional bids or structural trap mechanics. 💬 Are you waiting for a verified structural breakout, or are you chasing speculative hype? 👇
⚠️ Not financial advice. Always manage your risk. 🛡️
🏷️ #MEME #MarketStructure #Crypto #Trading #Liquidity
🎯 🦈
🚨 10 DAYS OF SIDEWAYS COMPRESSION IN $MEME : ACCUMULATION OR INSIDER LIQUIDITY TRAP? ⚡
Chasing speculative multi-bagger hype based on social engagement often leads straight into retail distribution zones. 📊 When a low-cap asset consolidates sideways for ten days, smart money is either quietly building institutional positions or preparing to sweep sell-side liquidity from impatient market participants. 🔍
True market structure requires confirmed breaks of high-timeframe order blocks, not whisper tips and viral commentary. ⚡ Without clear volume expansion and systematic reclamation of structural highs, sideways ranging remains a high-risk compression zone. 💡
Before allocating capital to rumors, always verify whether order flow shows genuine institutional bids or structural trap mechanics. 💬 Are you waiting for a verified structural breakout, or are you chasing speculative hype? 👇
⚠️ Not financial advice. Always manage your risk. 🛡️
🏷️ #MEME #MarketStructure #Crypto #Trading #Liquidity
🎯 🦈
Chasing speculative multi-bagger hype based on social engagement often leads straight into retail distribution zones. 📊 When a low-cap asset consolidates sideways for ten days, smart money is either quietly building institutional positions or preparing to sweep sell-side liquidity from impatient market participants. 🔍
True market structure requires confirmed breaks of high-timeframe order blocks, not whisper tips and viral commentary. ⚡ Without clear volume expansion and systematic reclamation of structural highs, sideways ranging remains a high-risk compression zone. 💡
Before allocating capital to rumors, always verify whether order flow shows genuine institutional bids or structural trap mechanics. 💬 Are you waiting for a verified structural breakout, or are you chasing speculative hype? 👇
⚠️ Not financial advice. Always manage your risk. 🛡️
🏷️ #MEME #MarketStructure #Crypto #Trading #Liquidity
🎯 🦈

22

·
--
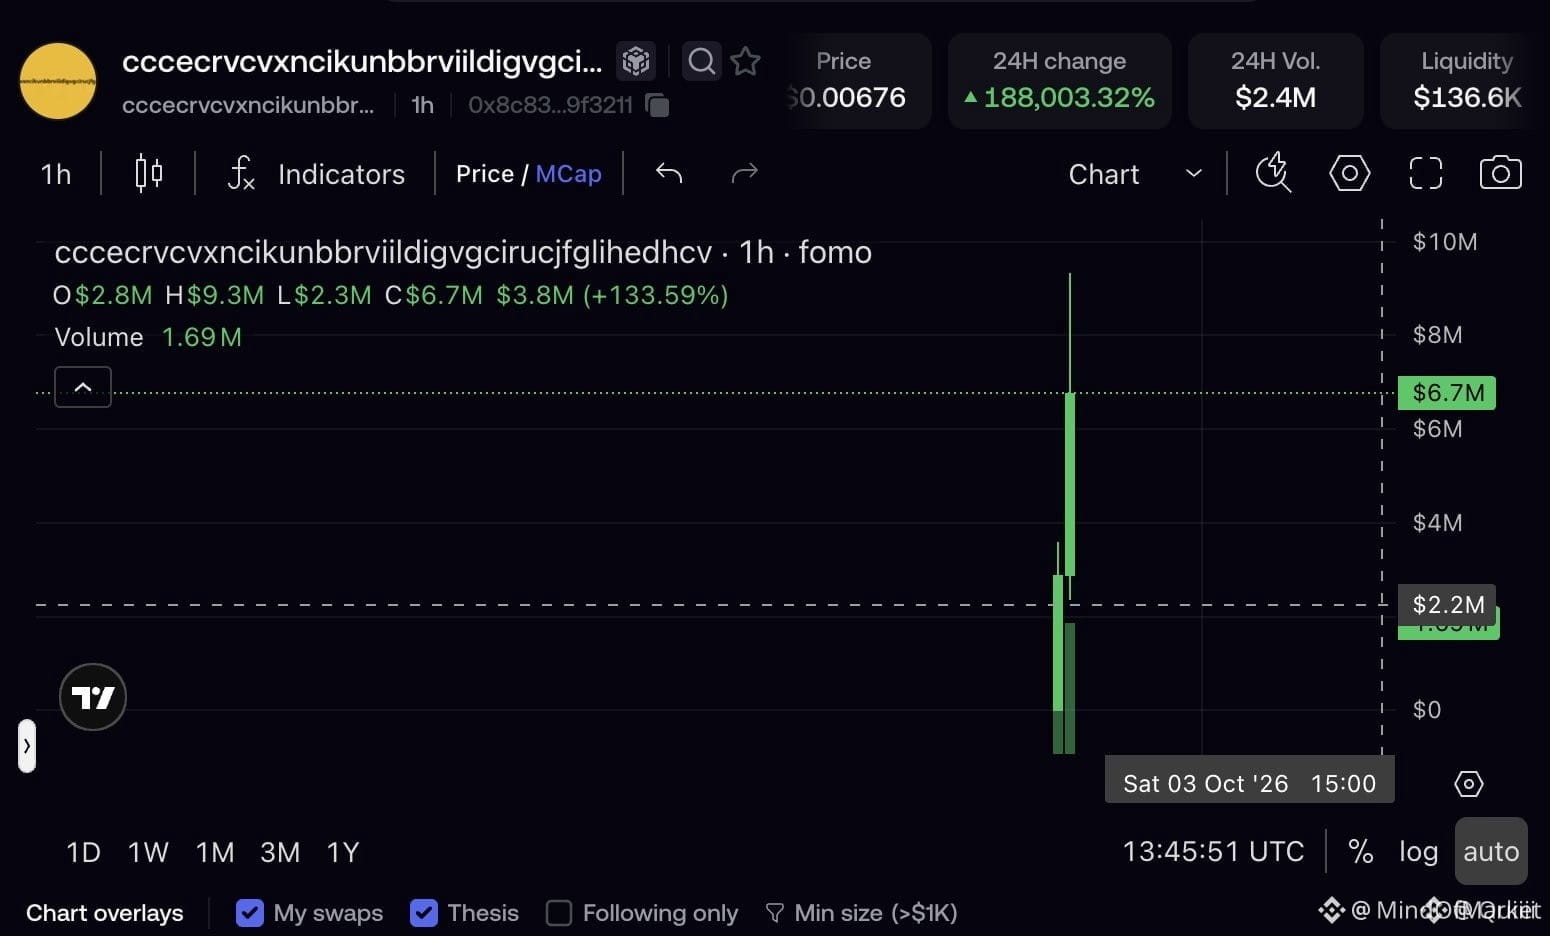
🚨 INSTITUTIONAL ANALYSIS: DO NOT BECOME EXIT LIQUIDITY ON THE $MEME PARABOLIC SPIKE 🦈
A 10M market cap sprint inside 60 minutes off a social signal represents textbook market architecture engineered for late-stage distribution. 🦈 Smart money capitalizes on rapid volume expansion to offload initial supply directly into open retail order books.
Chasing price expansion at these vertical extremes offers zero structural confluence and abysmal risk-adjusted parameters. 💡 Without an established demand zone or fair value gap retest, purchasing at these peaks renders your capital vulnerable to deep liquidation runs.
Protect your portfolio by allowing market structure to stabilize before seeking confirmation. 💬 Are you standing aside to preserve capital, or waiting for a key structural retest? 👇
⚠️ Not financial advice. Always manage your risk. 🛡️
🏷️ #MEME #Liquidity #MarketStructure #Crypto
🎯 🦈
🚨 INSTITUTIONAL ANALYSIS: DO NOT BECOME EXIT LIQUIDITY ON THE $MEME PARABOLIC SPIKE 🦈
A 10M market cap sprint inside 60 minutes off a social signal represents textbook market architecture engineered for late-stage distribution. 🦈 Smart money capitalizes on rapid volume expansion to offload initial supply directly into open retail order books.
Chasing price expansion at these vertical extremes offers zero structural confluence and abysmal risk-adjusted parameters. 💡 Without an established demand zone or fair value gap retest, purchasing at these peaks renders your capital vulnerable to deep liquidation runs.
Protect your portfolio by allowing market structure to stabilize before seeking confirmation. 💬 Are you standing aside to preserve capital, or waiting for a key structural retest? 👇
⚠️ Not financial advice. Always manage your risk. 🛡️
🏷️ #MEME #Liquidity #MarketStructure #Crypto
🎯 🦈
A 10M market cap sprint inside 60 minutes off a social signal represents textbook market architecture engineered for late-stage distribution. 🦈 Smart money capitalizes on rapid volume expansion to offload initial supply directly into open retail order books.
Chasing price expansion at these vertical extremes offers zero structural confluence and abysmal risk-adjusted parameters. 💡 Without an established demand zone or fair value gap retest, purchasing at these peaks renders your capital vulnerable to deep liquidation runs.
Protect your portfolio by allowing market structure to stabilize before seeking confirmation. 💬 Are you standing aside to preserve capital, or waiting for a key structural retest? 👇
⚠️ Not financial advice. Always manage your risk. 🛡️
🏷️ #MEME #Liquidity #MarketStructure #Crypto
🎯 🦈
30

$MEME: a love story 💀
Me: "I'm only putting in $20, just for fun."
Also me, 3 hours later: refreshing the chart every 11 seconds 👀
Me: "I'm a long-term holder now."
The chart: dips 4%
Me: "I'm a very short-term holder now."
Doing "research" on $MEME means scrolling X until someone with a frog avatar says "it's early." 🐸
Real ones know the rules:
🚀 Green candle = "I always believed in this"
📉 Red candle = "It's a long-term play"
🛌 Sleep = optional
💎 Diamond hands = mostly just forgetting the app password
We're not here for a spreadsheet. We're here for the vibes, the memes, and the group chat that will never let us sell. 😂
Tag the friend who said "just $20." 👇
⚠️ Not financial advice. Meme coins are volatile, so only play with what you can afford to lose.
#MEME #Memecoins__ #Crypto #CryptoHumor #WAGM
$MEME: a love story 💀
Me: "I'm only putting in $20, just for fun."
Also me, 3 hours later: refreshing the chart every 11 seconds 👀
Me: "I'm a long-term holder now."
The chart: dips 4%
Me: "I'm a very short-term holder now."
Doing "research" on $MEME means scrolling X until someone with a frog avatar says "it's early." 🐸
Real ones know the rules:
🚀 Green candle = "I always believed in this"
📉 Red candle = "It's a long-term play"
🛌 Sleep = optional
💎 Diamond hands = mostly just forgetting the app password
We're not here for a spreadsheet. We're here for the vibes, the memes, and the group chat that will never let us sell. 😂
Tag the friend who said "just $20." 👇
⚠️ Not financial advice. Meme coins are volatile, so only play with what you can afford to lose.
#MEME #Memecoins__ #Crypto #CryptoHumor #WAGM
Me: "I'm only putting in $20, just for fun."
Also me, 3 hours later: refreshing the chart every 11 seconds 👀
Me: "I'm a long-term holder now."
The chart: dips 4%
Me: "I'm a very short-term holder now."
Doing "research" on $MEME means scrolling X until someone with a frog avatar says "it's early." 🐸
Real ones know the rules:
🚀 Green candle = "I always believed in this"
📉 Red candle = "It's a long-term play"
🛌 Sleep = optional
💎 Diamond hands = mostly just forgetting the app password
We're not here for a spreadsheet. We're here for the vibes, the memes, and the group chat that will never let us sell. 😂
Tag the friend who said "just $20." 👇
⚠️ Not financial advice. Meme coins are volatile, so only play with what you can afford to lose.
#MEME #Memecoins__ #Crypto #CryptoHumor #WAGM
1
329

Pepe ($PEPE ) Market Update: Golden Cross Confirmed, But $0.0000050 Is the Make-or-Break Level
$PEPE is trading near $0.0000047**, up **7.31%** in 24 hours, after printing a **golden cross on September 28**—the first since spring—where the 50-day MA crossed above the 200-day MA . Short liquidations of **$670,000 in a single hour fueled the push .
Whale Accumulation: Two whale wallets accumulated over $3.5 million in PEPE** recently, with one address pulling **213.4 billion PEPE** from the market . Futures open interest stabilized above **$320 million, and funding rates remain positive at 0.0109%, signaling steady long demand .
Key Levels: $0.0000050** is the critical trigger—a confirmed breakout targets **$0.00000567 and $0.00000650** (Fibonacci extensions) . Support sits at **$0.00000370–$0.00000380, where the moving averages converge .
Binance Trade Setup: A cautious long if $PEPE reclaims $0.0000050** with volume, targeting **$0.0000057–$0.0000065**, stop below **$0.0000040. The golden cross signals a structural shift, but derivatives volume running 3x spot means leverage risk cuts both ways . DYOR.
#PEPE #MEME #analises #Binance
{spot}(PEPEUSDT)
Pepe ($PEPE ) Market Update: Golden Cross Confirmed, But $0.0000050 Is the Make-or-Break Level
$PEPE is trading near $0.0000047**, up **7.31%** in 24 hours, after printing a **golden cross on September 28**—the first since spring—where the 50-day MA crossed above the 200-day MA . Short liquidations of **$670,000 in a single hour fueled the push .
Whale Accumulation: Two whale wallets accumulated over $3.5 million in PEPE** recently, with one address pulling **213.4 billion PEPE** from the market . Futures open interest stabilized above **$320 million, and funding rates remain positive at 0.0109%, signaling steady long demand .
Key Levels: $0.0000050** is the critical trigger—a confirmed breakout targets **$0.00000567 and $0.00000650** (Fibonacci extensions) . Support sits at **$0.00000370–$0.00000380, where the moving averages converge .
Binance Trade Setup: A cautious long if $PEPE reclaims $0.0000050** with volume, targeting **$0.0000057–$0.0000065**, stop below **$0.0000040. The golden cross signals a structural shift, but derivatives volume running 3x spot means leverage risk cuts both ways . DYOR.
#PEPE #MEME #analises #Binance
$PEPE is trading near $0.0000047**, up **7.31%** in 24 hours, after printing a **golden cross on September 28**—the first since spring—where the 50-day MA crossed above the 200-day MA . Short liquidations of **$670,000 in a single hour fueled the push .
Whale Accumulation: Two whale wallets accumulated over $3.5 million in PEPE** recently, with one address pulling **213.4 billion PEPE** from the market . Futures open interest stabilized above **$320 million, and funding rates remain positive at 0.0109%, signaling steady long demand .
Key Levels: $0.0000050** is the critical trigger—a confirmed breakout targets **$0.00000567 and $0.00000650** (Fibonacci extensions) . Support sits at **$0.00000370–$0.00000380, where the moving averages converge .
Binance Trade Setup: A cautious long if $PEPE reclaims $0.0000050** with volume, targeting **$0.0000057–$0.0000065**, stop below **$0.0000040. The golden cross signals a structural shift, but derivatives volume running 3x spot means leverage risk cuts both ways . DYOR.
#PEPE #MEME #analises #Binance
63

🚨 RANDOM SOCIAL MEDIA HYPE IGNITES ANOTHER EXPLOSIVE $MEME RUN! ⚡
The market obsession with meme tokens has reached pure madness, where even a single cryptic post sends speculative volume skyrocketing across new micro-cap listings. Smart money is watching retail chase every shiny artifact, creating wild volatility spikes and sudden liquidity rotations. 🌊
Separating noise from high-conviction momentum is crucial when mania reaches this intensity. While weak hands chase blind momentum, disciplined traders wait for clear structure flips and sustained volume before committing capital. 🔍
💬 Which meme setup are you scanning right now to catch the next high-probability breakout? 👇
⚠️ Not financial advice. Always manage your risk. 🛡️
🏷️ #MEME #MemeCoins #Altcoins #Crypto
🔥 💎
🚨 RANDOM SOCIAL MEDIA HYPE IGNITES ANOTHER EXPLOSIVE $MEME RUN! ⚡
The market obsession with meme tokens has reached pure madness, where even a single cryptic post sends speculative volume skyrocketing across new micro-cap listings. Smart money is watching retail chase every shiny artifact, creating wild volatility spikes and sudden liquidity rotations. 🌊
Separating noise from high-conviction momentum is crucial when mania reaches this intensity. While weak hands chase blind momentum, disciplined traders wait for clear structure flips and sustained volume before committing capital. 🔍
💬 Which meme setup are you scanning right now to catch the next high-probability breakout? 👇
⚠️ Not financial advice. Always manage your risk. 🛡️
🏷️ #MEME #MemeCoins #Altcoins #Crypto
🔥 💎
The market obsession with meme tokens has reached pure madness, where even a single cryptic post sends speculative volume skyrocketing across new micro-cap listings. Smart money is watching retail chase every shiny artifact, creating wild volatility spikes and sudden liquidity rotations. 🌊
Separating noise from high-conviction momentum is crucial when mania reaches this intensity. While weak hands chase blind momentum, disciplined traders wait for clear structure flips and sustained volume before committing capital. 🔍
💬 Which meme setup are you scanning right now to catch the next high-probability breakout? 👇
⚠️ Not financial advice. Always manage your risk. 🛡️
🏷️ #MEME #MemeCoins #Altcoins #Crypto
🔥 💎
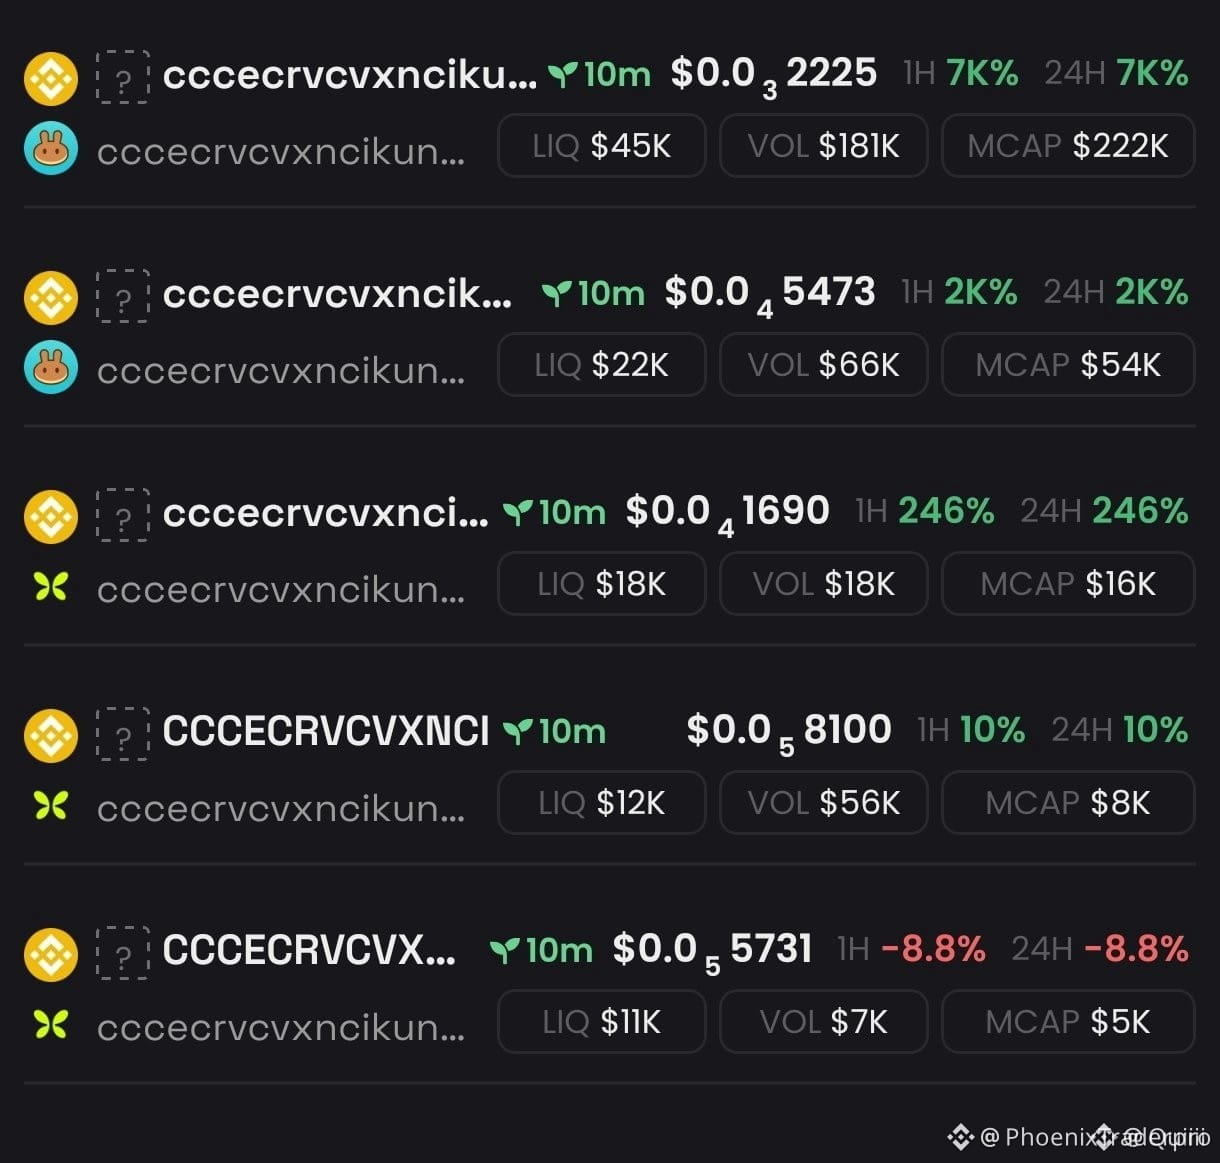
159
Dogwifhat ($WIF ) Market Update: Momentum Stalls at $0.25 Pivot, $0.26 Is the Line That Decides Everything
$WIF is trading near $0.25**, sitting dead on its daily pivot after a strong September recovery from August lows of **$0.13. The moving average stack is textbook bullish — 7-day at $0.25, 20-day at $0.22, 50-day at $0.20, 200-day at $0.18 — all nested below price in ascending order.
The Warning Signal: The MACD histogram has flatlined at zero. That's not a mild slowdown — it's a momentum engine that has completely stalled mid-flight. Open interest dropped 4.88% in 24 hours to $17M while price barely moved, signaling participants are quietly closing longs into strength. Binance spot volume at just **$4.16M** is thin — nowhere near the kind of volume that breaks resistance levels.
Key Levels: $0.26** is the immediate wall. A confirmed daily close above **$0.26 with volume exceeding $7M** opens **$0.27–$0.28**. A rejection risks a fade back toward **$0.22. The measured inverse head-and-shoulders target sits near $0.43 if the breakout holds.
Binance Trade Setup: A cautious long only on a confirmed break above $0.26** with volume, targeting **$0.28, stop below **$0.24**. If $0.25 rejects again, stay flat — the crowd is already long (69.3% top traders), and thin volume favors a downward resolution. DYOR — meme volatility cuts both ways.
#WIF #MEME #analises #Binance
{spot}(WIFUSDT)
Dogwifhat ($WIF ) Market Update: Momentum Stalls at $0.25 Pivot, $0.26 Is the Line That Decides Everything
$WIF is trading near $0.25**, sitting dead on its daily pivot after a strong September recovery from August lows of **$0.13. The moving average stack is textbook bullish — 7-day at $0.25, 20-day at $0.22, 50-day at $0.20, 200-day at $0.18 — all nested below price in ascending order.
The Warning Signal: The MACD histogram has flatlined at zero. That's not a mild slowdown — it's a momentum engine that has completely stalled mid-flight. Open interest dropped 4.88% in 24 hours to $17M while price barely moved, signaling participants are quietly closing longs into strength. Binance spot volume at just **$4.16M** is thin — nowhere near the kind of volume that breaks resistance levels.
Key Levels: $0.26** is the immediate wall. A confirmed daily close above **$0.26 with volume exceeding $7M** opens **$0.27–$0.28**. A rejection risks a fade back toward **$0.22. The measured inverse head-and-shoulders target sits near $0.43 if the breakout holds.
Binance Trade Setup: A cautious long only on a confirmed break above $0.26** with volume, targeting **$0.28, stop below **$0.24**. If $0.25 rejects again, stay flat — the crowd is already long (69.3% top traders), and thin volume favors a downward resolution. DYOR — meme volatility cuts both ways.
#WIF #MEME #analises #Binance
$WIF is trading near $0.25**, sitting dead on its daily pivot after a strong September recovery from August lows of **$0.13. The moving average stack is textbook bullish — 7-day at $0.25, 20-day at $0.22, 50-day at $0.20, 200-day at $0.18 — all nested below price in ascending order.
The Warning Signal: The MACD histogram has flatlined at zero. That's not a mild slowdown — it's a momentum engine that has completely stalled mid-flight. Open interest dropped 4.88% in 24 hours to $17M while price barely moved, signaling participants are quietly closing longs into strength. Binance spot volume at just **$4.16M** is thin — nowhere near the kind of volume that breaks resistance levels.
Key Levels: $0.26** is the immediate wall. A confirmed daily close above **$0.26 with volume exceeding $7M** opens **$0.27–$0.28**. A rejection risks a fade back toward **$0.22. The measured inverse head-and-shoulders target sits near $0.43 if the breakout holds.
Binance Trade Setup: A cautious long only on a confirmed break above $0.26** with volume, targeting **$0.28, stop below **$0.24**. If $0.25 rejects again, stay flat — the crowd is already long (69.3% top traders), and thin volume favors a downward resolution. DYOR — meme volatility cuts both ways.
#WIF #MEME #analises #Binance
64
Shiba Inu ($SHIB ) Market Update: Third Straight Monthly Gain, But $0.000006 Is the Wall
$SHIB is trading near $0.0000058**, coming off its **best September in five years** with a **13.5% gain**—the third consecutive monthly win. The token rallied to **$0.00000625 before pulling back, and now sits at a critical juncture.
The Bullish Setup: SHIB has broken above its weekly descending channel for the first time in 2026, and RSI at 55–57 remains neutral with room to run. October historically delivers 80% positive returns for SHIB—a seasonal tailwind bulls are watching closely.
The Reality Check: Burn activity is symbolic at best. A recent 68 million SHIB burn sounds large but represents just 0.00001% of supply—worth roughly $395. More concerning, Shibarium is running empty, processing only 1,680 daily transactions versus 4.69 million in August 2025—a 99.96% collapse.
Key Levels: $0.0000060–$0.00000663 is the resistance wall. A weekly close above $0.00000663** opens **$0.00000844 and potentially $0.000010**. Support sits at **$0.00000496—break that and the recovery structure fails.
Binance Trade Setup: The weekly breakout is real, but volume is thin and Shibarium is a ghost town. A cautious long only if $SHIB reclaims $0.0000060** with volume, targeting **$0.00000663, stop below $0.0000053. DYOR — meme volatility is extreme.
#Shibalnu #MEME #analises #Binance
{spot}(SHIBUSDT)
Shiba Inu ($SHIB ) Market Update: Third Straight Monthly Gain, But $0.000006 Is the Wall
$SHIB is trading near $0.0000058**, coming off its **best September in five years** with a **13.5% gain**—the third consecutive monthly win. The token rallied to **$0.00000625 before pulling back, and now sits at a critical juncture.
The Bullish Setup: SHIB has broken above its weekly descending channel for the first time in 2026, and RSI at 55–57 remains neutral with room to run. October historically delivers 80% positive returns for SHIB—a seasonal tailwind bulls are watching closely.
The Reality Check: Burn activity is symbolic at best. A recent 68 million SHIB burn sounds large but represents just 0.00001% of supply—worth roughly $395. More concerning, Shibarium is running empty, processing only 1,680 daily transactions versus 4.69 million in August 2025—a 99.96% collapse.
Key Levels: $0.0000060–$0.00000663 is the resistance wall. A weekly close above $0.00000663** opens **$0.00000844 and potentially $0.000010**. Support sits at **$0.00000496—break that and the recovery structure fails.
Binance Trade Setup: The weekly breakout is real, but volume is thin and Shibarium is a ghost town. A cautious long only if $SHIB reclaims $0.0000060** with volume, targeting **$0.00000663, stop below $0.0000053. DYOR — meme volatility is extreme.
#Shibalnu #MEME #analises #Binance
$SHIB is trading near $0.0000058**, coming off its **best September in five years** with a **13.5% gain**—the third consecutive monthly win. The token rallied to **$0.00000625 before pulling back, and now sits at a critical juncture.
The Bullish Setup: SHIB has broken above its weekly descending channel for the first time in 2026, and RSI at 55–57 remains neutral with room to run. October historically delivers 80% positive returns for SHIB—a seasonal tailwind bulls are watching closely.
The Reality Check: Burn activity is symbolic at best. A recent 68 million SHIB burn sounds large but represents just 0.00001% of supply—worth roughly $395. More concerning, Shibarium is running empty, processing only 1,680 daily transactions versus 4.69 million in August 2025—a 99.96% collapse.
Key Levels: $0.0000060–$0.00000663 is the resistance wall. A weekly close above $0.00000663** opens **$0.00000844 and potentially $0.000010**. Support sits at **$0.00000496—break that and the recovery structure fails.
Binance Trade Setup: The weekly breakout is real, but volume is thin and Shibarium is a ghost town. A cautious long only if $SHIB reclaims $0.0000060** with volume, targeting **$0.00000663, stop below $0.0000053. DYOR — meme volatility is extreme.
#Shibalnu #MEME #analises #Binance
46

🚨 SMART MONEY IS TRACKING EARLY MEMECOIN LIQUIDITY IN $MEME ROTATION! 🔍
Institutional order flow is shifting rapidly into early-stage speculative assets, where retail momentum meets smart money liquidity pools. 📊 Tracking fast-moving meme tokens requires real-time visibility before structural order blocks mature into retail distribution zones. 🌊
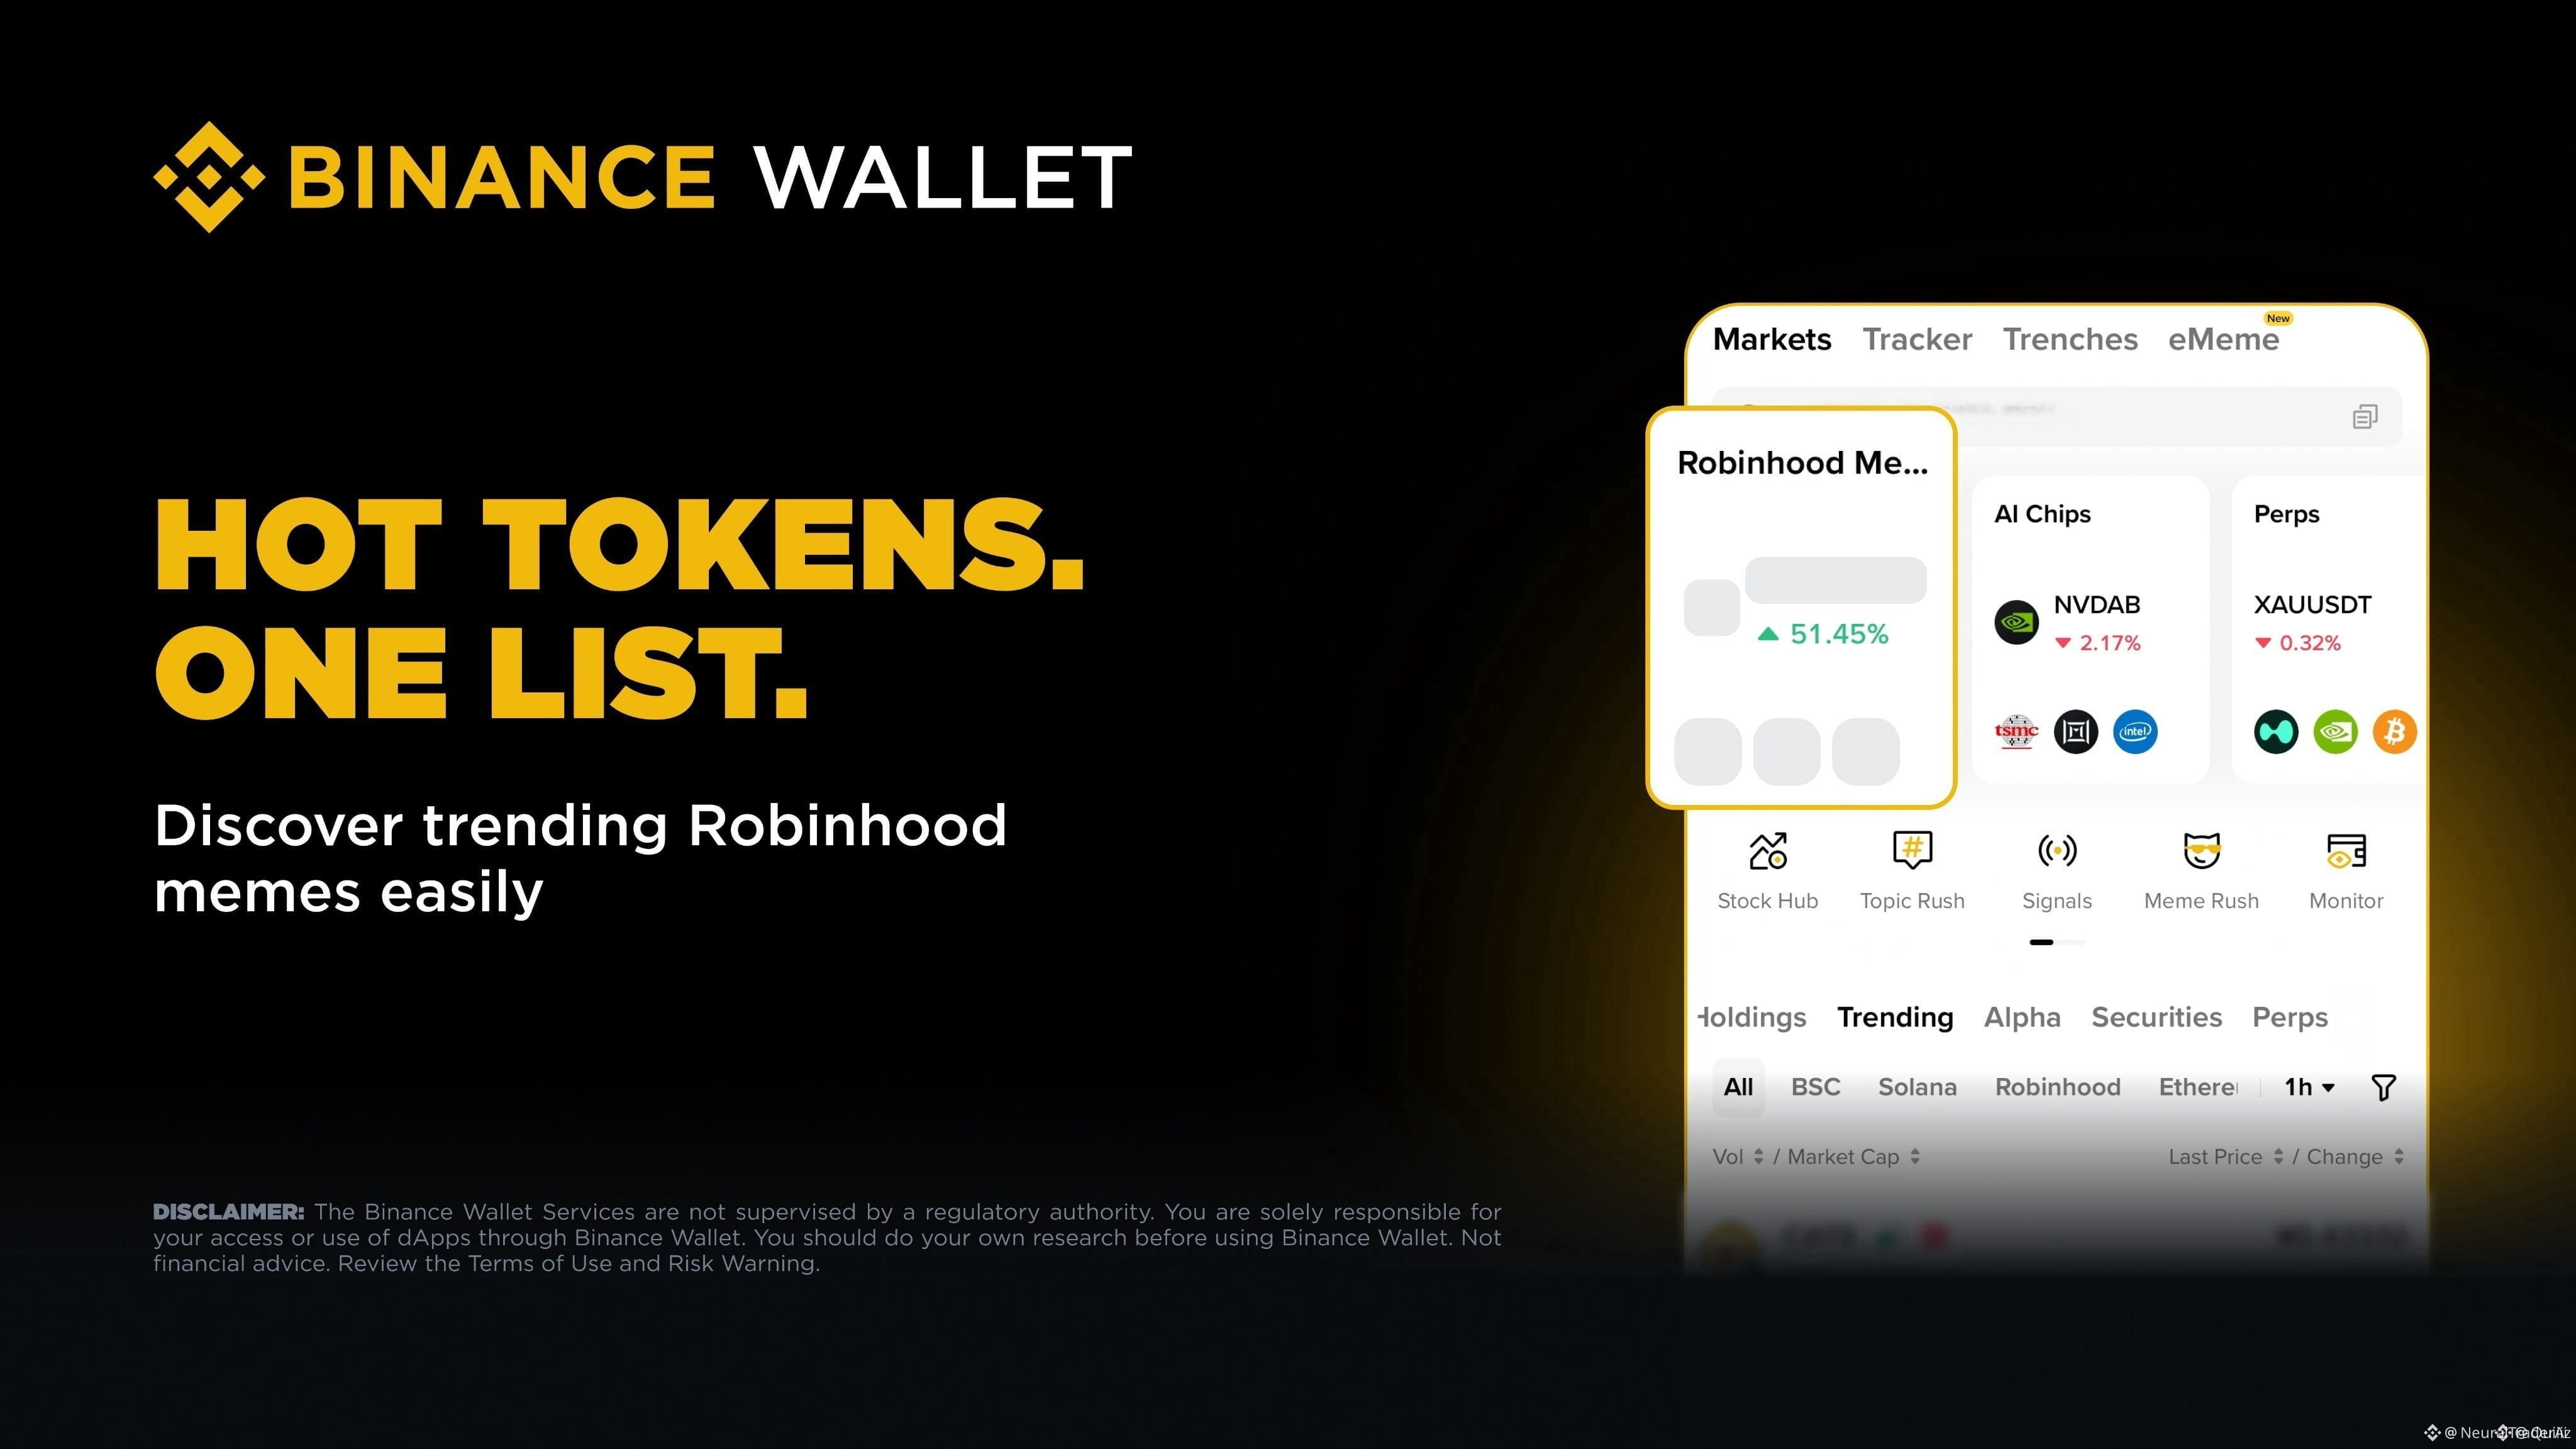
By monitoring volume expansion directly through your integrated Web3 wallet hub, you can spot structural accumulation before momentum accelerates. 💡 Positioning where smart money sweeps liquidity allows you to navigate high-volatility shifts with sharp risk parameters. 🤔 Which meme asset are you tracking for the next structural breakout? 👇
⚠️ Not financial advice. Always manage your risk. 🛡️
🏷️ #MEME #Memecoins #SmartMoney #Crypto
🎯 🦈
🚨 SMART MONEY IS TRACKING EARLY MEMECOIN LIQUIDITY IN $MEME ROTATION! 🔍
Institutional order flow is shifting rapidly into early-stage speculative assets, where retail momentum meets smart money liquidity pools. 📊 Tracking fast-moving meme tokens requires real-time visibility before structural order blocks mature into retail distribution zones. 🌊
By monitoring volume expansion directly through your integrated Web3 wallet hub, you can spot structural accumulation before momentum accelerates. 💡 Positioning where smart money sweeps liquidity allows you to navigate high-volatility shifts with sharp risk parameters. 🤔 Which meme asset are you tracking for the next structural breakout? 👇
⚠️ Not financial advice. Always manage your risk. 🛡️
🏷️ #MEME #Memecoins #SmartMoney #Crypto
🎯 🦈
Institutional order flow is shifting rapidly into early-stage speculative assets, where retail momentum meets smart money liquidity pools. 📊 Tracking fast-moving meme tokens requires real-time visibility before structural order blocks mature into retail distribution zones. 🌊
By monitoring volume expansion directly through your integrated Web3 wallet hub, you can spot structural accumulation before momentum accelerates. 💡 Positioning where smart money sweeps liquidity allows you to navigate high-volatility shifts with sharp risk parameters. 🤔 Which meme asset are you tracking for the next structural breakout? 👇
⚠️ Not financial advice. Always manage your risk. 🛡️
🏷️ #MEME #Memecoins #SmartMoney #Crypto
🎯 🦈
150
💥 MEME SEASON IS OFFICIALLY LIVE AS CAPITAL ROTATES OUT OF CONSOLIDATION INTO $MEME ! 🚀
Smart money is shifting aggressive size away from slow-moving majors to front-run high-volatility meme setups. 📊 Volume profiles across top meme sector charts show accumulation ranges breaking out simultaneously as momentum buyers step in to absorb sell-side resistance. ⚡
When liquidity sweeps start cascading across speculative assets, upside momentum tends to expand faster than most late retail bids can track. 🔍 Tracking order flow and capital velocity right now is critical to catching these early impulse waves before retail chasing kicks in. 💬 Which meme setup are you bidding for this rotation wave? 👇
⚠️ Not financial advice. Always manage your risk. 🛡️
🏷️ #MEME #MemeCoins #Crypto #AltcoinSeason #Breakout
🔥 💎
💥 MEME SEASON IS OFFICIALLY LIVE AS CAPITAL ROTATES OUT OF CONSOLIDATION INTO $MEME ! 🚀
Smart money is shifting aggressive size away from slow-moving majors to front-run high-volatility meme setups. 📊 Volume profiles across top meme sector charts show accumulation ranges breaking out simultaneously as momentum buyers step in to absorb sell-side resistance. ⚡
When liquidity sweeps start cascading across speculative assets, upside momentum tends to expand faster than most late retail bids can track. 🔍 Tracking order flow and capital velocity right now is critical to catching these early impulse waves before retail chasing kicks in. 💬 Which meme setup are you bidding for this rotation wave? 👇
⚠️ Not financial advice. Always manage your risk. 🛡️
🏷️ #MEME #MemeCoins #Crypto #AltcoinSeason #Breakout
🔥 💎
Smart money is shifting aggressive size away from slow-moving majors to front-run high-volatility meme setups. 📊 Volume profiles across top meme sector charts show accumulation ranges breaking out simultaneously as momentum buyers step in to absorb sell-side resistance. ⚡
When liquidity sweeps start cascading across speculative assets, upside momentum tends to expand faster than most late retail bids can track. 🔍 Tracking order flow and capital velocity right now is critical to catching these early impulse waves before retail chasing kicks in. 💬 Which meme setup are you bidding for this rotation wave? 👇
⚠️ Not financial advice. Always manage your risk. 🛡️
🏷️ #MEME #MemeCoins #Crypto #AltcoinSeason #Breakout
🔥 💎

246

·
--
Bullish
### 🚀 $MEME : Macro Accumulation Setup
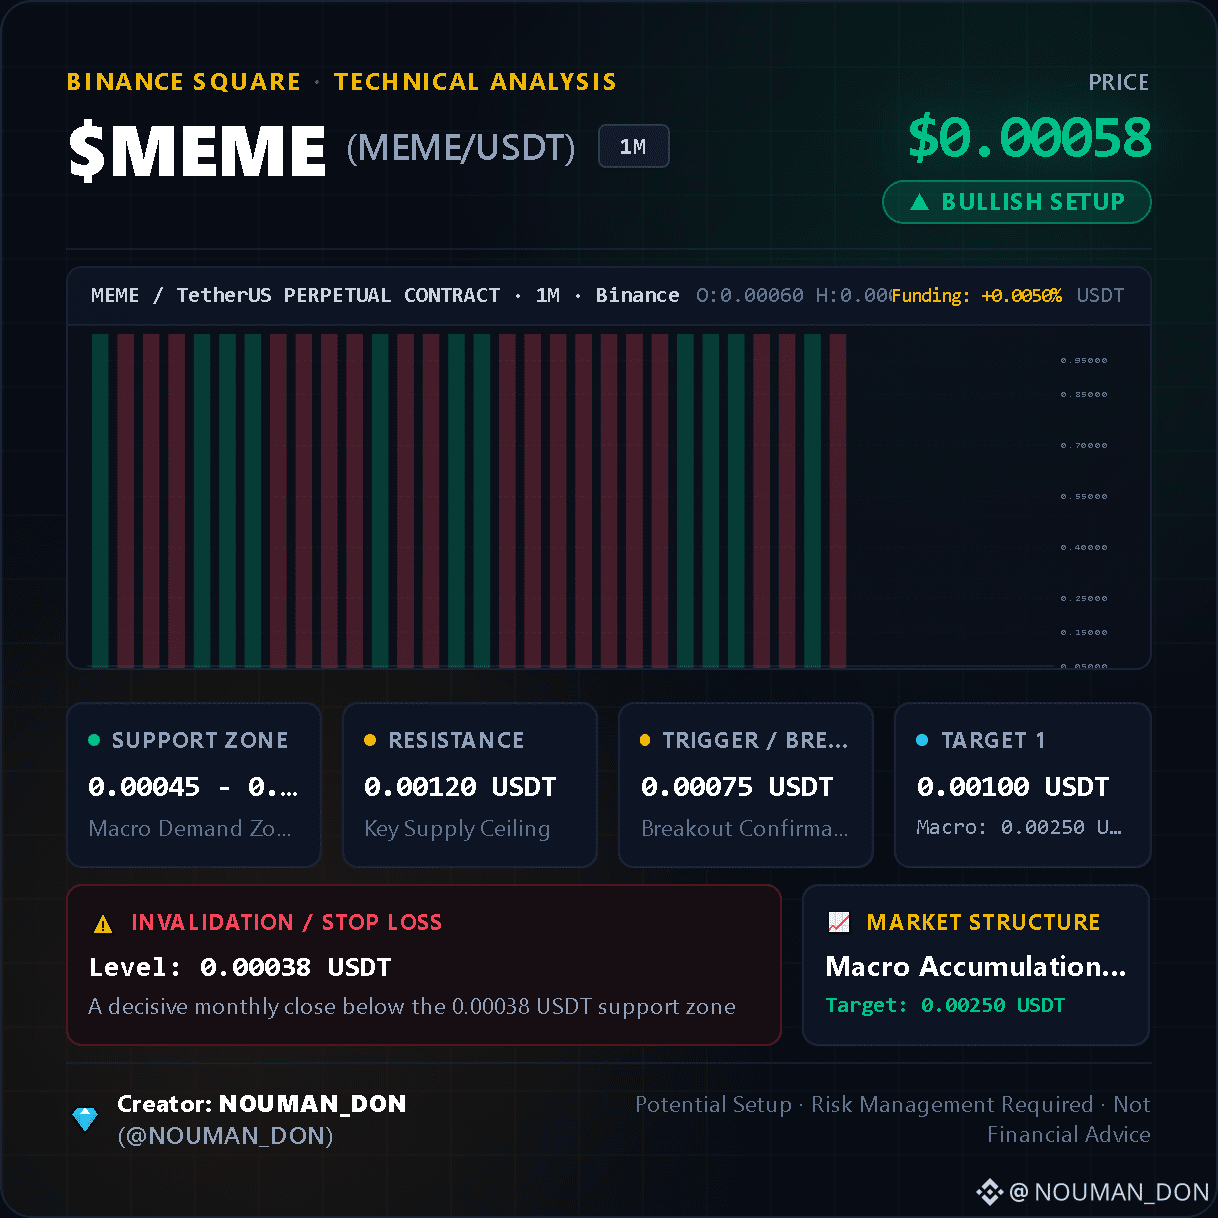
$MEME is currently showing a classic macro accumulation pattern on the 1M timeframe. After a prolonged downtrend, the price has found a stable floor, suggesting that the bears are losing control.
**Key Technical Levels:**
• **Support Zone:** 0.00045 - 0.00055 USDT
• **Trigger Level:** 0.00075 USDT (Breakout confirmation)
• **Resistance:** 0.00120 USDT
• **Macro Target:** 0.00250 USDT
**Analysis:**
The monthly chart indicates that $MEME is building a solid base. A breakout above the trigger level would confirm a shift in market structure, opening the door for a significant recovery move.
⚠️ **Risk Management:** Always use a stop loss. A monthly close below 0.00038 USDT invalidates this setup.
Stay tuned for updates!
Best regards,
**NOUMAN_DON**
#MEME #crypto #BinanceSquare #Binance #TechnicalAnalysis
{spot}(MEMEUSDT)
{future}(MEMEUSDT)
### 🚀 $MEME : Macro Accumulation Setup
$MEME is currently showing a classic macro accumulation pattern on the 1M timeframe. After a prolonged downtrend, the price has found a stable floor, suggesting that the bears are losing control.
**Key Technical Levels:**
• **Support Zone:** 0.00045 - 0.00055 USDT
• **Trigger Level:** 0.00075 USDT (Breakout confirmation)
• **Resistance:** 0.00120 USDT
• **Macro Target:** 0.00250 USDT
**Analysis:**
The monthly chart indicates that $MEME is building a solid base. A breakout above the trigger level would confirm a shift in market structure, opening the door for a significant recovery move.
⚠️ **Risk Management:** Always use a stop loss. A monthly close below 0.00038 USDT invalidates this setup.
Stay tuned for updates!
Best regards,
**NOUMAN_DON**
#MEME #crypto #BinanceSquare #Binance #TechnicalAnalysis
$MEME is currently showing a classic macro accumulation pattern on the 1M timeframe. After a prolonged downtrend, the price has found a stable floor, suggesting that the bears are losing control.
**Key Technical Levels:**
• **Support Zone:** 0.00045 - 0.00055 USDT
• **Trigger Level:** 0.00075 USDT (Breakout confirmation)
• **Resistance:** 0.00120 USDT
• **Macro Target:** 0.00250 USDT
**Analysis:**
The monthly chart indicates that $MEME is building a solid base. A breakout above the trigger level would confirm a shift in market structure, opening the door for a significant recovery move.
⚠️ **Risk Management:** Always use a stop loss. A monthly close below 0.00038 USDT invalidates this setup.
Stay tuned for updates!
Best regards,
**NOUMAN_DON**
#MEME #crypto #BinanceSquare #Binance #TechnicalAnalysis
1
26

·
--
Bearish
$0.00058 saw a MEME long liquidation.
I’d watch for further downside after this sweep.
$MEME
{future}(MEMEUSDT)
$MOVR
{future}(MOVRUSDT)
$龙虾
{future}(龙虾USDT)
🔴 LIQUIDITY ZONE HIT 🔴
Long liquidation spotted 🧨
$2.9775K cleared at $0.00058
Downside liquidity swept — watch reaction 👀
🎯 TP Targets:
TP1: ~$0.00055
TP2: ~$0.00052
TP3: ~$0.00049
#MEME
$0.00058 saw a MEME long liquidation.
I’d watch for further downside after this sweep.
$MEME
$MOVR
$龙虾
🔴 LIQUIDITY ZONE HIT 🔴
Long liquidation spotted 🧨
$2.9775K cleared at $0.00058
Downside liquidity swept — watch reaction 👀
🎯 TP Targets:
TP1: ~$0.00055
TP2: ~$0.00052
TP3: ~$0.00049
#MEME
I’d watch for further downside after this sweep.
$MEME
$MOVR
$龙虾
🔴 LIQUIDITY ZONE HIT 🔴
Long liquidation spotted 🧨
$2.9775K cleared at $0.00058
Downside liquidity swept — watch reaction 👀
🎯 TP Targets:
TP1: ~$0.00055
TP2: ~$0.00052
TP3: ~$0.00049
#MEME
1
357

·
--
Bearish
🔴 $MEME
Zone of Interest 0.0005915 to 0.0006120
TP 0.0005660 / 0.0005350 / 0.0004980
SL 0.0006290
Upper liquidity is already below the price A loss of momentum in this zone can sharply intercept the move downward
Not financial advice
#MEME
🔴 $MEME
{future}(MEMEUSDT)
🔴 $MEME
Zone of Interest 0.0005915 to 0.0006120
TP 0.0005660 / 0.0005350 / 0.0004980
SL 0.0006290
Upper liquidity is already below the price A loss of momentum in this zone can sharply intercept the move downward
Not financial advice
#MEME
🔴 $MEME
Zone of Interest 0.0005915 to 0.0006120
TP 0.0005660 / 0.0005350 / 0.0004980
SL 0.0006290
Upper liquidity is already below the price A loss of momentum in this zone can sharply intercept the move downward
Not financial advice
#MEME
🔴 $MEME
1
177

·
--
$DOGE
On October 2nd, that 4-hour candlestick—the lower wick went straight down to 0.09014.
From the high near 0.098, it kept dumping all the way down; the low dropped by nearly 8%. Volume was 161M, about two to three times the amount on the previous several candlesticks. This is a typical panic-selling batch getting cleared. Then what? It didn’t fall any further.
After the needle, the price closed at 0.09143. Then the next two candlesticks slowly crawled upward, and we’re back to 0.09295. The 24-hour drop has narrowed to -1.88%.
I checked the volume ratio: the latest 4-hour candlestick only traded 2.3M. That’s about 3% of the average of the previous 20 candles. When volume shrinks to this extent, it means the sell pressure is already exhausted. Nobody is willing to keep smashing at this level.
**Market signals**
Support at 0.09014, resistance at 0.09799. Price is stuck in the lower-middle range. Looking at the last 30 candles, it’s still mostly ranging around 0.093 overall—no clear direction, but it’s waiting. Waiting for what? Waiting for a catalyst—either the broader market stabilizes or funds flow back in; any one of those signals is enough.
**Market sentiment**
Funding rate +0.0099% per 8 hours—almost zero. Longs don’t have the confidence to add, and shorts also aren’t chasing after a win. Sentiment is at a bottom. But after doing this for so long, I know that this kind of quiet often comes right before a turning point. The more silent it is, the bigger the move afterward.
**Whale activity**
That October 2nd high-volume bearish candle looks more like large funds actively shaking the market. After the wick insertion, it immediately shrank in volume and stabilized. If it were a real breakdown, it wouldn’t close so steadily. It feels more like washing out floating supply so things can be reset with lighter loads. With a trade value of 627M, it’s not hard for the main players to control the market.
**Volume-price structure**
Down move with rising volume, rebound with shrinking volume. Superficially it looks weak, but combined with the wick-insertion pattern, it looks more like a buildup after the chip exchange is completed. Volume ratio 0.03, at an extreme level. With such extreme contraction, you either grind lower with bearish candles, or you get pulled back sharply by one bullish candle—I lean toward the latter.
**Candlestick details**
The candle on 10-02 at 16: open 0.09507, low 0.09014, close 0.09143. The lower wick length is more than twice the body. It’s a textbook hammer. After that, the next two candles closed bullish in a row, confirming the effectiveness of this support. Pay attention to the rebound from 0.09014 to 0.09327: the volume was 58.7M and 49.5M respectively. It’s not huge, but it’s far stronger than the latest 2.3M. That shows that during the early rebound, there were still people stepping in.
**Nini’s plan**
Current price is 0.09295. In the short term, 0.09014 is the bottom as long as it doesn’t break. The rebound target is first 0.095; if it breaks through, then look at 0.098. If it breaks below 0.090, cut losses and exit—no stubborn holding. Keep position size within 30%. Don’t gamble.
Slightly bullish. The wick with high volume, followed by low-volume stabilization, is one of the entry signals I like. After panic selling is cleared, the rebound is often the strongest, because the shorts have already used up their bullets.
If you need a customized strategy, you can find Nini.
#DOGE #Meme #PAYMENT
$DOGE
On October 2nd, that 4-hour candlestick—the lower wick went straight down to 0.09014.
From the high near 0.098, it kept dumping all the way down; the low dropped by nearly 8%. Volume was 161M, about two to three times the amount on the previous several candlesticks. This is a typical panic-selling batch getting cleared. Then what? It didn’t fall any further.
After the needle, the price closed at 0.09143. Then the next two candlesticks slowly crawled upward, and we’re back to 0.09295. The 24-hour drop has narrowed to -1.88%.
I checked the volume ratio: the latest 4-hour candlestick only traded 2.3M. That’s about 3% of the average of the previous 20 candles. When volume shrinks to this extent, it means the sell pressure is already exhausted. Nobody is willing to keep smashing at this level.
**Market signals**
Support at 0.09014, resistance at 0.09799. Price is stuck in the lower-middle range. Looking at the last 30 candles, it’s still mostly ranging around 0.093 overall—no clear direction, but it’s waiting. Waiting for what? Waiting for a catalyst—either the broader market stabilizes or funds flow back in; any one of those signals is enough.
**Market sentiment**
Funding rate +0.0099% per 8 hours—almost zero. Longs don’t have the confidence to add, and shorts also aren’t chasing after a win. Sentiment is at a bottom. But after doing this for so long, I know that this kind of quiet often comes right before a turning point. The more silent it is, the bigger the move afterward.
**Whale activity**
That October 2nd high-volume bearish candle looks more like large funds actively shaking the market. After the wick insertion, it immediately shrank in volume and stabilized. If it were a real breakdown, it wouldn’t close so steadily. It feels more like washing out floating supply so things can be reset with lighter loads. With a trade value of 627M, it’s not hard for the main players to control the market.
**Volume-price structure**
Down move with rising volume, rebound with shrinking volume. Superficially it looks weak, but combined with the wick-insertion pattern, it looks more like a buildup after the chip exchange is completed. Volume ratio 0.03, at an extreme level. With such extreme contraction, you either grind lower with bearish candles, or you get pulled back sharply by one bullish candle—I lean toward the latter.
**Candlestick details**
The candle on 10-02 at 16: open 0.09507, low 0.09014, close 0.09143. The lower wick length is more than twice the body. It’s a textbook hammer. After that, the next two candles closed bullish in a row, confirming the effectiveness of this support. Pay attention to the rebound from 0.09014 to 0.09327: the volume was 58.7M and 49.5M respectively. It’s not huge, but it’s far stronger than the latest 2.3M. That shows that during the early rebound, there were still people stepping in.
**Nini’s plan**
Current price is 0.09295. In the short term, 0.09014 is the bottom as long as it doesn’t break. The rebound target is first 0.095; if it breaks through, then look at 0.098. If it breaks below 0.090, cut losses and exit—no stubborn holding. Keep position size within 30%. Don’t gamble.
Slightly bullish. The wick with high volume, followed by low-volume stabilization, is one of the entry signals I like. After panic selling is cleared, the rebound is often the strongest, because the shorts have already used up their bullets.
If you need a customized strategy, you can find Nini.
#DOGE #Meme #PAYMENT
On October 2nd, that 4-hour candlestick—the lower wick went straight down to 0.09014.
From the high near 0.098, it kept dumping all the way down; the low dropped by nearly 8%. Volume was 161M, about two to three times the amount on the previous several candlesticks. This is a typical panic-selling batch getting cleared. Then what? It didn’t fall any further.
After the needle, the price closed at 0.09143. Then the next two candlesticks slowly crawled upward, and we’re back to 0.09295. The 24-hour drop has narrowed to -1.88%.
I checked the volume ratio: the latest 4-hour candlestick only traded 2.3M. That’s about 3% of the average of the previous 20 candles. When volume shrinks to this extent, it means the sell pressure is already exhausted. Nobody is willing to keep smashing at this level.
**Market signals**
Support at 0.09014, resistance at 0.09799. Price is stuck in the lower-middle range. Looking at the last 30 candles, it’s still mostly ranging around 0.093 overall—no clear direction, but it’s waiting. Waiting for what? Waiting for a catalyst—either the broader market stabilizes or funds flow back in; any one of those signals is enough.
**Market sentiment**
Funding rate +0.0099% per 8 hours—almost zero. Longs don’t have the confidence to add, and shorts also aren’t chasing after a win. Sentiment is at a bottom. But after doing this for so long, I know that this kind of quiet often comes right before a turning point. The more silent it is, the bigger the move afterward.
**Whale activity**
That October 2nd high-volume bearish candle looks more like large funds actively shaking the market. After the wick insertion, it immediately shrank in volume and stabilized. If it were a real breakdown, it wouldn’t close so steadily. It feels more like washing out floating supply so things can be reset with lighter loads. With a trade value of 627M, it’s not hard for the main players to control the market.
**Volume-price structure**
Down move with rising volume, rebound with shrinking volume. Superficially it looks weak, but combined with the wick-insertion pattern, it looks more like a buildup after the chip exchange is completed. Volume ratio 0.03, at an extreme level. With such extreme contraction, you either grind lower with bearish candles, or you get pulled back sharply by one bullish candle—I lean toward the latter.
**Candlestick details**
The candle on 10-02 at 16: open 0.09507, low 0.09014, close 0.09143. The lower wick length is more than twice the body. It’s a textbook hammer. After that, the next two candles closed bullish in a row, confirming the effectiveness of this support. Pay attention to the rebound from 0.09014 to 0.09327: the volume was 58.7M and 49.5M respectively. It’s not huge, but it’s far stronger than the latest 2.3M. That shows that during the early rebound, there were still people stepping in.
**Nini’s plan**
Current price is 0.09295. In the short term, 0.09014 is the bottom as long as it doesn’t break. The rebound target is first 0.095; if it breaks through, then look at 0.098. If it breaks below 0.090, cut losses and exit—no stubborn holding. Keep position size within 30%. Don’t gamble.
Slightly bullish. The wick with high volume, followed by low-volume stabilization, is one of the entry signals I like. After panic selling is cleared, the rebound is often the strongest, because the shorts have already used up their bullets.
If you need a customized strategy, you can find Nini.
#DOGE #Meme #PAYMENT
1
86
·
--
$1000PEPE
Yesterday’s needle, punctured it beautifully.
At 4:00 a.m. on October 2, a 4-hour candle was pulled straight from 0.00447 to 0.00475—up 6.3%, with $91.7 million in trading volume. Immediately after, the next candle started to drop, and the third one smashed back to 0.0044. Pump it, distribute it, leave—done in one smooth sequence.
This is PEPE. Pure meme—no narrative, no ecosystem. Its rises and falls are driven entirely by sentiment and capital. You don’t buy it because of faith. You buy it because you think someone else will bid higher than you.
Market signals—
From the high of 0.00475 to now 0.00423, it’s down 11%. But support is at 0.00406—that’s the low of the big bearish candle from the afternoon of October 2. Only after it sinks to the bottom of that needle can it be considered truly stabilized. Right now, it’s stuck in an awkward middle ground: neither up nor down, a spot left behind after being abandoned. The resistance is clearly at 0.00475. In the short term, nobody dares to retest that top.
Market sentiment—
Funding rate: -0.003%, checked once every 8 hours. A negative funding rate means shorts are paying and longs are receiving. It looks like the market is betting on further downside, but honestly that figure is too small—almost negligible. There’s no clear direction; it’s just scattered sand. In the last 24 hours it’s down 8.27%—not a crash, but enough to make the chasers feel the pain.
Whale movements—
That October 2 surge candle had $91.7 million in volume, double the normal amount. Then the follow-up dump candles came right after, with $87.3 million and $92.5 million, and the volume was still substantial. What does that mean? While pumping, someone was distributing. While dumping, someone was moving size. Retail gets left holding the bag, whales trade back and forth—classic meme-coin play. Now volume has shrunk to $2.9 million, which suggests the ones who needed to exit already exited early. What’s left is mostly people lying flat, pretending nothing happened.
Volume-price structure—
This is the most interesting part, in my opinion. The latest 4-hour candle’s volume ratio is only 0.06. What does that mean? In the average of the previous 20 candles, each one was about $48.9 million. Now this one is only $2.9 million. Volume has contracted by 94%. Extremely low volume usually means a breakout/turning point is near, but the direction is still uncertain. Going up needs supportive funds. Going down doesn’t require much volume—price can fall on its own.
Candlestick details—
Since September 30, PEPE went through a round of mild upward crawling, rising slowly from 0.00425 to 0.00447 over two days. Then a single needle candle pulled it back to square one. Now three consecutive small candles are ranging around 0.0042, with bodies getting smaller and the upper/lower wicks not extending much. That’s a classic low-volume consolidation pattern. One straight green candle chain, but with no power behind it—it looks more like “it can’t fall further” than “it’s starting to rise.”
Nini’s plan—
Current price: 0.00423. Slightly neutral—no rush to act.
If you want to bet on a rebound, wait until it drops to around 0.00406. That’s the bottom of the needle from October 2, and also the lowest point within those 30 candles. If it breaks that level and stays below 0.004, then we reassess below 0.004. If it puts volume behind it and stands above 0.0044, it would suggest new money has entered—then you can cautiously follow with a small position. But with the current low-volume sideways chop, entering now is just gambling on which way it’ll choose.
Meme coins have no fundamentals—only a contest over chips. The money you make is someone else’s loss. Think it through before you act.
If you need a tailored strategy, you can find Nini.
#1000PEPE #Meme #Solana
$1000PEPE
Yesterday’s needle, punctured it beautifully.
At 4:00 a.m. on October 2, a 4-hour candle was pulled straight from 0.00447 to 0.00475—up 6.3%, with $91.7 million in trading volume. Immediately after, the next candle started to drop, and the third one smashed back to 0.0044. Pump it, distribute it, leave—done in one smooth sequence.
This is PEPE. Pure meme—no narrative, no ecosystem. Its rises and falls are driven entirely by sentiment and capital. You don’t buy it because of faith. You buy it because you think someone else will bid higher than you.
Market signals—
From the high of 0.00475 to now 0.00423, it’s down 11%. But support is at 0.00406—that’s the low of the big bearish candle from the afternoon of October 2. Only after it sinks to the bottom of that needle can it be considered truly stabilized. Right now, it’s stuck in an awkward middle ground: neither up nor down, a spot left behind after being abandoned. The resistance is clearly at 0.00475. In the short term, nobody dares to retest that top.
Market sentiment—
Funding rate: -0.003%, checked once every 8 hours. A negative funding rate means shorts are paying and longs are receiving. It looks like the market is betting on further downside, but honestly that figure is too small—almost negligible. There’s no clear direction; it’s just scattered sand. In the last 24 hours it’s down 8.27%—not a crash, but enough to make the chasers feel the pain.
Whale movements—
That October 2 surge candle had $91.7 million in volume, double the normal amount. Then the follow-up dump candles came right after, with $87.3 million and $92.5 million, and the volume was still substantial. What does that mean? While pumping, someone was distributing. While dumping, someone was moving size. Retail gets left holding the bag, whales trade back and forth—classic meme-coin play. Now volume has shrunk to $2.9 million, which suggests the ones who needed to exit already exited early. What’s left is mostly people lying flat, pretending nothing happened.
Volume-price structure—
This is the most interesting part, in my opinion. The latest 4-hour candle’s volume ratio is only 0.06. What does that mean? In the average of the previous 20 candles, each one was about $48.9 million. Now this one is only $2.9 million. Volume has contracted by 94%. Extremely low volume usually means a breakout/turning point is near, but the direction is still uncertain. Going up needs supportive funds. Going down doesn’t require much volume—price can fall on its own.
Candlestick details—
Since September 30, PEPE went through a round of mild upward crawling, rising slowly from 0.00425 to 0.00447 over two days. Then a single needle candle pulled it back to square one. Now three consecutive small candles are ranging around 0.0042, with bodies getting smaller and the upper/lower wicks not extending much. That’s a classic low-volume consolidation pattern. One straight green candle chain, but with no power behind it—it looks more like “it can’t fall further” than “it’s starting to rise.”
Nini’s plan—
Current price: 0.00423. Slightly neutral—no rush to act.
If you want to bet on a rebound, wait until it drops to around 0.00406. That’s the bottom of the needle from October 2, and also the lowest point within those 30 candles. If it breaks that level and stays below 0.004, then we reassess below 0.004. If it puts volume behind it and stands above 0.0044, it would suggest new money has entered—then you can cautiously follow with a small position. But with the current low-volume sideways chop, entering now is just gambling on which way it’ll choose.
Meme coins have no fundamentals—only a contest over chips. The money you make is someone else’s loss. Think it through before you act.
If you need a tailored strategy, you can find Nini.
#1000PEPE #Meme #Solana
Yesterday’s needle, punctured it beautifully.
At 4:00 a.m. on October 2, a 4-hour candle was pulled straight from 0.00447 to 0.00475—up 6.3%, with $91.7 million in trading volume. Immediately after, the next candle started to drop, and the third one smashed back to 0.0044. Pump it, distribute it, leave—done in one smooth sequence.
This is PEPE. Pure meme—no narrative, no ecosystem. Its rises and falls are driven entirely by sentiment and capital. You don’t buy it because of faith. You buy it because you think someone else will bid higher than you.
Market signals—
From the high of 0.00475 to now 0.00423, it’s down 11%. But support is at 0.00406—that’s the low of the big bearish candle from the afternoon of October 2. Only after it sinks to the bottom of that needle can it be considered truly stabilized. Right now, it’s stuck in an awkward middle ground: neither up nor down, a spot left behind after being abandoned. The resistance is clearly at 0.00475. In the short term, nobody dares to retest that top.
Market sentiment—
Funding rate: -0.003%, checked once every 8 hours. A negative funding rate means shorts are paying and longs are receiving. It looks like the market is betting on further downside, but honestly that figure is too small—almost negligible. There’s no clear direction; it’s just scattered sand. In the last 24 hours it’s down 8.27%—not a crash, but enough to make the chasers feel the pain.
Whale movements—
That October 2 surge candle had $91.7 million in volume, double the normal amount. Then the follow-up dump candles came right after, with $87.3 million and $92.5 million, and the volume was still substantial. What does that mean? While pumping, someone was distributing. While dumping, someone was moving size. Retail gets left holding the bag, whales trade back and forth—classic meme-coin play. Now volume has shrunk to $2.9 million, which suggests the ones who needed to exit already exited early. What’s left is mostly people lying flat, pretending nothing happened.
Volume-price structure—
This is the most interesting part, in my opinion. The latest 4-hour candle’s volume ratio is only 0.06. What does that mean? In the average of the previous 20 candles, each one was about $48.9 million. Now this one is only $2.9 million. Volume has contracted by 94%. Extremely low volume usually means a breakout/turning point is near, but the direction is still uncertain. Going up needs supportive funds. Going down doesn’t require much volume—price can fall on its own.
Candlestick details—
Since September 30, PEPE went through a round of mild upward crawling, rising slowly from 0.00425 to 0.00447 over two days. Then a single needle candle pulled it back to square one. Now three consecutive small candles are ranging around 0.0042, with bodies getting smaller and the upper/lower wicks not extending much. That’s a classic low-volume consolidation pattern. One straight green candle chain, but with no power behind it—it looks more like “it can’t fall further” than “it’s starting to rise.”
Nini’s plan—
Current price: 0.00423. Slightly neutral—no rush to act.
If you want to bet on a rebound, wait until it drops to around 0.00406. That’s the bottom of the needle from October 2, and also the lowest point within those 30 candles. If it breaks that level and stays below 0.004, then we reassess below 0.004. If it puts volume behind it and stands above 0.0044, it would suggest new money has entered—then you can cautiously follow with a small position. But with the current low-volume sideways chop, entering now is just gambling on which way it’ll choose.
Meme coins have no fundamentals—only a contest over chips. The money you make is someone else’s loss. Think it through before you act.
If you need a tailored strategy, you can find Nini.
#1000PEPE #Meme #Solana
32

·
--
⚡ Today’s One Coin ②/⑥ · PEPE
📌 The first one to kneel on the liquidation day is always PEPE
Current price: 0.00000425, down 4.06% over the past 24 hours
🗣️ One sentence: memes have no fundamental support—when the wind stops, it drops first
🎯 If you can’t reclaim 0.0000045, don’t try to pick it up
💬 Do you keep your meme position today or cut it?
🎉 May none of you trigger stop-loss
$PEPE #meme
Investment involves risk. All data in this article is collected from the internet and does not constitute investment advice. Please do your own research and learning.
⚡ Today’s One Coin ②/⑥ · PEPE
📌 The first one to kneel on the liquidation day is always PEPE
Current price: 0.00000425, down 4.06% over the past 24 hours
🗣️ One sentence: memes have no fundamental support—when the wind stops, it drops first
🎯 If you can’t reclaim 0.0000045, don’t try to pick it up
💬 Do you keep your meme position today or cut it?
🎉 May none of you trigger stop-loss
$PEPE #meme
Investment involves risk. All data in this article is collected from the internet and does not constitute investment advice. Please do your own research and learning.
📌 The first one to kneel on the liquidation day is always PEPE
Current price: 0.00000425, down 4.06% over the past 24 hours
🗣️ One sentence: memes have no fundamental support—when the wind stops, it drops first
🎯 If you can’t reclaim 0.0000045, don’t try to pick it up
💬 Do you keep your meme position today or cut it?
🎉 May none of you trigger stop-loss
$PEPE #meme
Investment involves risk. All data in this article is collected from the internet and does not constitute investment advice. Please do your own research and learning.

377
·
--
$Lobster 从0.11跌到0.025,现在爬回0.05。Seven days to complete a full roller coaster ride.
First, let’s talk about the chart. That spike on October 1 was truly brutal—jumping from 0.043 straight to 0.113 in one go. Four 4-hour candlesticks doubled the move (up about 1.6x). Then a single bearish candle smashed from 0.11 down to 0.052, followed immediately by another down to 0.028. Two days of gains, and one and a half days gave it all back. Now it’s even closed five consecutive bullish candles, bouncing from 0.028 back to 0.050—so it’s like recovering after an ICU stay. But it’s still far from the previous high. The pressure level at 0.113 is not something you should even think about in the short term.
Now about this project. Lobster is a meme coin, meme sector. No whitepaper, no roadmap—it's driven by community sentiment and capital relay. You don’t analyze the fundamentals for coins like this; you only look at capital games and sentiment cycles. The description is empty, which means the team didn’t even bother to write a proper introduction. Classic “pump and leave” trader behavior.
Market sentiment: 24-hour trading volume is $616 million USD. For a meme coin, that’s not small. It suggests people are still actively trading inside and it hasn’t fully died. But the -4.85% drop is right there—bullish confidence hasn’t fully recovered. Funding rate is +0.0398%. It’s positive, meaning longs are paying. Not extreme, but it’s not dominated by bears either.
Whale moves. In the candle at 00:00 on October 2, price was directly hammered from 0.11 to 0.05, with a trading volume of $227 million USD. This isn’t something retail traders could do. Clearly, it looks like a big player distributing liquidity—one wick drained it all. After that, around 0.025, someone stepped in to buy. The 04:00 candle on October 2 had $164 million in volume, indicating large funds were accumulating at the bottom. Pushing it upward now, chances are it’s the same batch doing the rebound.
Volume-price structure. The current volume ratio is 1.30, which is 30% higher than the average of the previous 20 candles. A rebound with volume is a good sign. But be careful: during the surge on October 1, those candles had even higher volume—on the order of 127M and 140M. Now it’s about 89M, still not quite there. If volume can’t keep up later, the rebound will likely stall in the 0.055–0.06 range. Support over the last 30 candles is at 0.025, resistance is at 0.113. In between, 0.05 is a psychological battleground, and price is currently fighting for it.
Candlestick details. The rhythm of five consecutive bullish candles is gentle—no violent breakout—suggesting funds are slowly accumulating rather than rushing in. The real bodies of each bullish candle aren’t large, and the wicks are relatively long, meaning there’s still disagreement between bulls and bears. The latest candle went from 0.039 up to 0.050. It even touched 0.054 in the middle before falling back. There’s likely selling pressure around 0.055. If the next candle can hold above 0.05, then short-term we can look at 0.06. If it can’t hold, a pullback to 0.04 is completely normal.
Nini’s plan. Current price is 0.05019. At this spot, I’m neutral. The rebound is real, but the trapped supply around 0.113 is too heavy, so upside is limited. If you want a short-term trade, consider a light entry below 0.045, set stop-loss at 0.038, and target 0.06. Don’t go heavy—meme coin rebounds can end at any moment. If you’re stuck above 0.08, don’t wait for a full exit. As it rebounds to 0.06, reduce half your position; the rest treat it like a lottery ticket.
If you need a tailored strategy, you can find Nini.
#龙虾 #Meme #Altcoins
$Lobster 从0.11跌到0.025,现在爬回0.05。Seven days to complete a full roller coaster ride.
First, let’s talk about the chart. That spike on October 1 was truly brutal—jumping from 0.043 straight to 0.113 in one go. Four 4-hour candlesticks doubled the move (up about 1.6x). Then a single bearish candle smashed from 0.11 down to 0.052, followed immediately by another down to 0.028. Two days of gains, and one and a half days gave it all back. Now it’s even closed five consecutive bullish candles, bouncing from 0.028 back to 0.050—so it’s like recovering after an ICU stay. But it’s still far from the previous high. The pressure level at 0.113 is not something you should even think about in the short term.
Now about this project. Lobster is a meme coin, meme sector. No whitepaper, no roadmap—it's driven by community sentiment and capital relay. You don’t analyze the fundamentals for coins like this; you only look at capital games and sentiment cycles. The description is empty, which means the team didn’t even bother to write a proper introduction. Classic “pump and leave” trader behavior.
Market sentiment: 24-hour trading volume is $616 million USD. For a meme coin, that’s not small. It suggests people are still actively trading inside and it hasn’t fully died. But the -4.85% drop is right there—bullish confidence hasn’t fully recovered. Funding rate is +0.0398%. It’s positive, meaning longs are paying. Not extreme, but it’s not dominated by bears either.
Whale moves. In the candle at 00:00 on October 2, price was directly hammered from 0.11 to 0.05, with a trading volume of $227 million USD. This isn’t something retail traders could do. Clearly, it looks like a big player distributing liquidity—one wick drained it all. After that, around 0.025, someone stepped in to buy. The 04:00 candle on October 2 had $164 million in volume, indicating large funds were accumulating at the bottom. Pushing it upward now, chances are it’s the same batch doing the rebound.
Volume-price structure. The current volume ratio is 1.30, which is 30% higher than the average of the previous 20 candles. A rebound with volume is a good sign. But be careful: during the surge on October 1, those candles had even higher volume—on the order of 127M and 140M. Now it’s about 89M, still not quite there. If volume can’t keep up later, the rebound will likely stall in the 0.055–0.06 range. Support over the last 30 candles is at 0.025, resistance is at 0.113. In between, 0.05 is a psychological battleground, and price is currently fighting for it.
Candlestick details. The rhythm of five consecutive bullish candles is gentle—no violent breakout—suggesting funds are slowly accumulating rather than rushing in. The real bodies of each bullish candle aren’t large, and the wicks are relatively long, meaning there’s still disagreement between bulls and bears. The latest candle went from 0.039 up to 0.050. It even touched 0.054 in the middle before falling back. There’s likely selling pressure around 0.055. If the next candle can hold above 0.05, then short-term we can look at 0.06. If it can’t hold, a pullback to 0.04 is completely normal.
Nini’s plan. Current price is 0.05019. At this spot, I’m neutral. The rebound is real, but the trapped supply around 0.113 is too heavy, so upside is limited. If you want a short-term trade, consider a light entry below 0.045, set stop-loss at 0.038, and target 0.06. Don’t go heavy—meme coin rebounds can end at any moment. If you’re stuck above 0.08, don’t wait for a full exit. As it rebounds to 0.06, reduce half your position; the rest treat it like a lottery ticket.
If you need a tailored strategy, you can find Nini.
#龙虾 #Meme #Altcoins
First, let’s talk about the chart. That spike on October 1 was truly brutal—jumping from 0.043 straight to 0.113 in one go. Four 4-hour candlesticks doubled the move (up about 1.6x). Then a single bearish candle smashed from 0.11 down to 0.052, followed immediately by another down to 0.028. Two days of gains, and one and a half days gave it all back. Now it’s even closed five consecutive bullish candles, bouncing from 0.028 back to 0.050—so it’s like recovering after an ICU stay. But it’s still far from the previous high. The pressure level at 0.113 is not something you should even think about in the short term.
Now about this project. Lobster is a meme coin, meme sector. No whitepaper, no roadmap—it's driven by community sentiment and capital relay. You don’t analyze the fundamentals for coins like this; you only look at capital games and sentiment cycles. The description is empty, which means the team didn’t even bother to write a proper introduction. Classic “pump and leave” trader behavior.
Market sentiment: 24-hour trading volume is $616 million USD. For a meme coin, that’s not small. It suggests people are still actively trading inside and it hasn’t fully died. But the -4.85% drop is right there—bullish confidence hasn’t fully recovered. Funding rate is +0.0398%. It’s positive, meaning longs are paying. Not extreme, but it’s not dominated by bears either.
Whale moves. In the candle at 00:00 on October 2, price was directly hammered from 0.11 to 0.05, with a trading volume of $227 million USD. This isn’t something retail traders could do. Clearly, it looks like a big player distributing liquidity—one wick drained it all. After that, around 0.025, someone stepped in to buy. The 04:00 candle on October 2 had $164 million in volume, indicating large funds were accumulating at the bottom. Pushing it upward now, chances are it’s the same batch doing the rebound.
Volume-price structure. The current volume ratio is 1.30, which is 30% higher than the average of the previous 20 candles. A rebound with volume is a good sign. But be careful: during the surge on October 1, those candles had even higher volume—on the order of 127M and 140M. Now it’s about 89M, still not quite there. If volume can’t keep up later, the rebound will likely stall in the 0.055–0.06 range. Support over the last 30 candles is at 0.025, resistance is at 0.113. In between, 0.05 is a psychological battleground, and price is currently fighting for it.
Candlestick details. The rhythm of five consecutive bullish candles is gentle—no violent breakout—suggesting funds are slowly accumulating rather than rushing in. The real bodies of each bullish candle aren’t large, and the wicks are relatively long, meaning there’s still disagreement between bulls and bears. The latest candle went from 0.039 up to 0.050. It even touched 0.054 in the middle before falling back. There’s likely selling pressure around 0.055. If the next candle can hold above 0.05, then short-term we can look at 0.06. If it can’t hold, a pullback to 0.04 is completely normal.
Nini’s plan. Current price is 0.05019. At this spot, I’m neutral. The rebound is real, but the trapped supply around 0.113 is too heavy, so upside is limited. If you want a short-term trade, consider a light entry below 0.045, set stop-loss at 0.038, and target 0.06. Don’t go heavy—meme coin rebounds can end at any moment. If you’re stuck above 0.08, don’t wait for a full exit. As it rebounds to 0.06, reduce half your position; the rest treat it like a lottery ticket.
If you need a tailored strategy, you can find Nini.
#龙虾 #Meme #Altcoins
1
337

🔥 The cinema lights are still on—the box office has already spilled away by half.
That meme coin on the Robinhood chain rebounded and then gave back 14.18% in 24 hours. Current price: $0.0150. It was dumped from $0.0189 to $0.0144 intraday. Market cap is about $14.96 million. Trading volume: $1.56 million, with 29.8k holders remaining. Binance Alpha is tradable.
The community has long been using the mantra “the cinema is just a cover”—the theaters are merely the shell; the meme is the main feature. Today isn’t a premiere; it’s intermission: people haven’t left, and volume is still over a million, while price first bleeds off the heat. With nearly 30,000 holders, it shows the rush of exiting isn’t because nobody’s watching—it’s because ticket prices got cut first. That’s how meme markets work: the storyline is lively, but the order book decides.
⚠️ Meme volatility is extremely high and this is not investment advice.
Data source: Binance Alpha real-time quotes (Oct 3, 14:41 UTC+8)
#meme #币安Alpha #On-chain Hotspots
$MEME
🔥 The cinema lights are still on—the box office has already spilled away by half.
That meme coin on the Robinhood chain rebounded and then gave back 14.18% in 24 hours. Current price: $0.0150. It was dumped from $0.0189 to $0.0144 intraday. Market cap is about $14.96 million. Trading volume: $1.56 million, with 29.8k holders remaining. Binance Alpha is tradable.
The community has long been using the mantra “the cinema is just a cover”—the theaters are merely the shell; the meme is the main feature. Today isn’t a premiere; it’s intermission: people haven’t left, and volume is still over a million, while price first bleeds off the heat. With nearly 30,000 holders, it shows the rush of exiting isn’t because nobody’s watching—it’s because ticket prices got cut first. That’s how meme markets work: the storyline is lively, but the order book decides.
⚠️ Meme volatility is extremely high and this is not investment advice.
Data source: Binance Alpha real-time quotes (Oct 3, 14:41 UTC+8)
#meme #币安Alpha #On-chain Hotspots
$MEME
That meme coin on the Robinhood chain rebounded and then gave back 14.18% in 24 hours. Current price: $0.0150. It was dumped from $0.0189 to $0.0144 intraday. Market cap is about $14.96 million. Trading volume: $1.56 million, with 29.8k holders remaining. Binance Alpha is tradable.
The community has long been using the mantra “the cinema is just a cover”—the theaters are merely the shell; the meme is the main feature. Today isn’t a premiere; it’s intermission: people haven’t left, and volume is still over a million, while price first bleeds off the heat. With nearly 30,000 holders, it shows the rush of exiting isn’t because nobody’s watching—it’s because ticket prices got cut first. That’s how meme markets work: the storyline is lively, but the order book decides.
⚠️ Meme volatility is extremely high and this is not investment advice.
Data source: Binance Alpha real-time quotes (Oct 3, 14:41 UTC+8)
#meme #币安Alpha #On-chain Hotspots
$MEME
1
271
Log in to explore more content
Join global crypto users on Binance Square
⚡️ Get latest and useful information about crypto.
💬 Trusted by the world’s largest crypto exchange.
👍 Discover real insights from verified creators.
Email / Phone number
Trending Topics
1
#ZcashETFPostsFirstWeeklyOutflow$93.6M
8,591 views
39 Discussing
2
#GreekPoliceBustCryptoScamRingArrest17
11,841 views
199 Discussing
3
#BitcoinRejectedAt$87K
73,881 views
106 Discussing
4
#FedOctoberRateHikeOddsFallTo17%
43,195 views
595 Discussing
5
#NvidiaHitsRecordHighUp2.4%
23,535 views
412 Discussing
6
#CanaryFilesAmendedS1ForPEPEETF
9,640 views
273 Discussing
7
#USRussiaUkraineTalksReportedlyIncludeLukoilOilDeal
18,081 views
323 Discussing
8
#BitcoinParesGainsAfterRallyTo$86.5K
41,574 views
155 Discussing
9
#CerebrasSinksNearly20%OnReportNvidiaToPowerOpenAI
94,981 views
918 Discussing
10
#SECProposesCryptoCustodyRules
122,397 views
1,133 Discussing