

#goldpriceanalysis
goldpriceanalysis
799 views
7 Discussing
Hot
Latest


·
--

Article
BIG MOVE AHEAD FOR GOLD? Fed Decision, US Dollar & Critical Trading Zones🟡 Gold (XAU/USD) Complete Day-Trading Analysis — October 28, 2026
📈 Market outlook
🕯️ 15-minute candlesticks
🧱 Support and resistance
🎯 Trading setups
📌 Preparation for October 29
⚖️ Gold is trading in a highly sensitive environment today, with the US Federal Reserve's interest-rate decision and its guidance on future policy among the most important potential catalysts. For day traders, the priority is to identify whether gold can sustain its recovery above $4,000 per ounce or whether selling pressure will push it back toward the day's lows.
📊 According to the latest available market snapshot from Investing.com, spot gold (XAU/USD) was quoted around $4,060.95 per ounce, up approximately 1.09%, with a reported daily range of $3,989.33–$4,065.76. These are retrieved market figures, not a guaranteed live executable quote.
📊 Live 15-minute candlestick chart
The most useful chart for your request is the live XAU/USD or gold-futures chart with the interval set to 15 minutes. I could verify the market snapshot, but I could not retrieve a complete, timestamped sequence of today's 15-minute OHLC candles from the available sources. I therefore won't invent candlesticks or label a simulated chart as real market data.
🧭 Today's market structure and technical analysis
What is driving gold today?
The latest reporting points to a market balancing a short-term recovery against broader downside risks.
🏦 Federal Reserve uncertainty: The October 28 rate decision and the accompanying policy commentary may produce sharp movements in gold. The expected decision alone matters less than whether the Fed sounds more or less restrictive than markets anticipate.💵 US dollar strength: A stronger dollar generally pressures gold because it makes dollar-priced bullion more expensive for international buyers. The dollar has recently traded near a two-week high.📈 Treasury yields: Rising US yields can make interest-bearing assets more attractive relative to gold, which pays no interest. Watch whether yields rise or fall after the Fed announcement.🛢️ Oil and inflation: Elevated oil prices can raise inflation concerns and strengthen expectations of tighter monetary policy. Conversely, falling oil prices may reduce those concerns and support gold🌍 Geopolitical developments: Changes in Middle East tensions may affect safe-haven demand, although movements in the dollar and yields can sometimes outweigh that support.
📍 Important price levels for today's plan
These levels are based on the retrieved daily range, round-number psychology and nearby reference prices. They are planning levels, not verified 15-minute swing points.
Suggested chart configuration
⏱️ 15-minute: Identify the intraday trend, breakouts and important swing points.🔎 5-minute: Refine entry timing after a 15-minute signal.🧭 1-hour and 4-hour: Determine whether a trade agrees with the larger trend.📊 Indicators: Use the 20 EMA, 50 EMA, RSI (14) and volume if available. Indicators support price action; they do not guarantee direction.📌 Mark levels: Record the Asian-session high and low, London-session high and low, previous day's high and low, and current day's opening price.
For spot gold, tick volume can vary by broker. For COMEX futures, exchange volume provides a different and more centralized view of activity.
🎯 Day-trading setups for October 28
The goal is not to predict every candle. It is to wait for price to confirm a setup, define the invalidation point and manage risk.
These are conditional strategies, not instructions to enter immediately. The quoted price may have moved significantly since the snapshot was retrieved.
🌍 Key Market Drivers
🏦 Federal Reserve: Hawkish guidance may pressure gold; dovish guidance may support it.💵 US dollar: Dollar strength generally weighs on gold.📈 Treasury yields: Rising yields can pressure gold, while falling yields may support it.🌐 Geopolitical risks: Increased uncertainty may boost safe-haven demand.
🌅 How to prepare for tomorrow — October 29
Tomorrow's plan should depend on how today's Fed-driven price action closes, rather than assuming that today's trend will continue.
Before the next session
Record today's actual high, low, opening price and closing price from your broker.Mark the Fed announcement candle and the first clear post-announcement swing high and low.Identify whether price closes above or below the key levels discussed earlier.Check the PCE release schedule, dollar index and US Treasury yields.
If gold closes strongly above resistance
Look for a continuation only if the next session holds the breakout zone. A gap, failed retest or sharp rejection could invalidate the bullish scenario.
If gold closes below support
Watch for a failed reclaim and lower highs. The $4,000 area and the recorded daily low are reference points, not guaranteed targets.
If gold closes near the middle of its range
Treat the next session as potentially range-bound until price proves otherwise. Wait for a clear break, retest and confirmation instead of forcing a trade.
📝 Final trading outlook
🟡 Current bias: Cautiously neutral until the live 15-minute chart confirms whether the recovery is holding.🟢 Bullish confirmation: Sustained trading above the day's verified resistance, supported by a successful retest and a weaker dollar or falling yields.🔴 Bearish confirmation: A failed recovery, a confirmed break below support and renewed dollar or yield strength.⚪ No-trade condition: Choppy price action, conflicting signals or spreads that make the trade's risk unattractive.
The most important point is that a strong daily percentage gain does not automatically make gold bullish for the rest of the day. The Fed decision could reverse the move in either direction. Preserve capital and let confirmed price action determine the trade.
For a genuinely detailed candle-by-candle review, use the live chart above and compare its actual 15-minute OHLC values with these reference zones. The available data does not support claiming that specific candles or indicators have already confirmed a buy or sell signal.
#GoldPriceAnalysis #GoldPricePredictionToday #XAUUSDTrading #GoldTechnicalAnalysis
$XAU
BIG MOVE AHEAD FOR GOLD? Fed Decision, US Dollar & Critical Trading Zones
🟡 Gold (XAU/USD) Complete Day-Trading Analysis — October 28, 2026
📈 Market outlook
🕯️ 15-minute candlesticks
🧱 Support and resistance
🎯 Trading setups
📌 Preparation for October 29
⚖️ Gold is trading in a highly sensitive environment today, with the US Federal Reserve's interest-rate decision and its guidance on future policy among the most important potential catalysts. For day traders, the priority is to identify whether gold can sustain its recovery above $4,000 per ounce or whether selling pressure will push it back toward the day's lows.
📊 According to the latest available market snapshot from Investing.com, spot gold (XAU/USD) was quoted around $4,060.95 per ounce, up approximately 1.09%, with a reported daily range of $3,989.33–$4,065.76. These are retrieved market figures, not a guaranteed live executable quote.
📊 Live 15-minute candlestick chart
The most useful chart for your request is the live XAU/USD or gold-futures chart with the interval set to 15 minutes. I could verify the market snapshot, but I could not retrieve a complete, timestamped sequence of today's 15-minute OHLC candles from the available sources. I therefore won't invent candlesticks or label a simulated chart as real market data.
🧭 Today's market structure and technical analysis
What is driving gold today?
The latest reporting points to a market balancing a short-term recovery against broader downside risks.
🏦 Federal Reserve uncertainty: The October 28 rate decision and the accompanying policy commentary may produce sharp movements in gold. The expected decision alone matters less than whether the Fed sounds more or less restrictive than markets anticipate.💵 US dollar strength: A stronger dollar generally pressures gold because it makes dollar-priced bullion more expensive for international buyers. The dollar has recently traded near a two-week high.📈 Treasury yields: Rising US yields can make interest-bearing assets more attractive relative to gold, which pays no interest. Watch whether yields rise or fall after the Fed announcement.🛢️ Oil and inflation: Elevated oil prices can raise inflation concerns and strengthen expectations of tighter monetary policy. Conversely, falling oil prices may reduce those concerns and support gold🌍 Geopolitical developments: Changes in Middle East tensions may affect safe-haven demand, although movements in the dollar and yields can sometimes outweigh that support.
📍 Important price levels for today's plan
These levels are based on the retrieved daily range, round-number psychology and nearby reference prices. They are planning levels, not verified 15-minute swing points.
Suggested chart configuration
⏱️ 15-minute: Identify the intraday trend, breakouts and important swing points.🔎 5-minute: Refine entry timing after a 15-minute signal.🧭 1-hour and 4-hour: Determine whether a trade agrees with the larger trend.📊 Indicators: Use the 20 EMA, 50 EMA, RSI (14) and volume if available. Indicators support price action; they do not guarantee direction.📌 Mark levels: Record the Asian-session high and low, London-session high and low, previous day's high and low, and current day's opening price.
For spot gold, tick volume can vary by broker. For COMEX futures, exchange volume provides a different and more centralized view of activity.
🎯 Day-trading setups for October 28
The goal is not to predict every candle. It is to wait for price to confirm a setup, define the invalidation point and manage risk.
These are conditional strategies, not instructions to enter immediately. The quoted price may have moved significantly since the snapshot was retrieved.
🌍 Key Market Drivers
🏦 Federal Reserve: Hawkish guidance may pressure gold; dovish guidance may support it.💵 US dollar: Dollar strength generally weighs on gold.📈 Treasury yields: Rising yields can pressure gold, while falling yields may support it.🌐 Geopolitical risks: Increased uncertainty may boost safe-haven demand.
🌅 How to prepare for tomorrow — October 29
Tomorrow's plan should depend on how today's Fed-driven price action closes, rather than assuming that today's trend will continue.
Before the next session
Record today's actual high, low, opening price and closing price from your broker.Mark the Fed announcement candle and the first clear post-announcement swing high and low.Identify whether price closes above or below the key levels discussed earlier.Check the PCE release schedule, dollar index and US Treasury yields.
If gold closes strongly above resistance
Look for a continuation only if the next session holds the breakout zone. A gap, failed retest or sharp rejection could invalidate the bullish scenario.
If gold closes below support
Watch for a failed reclaim and lower highs. The $4,000 area and the recorded daily low are reference points, not guaranteed targets.
If gold closes near the middle of its range
Treat the next session as potentially range-bound until price proves otherwise. Wait for a clear break, retest and confirmation instead of forcing a trade.
📝 Final trading outlook
🟡 Current bias: Cautiously neutral until the live 15-minute chart confirms whether the recovery is holding.🟢 Bullish confirmation: Sustained trading above the day's verified resistance, supported by a successful retest and a weaker dollar or falling yields.🔴 Bearish confirmation: A failed recovery, a confirmed break below support and renewed dollar or yield strength.⚪ No-trade condition: Choppy price action, conflicting signals or spreads that make the trade's risk unattractive.
The most important point is that a strong daily percentage gain does not automatically make gold bullish for the rest of the day. The Fed decision could reverse the move in either direction. Preserve capital and let confirmed price action determine the trade.
For a genuinely detailed candle-by-candle review, use the live chart above and compare its actual 15-minute OHLC values with these reference zones. The available data does not support claiming that specific candles or indicators have already confirmed a buy or sell signal.
#GoldPriceAnalysis #GoldPricePredictionToday #XAUUSDTrading #GoldTechnicalAnalysis
$XAU
2
508
·
--

Article
Fed Eve Liquidation: Gold $4,028 Silver $56.62 As Dollar Hits 4-Week High🪙 Precious Metals Market Update: Heavy Selling Pressure Ahead of FOMC
⋆ Spot gold is trading at $4,028.50 per ounce, while spot silver sits at $56.62 per ounce.
⋆ Both precious metals are experiencing heavy selling pressure as markets brace for today's Federal Reserve monetary policy decision.
⋆ A surging US Dollar near a four-week high and hawkish rate expectations continue to weigh heavily on non-yielding bullion.
📊 Technical Graph Visualizations (USD)
⋆ The custom plots below outline the technical support and resistance levels dominating today's intraday trading channels.
🌐 Macro Market Analysis
1. 🏛️ The Federal Reserve Looming Shadow
⋆ The primary catalyst for today’s market correction is intense positioning ahead of the FOMC policy announcement, causing a spike in market uncertainty.
⋆ Traders are pricing in an 80% probability of a rate hike by September under a potential hawkish posture by Fed Chair Kevin Warsh.
⋆Higher interest rates raise the opportunity cost of holding non-yielding assets, sparking active liquidations across both metals.
2. 🕊️ Easing Geopolitical Premia
⋆ The extreme safe-haven bid that elevated gold earlier this year has deflated significantly.
⋆ Diplomatic developments regarding a pause in the five-month-old US-Iran conflict have caused crude oil to plunge, rapidly cooling global inflation fears and removing a fundamental pillar of support for precious metals.
3. 📉 Silver's Double Whammy
⋆ Silver is underperforming gold due to a combination of tapering investment demand and structural headwinds in its industrial sectors.
⋆ Reports of oversupply in the solar cell market—alongside structural shifts toward alternative technologies like copper paste—have weakened silver's industrial demand outlook.
📈 Technical Breakdown & Trading Levels
🥇 Gold (XAU/USD)
The short-term bias for gold remains a Strong Sell according to major moving averages, with the metal carving out a descending channel.Critical Resistance: $4,100 (Bullish continuation is heavily capped here).Daily Pivot: $4,020.40 (Spot price is hovering precariously just above this level).Key Support Levels: $4,012.14 ($1), followed by the crucial psychological floor at $3,997.65 (S3). A breach below $4,000 could trigger systemic stop-loss liquidations down to $3,800.
🥈 Silver (XAG/USD)
Silver's technical structure is decisively bearish as the Relative Strength Index (RSI) struggles beneath the neutral 50 line.Critical Resistance: $60.00 (A clean daily close above this line is required to shift the bias back to bullish).Key Support Levels: $55.00 and $54.77 (the mid-July swing low). A breakdown past $54.77 will expose the $52.00 macro support window.
⚖️ Gold/Silver Ratio
The current Gold-to-Silver ratio sits at 71.1:1, indicating that silver continues to trade at the cheaper end of its historical valuation spectrum relative to gold.
🔮 2026 Q3 Strategic Outlook
⋆ While the immediate outlook is dominated by macroeconomic headwinds, institutional analysts remain structurally bullish for the back half of 2026.
⋆ J.P. Morgan Global Research forecasts that gold will recover to average $6,000/oz by Q4 2026, driven by an expected return of aggressive central bank diversification and long-term monetary easing cycles.
⋆ Historically, precious metals undergo a summer slowdown before gathering momentum from September through December.
🏷️ Long Hashtags
#PreciousMetalsMarket #GoldPriceAnalysis #SilverTrading #FederalReserveFOMC
$XAU $XAG
{future}(XAGUSDT)
{future}(XAUUSDT)
Fed Eve Liquidation: Gold $4,028 Silver $56.62 As Dollar Hits 4-Week High
🪙 Precious Metals Market Update: Heavy Selling Pressure Ahead of FOMC
⋆ Spot gold is trading at $4,028.50 per ounce, while spot silver sits at $56.62 per ounce.
⋆ Both precious metals are experiencing heavy selling pressure as markets brace for today's Federal Reserve monetary policy decision.
⋆ A surging US Dollar near a four-week high and hawkish rate expectations continue to weigh heavily on non-yielding bullion.
📊 Technical Graph Visualizations (USD)
⋆ The custom plots below outline the technical support and resistance levels dominating today's intraday trading channels.
🌐 Macro Market Analysis
1. 🏛️ The Federal Reserve Looming Shadow
⋆ The primary catalyst for today’s market correction is intense positioning ahead of the FOMC policy announcement, causing a spike in market uncertainty.
⋆ Traders are pricing in an 80% probability of a rate hike by September under a potential hawkish posture by Fed Chair Kevin Warsh.
⋆Higher interest rates raise the opportunity cost of holding non-yielding assets, sparking active liquidations across both metals.
2. 🕊️ Easing Geopolitical Premia
⋆ The extreme safe-haven bid that elevated gold earlier this year has deflated significantly.
⋆ Diplomatic developments regarding a pause in the five-month-old US-Iran conflict have caused crude oil to plunge, rapidly cooling global inflation fears and removing a fundamental pillar of support for precious metals.
3. 📉 Silver's Double Whammy
⋆ Silver is underperforming gold due to a combination of tapering investment demand and structural headwinds in its industrial sectors.
⋆ Reports of oversupply in the solar cell market—alongside structural shifts toward alternative technologies like copper paste—have weakened silver's industrial demand outlook.
📈 Technical Breakdown & Trading Levels
🥇 Gold (XAU/USD)
The short-term bias for gold remains a Strong Sell according to major moving averages, with the metal carving out a descending channel.Critical Resistance: $4,100 (Bullish continuation is heavily capped here).Daily Pivot: $4,020.40 (Spot price is hovering precariously just above this level).Key Support Levels: $4,012.14 ($1), followed by the crucial psychological floor at $3,997.65 (S3). A breach below $4,000 could trigger systemic stop-loss liquidations down to $3,800.
🥈 Silver (XAG/USD)
Silver's technical structure is decisively bearish as the Relative Strength Index (RSI) struggles beneath the neutral 50 line.Critical Resistance: $60.00 (A clean daily close above this line is required to shift the bias back to bullish).Key Support Levels: $55.00 and $54.77 (the mid-July swing low). A breakdown past $54.77 will expose the $52.00 macro support window.
⚖️ Gold/Silver Ratio
The current Gold-to-Silver ratio sits at 71.1:1, indicating that silver continues to trade at the cheaper end of its historical valuation spectrum relative to gold.
🔮 2026 Q3 Strategic Outlook
⋆ While the immediate outlook is dominated by macroeconomic headwinds, institutional analysts remain structurally bullish for the back half of 2026.
⋆ J.P. Morgan Global Research forecasts that gold will recover to average $6,000/oz by Q4 2026, driven by an expected return of aggressive central bank diversification and long-term monetary easing cycles.
⋆ Historically, precious metals undergo a summer slowdown before gathering momentum from September through December.
🏷️ Long Hashtags
#PreciousMetalsMarket #GoldPriceAnalysis #SilverTrading #FederalReserveFOMC
$XAU $XAG
3
438
·
--

Article
GOLD (XAU/USD) — NEW YORK SESSION MARKET ANALYSIS & DAY-TRADING STRATEGY🥇 GOLD (XAU/USD) — NEW YORK SESSION DAY-TRADING PLAN
📅 Friday, September 11, 2026
📊 Market Overview
🟡 Gold is entering New York trading after a sharp Thursday decline, with Thursday's low near $4,324.
💵 A stronger USD and elevated Treasury yields remain bearish factors for gold.
🔥 U.S. CPI at 8:30 AM ET is today's key catalyst and could create very high volatility.
🕯️ Key Candlestick Levels
🔴 Bearish Setup
📉 If CPI is hotter than expected and USD/yields rise:
➡️ Watch $4,400–$4,420 for rejection.
➡️ Bearish confirmation could target $4,360 → $4,340 → $4,324.
➡️ A break below $4,324 could expose $4,300.
🟢 Bullish Setup
📈 If CPI is cooler and USD/yields fall:
➡️ Gold reclaiming $4,420 strengthens the recovery case.
➡️ Above $4,450, watch $4,480–$4,500.
⚡ New York Trading Strategy
⏰ 8:30 AM ET: CPI release — avoid chasing the first spike.
⏰ 8:35–8:45 AM ET: Let the initial volatility settle.
🎯 Look for break → retest → confirmation on the 5M/15M chart.
📉 Current bias: Bearish / sell-the-rally, unless gold decisively reclaims $4,420–$4,450.
🧠 Next New York Session Preparation
✅ Mark today's NY high/low.
✅ Keep $4,324 and $4,300 as major downside levels.
✅ Monitor DXY + U.S. 10Y yields.
✅ Use smaller position size around major economic releases.
✅ Never risk more than you can afford to lose.
#XAUUSDAnalysis #GoldDayTrading #GoldPriceAnalysis #GoldTradingStrategy
$XAU
{future}(XAUUSDT)
GOLD (XAU/USD) — NEW YORK SESSION MARKET ANALYSIS & DAY-TRADING STRATEGY
🥇 GOLD (XAU/USD) — NEW YORK SESSION DAY-TRADING PLAN
📅 Friday, September 11, 2026
📊 Market Overview
🟡 Gold is entering New York trading after a sharp Thursday decline, with Thursday's low near $4,324.
💵 A stronger USD and elevated Treasury yields remain bearish factors for gold.
🔥 U.S. CPI at 8:30 AM ET is today's key catalyst and could create very high volatility.
🕯️ Key Candlestick Levels
🔴 Bearish Setup
📉 If CPI is hotter than expected and USD/yields rise:
➡️ Watch $4,400–$4,420 for rejection.
➡️ Bearish confirmation could target $4,360 → $4,340 → $4,324.
➡️ A break below $4,324 could expose $4,300.
🟢 Bullish Setup
📈 If CPI is cooler and USD/yields fall:
➡️ Gold reclaiming $4,420 strengthens the recovery case.
➡️ Above $4,450, watch $4,480–$4,500.
⚡ New York Trading Strategy
⏰ 8:30 AM ET: CPI release — avoid chasing the first spike.
⏰ 8:35–8:45 AM ET: Let the initial volatility settle.
🎯 Look for break → retest → confirmation on the 5M/15M chart.
📉 Current bias: Bearish / sell-the-rally, unless gold decisively reclaims $4,420–$4,450.
🧠 Next New York Session Preparation
✅ Mark today's NY high/low.
✅ Keep $4,324 and $4,300 as major downside levels.
✅ Monitor DXY + U.S. 10Y yields.
✅ Use smaller position size around major economic releases.
✅ Never risk more than you can afford to lose.
#XAUUSDAnalysis #GoldDayTrading #GoldPriceAnalysis #GoldTradingStrategy
$XAU
3
484
·
--

Article
GOLD (XAU/USD) — New York Session Market Analysis, Key Levels & Trading Outlook🟡 GOLD (XAU/USD) — New York Session Day-Trading Plan
Gold closed the latest session around $4,290, down roughly 1.4%, with the stronger USD and 10-year Treasury yield above 5% keeping pressure on XAU/USD. The Fed decision tomorrow is also likely to increase volatility.
🕯️ Key NY Levels
📉 Short Setup
🔻 If NY price breaks $4,305 and a 5/15-minute candle closes below it, wait for a retest.
🎯 Targets: $4,280 → $4,250 → $4,235.
📈 Long Setup
🟢 If price breaks and holds above $4,360, wait for a bullish retest.
🎯 Targets: $4,395 → $4,420.
🟡 Range Setup
If gold remains between $4,305–$4,360, avoid chasing trades in the middle. Wait for a liquidity sweep and confirmation at either boundary.
🇺🇸 What to Watch in New York
💵 DXY: Continued strength favors sellers.
📈 10Y yield: Above 5% remains a major headwind for gold.
🛢️ Oil: Above $100 is increasing inflation/rate-hike concerns.
🏦 Fed: Markets are pricing about a 93% probability of a rate hike, making Wednesday's decision a major volatility catalyst.
🎯 Day-Trader Bias
🔴 Below $4,360 = bearish preference
🟢 Above $4,360 = bullish recovery potential
🔻 Below $4,305 = stronger short opportunity
⚠️ For the next NY session, prioritize break → retest → confirmation rather than entering immediately after a large candle. Fed-related volatility makes false breakouts particularly dangerous.
📢 This content is for informational and educational purposes only and does not constitute financial, investment, trading, or legal advice.
#GoldTrading #XAUUSD #GoldPriceAnalysis #GoldTechnicalAnalysis
$XAU
{future}(XAUUSDT)
GOLD (XAU/USD) — New York Session Market Analysis, Key Levels & Trading Outlook
🟡 GOLD (XAU/USD) — New York Session Day-Trading Plan
Gold closed the latest session around $4,290, down roughly 1.4%, with the stronger USD and 10-year Treasury yield above 5% keeping pressure on XAU/USD. The Fed decision tomorrow is also likely to increase volatility.
🕯️ Key NY Levels
📉 Short Setup
🔻 If NY price breaks $4,305 and a 5/15-minute candle closes below it, wait for a retest.
🎯 Targets: $4,280 → $4,250 → $4,235.
📈 Long Setup
🟢 If price breaks and holds above $4,360, wait for a bullish retest.
🎯 Targets: $4,395 → $4,420.
🟡 Range Setup
If gold remains between $4,305–$4,360, avoid chasing trades in the middle. Wait for a liquidity sweep and confirmation at either boundary.
🇺🇸 What to Watch in New York
💵 DXY: Continued strength favors sellers.
📈 10Y yield: Above 5% remains a major headwind for gold.
🛢️ Oil: Above $100 is increasing inflation/rate-hike concerns.
🏦 Fed: Markets are pricing about a 93% probability of a rate hike, making Wednesday's decision a major volatility catalyst.
🎯 Day-Trader Bias
🔴 Below $4,360 = bearish preference
🟢 Above $4,360 = bullish recovery potential
🔻 Below $4,305 = stronger short opportunity
⚠️ For the next NY session, prioritize break → retest → confirmation rather than entering immediately after a large candle. Fed-related volatility makes false breakouts particularly dangerous.
📢 This content is for informational and educational purposes only and does not constitute financial, investment, trading, or legal advice.
#GoldTrading #XAUUSD #GoldPriceAnalysis #GoldTechnicalAnalysis
$XAU
1
4
481

·
--
Bullish
$XAUT
{future}(XAUTUSDT)
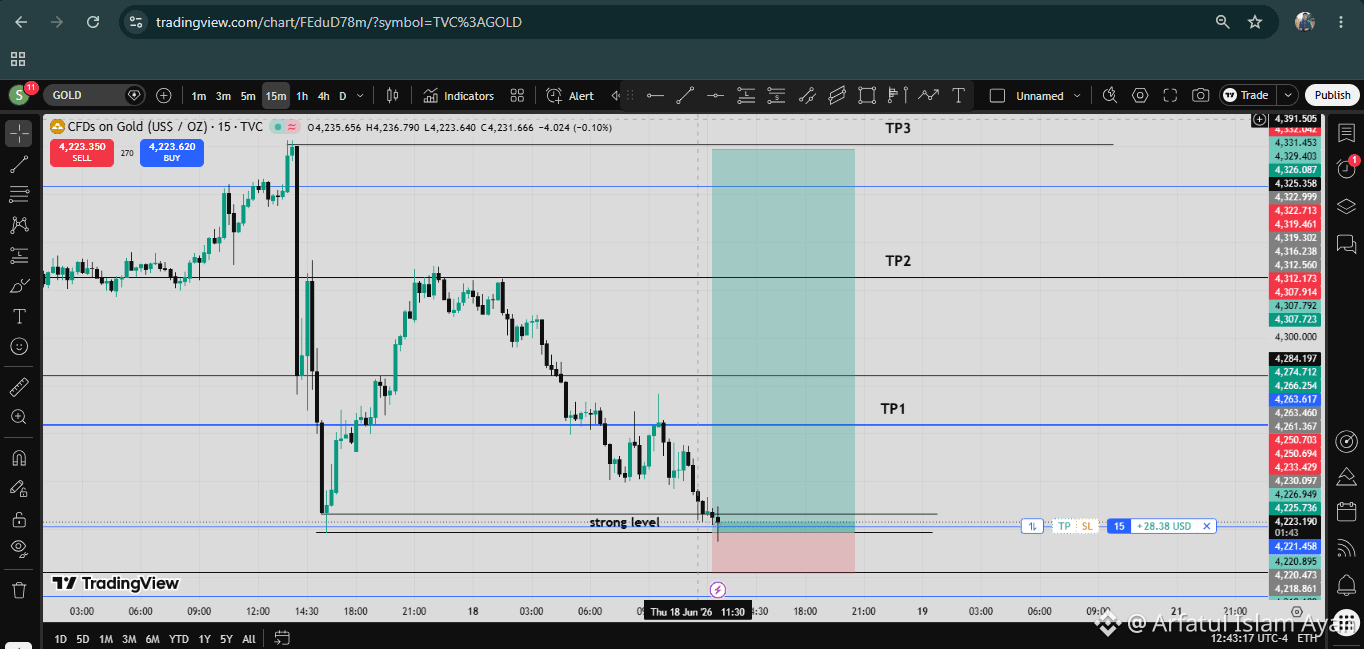
*Gold (XAU/USD) – 15M Chart Setup**
Entry: $4,220
SL: $4,200
{future}(XAUUSDT)
TP1: $4,263
TP2: $4,326 TP3 (Final Target): $4,380
Key Support: marked as "strong level" below entry
Risk: $20 → Reward at TP1: $43 (≈1:2.1), TP2: $106 (≈1:5.3), TP3: $160 (≈1:8). Solid risk-reward setup overall.
#GOLD #XAUUSD #priceaction #smc #GoldPriceAnalysis
$XAUT
*Gold (XAU/USD) – 15M Chart Setup**
Entry: $4,220
SL: $4,200
TP1: $4,263
TP2: $4,326 TP3 (Final Target): $4,380
Key Support: marked as "strong level" below entry
Risk: $20 → Reward at TP1: $43 (≈1:2.1), TP2: $106 (≈1:5.3), TP3: $160 (≈1:8). Solid risk-reward setup overall.
#GOLD #XAUUSD #priceaction #smc #GoldPriceAnalysis
168
·
--
Verified

Article
GOLD (XAU/USD) — NEW YORK SESSION DAY-TRADING ANALYSIS & GAME PLAN🥇 GOLD (XAU/USD) — NEW YORK SESSION DAY-TRADING PLAN
📅 September 10, 2026
📊 Market Overview
🟡 Gold is trading around $4,390–$4,400/oz after Wednesday’s strong rebound from approximately $4,342.
📈 Wednesday’s bullish candle pushed price toward $4,434, making this the key breakout level.
⚠️ Today’s U.S. PPI release at 8:30 AM ET could create significant volatility.
🕯️ Key Levels
🔴 Resistance: $4,418 → $4,434 → $4,450
🟡 Pivot: $4,400
🟢 Support: $4,380 → $4,360 → $4,340
🔵 Major downside: $4,310–$4,305
XAU/USD Key Trading Zones
Illustrative price levels for today's New York session based on the latest market structure.
Levels are scenario zones, not guaranteed targets.
📈 Bullish Setup
🟢 Above $4,400–$4,418, buyers remain favored.
🚀 A confirmed break above $4,434 could target $4,450–$4,475.
🕯️ Wait for a 5–15 minute candle confirmation/retest before entering.
📉 Bearish Setup
🔴 Rejection around $4,400–$4,418 could send gold toward $4,380 → $4,360.
💥 A decisive break below $4,340 could expose $4,310–$4,305.
🇺🇸 NY Session Game Plan
⏰ 8:30 AM ET: PPI/news volatility — avoid chasing the first spike.
🕯️ Let the initial move settle, then trade the confirmed breakout or reversal.
💵 Watch DXY and Treasury yields alongside gold.
⚠️ Keep leverage and position size controlled during the data release.
🎯 Overall Bias
🟢 Bullish above $4,418
🟡 Neutral between $4,380–$4,418
🔴 Bearish below $4,380
💥 Strong bearish confirmation below $4,340
🏷️ #XAUUSD #GoldDayTrading #NewYorkSessionTrading #GoldTechnicalAnalysis #GoldPriceAnalysis
$XAU
{future}(XAUUSDT)
GOLD (XAU/USD) — NEW YORK SESSION DAY-TRADING ANALYSIS & GAME PLAN
🥇 GOLD (XAU/USD) — NEW YORK SESSION DAY-TRADING PLAN
📅 September 10, 2026
📊 Market Overview
🟡 Gold is trading around $4,390–$4,400/oz after Wednesday’s strong rebound from approximately $4,342.
📈 Wednesday’s bullish candle pushed price toward $4,434, making this the key breakout level.
⚠️ Today’s U.S. PPI release at 8:30 AM ET could create significant volatility.
🕯️ Key Levels
🔴 Resistance: $4,418 → $4,434 → $4,450
🟡 Pivot: $4,400
🟢 Support: $4,380 → $4,360 → $4,340
🔵 Major downside: $4,310–$4,305
XAU/USD Key Trading Zones
Illustrative price levels for today's New York session based on the latest market structure.
Levels are scenario zones, not guaranteed targets.
📈 Bullish Setup
🟢 Above $4,400–$4,418, buyers remain favored.
🚀 A confirmed break above $4,434 could target $4,450–$4,475.
🕯️ Wait for a 5–15 minute candle confirmation/retest before entering.
📉 Bearish Setup
🔴 Rejection around $4,400–$4,418 could send gold toward $4,380 → $4,360.
💥 A decisive break below $4,340 could expose $4,310–$4,305.
🇺🇸 NY Session Game Plan
⏰ 8:30 AM ET: PPI/news volatility — avoid chasing the first spike.
🕯️ Let the initial move settle, then trade the confirmed breakout or reversal.
💵 Watch DXY and Treasury yields alongside gold.
⚠️ Keep leverage and position size controlled during the data release.
🎯 Overall Bias
🟢 Bullish above $4,418
🟡 Neutral between $4,380–$4,418
🔴 Bearish below $4,380
💥 Strong bearish confirmation below $4,340
🏷️ #XAUUSD #GoldDayTrading #NewYorkSessionTrading #GoldTechnicalAnalysis #GoldPriceAnalysis
$XAU
1
6
968
Log in to explore more content
Join global crypto users on Binance Square
⚡️ Get latest and useful information about crypto.
💬 Trusted by the world’s largest crypto exchange.
👍 Discover real insights from verified creators.
Email / Phone number
Trending Topics
1
#UniswapA16zSeekDeFiExemptionFromIllinoisCryptoTax
28,158 views
787 Discussing
2
#HKDollarStablecoinHKDAPToLaunchOnSolana
21,194 views
505 Discussing
3
#$1.5BInLeveragedCryptoBetsLiquidated
46,820 views
254 Discussing
4
#TrezorSaysCryptoBilisSoldWalletMayContainMaliciousComponents
3,732 views
73 Discussing
5
#KOSPIFalls3.53%BackBelow6000
65,106 views
1,113 Discussing
6
#AmazonSharesFallAbout7%InPremarketTrading
29,789 views
604 Discussing
7
#USMidtermElections
258,046 views
2,378 Discussing
8
#StrategySTRCReaches$99.95ForFirstTimeIn165Days
30,185 views
95 Discussing
9
#BinanceWillListPredictPREDICT
98,845 views
1,412 Discussing
10
#SwitzerlandFirstSpotBitcoinETFExpectedToTradeInNovember
3,246 views
112 Discussing