

#cryptoinsights
cryptoinsights
10.9M views
16,242 Discussing
Hot
Latest

·
--
Bullish
🔥 $MOVR — Is the Rally Ready for Another Leg Up? 🚀
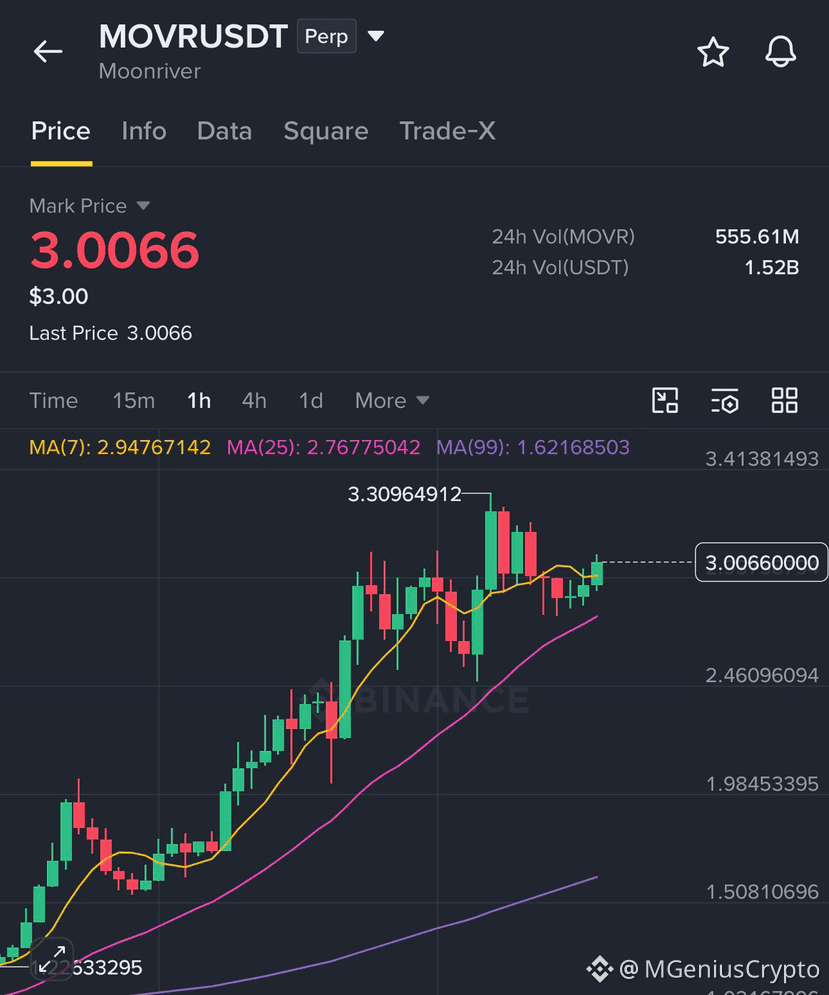
MOVR is still showing strong bullish momentum, and the rally doesn’t look exhausted yet.
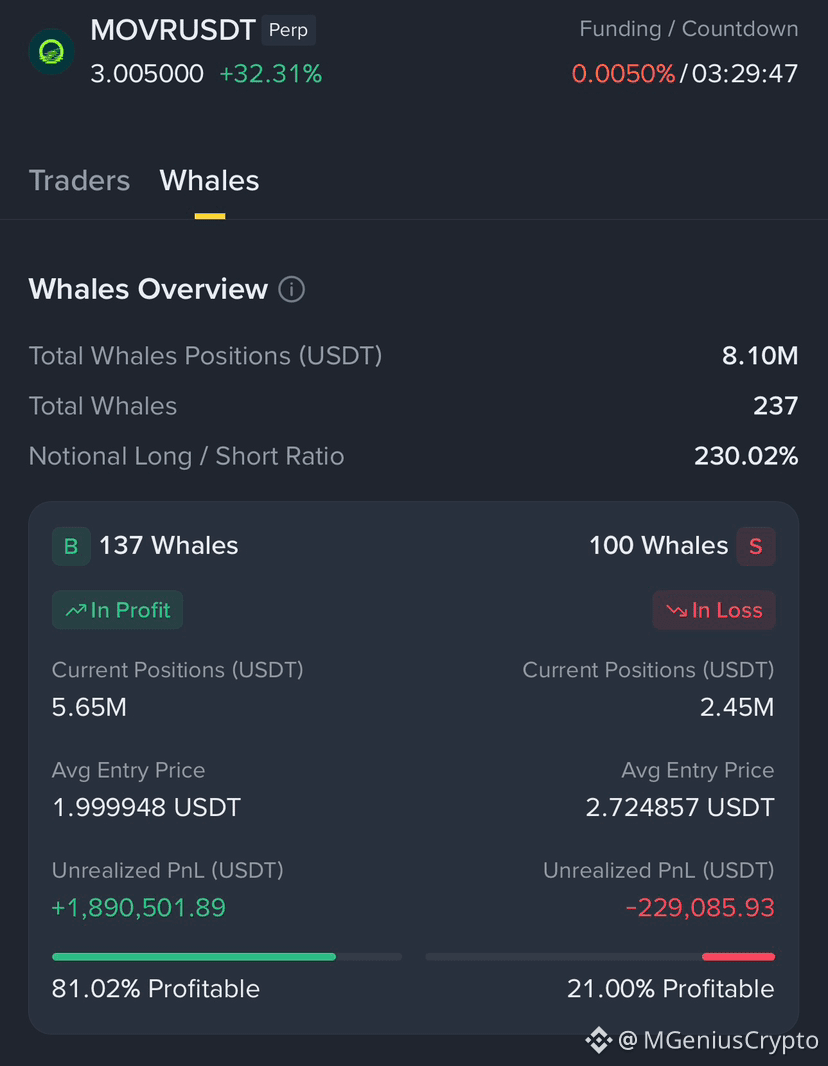
🐋 Whale positioning is especially interesting:
• 69.7% of whale capital is in LONG positions
• Long/Short notional ratio: 230%
• 81% of long whales are currently profitable
• Shorts entered around $2.72 on average and are currently under pressure
• Positive funding suggests longs are paying shorts, while continued upside could increase short-squeeze pressure.
With MOVR trading around the $3 area, the big question is:
🎯 Can MOVR push toward $3.50 — or even $4 today?
The whale positioning supports the bullish narrative, but after such a sharp rally, a sudden pullback is also possible. $3.50 and $4 should be viewed as potential levels, not guaranteed targets.
🐋 What do you think — $3.50 first, or can MOVR reach $4? Comment below👇
#binance #crypto #trading #CryptoInsights #KoreaProposesTokenizingStocksAndBonds
{future}(MOVRUSDT)
🔥 $MOVR — Is the Rally Ready for Another Leg Up? 🚀
MOVR is still showing strong bullish momentum, and the rally doesn’t look exhausted yet.
🐋 Whale positioning is especially interesting:
• 69.7% of whale capital is in LONG positions
• Long/Short notional ratio: 230%
• 81% of long whales are currently profitable
• Shorts entered around $2.72 on average and are currently under pressure
• Positive funding suggests longs are paying shorts, while continued upside could increase short-squeeze pressure.
With MOVR trading around the $3 area, the big question is:
🎯 Can MOVR push toward $3.50 — or even $4 today?
The whale positioning supports the bullish narrative, but after such a sharp rally, a sudden pullback is also possible. $3.50 and $4 should be viewed as potential levels, not guaranteed targets.
🐋 What do you think — $3.50 first, or can MOVR reach $4 ? Comment below👇
#binance #crypto #trading #CryptoInsights #KoreaProposesTokenizingStocksAndBonds
MOVR is still showing strong bullish momentum, and the rally doesn’t look exhausted yet.
🐋 Whale positioning is especially interesting:
• 69.7% of whale capital is in LONG positions
• Long/Short notional ratio: 230%
• 81% of long whales are currently profitable
• Shorts entered around $2.72 on average and are currently under pressure
• Positive funding suggests longs are paying shorts, while continued upside could increase short-squeeze pressure.
With MOVR trading around the $3 area, the big question is:
🎯 Can MOVR push toward $3.50 — or even $4 today?
The whale positioning supports the bullish narrative, but after such a sharp rally, a sudden pullback is also possible. $3.50 and $4 should be viewed as potential levels, not guaranteed targets.
🐋 What do you think — $3.50 first, or can MOVR reach $4 ? Comment below👇
#binance #crypto #trading #CryptoInsights #KoreaProposesTokenizingStocksAndBonds
1
417

Bitcoin is demonstrating significant resilience, consolidating above crucial support levels despite recent fluctuations across the broader crypto landscape. This underlying strength hints at persistent investor interest and a strong base of long-term holders. A clear opportunity lies in potential accumulation during this current range-bound movement, particularly if BTC prepares for an upward breakout towards testing prior resistance zones. However, the immediate risk remains a potential breakdown from these established support floors, which could lead to further retracement and activate stop-losses for those positioned on the long side. Monitoring volume will be key for confirmation. Are you expecting an imminent rally or further consolidation for BTC?
#Bitcoin #CryptoInsights #TradingSignals
Bitcoin is demonstrating significant resilience, consolidating above crucial support levels despite recent fluctuations across the broader crypto landscape. This underlying strength hints at persistent investor interest and a strong base of long-term holders. A clear opportunity lies in potential accumulation during this current range-bound movement, particularly if BTC prepares for an upward breakout towards testing prior resistance zones. However, the immediate risk remains a potential breakdown from these established support floors, which could lead to further retracement and activate stop-losses for those positioned on the long side. Monitoring volume will be key for confirmation. Are you expecting an imminent rally or further consolidation for BTC?
#Bitcoin #CryptoInsights #TradingSignals
#Bitcoin #CryptoInsights #TradingSignals
83

·
--
Every Layer 1 runs two businesses at once: an app store and a courthouse.
The app store competes on throughput, latency, UX. The courthouse is quieter — settlement guarantees, neutrality, and the security budget that pays for all of it.
Heres the tension that never makes it into the TPS charts: cheap blockspace is great UX, but it shrinks the fee revenue that pays validators once issuance subsidies fade. Chains that race toward zero fees are, in effect, renting their security from token inflation — and that bill comes due when emissions taper.
The metric that actually ranks L1s isnt transactions per second. Its annualized real fee revenue versus the cost of issuance. A persistent surplus means users fund security. A persistent deficit means holders fund security — silently, through dilution.
$ETH made the hardest trade here: scale through rollups while keeping the base layer expensive enough to pay for its own defense. $SOL is proving volume can grow fast enough to offset falling unit fees. $BNB shows what a burn-backed supply sink does to the math over a full cycle.
Dont grade chains on their benchmark dashboard. Grade the security budget — its the only invoice that never goes away.
#Layer1 #Crypto #Blockchain #CryptoInsights
Every Layer 1 runs two businesses at once: an app store and a courthouse.
The app store competes on throughput, latency, UX. The courthouse is quieter — settlement guarantees, neutrality, and the security budget that pays for all of it.
Heres the tension that never makes it into the TPS charts: cheap blockspace is great UX, but it shrinks the fee revenue that pays validators once issuance subsidies fade. Chains that race toward zero fees are, in effect, renting their security from token inflation — and that bill comes due when emissions taper.
The metric that actually ranks L1s isnt transactions per second. Its annualized real fee revenue versus the cost of issuance. A persistent surplus means users fund security. A persistent deficit means holders fund security — silently, through dilution.
$ETH made the hardest trade here: scale through rollups while keeping the base layer expensive enough to pay for its own defense. $SOL is proving volume can grow fast enough to offset falling unit fees. $BNB shows what a burn-backed supply sink does to the math over a full cycle.
Dont grade chains on their benchmark dashboard. Grade the security budget — its the only invoice that never goes away.
#Layer1 #Crypto #Blockchain #CryptoInsights
The app store competes on throughput, latency, UX. The courthouse is quieter — settlement guarantees, neutrality, and the security budget that pays for all of it.
Heres the tension that never makes it into the TPS charts: cheap blockspace is great UX, but it shrinks the fee revenue that pays validators once issuance subsidies fade. Chains that race toward zero fees are, in effect, renting their security from token inflation — and that bill comes due when emissions taper.
The metric that actually ranks L1s isnt transactions per second. Its annualized real fee revenue versus the cost of issuance. A persistent surplus means users fund security. A persistent deficit means holders fund security — silently, through dilution.
$ETH made the hardest trade here: scale through rollups while keeping the base layer expensive enough to pay for its own defense. $SOL is proving volume can grow fast enough to offset falling unit fees. $BNB shows what a burn-backed supply sink does to the math over a full cycle.
Dont grade chains on their benchmark dashboard. Grade the security budget — its the only invoice that never goes away.
#Layer1 #Crypto #Blockchain #CryptoInsights
120

·
--
**The Bull Roars! 🐂 $BTC Unstoppable—Which Altcoin Will Lead the Next Wave?**
Attention, #BinanceSquare! 🚨 The crypto market is buzzing on September 28, 2026. $BTC continues its triumphant march, firmly consolidating above 83,000 USDT. With a current price of **83555.77 USDT**, the king shows undeniable strength, laying a solid foundation for the next big move. Institutional and retail confidence is at its highest! 📈
While the king sets the pace, my expert eye is on $SOL. At **118.96 USDT**, Solana presents an incredibly robust technical structure, with clean consolidation and growing volume. Its flourishing DeFi and Gaming ecosystem, along with superior scalability, position it as an altcoin with explosive potential to capture the next wave of capital. Get ready for liftoff! 🚀
What’s your hidden gem for this bullish season? Comment below! 👇
#CryptoInsights #Altcoins
**The Bull Roars! 🐂 $BTC Unstoppable—Which Altcoin Will Lead the Next Wave?**
Attention, #BinanceSquare! 🚨 The crypto market is buzzing on September 28, 2026. $BTC continues its triumphant march, firmly consolidating above 83,000 USDT. With a current price of **83555.77 USDT**, the king shows undeniable strength, laying a solid foundation for the next big move. Institutional and retail confidence is at its highest! 📈
While the king sets the pace, my expert eye is on $SOL . At **118.96 USDT**, Solana presents an incredibly robust technical structure, with clean consolidation and growing volume. Its flourishing DeFi and Gaming ecosystem, along with superior scalability, position it as an altcoin with explosive potential to capture the next wave of capital. Get ready for liftoff! 🚀
What’s your hidden gem for this bullish season? Comment below! 👇
#CryptoInsights #Altcoins
Attention, #BinanceSquare! 🚨 The crypto market is buzzing on September 28, 2026. $BTC continues its triumphant march, firmly consolidating above 83,000 USDT. With a current price of **83555.77 USDT**, the king shows undeniable strength, laying a solid foundation for the next big move. Institutional and retail confidence is at its highest! 📈
While the king sets the pace, my expert eye is on $SOL . At **118.96 USDT**, Solana presents an incredibly robust technical structure, with clean consolidation and growing volume. Its flourishing DeFi and Gaming ecosystem, along with superior scalability, position it as an altcoin with explosive potential to capture the next wave of capital. Get ready for liftoff! 🚀
What’s your hidden gem for this bullish season? Comment below! 👇
#CryptoInsights #Altcoins
164
·
--
🚀 Get ready for $BTC UNSTOPPABLE! READY FOR THE NEXT EXPLOSION? 🔥
Binance Square friends, the market is on fire! $BTC keeps surprising us, consolidating with an incredible force at **84607.89 USDT**. This level is a testament to the confidence and bullish momentum taking over the crypto space. We’re in price-discovery territory! 📈 Bitcoin’s resilience is astonishing, paving the way for the rest of the market.
While $BTC roars, my radar is aimed at $SOL. Trading at **122.84 USDT**, Solana is building an extremely solid foundation. Its robust ecosystem in DeFi, GameFi, and NFTs—along with its scalability and low fees—makes it a top candidate for a massive rotation of capital. It’s a gem with explosive potential! 💎
Now, the key question: What’s your favorite altcoin for this cycle and why? I’m reading your comments! 👇
#CryptoInsights #AltcoinGems
🚀 Get ready for $BTC UNSTOPPABLE! READY FOR THE NEXT EXPLOSION? 🔥
Binance Square friends, the market is on fire! $BTC keeps surprising us, consolidating with an incredible force at **84607.89 USDT**. This level is a testament to the confidence and bullish momentum taking over the crypto space. We’re in price-discovery territory! 📈 Bitcoin’s resilience is astonishing, paving the way for the rest of the market.
While $BTC roars, my radar is aimed at $SOL . Trading at **122.84 USDT**, Solana is building an extremely solid foundation. Its robust ecosystem in DeFi, GameFi, and NFTs—along with its scalability and low fees—makes it a top candidate for a massive rotation of capital. It’s a gem with explosive potential! 💎
Now, the key question: What’s your favorite altcoin for this cycle and why? I’m reading your comments! 👇
#CryptoInsights #AltcoinGems
Binance Square friends, the market is on fire! $BTC keeps surprising us, consolidating with an incredible force at **84607.89 USDT**. This level is a testament to the confidence and bullish momentum taking over the crypto space. We’re in price-discovery territory! 📈 Bitcoin’s resilience is astonishing, paving the way for the rest of the market.
While $BTC roars, my radar is aimed at $SOL . Trading at **122.84 USDT**, Solana is building an extremely solid foundation. Its robust ecosystem in DeFi, GameFi, and NFTs—along with its scalability and low fees—makes it a top candidate for a massive rotation of capital. It’s a gem with explosive potential! 💎
Now, the key question: What’s your favorite altcoin for this cycle and why? I’m reading your comments! 👇
#CryptoInsights #AltcoinGems
113

·
--
Bullish
Crypto week of Sep 21–25: ETFs pushed prices higher, short squeeze amplified the move, but BTC failed to hold the $87,400 area
📈 Bitcoin opened the week around $80,000–81,000, surged to roughly $87,300–87,400, then eased back toward $84,000 by the end of the week. The rally coincided with strong ETF inflows and heavy short liquidations, while several altcoins outperformed BTC.
💰 U.S. spot Bitcoin ETFs attracted about $2.4 billion across five sessions, including nearly 1 billion on Sep 21 alone. Importantly, flows remained positive in the final two sessions even as BTC moved away from its peak, suggesting the pullback was not accompanied by a clear reversal in ETF demand.
⚡ Around $635 million in short positions were liquidated within 24 hours on Sep 21, amplifying the upside move. Afterward, BTC open interest on Binance fell nearly 13% while price declined only modestly, indicating much of the squeeze-driven positioning had been cleared rather than immediately replaced by a new layer of leveraged longs.
🏦 On-chain data also showed roughly 29,800 BTC leaving exchanges over seven days. BTC falling from $87,400 toward $84,000 while exchange flows remained net negative suggests readily available sell-side supply on CEXs did not rise in proportion to the price decline.
🔄 Ethereum ETFs also recorded around $690 million in inflows over five sessions. ETH price performance lagged some altcoins, but improving ETF demand showed that institutional buying was not limited to Bitcoin.
📊 After the squeeze, funding on several exchanges moved back toward low or negative levels, while total stablecoin supply remained around $305–312 billion. The structure suggests underlying liquidity remains in the market, but a sustained break above $87,400 may require renewed spot demand rather than another short squeeze alone.
#CryptoInsights $BTC
Crypto week of Sep 21–25: ETFs pushed prices higher, short squeeze amplified the move, but BTC failed to hold the $87,400 area
📈 Bitcoin opened the week around $80,000–81,000, surged to roughly $87,300–87,400, then eased back toward $84,000 by the end of the week. The rally coincided with strong ETF inflows and heavy short liquidations, while several altcoins outperformed BTC.
💰 U.S. spot Bitcoin ETFs attracted about $2.4 billion across five sessions, including nearly 1 billion on Sep 21 alone. Importantly, flows remained positive in the final two sessions even as BTC moved away from its peak, suggesting the pullback was not accompanied by a clear reversal in ETF demand.
⚡ Around $635 million in short positions were liquidated within 24 hours on Sep 21, amplifying the upside move. Afterward, BTC open interest on Binance fell nearly 13% while price declined only modestly, indicating much of the squeeze-driven positioning had been cleared rather than immediately replaced by a new layer of leveraged longs.
🏦 On-chain data also showed roughly 29,800 BTC leaving exchanges over seven days. BTC falling from $87,400 toward $84,000 while exchange flows remained net negative suggests readily available sell-side supply on CEXs did not rise in proportion to the price decline.
🔄 Ethereum ETFs also recorded around $690 million in inflows over five sessions. ETH price performance lagged some altcoins, but improving ETF demand showed that institutional buying was not limited to Bitcoin.
📊 After the squeeze, funding on several exchanges moved back toward low or negative levels, while total stablecoin supply remained around $305–312 billion. The structure suggests underlying liquidity remains in the market, but a sustained break above $87,400 may require renewed spot demand rather than another short squeeze alone.
#CryptoInsights $BTC
📈 Bitcoin opened the week around $80,000–81,000, surged to roughly $87,300–87,400, then eased back toward $84,000 by the end of the week. The rally coincided with strong ETF inflows and heavy short liquidations, while several altcoins outperformed BTC.
💰 U.S. spot Bitcoin ETFs attracted about $2.4 billion across five sessions, including nearly 1 billion on Sep 21 alone. Importantly, flows remained positive in the final two sessions even as BTC moved away from its peak, suggesting the pullback was not accompanied by a clear reversal in ETF demand.
⚡ Around $635 million in short positions were liquidated within 24 hours on Sep 21, amplifying the upside move. Afterward, BTC open interest on Binance fell nearly 13% while price declined only modestly, indicating much of the squeeze-driven positioning had been cleared rather than immediately replaced by a new layer of leveraged longs.
🏦 On-chain data also showed roughly 29,800 BTC leaving exchanges over seven days. BTC falling from $87,400 toward $84,000 while exchange flows remained net negative suggests readily available sell-side supply on CEXs did not rise in proportion to the price decline.
🔄 Ethereum ETFs also recorded around $690 million in inflows over five sessions. ETH price performance lagged some altcoins, but improving ETF demand showed that institutional buying was not limited to Bitcoin.
📊 After the squeeze, funding on several exchanges moved back toward low or negative levels, while total stablecoin supply remained around $305–312 billion. The structure suggests underlying liquidity remains in the market, but a sustained break above $87,400 may require renewed spot demand rather than another short squeeze alone.
#CryptoInsights $BTC

1
35
·
--
Most on-chain metrics measure activity. The underrated ones measure the absence of it.
Every coin carries an invisible timestamp: how long since it last moved. Dormancy — often framed as coin-days — is the aggregate of those timestamps, and it tells you something volume never will: whether current owners intend to hold, or are merely renting their position.
A market with high churn is a rental market. Coins circulate fast, ownership is shallow, and price gets set by short-term flows. A market with rising dormancy is an ownership market: supply stacks into hands that do not flinch on +10% days or -10% days. That is where trends get their fuel.
The signal is not the level — it is the change. When the share of supply untouched for six months or more keeps growing through new highs, patient capital is still absorbing. When that cohort share flattens or rolls over while price pushes higher, the bid has quietly shifted from holders to renters. Tops built on rented supply do not need much of an excuse to unwind.
Activity gets the headlines. The refusal to sell is the quieter, stronger signal — and it is readable on-chain weeks before it shows up in price.
$BTC $ETH $SOL
#OnChainAnalysis #Bitcoin #CryptoInsights #MarketStructure
Most on-chain metrics measure activity. The underrated ones measure the absence of it.
Every coin carries an invisible timestamp: how long since it last moved. Dormancy — often framed as coin-days — is the aggregate of those timestamps, and it tells you something volume never will: whether current owners intend to hold, or are merely renting their position.
A market with high churn is a rental market. Coins circulate fast, ownership is shallow, and price gets set by short-term flows. A market with rising dormancy is an ownership market: supply stacks into hands that do not flinch on +10% days or -10% days. That is where trends get their fuel.
The signal is not the level — it is the change. When the share of supply untouched for six months or more keeps growing through new highs, patient capital is still absorbing. When that cohort share flattens or rolls over while price pushes higher, the bid has quietly shifted from holders to renters. Tops built on rented supply do not need much of an excuse to unwind.
Activity gets the headlines. The refusal to sell is the quieter, stronger signal — and it is readable on-chain weeks before it shows up in price.
$BTC $ETH $SOL
#OnChainAnalysis #Bitcoin #CryptoInsights #MarketStructure
Every coin carries an invisible timestamp: how long since it last moved. Dormancy — often framed as coin-days — is the aggregate of those timestamps, and it tells you something volume never will: whether current owners intend to hold, or are merely renting their position.
A market with high churn is a rental market. Coins circulate fast, ownership is shallow, and price gets set by short-term flows. A market with rising dormancy is an ownership market: supply stacks into hands that do not flinch on +10% days or -10% days. That is where trends get their fuel.
The signal is not the level — it is the change. When the share of supply untouched for six months or more keeps growing through new highs, patient capital is still absorbing. When that cohort share flattens or rolls over while price pushes higher, the bid has quietly shifted from holders to renters. Tops built on rented supply do not need much of an excuse to unwind.
Activity gets the headlines. The refusal to sell is the quieter, stronger signal — and it is readable on-chain weeks before it shows up in price.
$BTC $ETH $SOL
#OnChainAnalysis #Bitcoin #CryptoInsights #MarketStructure
1
150
·
--
Diversification is the first thing that dies in a crypto crash.
Portfolios of ten altcoins feel diversified. They aren't. They're one trade - leveraged beta on $BTC - wearing different tickers.
Correlation data is unforgiving. In calm markets, $ETH and $SOL print pairwise correlations of 0.3-0.6, and spreading capital across chains feels like genuine risk reduction. Then the drawdown arrives and correlations converge toward 1.0. Everything sells together, because the marginal seller isn't selling a thesis - they're selling risk. Margin calls, fund redemptions, and liquidations don't ask which sector you preferred.
This is the classic failure mode of diversification: it works precisely when you don't need it, and vanishes precisely when you do.
Two honest implications:
1. A ten-coin portfolio isn't ten bets. It's one bet on crypto liquidity, sized ten times larger than any single position. Manage exposure at the portfolio level, not the token level.
2. The diversifiers that survive stress are structural: uncorrelated cash, time (staggered entries instead of lump sums), and position sizing that assumes everything correlates at the worst moment.
Real diversification in crypto isn't owning more assets. It's owning the same asset class with less leverage and more patience.
Correlations converge in a crash. Build for the crash, not the calm.
#RiskManagement #PortfolioStrategy #CryptoTrading #CryptoInsights
Diversification is the first thing that dies in a crypto crash.
Portfolios of ten altcoins feel diversified. They aren't. They're one trade - leveraged beta on $BTC - wearing different tickers.
Correlation data is unforgiving. In calm markets, $ETH and $SOL print pairwise correlations of 0.3-0.6, and spreading capital across chains feels like genuine risk reduction. Then the drawdown arrives and correlations converge toward 1.0. Everything sells together, because the marginal seller isn't selling a thesis - they're selling risk. Margin calls, fund redemptions, and liquidations don't ask which sector you preferred.
This is the classic failure mode of diversification: it works precisely when you don't need it, and vanishes precisely when you do.
Two honest implications:
1. A ten-coin portfolio isn't ten bets. It's one bet on crypto liquidity, sized ten times larger than any single position. Manage exposure at the portfolio level, not the token level.
2. The diversifiers that survive stress are structural: uncorrelated cash, time (staggered entries instead of lump sums), and position sizing that assumes everything correlates at the worst moment.
Real diversification in crypto isn't owning more assets. It's owning the same asset class with less leverage and more patience.
Correlations converge in a crash. Build for the crash, not the calm.
#RiskManagement #PortfolioStrategy #CryptoTrading #CryptoInsights
Portfolios of ten altcoins feel diversified. They aren't. They're one trade - leveraged beta on $BTC - wearing different tickers.
Correlation data is unforgiving. In calm markets, $ETH and $SOL print pairwise correlations of 0.3-0.6, and spreading capital across chains feels like genuine risk reduction. Then the drawdown arrives and correlations converge toward 1.0. Everything sells together, because the marginal seller isn't selling a thesis - they're selling risk. Margin calls, fund redemptions, and liquidations don't ask which sector you preferred.
This is the classic failure mode of diversification: it works precisely when you don't need it, and vanishes precisely when you do.
Two honest implications:
1. A ten-coin portfolio isn't ten bets. It's one bet on crypto liquidity, sized ten times larger than any single position. Manage exposure at the portfolio level, not the token level.
2. The diversifiers that survive stress are structural: uncorrelated cash, time (staggered entries instead of lump sums), and position sizing that assumes everything correlates at the worst moment.
Real diversification in crypto isn't owning more assets. It's owning the same asset class with less leverage and more patience.
Correlations converge in a crash. Build for the crash, not the calm.
#RiskManagement #PortfolioStrategy #CryptoTrading #CryptoInsights
66

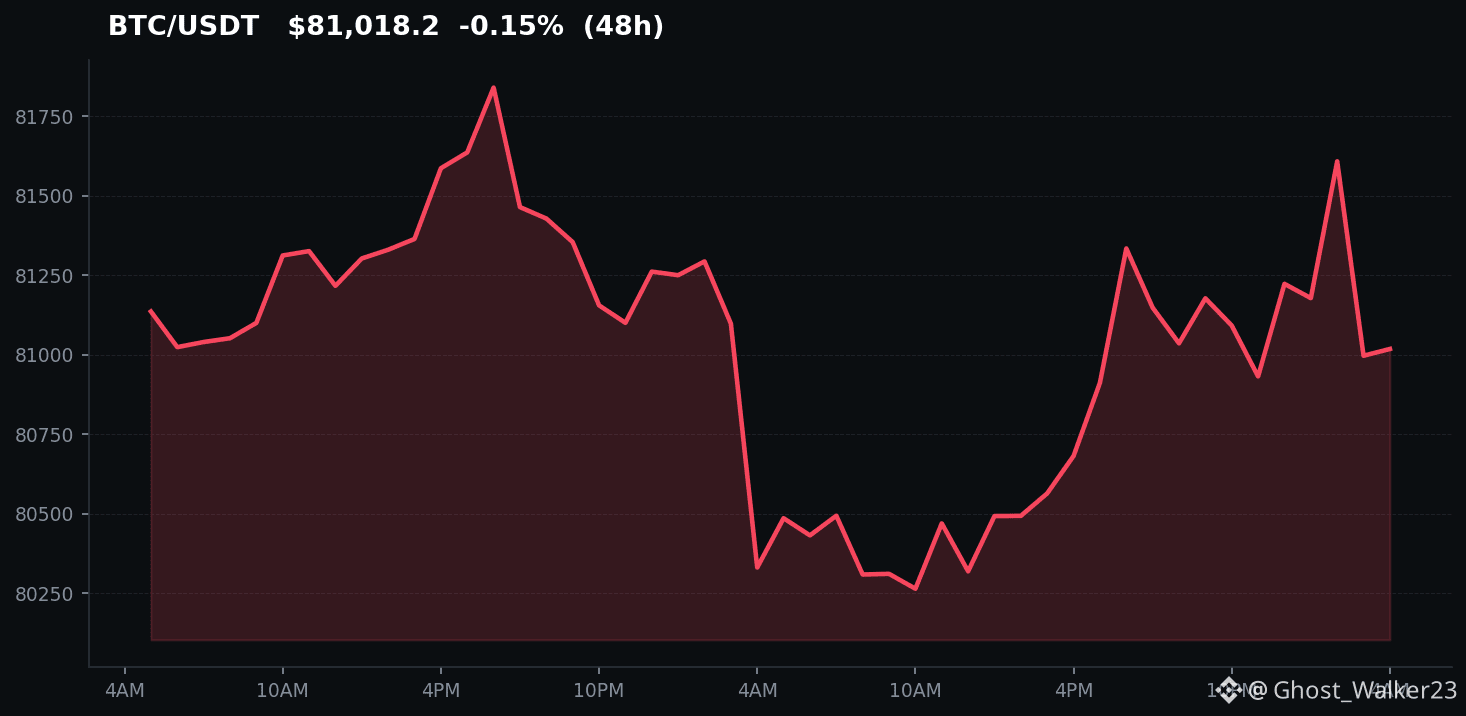
🚀 With the price of $BTC hovering at $81,021.39, and whispers from Michael Saylor hinting at potential strategies for future buys, many are curious about market movements. As you can see below, trends suggest an uptick in interest for Bitcoin despite minor fluctuations. 📊
Meanwhile, $ETH is gaining traction, currently trading at $2,649.35 (+1.15%). Are you considering a strategy shift as the crypto landscape evolves? 💡
#SaylorHintsStrategyBitcoinBuy #CryptoInsights
👀 Síguenos para estar pendiente de las próximas oportunidades.
🚀 With the price of $BTC hovering at $81,021.39, and whispers from Michael Saylor hinting at potential strategies for future buys, many are curious about market movements. As you can see below, trends suggest an uptick in interest for Bitcoin despite minor fluctuations. 📊
Meanwhile, $ETH is gaining traction, currently trading at $2,649.35 (+1.15%). Are you considering a strategy shift as the crypto landscape evolves? 💡
#SaylorHintsStrategyBitcoinBuy #CryptoInsights
👀 Síguenos para estar pendiente de las próximas oportunidades.
Meanwhile, $ETH is gaining traction, currently trading at $2,649.35 (+1.15%). Are you considering a strategy shift as the crypto landscape evolves? 💡
#SaylorHintsStrategyBitcoinBuy #CryptoInsights
👀 Síguenos para estar pendiente de las próximas oportunidades.
79

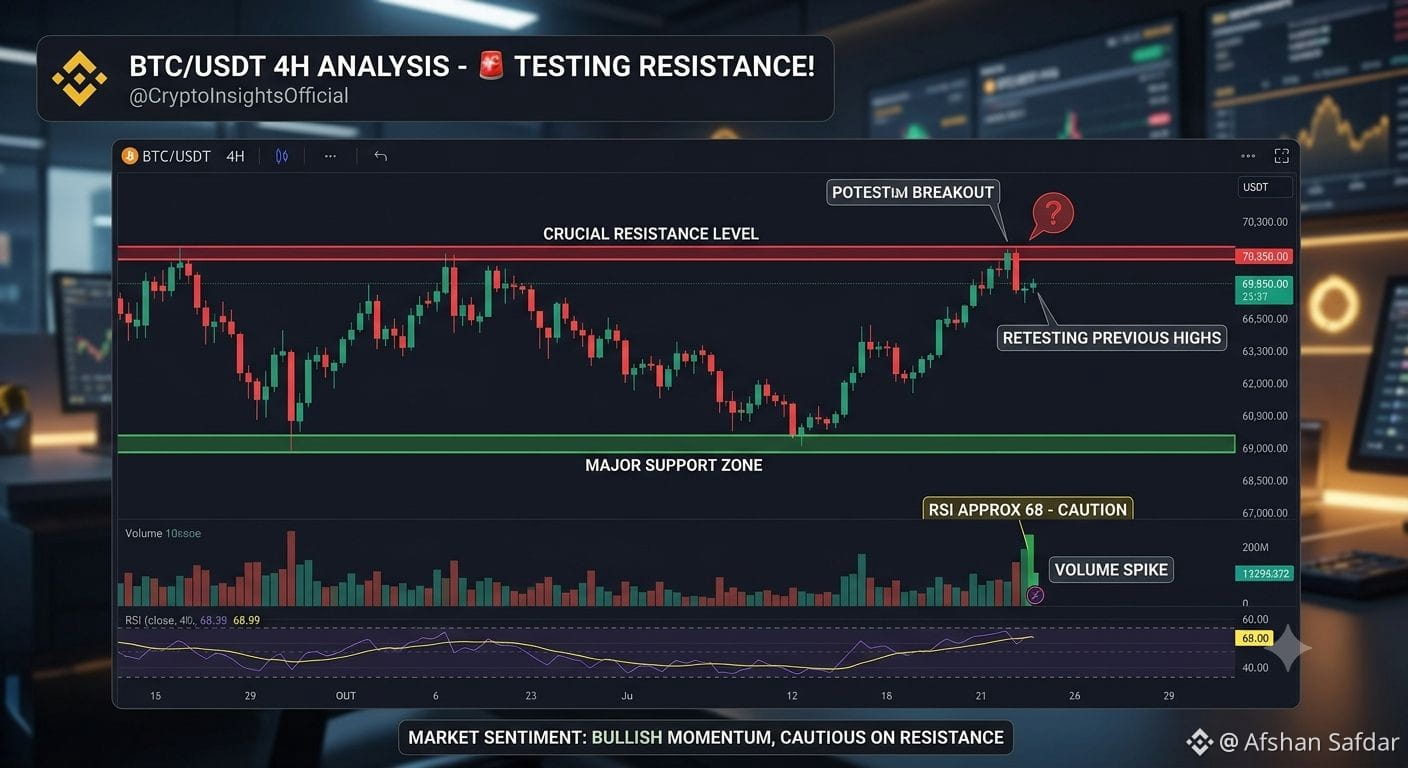
🚨 $BTC Resistance Test: Breakout or Fakeout? 👀
Bitcoin is testing a key resistance zone after a strong rebound. Volume is building, but traders are watching closely for confirmation.
📊 Key Technicals
Resistance: Key swing high level. A daily close above opens targets to higher liquidity.
Support: Strong buyer demand remains intact at lower levels.
RSI: Short-term overbought, signaling possible sideways consolidation before the next push.
💡 Quick Strategy
Wait for Confirmation: Avoid buying directly into resistance; look for a successful retest of support.
Manage Risk: Keep stop-losses strict against sudden volatility.
👇 Breakout or retest first? Drop your thoughts below!
#CryptoInsights #Bitcoin #BTC #cryptotrading
$BTC $BITCOIN
{spot}(BTCUSDT)
🚨 $BTC Resistance Test: Breakout or Fakeout? 👀
Bitcoin is testing a key resistance zone after a strong rebound. Volume is building, but traders are watching closely for confirmation.
📊 Key Technicals
Resistance: Key swing high level. A daily close above opens targets to higher liquidity.
Support: Strong buyer demand remains intact at lower levels.
RSI: Short-term overbought, signaling possible sideways consolidation before the next push.
💡 Quick Strategy
Wait for Confirmation: Avoid buying directly into resistance; look for a successful retest of support.
Manage Risk: Keep stop-losses strict against sudden volatility.
👇 Breakout or retest first? Drop your thoughts below!
#CryptoInsights #Bitcoin #BTC #cryptotrading
$BTC $BITCOIN
Bitcoin is testing a key resistance zone after a strong rebound. Volume is building, but traders are watching closely for confirmation.
📊 Key Technicals
Resistance: Key swing high level. A daily close above opens targets to higher liquidity.
Support: Strong buyer demand remains intact at lower levels.
RSI: Short-term overbought, signaling possible sideways consolidation before the next push.
💡 Quick Strategy
Wait for Confirmation: Avoid buying directly into resistance; look for a successful retest of support.
Manage Risk: Keep stop-losses strict against sudden volatility.
👇 Breakout or retest first? Drop your thoughts below!
#CryptoInsights #Bitcoin #BTC #cryptotrading
$BTC $BITCOIN
1
55

·
--

Article
The Silent Portfolio Killer: Why Your Favorite Altcoin Keeps Bleeding 🩸📉Ever bought an altcoin with great tech, massive hype, and an amazing community, yet the price just keeps dropping?
You are probably ignoring one of the most crucial metrics in crypto: Token Unlocks and FDV (Fully Diluted Valuation).
Here is the harsh reality: A project can be revolutionary, but if only 10% or 20% of its total supply is currently circulating, you are likely just exit liquidity for early venture capitalists. When millions of new tokens are unlocked and dumped into the market every month, the price will naturally bleed out due to inflation—even if the buying demand stays exactly the same.
How to protect your capital:
Check the Supply: Always compare the Circulating Supply with the Total Supply. If the gap is massive, proceed with extreme caution.Track Unlock Schedules: Never open a long position right before a massive "cliff" unlock event. Respect the King: This is exactly why $BTC remains the ultimate safe haven. Its inflation schedule is transparent, predictable, and constantly shrinking (Halving).
Before you ape into the next shiny altcoin, check the tokenomics. Good tech doesn't always equal a good price.
Do you actively track token unlocks before buying, or do you rely purely on technical analysis? Let's discuss below! 👇
#CryptoInsights #Tokenomics #TradingStrategy #BinanceSquare
$BTC $ARB $SUI
The Silent Portfolio Killer: Why Your Favorite Altcoin Keeps Bleeding 🩸📉
Ever bought an altcoin with great tech, massive hype, and an amazing community, yet the price just keeps dropping?
You are probably ignoring one of the most crucial metrics in crypto: Token Unlocks and FDV (Fully Diluted Valuation).
Here is the harsh reality: A project can be revolutionary, but if only 10% or 20% of its total supply is currently circulating, you are likely just exit liquidity for early venture capitalists. When millions of new tokens are unlocked and dumped into the market every month, the price will naturally bleed out due to inflation—even if the buying demand stays exactly the same.
How to protect your capital:
Check the Supply: Always compare the Circulating Supply with the Total Supply. If the gap is massive, proceed with extreme caution.Track Unlock Schedules: Never open a long position right before a massive "cliff" unlock event. Respect the King: This is exactly why $BTC remains the ultimate safe haven. Its inflation schedule is transparent, predictable, and constantly shrinking (Halving).
Before you ape into the next shiny altcoin, check the tokenomics. Good tech doesn't always equal a good price.
Do you actively track token unlocks before buying, or do you rely purely on technical analysis? Let's discuss below! 👇
#CryptoInsights #Tokenomics #TradingStrategy #BinanceSquare
$BTC $ARB $SUI
You are probably ignoring one of the most crucial metrics in crypto: Token Unlocks and FDV (Fully Diluted Valuation).
Here is the harsh reality: A project can be revolutionary, but if only 10% or 20% of its total supply is currently circulating, you are likely just exit liquidity for early venture capitalists. When millions of new tokens are unlocked and dumped into the market every month, the price will naturally bleed out due to inflation—even if the buying demand stays exactly the same.
How to protect your capital:
Check the Supply: Always compare the Circulating Supply with the Total Supply. If the gap is massive, proceed with extreme caution.Track Unlock Schedules: Never open a long position right before a massive "cliff" unlock event. Respect the King: This is exactly why $BTC remains the ultimate safe haven. Its inflation schedule is transparent, predictable, and constantly shrinking (Halving).
Before you ape into the next shiny altcoin, check the tokenomics. Good tech doesn't always equal a good price.
Do you actively track token unlocks before buying, or do you rely purely on technical analysis? Let's discuss below! 👇
#CryptoInsights #Tokenomics #TradingStrategy #BinanceSquare
$BTC $ARB $SUI
90

·
--
#CryptoInsights 👁️ The “Matrix Effect”: Why 90% of traders lose money when the market is green 🟩
Post body:
There’s an unwritten paradox in cryptocurrency trading: the worst financial decisions almost never happen during a Crash—they happen during days of euphoria.
Psychologically, when the market turns green, your brain activates the same dopamine circuit as a slot machine. You stop analyzing projects and start calculating how much money you would have made if you had invested more.
That thought has a name in behavioral finance: Bias of Retrospective Bias and Projected Euphoria.
Here’s the mental map that distinguishes an average investor from a professional when green candles dominate the screen:
The Average Investor:
Sees a coin rise +40% in 24 hours.
Feels the urgency not to miss out (FOMO).
Buys at the peak of the candle.
Acts as “exit liquidity” for the big funds.
The Professional Trader:
Sees a coin rise +40% in 24 hours.
Executes a partial Take Profit to secure capital.
Moves the Stop Loss to a profit zone.
Reassigns liquidity to strong projects that haven’t exploded yet.
💡 The Inverse Mirror Rule:
If the idea of buying scares you because the market is red, it’s probably a good time to analyze entries. If you feel an uncontrollable urge to buy because everything is going up, then you’re already late.
The market’s secret isn’t guessing the future—it’s mastering the chemistry of your brain before you press the Trade button.
💬 What’s been the most expensive lesson the market’s euphoria has taught you? I’m listening in the comments. 👇
#BinanceSquare
#Write2Earn
#Binance
#tradingtips
#CryptoInsights 👁️ The “Matrix Effect”: Why 90% of traders lose money when the market is green 🟩
Post body:
There’s an unwritten paradox in cryptocurrency trading: the worst financial decisions almost never happen during a Crash—they happen during days of euphoria.
Psychologically, when the market turns green, your brain activates the same dopamine circuit as a slot machine. You stop analyzing projects and start calculating how much money you would have made if you had invested more.
That thought has a name in behavioral finance: Bias of Retrospective Bias and Projected Euphoria.
Here’s the mental map that distinguishes an average investor from a professional when green candles dominate the screen:
The Average Investor:
Sees a coin rise +40% in 24 hours.
Feels the urgency not to miss out (FOMO).
Buys at the peak of the candle.
Acts as “exit liquidity” for the big funds.
The Professional Trader:
Sees a coin rise +40% in 24 hours.
Executes a partial Take Profit to secure capital.
Moves the Stop Loss to a profit zone.
Reassigns liquidity to strong projects that haven’t exploded yet.
💡 The Inverse Mirror Rule:
If the idea of buying scares you because the market is red, it’s probably a good time to analyze entries. If you feel an uncontrollable urge to buy because everything is going up, then you’re already late.
The market’s secret isn’t guessing the future—it’s mastering the chemistry of your brain before you press the Trade button.
💬 What’s been the most expensive lesson the market’s euphoria has taught you? I’m listening in the comments. 👇
#BinanceSquare
#Write2Earn
#Binance
#tradingtips
Post body:
There’s an unwritten paradox in cryptocurrency trading: the worst financial decisions almost never happen during a Crash—they happen during days of euphoria.
Psychologically, when the market turns green, your brain activates the same dopamine circuit as a slot machine. You stop analyzing projects and start calculating how much money you would have made if you had invested more.
That thought has a name in behavioral finance: Bias of Retrospective Bias and Projected Euphoria.
Here’s the mental map that distinguishes an average investor from a professional when green candles dominate the screen:
The Average Investor:
Sees a coin rise +40% in 24 hours.
Feels the urgency not to miss out (FOMO).
Buys at the peak of the candle.
Acts as “exit liquidity” for the big funds.
The Professional Trader:
Sees a coin rise +40% in 24 hours.
Executes a partial Take Profit to secure capital.
Moves the Stop Loss to a profit zone.
Reassigns liquidity to strong projects that haven’t exploded yet.
💡 The Inverse Mirror Rule:
If the idea of buying scares you because the market is red, it’s probably a good time to analyze entries. If you feel an uncontrollable urge to buy because everything is going up, then you’re already late.
The market’s secret isn’t guessing the future—it’s mastering the chemistry of your brain before you press the Trade button.
💬 What’s been the most expensive lesson the market’s euphoria has taught you? I’m listening in the comments. 👇
#BinanceSquare
#Write2Earn
#Binance
#tradingtips
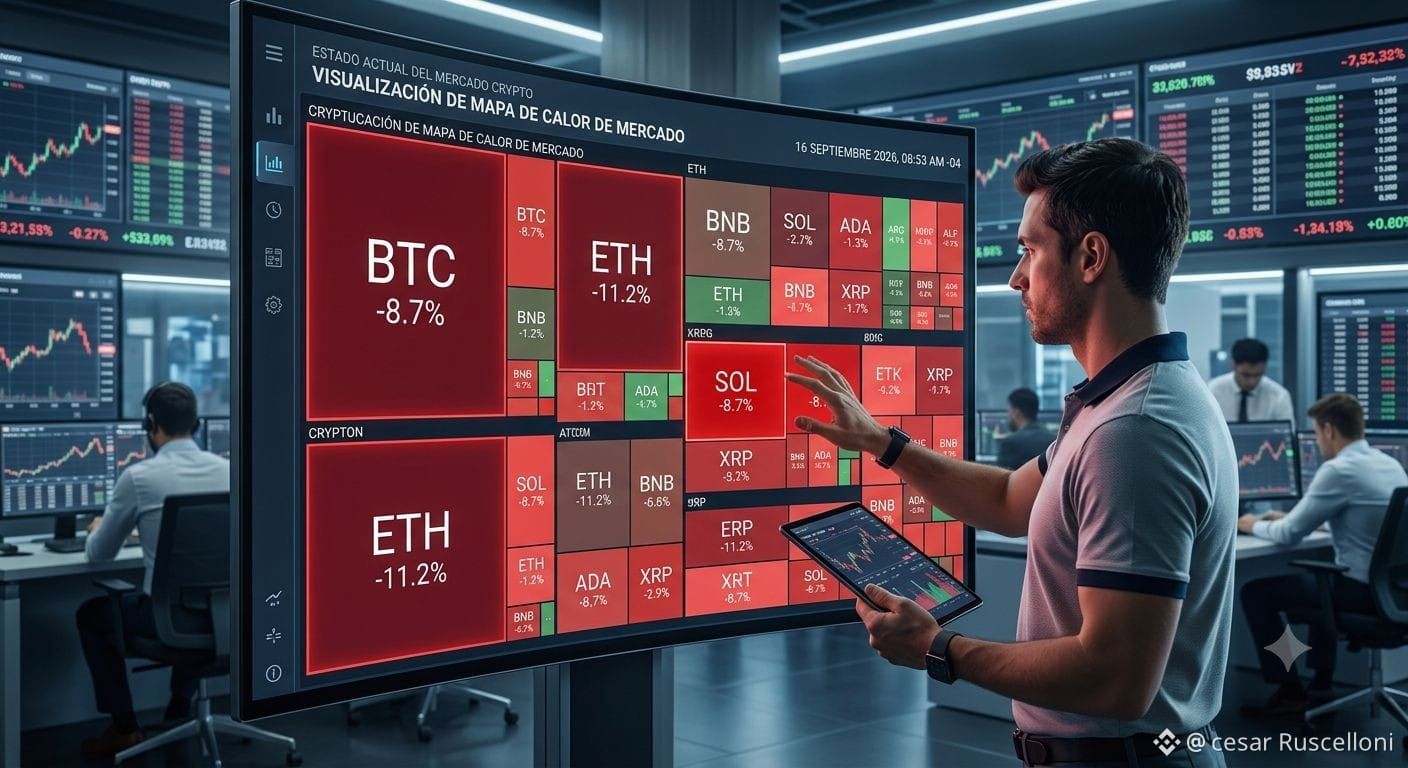
267

Hayes: Yen Unwind Could Fuel Crypto’s Next Liquidity Wave
Arthur Hayes says Japan’s yen carry-trade unwind plus French bond stress may force the Fed to print more dollars — creating a “money printing bonanza” for Bitcoin and Ethereum.
He sees BTC potentially reclaiming its all-time high by year-end, while ETH remains his top large-cap bet as the “most hated mega-cap.”
Why it matters
Crypto is shifting from four-year cycles to capital-flow driven moves. As Saylor put it, Bitcoin has already won as digital capital. Liquidity stress in FX and bonds now matters more than pure crypto charts.
Takeaway
Watch EUR/JPY and long-end yields. When global funding tightens, hard assets often absorb the next wave of printed money.
Clarity on market structure and institutional pipes will decide how fast that capital actually arrives.
#CryptoInsights #Marketsentimentstoday #CryptoEducation💡🚀 #Bitcoin #Ethereum
Hayes: Yen Unwind Could Fuel Crypto’s Next Liquidity Wave
Arthur Hayes says Japan’s yen carry-trade unwind plus French bond stress may force the Fed to print more dollars — creating a “money printing bonanza” for Bitcoin and Ethereum.
He sees BTC potentially reclaiming its all-time high by year-end, while ETH remains his top large-cap bet as the “most hated mega-cap.”
Why it matters
Crypto is shifting from four-year cycles to capital-flow driven moves. As Saylor put it, Bitcoin has already won as digital capital. Liquidity stress in FX and bonds now matters more than pure crypto charts.
Takeaway
Watch EUR/JPY and long-end yields. When global funding tightens, hard assets often absorb the next wave of printed money.
Clarity on market structure and institutional pipes will decide how fast that capital actually arrives.
#CryptoInsights #Marketsentimentstoday #CryptoEducation💡🚀 #Bitcoin #Ethereum
Arthur Hayes says Japan’s yen carry-trade unwind plus French bond stress may force the Fed to print more dollars — creating a “money printing bonanza” for Bitcoin and Ethereum.
He sees BTC potentially reclaiming its all-time high by year-end, while ETH remains his top large-cap bet as the “most hated mega-cap.”
Why it matters
Crypto is shifting from four-year cycles to capital-flow driven moves. As Saylor put it, Bitcoin has already won as digital capital. Liquidity stress in FX and bonds now matters more than pure crypto charts.
Takeaway
Watch EUR/JPY and long-end yields. When global funding tightens, hard assets often absorb the next wave of printed money.
Clarity on market structure and institutional pipes will decide how fast that capital actually arrives.
#CryptoInsights #Marketsentimentstoday #CryptoEducation💡🚀 #Bitcoin #Ethereum

56
Order blocks on Mira (MIRA) show a bullish breakout while trading volume surges, suggesting growing investor sentiment. Meanwhile, Jasmy (JASMY) is expanding its ecosystem with new data privacy solutions, driving adoption and liquidity. MrvLB (MRVLB) maintains steady momentum, attracting institutional interest through innovative staking protocols. Together, they illustrate a diversified momentum wave across the BSC space. 🚀 #CryptoInsights #SMC
Order blocks on Mira (MIRA) show a bullish breakout while trading volume surges, suggesting growing investor sentiment. Meanwhile, Jasmy (JASMY) is expanding its ecosystem with new data privacy solutions, driving adoption and liquidity. MrvLB (MRVLB) maintains steady momentum, attracting institutional interest through innovative staking protocols. Together, they illustrate a diversified momentum wave across the BSC space. 🚀 #CryptoInsights #SMC
1
391

·
--
📊 The latest scan gave me three very different momentum profiles.
$RAY
{spot}(RAYUSDT)
is clearly leading this group.
At $1.685, its RSI sits at 58.65, while the trend reading is +8.13%. That's a much stronger trend figure than the other two, making RAY the obvious momentum leader from this scan.
$ETHFI
{spot}(ETHFIUSDT)
is more measured.
Price: $0.677
RSI: 53.04
Trend: +2.92%
The numbers are positive, but without the same acceleration seen in RAY. Sometimes that difference matters more than simply looking for the highest RSI.
Then there is $SOL
{future}(SOLUSDT)
.
At $102.28, SOL has the highest RSI of the three at 60.65, yet its trend reading is only +0.13% in this scan.
So which signal would you trust more?
🚀 RAY — strongest trend
⚖️ ETHFI — balanced readings
🔥 SOL — strongest RSI
Different numbers can tell different stories, which is why I prefer comparing momentum instead of looking at one indicator alone.
If you had to watch one chart first, which would it be?
#CryptoTrading #Altcoins #cryptoinsights
📊 The latest scan gave me three very different momentum profiles.
$RAY
is clearly leading this group.
At $1.685, its RSI sits at 58.65, while the trend reading is +8.13%. That's a much stronger trend figure than the other two, making RAY the obvious momentum leader from this scan.
$ETHFI
is more measured.
Price: $0.677
RSI: 53.04
Trend: +2.92%
The numbers are positive, but without the same acceleration seen in RAY. Sometimes that difference matters more than simply looking for the highest RSI.
Then there is $SOL
.
At $102.28, SOL has the highest RSI of the three at 60.65, yet its trend reading is only +0.13% in this scan.
So which signal would you trust more?
🚀 RAY — strongest trend
⚖️ ETHFI — balanced readings
🔥 SOL — strongest RSI
Different numbers can tell different stories, which is why I prefer comparing momentum instead of looking at one indicator alone.
If you had to watch one chart first, which would it be?
#CryptoTrading #Altcoins #cryptoinsights
$RAY
is clearly leading this group.
At $1.685, its RSI sits at 58.65, while the trend reading is +8.13%. That's a much stronger trend figure than the other two, making RAY the obvious momentum leader from this scan.
$ETHFI
is more measured.
Price: $0.677
RSI: 53.04
Trend: +2.92%
The numbers are positive, but without the same acceleration seen in RAY. Sometimes that difference matters more than simply looking for the highest RSI.
Then there is $SOL
.
At $102.28, SOL has the highest RSI of the three at 60.65, yet its trend reading is only +0.13% in this scan.
So which signal would you trust more?
🚀 RAY — strongest trend
⚖️ ETHFI — balanced readings
🔥 SOL — strongest RSI
Different numbers can tell different stories, which is why I prefer comparing momentum instead of looking at one indicator alone.
If you had to watch one chart first, which would it be?
#CryptoTrading #Altcoins #cryptoinsights
🟢 RAY
20%
🔵 ETHFI
60%
🟣 SOL
16%
👀 None for now
4%
25 votes • Voting closed
806

·
--
🦈 $BTC REVEALS WHY DISCIPLINE OUTSHINES QUICK MEME GAIN 💥
Smart money rarely chases meme hype; they anchor in order blocks that have survived five years of net contributions. 📊 The recent liquidity sweep on the 4H chart shows institutional buyers re‑establishing a demand zone, a classic 🦈 move that signals long‑term bias.
Your 155 M VND (~$6k) stash proves that disciplined accumulation beats flash‑pump fantasies. 📈 Respect the risk, watch the liquidity pool refill, and let the market inefficiency fill the fair‑value gap. 💡
💬 Are you ready to trade discipline over hype? 👇
⚠️ Not financial advice. Always manage your risk. 🛡️
🏷️ #BTC #Discipline #LongTerm #CryptoInsights
🔥 💎
🦈 $BTC REVEALS WHY DISCIPLINE OUTSHINES QUICK MEME GAIN 💥
Smart money rarely chases meme hype; they anchor in order blocks that have survived five years of net contributions. 📊 The recent liquidity sweep on the 4H chart shows institutional buyers re‑establishing a demand zone, a classic 🦈 move that signals long‑term bias.
Your 155 M VND (~$6k) stash proves that disciplined accumulation beats flash‑pump fantasies. 📈 Respect the risk, watch the liquidity pool refill, and let the market inefficiency fill the fair‑value gap. 💡
💬 Are you ready to trade discipline over hype? 👇
⚠️ Not financial advice. Always manage your risk. 🛡️
🏷️ #BTC #Discipline #LongTerm #CryptoInsights
🔥 💎
Smart money rarely chases meme hype; they anchor in order blocks that have survived five years of net contributions. 📊 The recent liquidity sweep on the 4H chart shows institutional buyers re‑establishing a demand zone, a classic 🦈 move that signals long‑term bias.
Your 155 M VND (~$6k) stash proves that disciplined accumulation beats flash‑pump fantasies. 📈 Respect the risk, watch the liquidity pool refill, and let the market inefficiency fill the fair‑value gap. 💡
💬 Are you ready to trade discipline over hype? 👇
⚠️ Not financial advice. Always manage your risk. 🛡️
🏷️ #BTC #Discipline #LongTerm #CryptoInsights
🔥 💎


14

·
--
Article
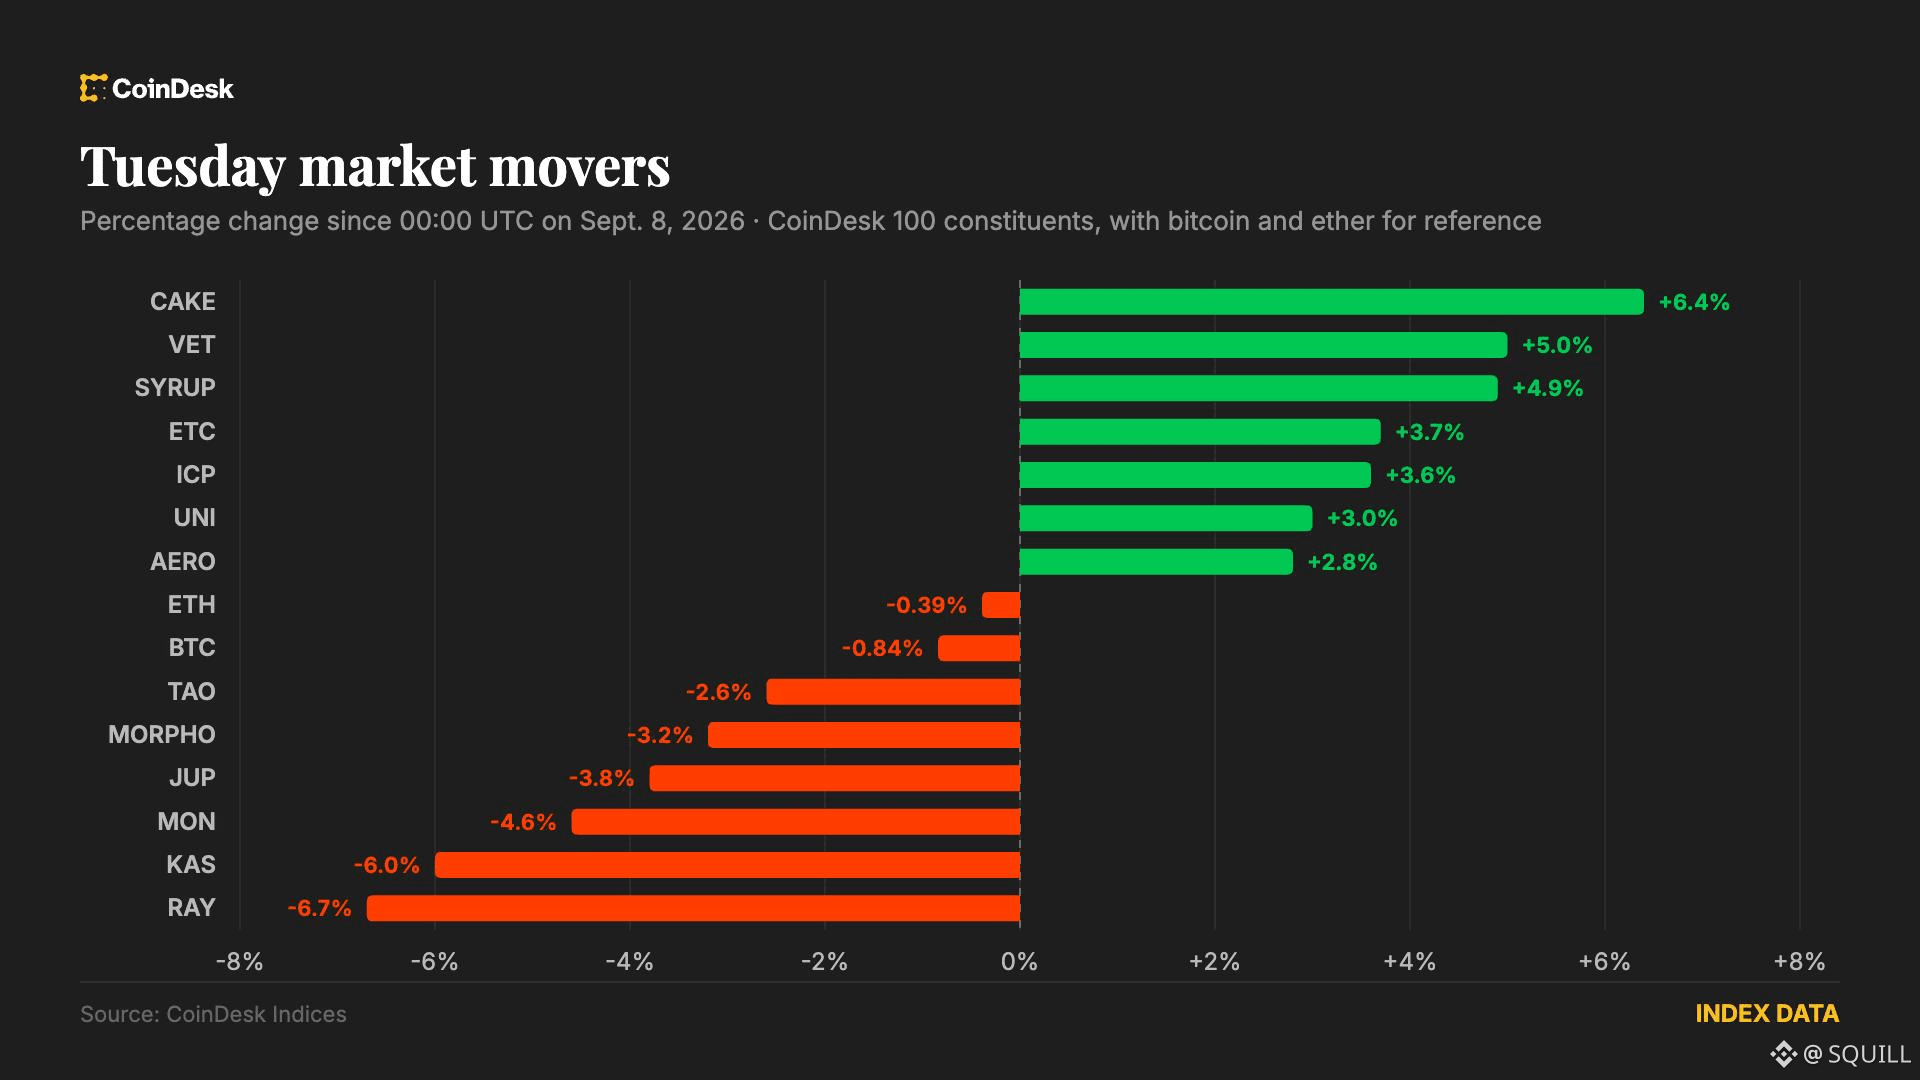
Bitcoin’s Slipping Drop: Why $BTC Fell While BNB Chain and DeFi Tokens SoarBitcoin slipped to $78,874, a 0.42% drop, yet BNB Chain tokens and DeFi assets rallied, showing a split in market sentiment. This shift highlights how different segments of the crypto ecosystem can move independently, even when the flagship coin is under pressure.
The Concept
When Bitcoin’s price dips, many investors assume the entire market will follow suit. However, the recent selloff revealed that altcoins, especially those tied to specific ecosystems like BNB Chain, can defy the broader trend. Think of Bitcoin as the market’s “benchmark” stock; its movement often sets the tone, but individual sectors—like DeFi—can chart their own course based on project fundamentals, partnerships, or network upgrades. #CryptoInsights #DeFiDynamics
Real‑World Example
On September 8th, $BTC fell just under 0.5%, settling at $78,874. In contrast, the CoinDesk 20 index, which tracks the top 20 crypto assets, edged up 0.2%, and the memecoin index gained 0.41%. BNB Chain tokens, the native coins of Binance’s smart‑contract platform, experienced a notable rally. This divergence suggests that while Bitcoin’s price was pressured by broader market sentiment or macro factors, BNB Chain’s ecosystem was buoyed by recent developments—perhaps a new DeFi protocol launch, a partnership announcement, or a network upgrade that increased user activity and demand for its native token.
Takeaway
Don’t assume a Bitcoin dip means every crypto will fall. Look at the underlying drivers for each token: network upgrades, partnership news, and user adoption. Diversifying across sectors—especially those with strong fundamentals like BNB Chain—can provide resilience against Bitcoin’s volatility. Consider adding a small allocation to BNB Chain tokens or other DeFi projects that show independent growth. #SmartInvesting
Engagement Question
What’s your strategy when Bitcoin drops but altcoins rally? Share your thoughts below!
Bitcoin’s Slipping Drop: Why $BTC Fell While BNB Chain and DeFi Tokens Soar
Bitcoin slipped to $78,874, a 0.42% drop, yet BNB Chain tokens and DeFi assets rallied, showing a split in market sentiment. This shift highlights how different segments of the crypto ecosystem can move independently, even when the flagship coin is under pressure.
The Concept
When Bitcoin’s price dips, many investors assume the entire market will follow suit. However, the recent selloff revealed that altcoins, especially those tied to specific ecosystems like BNB Chain, can defy the broader trend. Think of Bitcoin as the market’s “benchmark” stock; its movement often sets the tone, but individual sectors—like DeFi—can chart their own course based on project fundamentals, partnerships, or network upgrades. #CryptoInsights #DeFiDynamics
Real‑World Example
On September 8th, $BTC fell just under 0.5%, settling at $78,874. In contrast, the CoinDesk 20 index, which tracks the top 20 crypto assets, edged up 0.2%, and the memecoin index gained 0.41%. BNB Chain tokens, the native coins of Binance’s smart‑contract platform, experienced a notable rally. This divergence suggests that while Bitcoin’s price was pressured by broader market sentiment or macro factors, BNB Chain’s ecosystem was buoyed by recent developments—perhaps a new DeFi protocol launch, a partnership announcement, or a network upgrade that increased user activity and demand for its native token.
Takeaway
Don’t assume a Bitcoin dip means every crypto will fall. Look at the underlying drivers for each token: network upgrades, partnership news, and user adoption. Diversifying across sectors—especially those with strong fundamentals like BNB Chain—can provide resilience against Bitcoin’s volatility. Consider adding a small allocation to BNB Chain tokens or other DeFi projects that show independent growth. #SmartInvesting
Engagement Question
What’s your strategy when Bitcoin drops but altcoins rally? Share your thoughts below!
The Concept
When Bitcoin’s price dips, many investors assume the entire market will follow suit. However, the recent selloff revealed that altcoins, especially those tied to specific ecosystems like BNB Chain, can defy the broader trend. Think of Bitcoin as the market’s “benchmark” stock; its movement often sets the tone, but individual sectors—like DeFi—can chart their own course based on project fundamentals, partnerships, or network upgrades. #CryptoInsights #DeFiDynamics
Real‑World Example
On September 8th, $BTC fell just under 0.5%, settling at $78,874. In contrast, the CoinDesk 20 index, which tracks the top 20 crypto assets, edged up 0.2%, and the memecoin index gained 0.41%. BNB Chain tokens, the native coins of Binance’s smart‑contract platform, experienced a notable rally. This divergence suggests that while Bitcoin’s price was pressured by broader market sentiment or macro factors, BNB Chain’s ecosystem was buoyed by recent developments—perhaps a new DeFi protocol launch, a partnership announcement, or a network upgrade that increased user activity and demand for its native token.
Takeaway
Don’t assume a Bitcoin dip means every crypto will fall. Look at the underlying drivers for each token: network upgrades, partnership news, and user adoption. Diversifying across sectors—especially those with strong fundamentals like BNB Chain—can provide resilience against Bitcoin’s volatility. Consider adding a small allocation to BNB Chain tokens or other DeFi projects that show independent growth. #SmartInvesting
Engagement Question
What’s your strategy when Bitcoin drops but altcoins rally? Share your thoughts below!
9

·
--
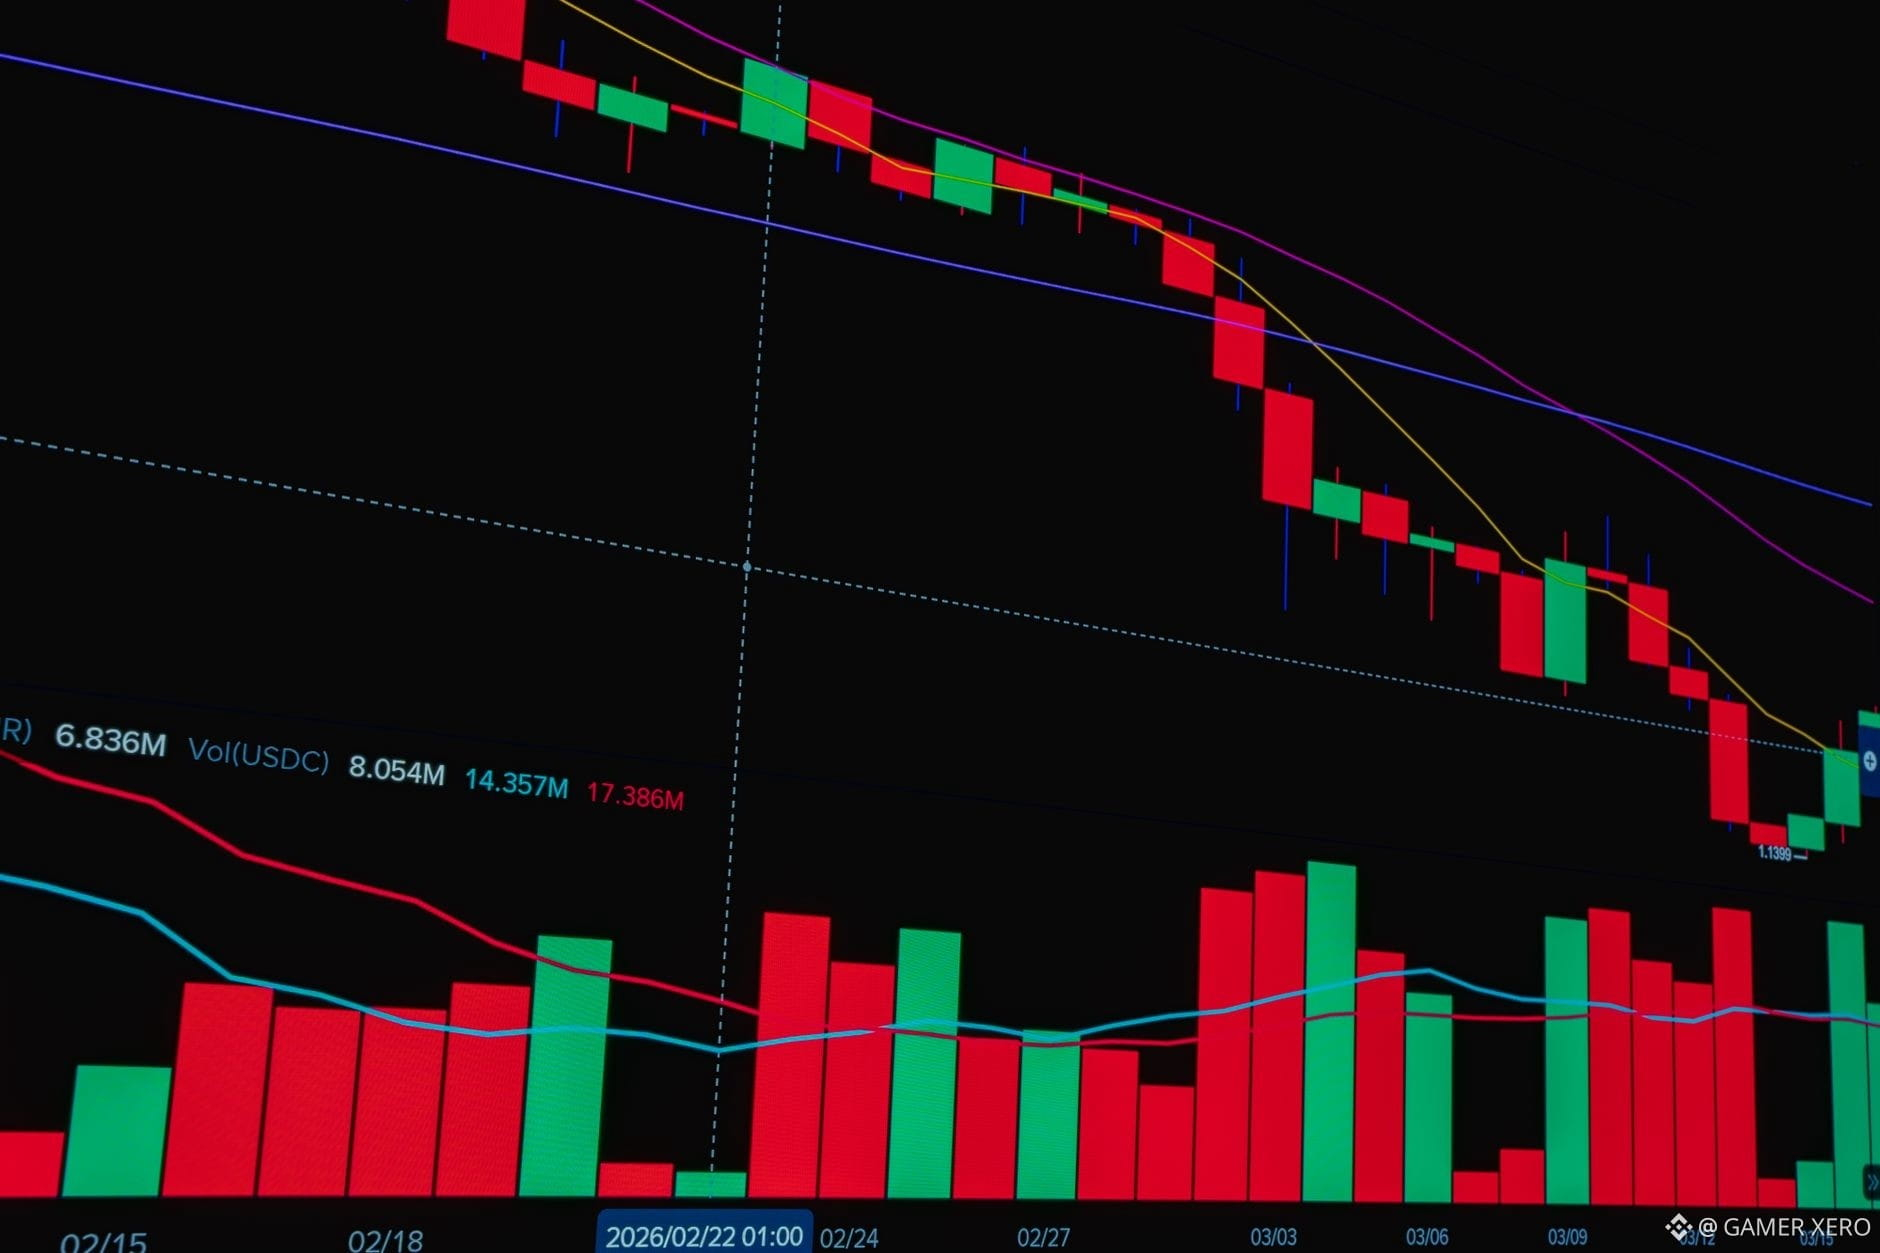
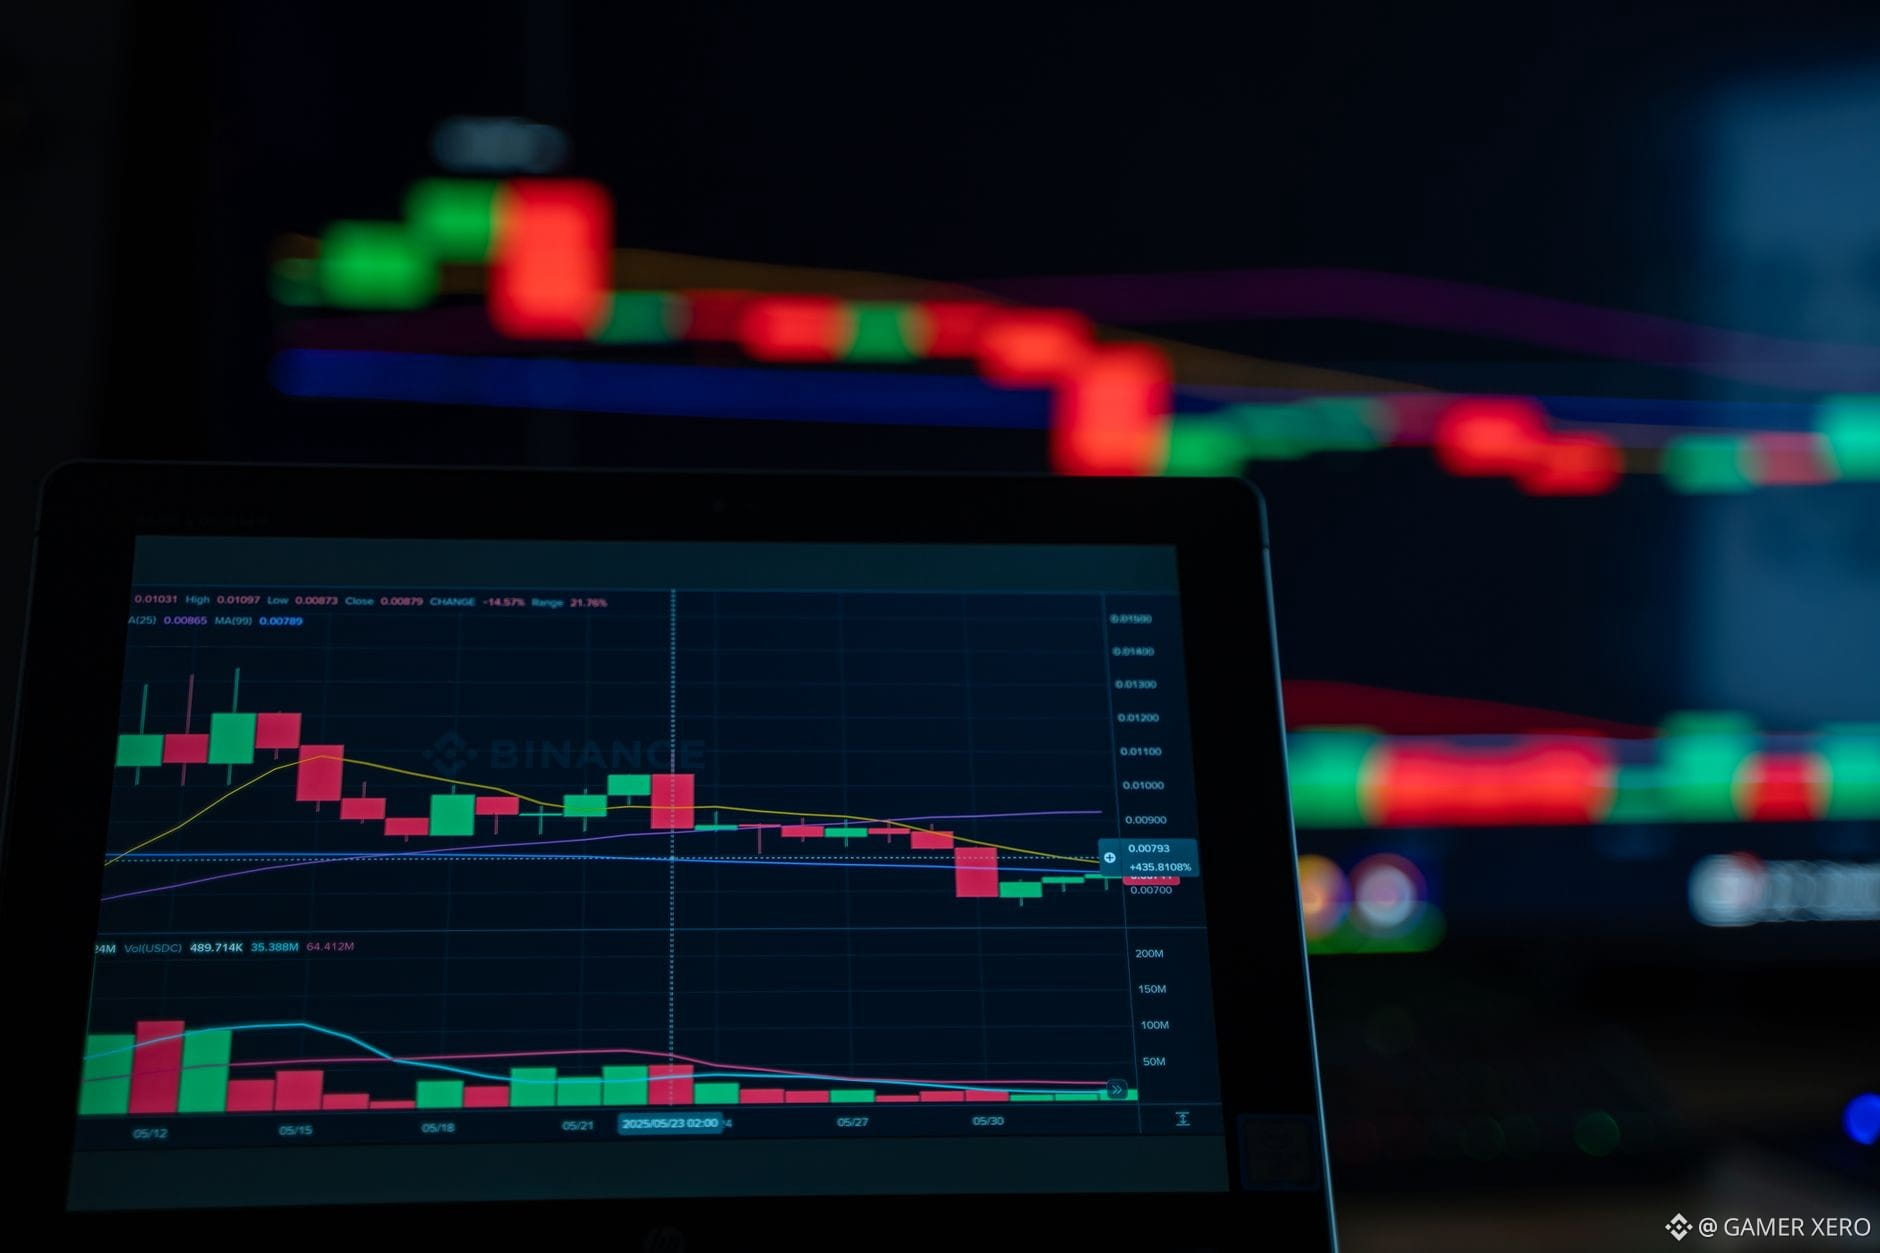
The US CPI report is looming, and the data shows inflation still running above the Fed’s target. For crypto traders that means the macro backdrop could stay tilted toward tighter monetary policy for a while, which historically adds pressure on risk assets and can tighten funding rates on margin positions. On Binance Spot, $BTC is hovering at $78,468 with a modest 1.2 % dip over the last 24 hours, while $ETH sits at $2,478, down 0.4 %. Those moves suggest the market is already pricing in a cautious tone, but the real test will be how quickly liquidity providers adjust their leverage caps once the CPI numbers land.
If funding rates rise, we may see tighter order‑book spreads and a shift toward more defensive positioning. Conversely, a softer inflation surprise could reopen room for modest upside while keeping volatility in check. Watching the bid‑ask imbalance on the spot book will give an early clue whether buyers or sellers are gaining the edge as the data rolls out.
How are you adapting your risk parameters ahead of the CPI release?
#CryptoInsights #Binance #Macro #GAMERXERO
The US CPI report is looming, and the data shows inflation still running above the Fed’s target. For crypto traders that means the macro backdrop could stay tilted toward tighter monetary policy for a while, which historically adds pressure on risk assets and can tighten funding rates on margin positions. On Binance Spot, $BTC is hovering at $78,468 with a modest 1.2 % dip over the last 24 hours, while $ETH sits at $2,478, down 0.4 %. Those moves suggest the market is already pricing in a cautious tone, but the real test will be how quickly liquidity providers adjust their leverage caps once the CPI numbers land.
If funding rates rise, we may see tighter order‑book spreads and a shift toward more defensive positioning. Conversely, a softer inflation surprise could reopen room for modest upside while keeping volatility in check. Watching the bid‑ask imbalance on the spot book will give an early clue whether buyers or sellers are gaining the edge as the data rolls out.
How are you adapting your risk parameters ahead of the CPI release?
#CryptoInsights #Binance #Macro #GAMERXERO
If funding rates rise, we may see tighter order‑book spreads and a shift toward more defensive positioning. Conversely, a softer inflation surprise could reopen room for modest upside while keeping volatility in check. Watching the bid‑ask imbalance on the spot book will give an early clue whether buyers or sellers are gaining the edge as the data rolls out.
How are you adapting your risk parameters ahead of the CPI release?
#CryptoInsights #Binance #Macro #GAMERXERO
37
·
--
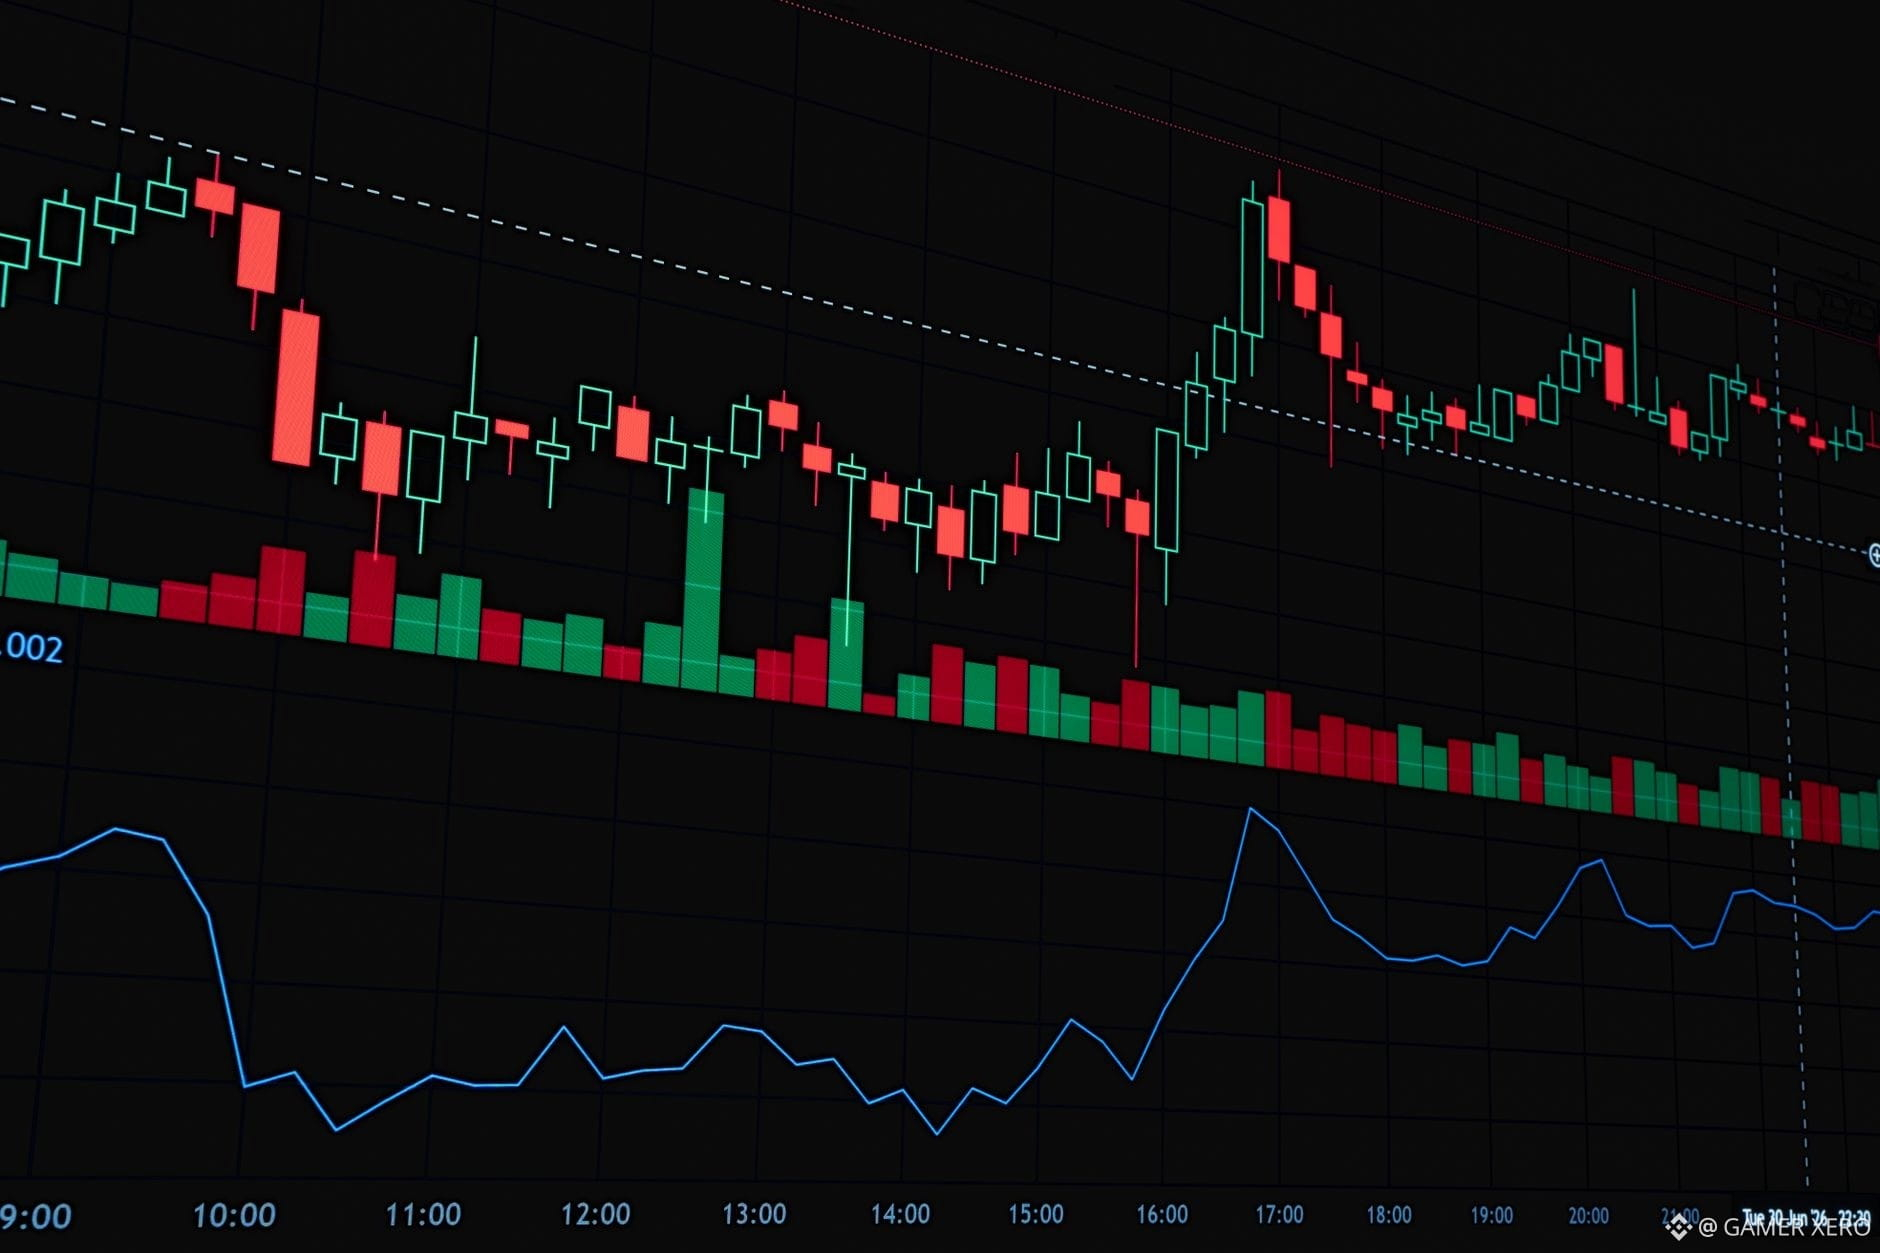
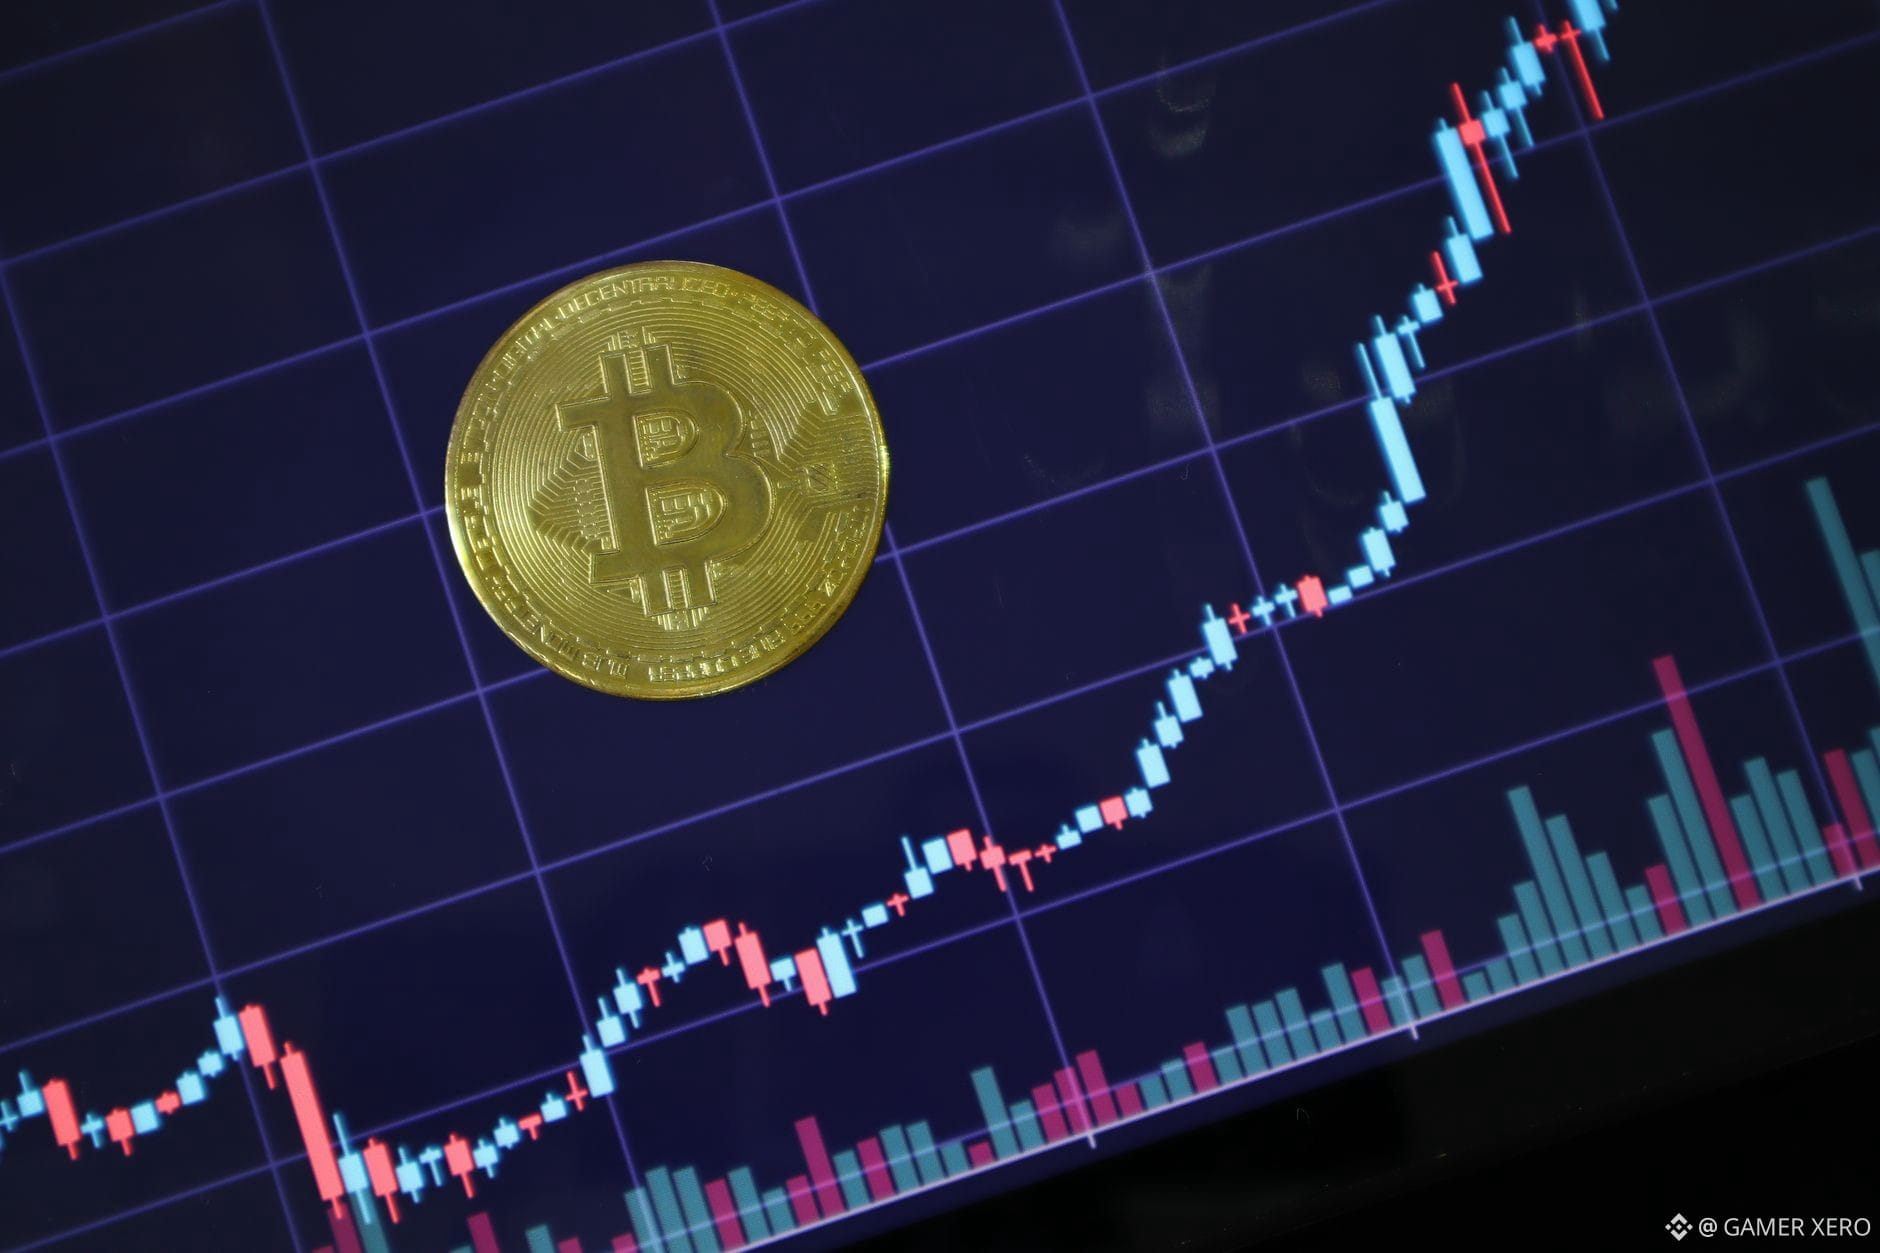
USDC’s week‑long surge of $584 million is more than a headline – it’s a signal that stablecoin liquidity is tightening around a few dominant players. On Binance, $USDC continues to anchor a growing share of spot‑margin collateral, meaning traders can lock in lower‑cost funding without chasing multiple peg tokens. The effect ripples into the broader market: when a stablecoin’s supply expands quickly, the underlying fiat inflow often supports higher‑volume order books, especially for the flagship pair $BTC/USDC that’s hovering just under $79,700. This extra depth can dampen short‑term slippage, making it easier to execute larger positions without moving the market.
At the same time, the $USDC influx puts pressure on other stablecoins to prove utility or competitive yields, which could reshape fee structures on Binance’s lending platform. For traders who rely on stablecoins for hedging or arbitrage, the growing dominance of USDC may mean tighter spreads but also a need to monitor reserve ratios and on‑chain activity for signs of stress.
How are you adjusting your stablecoin strategy as USDC tightens its grip on the market?
#CryptoInsights #Stablecoins #Binance #GAMERXERO
USDC’s week‑long surge of $584 million is more than a headline – it’s a signal that stablecoin liquidity is tightening around a few dominant players. On Binance, $USDC continues to anchor a growing share of spot‑margin collateral, meaning traders can lock in lower‑cost funding without chasing multiple peg tokens. The effect ripples into the broader market: when a stablecoin’s supply expands quickly, the underlying fiat inflow often supports higher‑volume order books, especially for the flagship pair $BTC /USDC that’s hovering just under $79,700. This extra depth can dampen short‑term slippage, making it easier to execute larger positions without moving the market.
At the same time, the $USDC influx puts pressure on other stablecoins to prove utility or competitive yields, which could reshape fee structures on Binance’s lending platform. For traders who rely on stablecoins for hedging or arbitrage, the growing dominance of USDC may mean tighter spreads but also a need to monitor reserve ratios and on‑chain activity for signs of stress.
How are you adjusting your stablecoin strategy as USDC tightens its grip on the market?
#CryptoInsights #Stablecoins #Binance #GAMERXERO
At the same time, the $USDC influx puts pressure on other stablecoins to prove utility or competitive yields, which could reshape fee structures on Binance’s lending platform. For traders who rely on stablecoins for hedging or arbitrage, the growing dominance of USDC may mean tighter spreads but also a need to monitor reserve ratios and on‑chain activity for signs of stress.
How are you adjusting your stablecoin strategy as USDC tightens its grip on the market?
#CryptoInsights #Stablecoins #Binance #GAMERXERO
26
·
--
DeFi Liquidity Is Evolving — and Most Traders Are Still Using the Old Playbook
For years, DeFi liquidity meant one thing: AMMs. You split assets 50/50, deposited into a pool, earned fees, and accepted impermanent loss as the cost of doing business.
That model still works. But it is no longer the whole story.
The shift happening right now is structural. Liquidity is moving from passive pool-based models toward intent-driven execution — where users broadcast what they want, and a competitive layer of solvers finds the optimal fill across multiple venues, chains, and liquidity sources simultaneously.
This matters because it reframes how value flows through the ecosystem.
Under the old model, liquidity was fragmented. Each pool competed independently. Capital was locked, often idle, and pricing was reactive. Under the intent model, aggregated liquidity becomes programmable. Solvers compete for execution quality. Slippage compresses. Users get outcomes, not routes.
The chains building the settlement and coordination layer that solvers run on are the ones that win this transition. $ETH remains the deepest settlement base. $BNB delivers high-throughput clearing rails. $AVAX subnet architecture enables institutional-grade execution isolation. These are not just ecosystems — they are the infrastructure stack of the next DeFi era.
DeFi liquidity is growing up. The protocols capturing institutional flow will be those treating execution quality — not just yield — as the primary product.
Watch where the solvers run. That is where DeFi value accrual is heading next.
#DeFi #Crypto #Web3 #CryptoInsights
DeFi Liquidity Is Evolving — and Most Traders Are Still Using the Old Playbook
For years, DeFi liquidity meant one thing: AMMs. You split assets 50/50, deposited into a pool, earned fees, and accepted impermanent loss as the cost of doing business.
That model still works. But it is no longer the whole story.
The shift happening right now is structural. Liquidity is moving from passive pool-based models toward intent-driven execution — where users broadcast what they want, and a competitive layer of solvers finds the optimal fill across multiple venues, chains, and liquidity sources simultaneously.
This matters because it reframes how value flows through the ecosystem.
Under the old model, liquidity was fragmented. Each pool competed independently. Capital was locked, often idle, and pricing was reactive. Under the intent model, aggregated liquidity becomes programmable. Solvers compete for execution quality. Slippage compresses. Users get outcomes, not routes.
The chains building the settlement and coordination layer that solvers run on are the ones that win this transition. $ETH remains the deepest settlement base. $BNB delivers high-throughput clearing rails. $AVAX subnet architecture enables institutional-grade execution isolation. These are not just ecosystems — they are the infrastructure stack of the next DeFi era.
DeFi liquidity is growing up. The protocols capturing institutional flow will be those treating execution quality — not just yield — as the primary product.
Watch where the solvers run. That is where DeFi value accrual is heading next.
#DeFi #Crypto #Web3 #CryptoInsights
For years, DeFi liquidity meant one thing: AMMs. You split assets 50/50, deposited into a pool, earned fees, and accepted impermanent loss as the cost of doing business.
That model still works. But it is no longer the whole story.
The shift happening right now is structural. Liquidity is moving from passive pool-based models toward intent-driven execution — where users broadcast what they want, and a competitive layer of solvers finds the optimal fill across multiple venues, chains, and liquidity sources simultaneously.
This matters because it reframes how value flows through the ecosystem.
Under the old model, liquidity was fragmented. Each pool competed independently. Capital was locked, often idle, and pricing was reactive. Under the intent model, aggregated liquidity becomes programmable. Solvers compete for execution quality. Slippage compresses. Users get outcomes, not routes.
The chains building the settlement and coordination layer that solvers run on are the ones that win this transition. $ETH remains the deepest settlement base. $BNB delivers high-throughput clearing rails. $AVAX subnet architecture enables institutional-grade execution isolation. These are not just ecosystems — they are the infrastructure stack of the next DeFi era.
DeFi liquidity is growing up. The protocols capturing institutional flow will be those treating execution quality — not just yield — as the primary product.
Watch where the solvers run. That is where DeFi value accrual is heading next.
#DeFi #Crypto #Web3 #CryptoInsights
89
Log in to explore more content
Join global crypto users on Binance Square
⚡️ Get latest and useful information about crypto.
💬 Trusted by the world’s largest crypto exchange.
👍 Discover real insights from verified creators.
Email / Phone number
Trending Topics
1
#NEARFallsToAround$4.70Down14%
4,960 views
14 Discussing
2
#EthereumFoundationLaunchesZkAPIOnMainnet
253 views
50 Discussing
3
#EvernorthPlansNasdaqListingOct8
5,999 views
82 Discussing
4
#SECProposesCryptoCustodyFramework
5,304 views
80 Discussing
5
#IMFApproves$139MDisbursementToElSalvador
4,982 views
14 Discussing
6
#AnthropicTargetsIPOAsSoonAsMidNovember
8,028 views
111 Discussing
7
#EtherGains70.9%InQ3
208,356 views
1,363 Discussing
8
#TreasuryLetsStatesFileStablecoinCertificationsEarly
15,344 views
108 Discussing
9
#US10YearYieldNears5.3%
175,303 views
1,274 Discussing
10
#DollarIndexHitsHighestSinceMay2025
59,533 views
717 Discussing