
#bitcoinprice
bitcoinprice
1.6M views
2,588 Discussing
Hot
Latest

·
--

Article
Bitcoin Price Prediction 2027$BTC Price Prediction 2027: What the Numbers and Institutional Forecasts Show :
As of mid-November 2026, Bitcoin trades near $63,750 to $64,950 (₹59.58 lakh), marking a 26% year-to-date decline and a 48.5% drop from its all-time high of $126,080 recorded on October 6, 2025. Market sentiment sits deep in defensive territory, with the Crypto Fear & Greed Index registering between 10 and 22 out of 100 and Bitcoin's 14-day Relative Strength Index (RSI) hovering in oversold conditions between 21.64 and 23.74. Against this backdrop, institutional desks, quantitative models, and prediction markets have laid out sharply diverging price trajectories for 2027.
Institutional Price Targets for 2027 :
Major Wall Street banks and digital asset research firms maintain 2027 price targets ranging from $113,000 to $250,000, though each forecast relies on distinct assumptions regarding liquidity and exchange-traded fund (ETF) demand:
* Citigroup ($113,000): Analyst Alex Saunders set a 12-month target extending to October 2027 at $113,000, representing an approximate 74% upside from mid-November 2026 levels. Citigroup's model identifies $82,000 as its baseline "zero-inflow" equilibrium price, meaning positive net spot ETF inflows are required to propel the asset toward six figures.
* Bernstein ($150,000): Analyst Gautam Chhugani maintains a mid-2027 target of $150,000, which requires Bitcoin to more than double from current trading levels and surpass its 2025 record peak.
* Siebert Financial ($175,000): Analyst Brian Vieten projects a 2027 target of $175,000, implying a nearly threefold increase from November 2026 prices.
* Galaxy Digital ($250,000): Head of Research Alex Thorn reaffirmed a year-end 2027 target of $250,000, a projection that requires a nearly fourfold rally and hinges on significant global monetary expansion.
Quantitative Models and Market Expectations
Algorithmic forecasting platforms and real-money prediction markets point to a much more measured recovery curve heading into 2027:
* Baseline Algorithmic Forecasts ($79,849 – $87,497): Quantitative models on Binance project Bitcoin reaching $79,849.34 in 2027 based on historical market trajectory data. Similarly, CoinCodex models estimate a recovery toward $87,497 following a projected 2026 year-end close between $70,009 and $78,371.
* Medium-Term Channel Projections ($77,500 – $108,000): Technical models from CoinDCX outline a medium-term trading channel between $58,000 and $85,000 extending into March 2027, with a $77,500 Q1 target and a broader 2027 target of $100,000 within an expected annual range of $60,000 to $108,000.
* Prediction Market Odds: On Kalshi, traders pricing near-term probabilities assign just a 3% chance of Bitcoin reclaiming $100,000 before the end of 2026, placing the highest-probability year-end range at $60,000 to $65,000 (23% odds) with a market median of $62,600.
Spot ETF Flows and Institutional Liquidity Data
Institutional fund flows remain the primary empirical driver behind recent price compression and 2027 recovery models:
* Asset Contraction: According to SoSoValue data, total net assets across U.S. spot Bitcoin ETFs contracted from $109.3 billion on October 21, 2026, down to $86.2 billion by November 13, 2026.
* November 2026 Outflows: Spot Bitcoin ETFs recorded approximately $2.1 billion in cumulative net outflows during the first half of November 2026. Between November 5 and November 13 alone, the funds experienced seven consecutive sessions of net redemptions totaling $1.47 billion, including single-day outflows of $430.2 million on November 5 and $411.9 million on November 6.
Key Technical Thresholds Governing the 2027 Outlook
Market analysts track specific moving averages and price floors to validate or invalidate 2027 bullish scenarios:
* Downside Support ($58,000 – $60,000): The $60,000 level serves as the immediate psychological pivot, backed by the June 30, 2026 low of $58,566 (and broader chart support near $58,000). Analysts note that a decisive weekly close below $58,566 would likely force downward revisions across existing institutional 2027 forecasts.
* Overhead Moving Averages ($68,000 – $76,164): Bitcoin currently trades below its 200-week moving average near $68,000, its 20-day exponential moving average (EMA) at $72,254, its 200-day simple moving average (SMA) between $72,770 and $72,930, and its 200-day EMA at $75,811.
* Bullish Breakout Trigger ($80,000 – $82,000): Technical strategists indicate that reclaiming the 200-day moving averages around $73,000 to $76,000 and securing a daily close above the $80,000 to $82,000 zone are the required structural milestones to restore a sustained 2027 uptrend.
Other Upcoming Predictions For : $ZEC and $ETH
#AnthropicToDebutAfter$83IPOPricing
#Bitcoinprice
#BTCRemainsUnderPressureAfterHawkishFOMCMinutes
#cryptouniverseofficial
#CryptoPatience
Disclaimer: Cryptocurrency markets carry high volatility, and analyst targets represent statistical or institutional projections rather than guarantee.
Bitcoin Price Prediction 2027
$BTC Price Prediction 2027: What the Numbers and Institutional Forecasts Show :
As of mid-November 2026, Bitcoin trades near $63,750 to $64,950 (₹59.58 lakh), marking a 26% year-to-date decline and a 48.5% drop from its all-time high of $126,080 recorded on October 6, 2025. Market sentiment sits deep in defensive territory, with the Crypto Fear & Greed Index registering between 10 and 22 out of 100 and Bitcoin's 14-day Relative Strength Index (RSI) hovering in oversold conditions between 21.64 and 23.74. Against this backdrop, institutional desks, quantitative models, and prediction markets have laid out sharply diverging price trajectories for 2027.
Institutional Price Targets for 2027 :
Major Wall Street banks and digital asset research firms maintain 2027 price targets ranging from $113,000 to $250,000, though each forecast relies on distinct assumptions regarding liquidity and exchange-traded fund (ETF) demand:
* Citigroup ($113,000): Analyst Alex Saunders set a 12-month target extending to October 2027 at $113,000, representing an approximate 74% upside from mid-November 2026 levels. Citigroup's model identifies $82,000 as its baseline "zero-inflow" equilibrium price, meaning positive net spot ETF inflows are required to propel the asset toward six figures.
* Bernstein ($150,000): Analyst Gautam Chhugani maintains a mid-2027 target of $150,000, which requires Bitcoin to more than double from current trading levels and surpass its 2025 record peak.
* Siebert Financial ($175,000): Analyst Brian Vieten projects a 2027 target of $175,000, implying a nearly threefold increase from November 2026 prices.
* Galaxy Digital ($250,000): Head of Research Alex Thorn reaffirmed a year-end 2027 target of $250,000, a projection that requires a nearly fourfold rally and hinges on significant global monetary expansion.
Quantitative Models and Market Expectations
Algorithmic forecasting platforms and real-money prediction markets point to a much more measured recovery curve heading into 2027:
* Baseline Algorithmic Forecasts ($79,849 – $87,497): Quantitative models on Binance project Bitcoin reaching $79,849.34 in 2027 based on historical market trajectory data. Similarly, CoinCodex models estimate a recovery toward $87,497 following a projected 2026 year-end close between $70,009 and $78,371.
* Medium-Term Channel Projections ($77,500 – $108,000): Technical models from CoinDCX outline a medium-term trading channel between $58,000 and $85,000 extending into March 2027, with a $77,500 Q1 target and a broader 2027 target of $100,000 within an expected annual range of $60,000 to $108,000.
* Prediction Market Odds: On Kalshi, traders pricing near-term probabilities assign just a 3% chance of Bitcoin reclaiming $100,000 before the end of 2026, placing the highest-probability year-end range at $60,000 to $65,000 (23% odds) with a market median of $62,600.
Spot ETF Flows and Institutional Liquidity Data
Institutional fund flows remain the primary empirical driver behind recent price compression and 2027 recovery models:
* Asset Contraction: According to SoSoValue data, total net assets across U.S. spot Bitcoin ETFs contracted from $109.3 billion on October 21, 2026, down to $86.2 billion by November 13, 2026.
* November 2026 Outflows: Spot Bitcoin ETFs recorded approximately $2.1 billion in cumulative net outflows during the first half of November 2026. Between November 5 and November 13 alone, the funds experienced seven consecutive sessions of net redemptions totaling $1.47 billion, including single-day outflows of $430.2 million on November 5 and $411.9 million on November 6.
Key Technical Thresholds Governing the 2027 Outlook
Market analysts track specific moving averages and price floors to validate or invalidate 2027 bullish scenarios:
* Downside Support ($58,000 – $60,000): The $60,000 level serves as the immediate psychological pivot, backed by the June 30, 2026 low of $58,566 (and broader chart support near $58,000). Analysts note that a decisive weekly close below $58,566 would likely force downward revisions across existing institutional 2027 forecasts.
* Overhead Moving Averages ($68,000 – $76,164): Bitcoin currently trades below its 200-week moving average near $68,000, its 20-day exponential moving average (EMA) at $72,254, its 200-day simple moving average (SMA) between $72,770 and $72,930, and its 200-day EMA at $75,811.
* Bullish Breakout Trigger ($80,000 – $82,000): Technical strategists indicate that reclaiming the 200-day moving averages around $73,000 to $76,000 and securing a daily close above the $80,000 to $82,000 zone are the required structural milestones to restore a sustained 2027 uptrend.
Other Upcoming Predictions For : $ZEC and $ETH
#AnthropicToDebutAfter$83IPOPricing
#Bitcoinprice
#BTCRemainsUnderPressureAfterHawkishFOMCMinutes
#cryptouniverseofficial
#CryptoPatience
Disclaimer: Cryptocurrency markets carry high volatility, and analyst targets represent statistical or institutional projections rather than guarantee.
As of mid-November 2026, Bitcoin trades near $63,750 to $64,950 (₹59.58 lakh), marking a 26% year-to-date decline and a 48.5% drop from its all-time high of $126,080 recorded on October 6, 2025. Market sentiment sits deep in defensive territory, with the Crypto Fear & Greed Index registering between 10 and 22 out of 100 and Bitcoin's 14-day Relative Strength Index (RSI) hovering in oversold conditions between 21.64 and 23.74. Against this backdrop, institutional desks, quantitative models, and prediction markets have laid out sharply diverging price trajectories for 2027.
Institutional Price Targets for 2027 :
Major Wall Street banks and digital asset research firms maintain 2027 price targets ranging from $113,000 to $250,000, though each forecast relies on distinct assumptions regarding liquidity and exchange-traded fund (ETF) demand:
* Citigroup ($113,000): Analyst Alex Saunders set a 12-month target extending to October 2027 at $113,000, representing an approximate 74% upside from mid-November 2026 levels. Citigroup's model identifies $82,000 as its baseline "zero-inflow" equilibrium price, meaning positive net spot ETF inflows are required to propel the asset toward six figures.
* Bernstein ($150,000): Analyst Gautam Chhugani maintains a mid-2027 target of $150,000, which requires Bitcoin to more than double from current trading levels and surpass its 2025 record peak.
* Siebert Financial ($175,000): Analyst Brian Vieten projects a 2027 target of $175,000, implying a nearly threefold increase from November 2026 prices.
* Galaxy Digital ($250,000): Head of Research Alex Thorn reaffirmed a year-end 2027 target of $250,000, a projection that requires a nearly fourfold rally and hinges on significant global monetary expansion.
Quantitative Models and Market Expectations
Algorithmic forecasting platforms and real-money prediction markets point to a much more measured recovery curve heading into 2027:
* Baseline Algorithmic Forecasts ($79,849 – $87,497): Quantitative models on Binance project Bitcoin reaching $79,849.34 in 2027 based on historical market trajectory data. Similarly, CoinCodex models estimate a recovery toward $87,497 following a projected 2026 year-end close between $70,009 and $78,371.
* Medium-Term Channel Projections ($77,500 – $108,000): Technical models from CoinDCX outline a medium-term trading channel between $58,000 and $85,000 extending into March 2027, with a $77,500 Q1 target and a broader 2027 target of $100,000 within an expected annual range of $60,000 to $108,000.
* Prediction Market Odds: On Kalshi, traders pricing near-term probabilities assign just a 3% chance of Bitcoin reclaiming $100,000 before the end of 2026, placing the highest-probability year-end range at $60,000 to $65,000 (23% odds) with a market median of $62,600.
Spot ETF Flows and Institutional Liquidity Data
Institutional fund flows remain the primary empirical driver behind recent price compression and 2027 recovery models:
* Asset Contraction: According to SoSoValue data, total net assets across U.S. spot Bitcoin ETFs contracted from $109.3 billion on October 21, 2026, down to $86.2 billion by November 13, 2026.
* November 2026 Outflows: Spot Bitcoin ETFs recorded approximately $2.1 billion in cumulative net outflows during the first half of November 2026. Between November 5 and November 13 alone, the funds experienced seven consecutive sessions of net redemptions totaling $1.47 billion, including single-day outflows of $430.2 million on November 5 and $411.9 million on November 6.
Key Technical Thresholds Governing the 2027 Outlook
Market analysts track specific moving averages and price floors to validate or invalidate 2027 bullish scenarios:
* Downside Support ($58,000 – $60,000): The $60,000 level serves as the immediate psychological pivot, backed by the June 30, 2026 low of $58,566 (and broader chart support near $58,000). Analysts note that a decisive weekly close below $58,566 would likely force downward revisions across existing institutional 2027 forecasts.
* Overhead Moving Averages ($68,000 – $76,164): Bitcoin currently trades below its 200-week moving average near $68,000, its 20-day exponential moving average (EMA) at $72,254, its 200-day simple moving average (SMA) between $72,770 and $72,930, and its 200-day EMA at $75,811.
* Bullish Breakout Trigger ($80,000 – $82,000): Technical strategists indicate that reclaiming the 200-day moving averages around $73,000 to $76,000 and securing a daily close above the $80,000 to $82,000 zone are the required structural milestones to restore a sustained 2027 uptrend.
Other Upcoming Predictions For : $ZEC and $ETH
#AnthropicToDebutAfter$83IPOPricing
#Bitcoinprice
#BTCRemainsUnderPressureAfterHawkishFOMCMinutes
#cryptouniverseofficial
#CryptoPatience
Disclaimer: Cryptocurrency markets carry high volatility, and analyst targets represent statistical or institutional projections rather than guarantee.
1
2

·
--
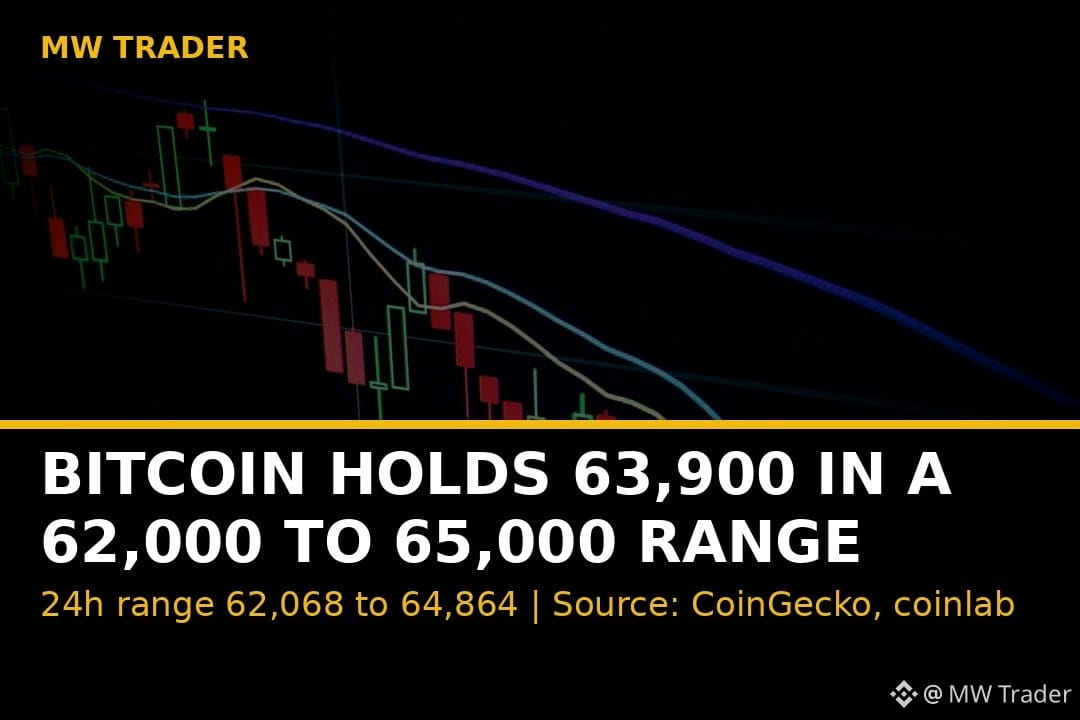
Bitcoin trades near $63,951, stuck inside a $62,000 to $65,000 range that has held all day. 📊
Bitcoin sits at $63,951, down 0.40 percent in 24 hours and 13.14 percent in seven days, with a 24 hour range of $62,068 to $64,864, according to CoinGecko and CoinStats, and coinlab puts the base case for today at sideways between $62,000 and $65,000. 🔴 The total market value dropped 2.98 percent in 24 hours to $2.177 trillion, while Bitcoin dominance rose to 58.9 percent, which tells me money is hiding in Bitcoin, not rotating into altcoins. My reading is that this range holds until the US session breaks it, so patience beats guessing the direction here. ⚠️
Does Bitcoin break $65,000 first, or does it test $62,006 again before the US open? 🤔
Follow for more trades.
#Crypto #Bitcoin #FuturesTrading #TradingSignals #BitcoinPrice
Bitcoin trades near $63,951, stuck inside a $62,000 to $65,000 range that has held all day. 📊
Bitcoin sits at $63,951, down 0.40 percent in 24 hours and 13.14 percent in seven days, with a 24 hour range of $62,068 to $64,864, according to CoinGecko and CoinStats, and coinlab puts the base case for today at sideways between $62,000 and $65,000. 🔴 The total market value dropped 2.98 percent in 24 hours to $2.177 trillion, while Bitcoin dominance rose to 58.9 percent, which tells me money is hiding in Bitcoin, not rotating into altcoins. My reading is that this range holds until the US session breaks it, so patience beats guessing the direction here. ⚠️
Does Bitcoin break $65,000 first, or does it test $62,006 again before the US open? 🤔
Follow for more trades.
#Crypto #Bitcoin #FuturesTrading #TradingSignals #BitcoinPrice
Bitcoin sits at $63,951, down 0.40 percent in 24 hours and 13.14 percent in seven days, with a 24 hour range of $62,068 to $64,864, according to CoinGecko and CoinStats, and coinlab puts the base case for today at sideways between $62,000 and $65,000. 🔴 The total market value dropped 2.98 percent in 24 hours to $2.177 trillion, while Bitcoin dominance rose to 58.9 percent, which tells me money is hiding in Bitcoin, not rotating into altcoins. My reading is that this range holds until the US session breaks it, so patience beats guessing the direction here. ⚠️
Does Bitcoin break $65,000 first, or does it test $62,006 again before the US open? 🤔
Follow for more trades.
#Crypto #Bitcoin #FuturesTrading #TradingSignals #BitcoinPrice

·
--
Bullish
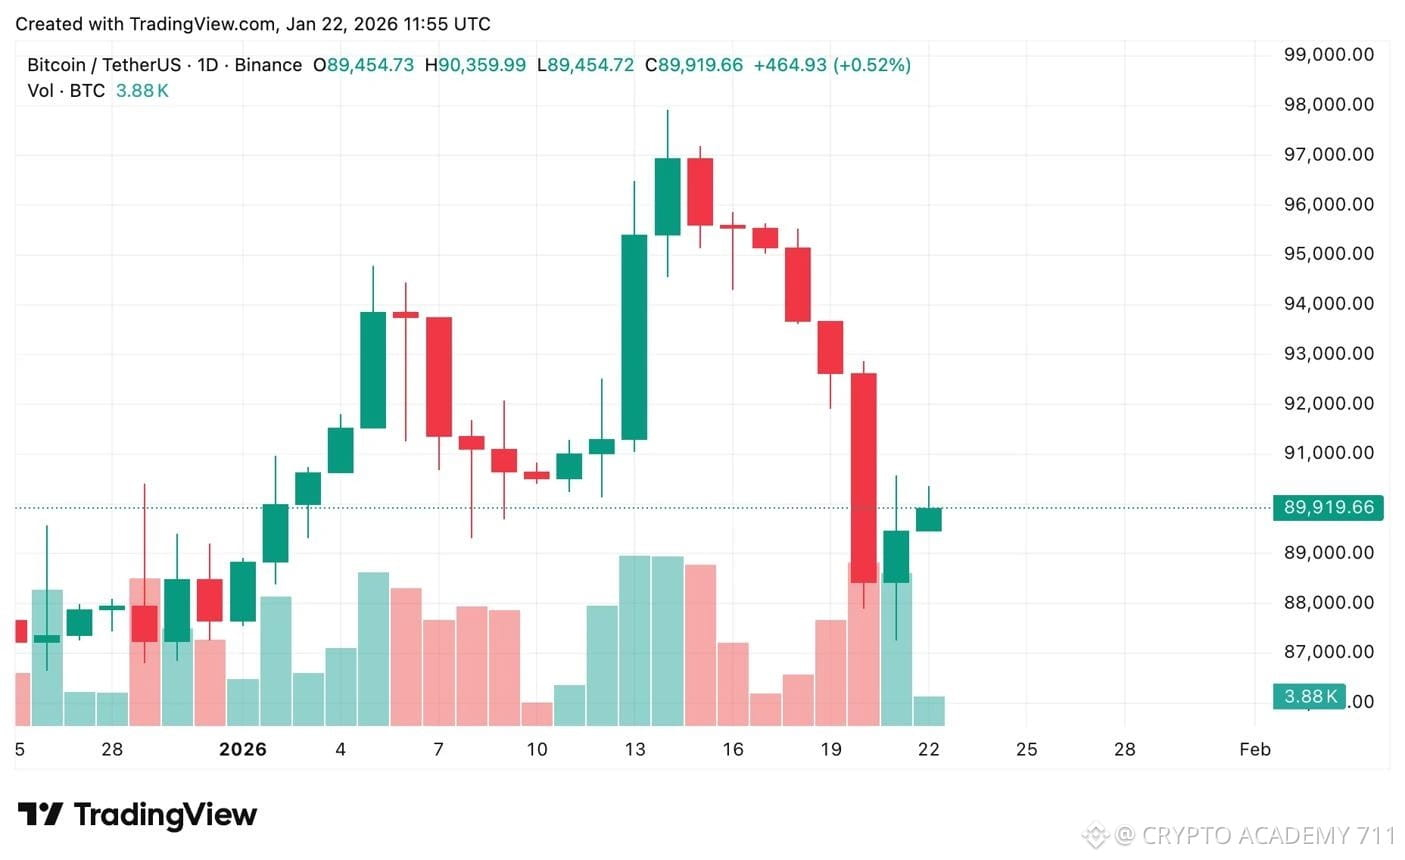
$BTC BREAKING: BITCOIN (BTC) CROSSES $64,000! 📈
now the $BTC drops below $64,000
Bitcoin has crossed the important $64,000 USDT level, attracting attention across the crypto market.
🔥 Why It Matters:
- BTC is testing an important psychological price level.
- A sustained move above $64K could strengthen bullish sentiment.
- Traders should watch trading volume and market momentum.
- Failure to hold above $64K could trigger a short-term pullback.
📊 Market Outlook:
The next move is crucial. Bulls need to defend the breakout, while bears may attempt to push BTC below $64K.
⚠️ Always manage risk and avoid emotional trading.
What do you think? Will BTC continue higher or face a correction?
{spot}(BTCUSDT)
#Bitcoin #BTC #CryptoNews #Binance #CryptoMarket #BitcoinPrice
$BTC BREAKING: BITCOIN (BTC) CROSSES $64,000! 📈
now the $BTC drops below $64,000
Bitcoin has crossed the important $64,000 USDT level, attracting attention across the crypto market.
🔥 Why It Matters:
- BTC is testing an important psychological price level.
- A sustained move above $64K could strengthen bullish sentiment.
- Traders should watch trading volume and market momentum.
- Failure to hold above $64K could trigger a short-term pullback.
📊 Market Outlook:
The next move is crucial. Bulls need to defend the breakout, while bears may attempt to push BTC below $64K.
⚠️ Always manage risk and avoid emotional trading.
What do you think? Will BTC continue higher or face a correction?
#Bitcoin #BTC #CryptoNews #Binance #CryptoMarket #BitcoinPrice
now the $BTC drops below $64,000
Bitcoin has crossed the important $64,000 USDT level, attracting attention across the crypto market.
🔥 Why It Matters:
- BTC is testing an important psychological price level.
- A sustained move above $64K could strengthen bullish sentiment.
- Traders should watch trading volume and market momentum.
- Failure to hold above $64K could trigger a short-term pullback.
📊 Market Outlook:
The next move is crucial. Bulls need to defend the breakout, while bears may attempt to push BTC below $64K.
⚠️ Always manage risk and avoid emotional trading.
What do you think? Will BTC continue higher or face a correction?
#Bitcoin #BTC #CryptoNews #Binance #CryptoMarket #BitcoinPrice

40
·
--
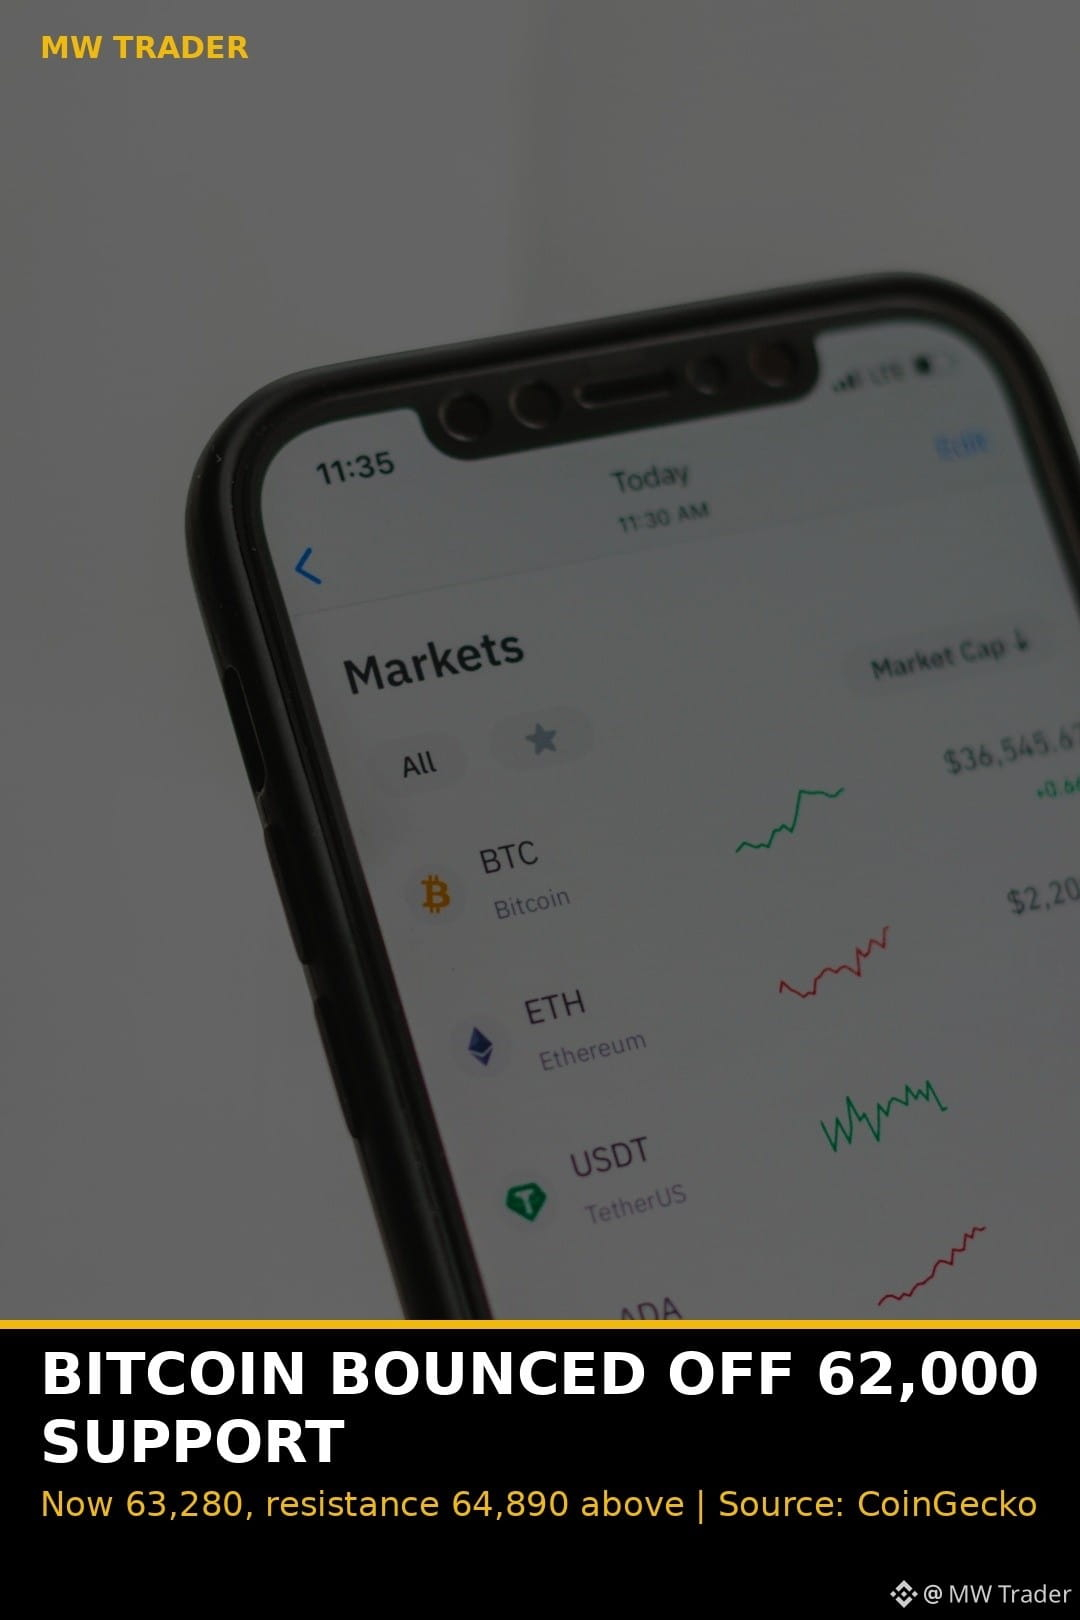
Bitcoin bounced off $62,000 and is back near $63,280, but the bounce has not proved anything yet. 📊
Bitcoin fell to the $62,000 area and then climbed back toward $63,000, while Ethereum recovered to around $1,780, according to NDTV market updates. 📈 Analysts put immediate support at $62,000, then $61,000 to $61,500, with resistance at $64,890. My reading is that this is a dead cat bounce until $64,890 breaks, because Bitcoin is still down 13.86 percent over seven days and every rally this week has been sold. ⚠️
Does Bitcoin break $64,890 and turn the bounce real, or does $62,000 give way first? 🤔
Follow for more trades.
#Crypto #Bitcoin #FuturesTrading #TradingSignals #BitcoinPrice
Bitcoin bounced off $62,000 and is back near $63,280, but the bounce has not proved anything yet. 📊
Bitcoin fell to the $62,000 area and then climbed back toward $63,000, while Ethereum recovered to around $1,780, according to NDTV market updates. 📈 Analysts put immediate support at $62,000, then $61,000 to $61,500, with resistance at $64,890. My reading is that this is a dead cat bounce until $64,890 breaks, because Bitcoin is still down 13.86 percent over seven days and every rally this week has been sold. ⚠️
Does Bitcoin break $64,890 and turn the bounce real, or does $62,000 give way first? 🤔
Follow for more trades.
#Crypto #Bitcoin #FuturesTrading #TradingSignals #BitcoinPrice
Bitcoin fell to the $62,000 area and then climbed back toward $63,000, while Ethereum recovered to around $1,780, according to NDTV market updates. 📈 Analysts put immediate support at $62,000, then $61,000 to $61,500, with resistance at $64,890. My reading is that this is a dead cat bounce until $64,890 breaks, because Bitcoin is still down 13.86 percent over seven days and every rally this week has been sold. ⚠️
Does Bitcoin break $64,890 and turn the bounce real, or does $62,000 give way first? 🤔
Follow for more trades.
#Crypto #Bitcoin #FuturesTrading #TradingSignals #BitcoinPrice
1
·
--
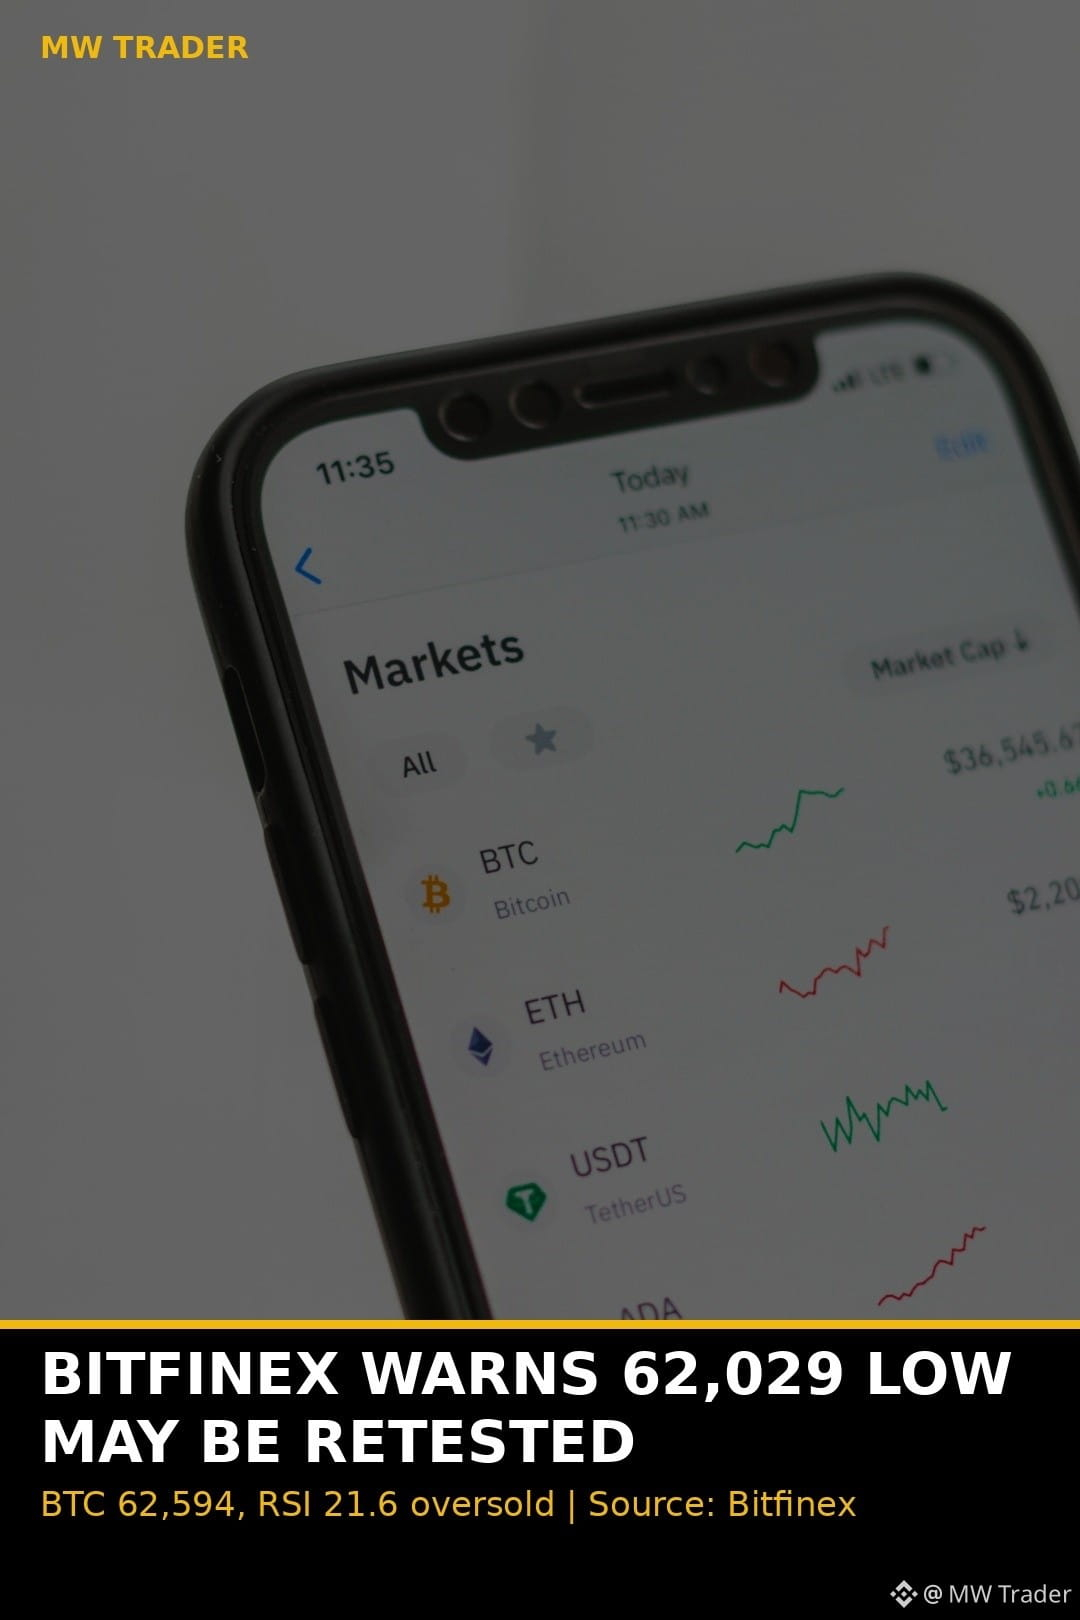
Bitfinex warns Bitcoin may retest its November low of $62,029, and the chart agrees it is close. 📊
Bitcoin sits at $62,594, down 2.52 percent in 24 hours and down about 14.8 percent over seven days, and Bitfinex warns the price faces a potential retest of November's $62,029 low, according to Crypto Economy. 🔴 The daily RSI reads 21.6, deep in oversold territory, according to the rnoncrypto daily brief, yet price keeps grinding lower, which tells me the selling is orderly, not panicked, and orderly selling can walk straight through a low that everyone is watching. ⚠️
Does $62,029 hold as the floor, or does Bitcoin print a fresh November low this week? 🤔
Follow for more trades.
#Crypto #Bitcoin #FuturesTrading #TradingSignals #BitcoinPrice
Bitfinex warns Bitcoin may retest its November low of $62,029, and the chart agrees it is close. 📊
Bitcoin sits at $62,594, down 2.52 percent in 24 hours and down about 14.8 percent over seven days, and Bitfinex warns the price faces a potential retest of November's $62,029 low, according to Crypto Economy. 🔴 The daily RSI reads 21.6, deep in oversold territory, according to the rnoncrypto daily brief, yet price keeps grinding lower, which tells me the selling is orderly, not panicked, and orderly selling can walk straight through a low that everyone is watching. ⚠️
Does $62,029 hold as the floor, or does Bitcoin print a fresh November low this week? 🤔
Follow for more trades.
#Crypto #Bitcoin #FuturesTrading #TradingSignals #BitcoinPrice
Bitcoin sits at $62,594, down 2.52 percent in 24 hours and down about 14.8 percent over seven days, and Bitfinex warns the price faces a potential retest of November's $62,029 low, according to Crypto Economy. 🔴 The daily RSI reads 21.6, deep in oversold territory, according to the rnoncrypto daily brief, yet price keeps grinding lower, which tells me the selling is orderly, not panicked, and orderly selling can walk straight through a low that everyone is watching. ⚠️
Does $62,029 hold as the floor, or does Bitcoin print a fresh November low this week? 🤔
Follow for more trades.
#Crypto #Bitcoin #FuturesTrading #TradingSignals #BitcoinPrice
1
·
--
Bitcoin is at $63,072, and fear just hit 11 for the fifth day in a row. 😨
Bitcoin fell 2.81 percent in 24 hours to $63,072, with the range running from $64,918 down to $62,068, and the Fear and Greed Index reads 11, Extreme Fear, for the fifth straight day, after 12, 10, 10 and 13, according to live CoinGecko data and alternative.me. 📉 My reading is that the bounce from $62,068 shows buyers defend the low $62,000s, but fear this deep for five days means the market does not trust a bounce yet, and the $66,000 reclaim is the proof level I wait for. ⚠️
Does Bitcoin reclaim $66,000 this week, or test $60,000 first? 🤔
Follow for more trades.
#Crypto #Bitcoin #FuturesTrading #TradingSignals #BitcoinPrice
Bitcoin is at $63,072, and fear just hit 11 for the fifth day in a row. 😨
Bitcoin fell 2.81 percent in 24 hours to $63,072, with the range running from $64,918 down to $62,068, and the Fear and Greed Index reads 11, Extreme Fear, for the fifth straight day, after 12, 10, 10 and 13, according to live CoinGecko data and alternative.me. 📉 My reading is that the bounce from $62,068 shows buyers defend the low $62,000s, but fear this deep for five days means the market does not trust a bounce yet, and the $66,000 reclaim is the proof level I wait for. ⚠️
Does Bitcoin reclaim $66,000 this week, or test $60,000 first? 🤔
Follow for more trades.
#Crypto #Bitcoin #FuturesTrading #TradingSignals #BitcoinPrice
Bitcoin fell 2.81 percent in 24 hours to $63,072, with the range running from $64,918 down to $62,068, and the Fear and Greed Index reads 11, Extreme Fear, for the fifth straight day, after 12, 10, 10 and 13, according to live CoinGecko data and alternative.me. 📉 My reading is that the bounce from $62,068 shows buyers defend the low $62,000s, but fear this deep for five days means the market does not trust a bounce yet, and the $66,000 reclaim is the proof level I wait for. ⚠️
Does Bitcoin reclaim $66,000 this week, or test $60,000 first? 🤔
Follow for more trades.
#Crypto #Bitcoin #FuturesTrading #TradingSignals #BitcoinPrice
·
--
Which comes first, $58,000 or $66,000? 🤔
Bitcoin sits at $62,481 between two clear levels, with the $60,000 to $62,000 floor below and the $66,000 to $68,000 reclaim zone above, according to FXStreet, and a loss of $62,000 on high volume opens a fast move toward the 52 week low near $57,800. 📊 My reading is that the Fed decides it, because a hawkish December 9 pushes price toward $58,000, while any dovish surprise sends it straight for $66,000, and the market is too scared to pick a side before then. ⚠️
Do you vote $58,000 first, or $66,000 first? 👉
Follow for more trades.
#Crypto #Bitcoin #FuturesTrading #TradingSignals #BitcoinPrice
Which comes first, $58,000 or $66,000? 🤔
Bitcoin sits at $62,481 between two clear levels, with the $60,000 to $62,000 floor below and the $66,000 to $68,000 reclaim zone above, according to FXStreet, and a loss of $62,000 on high volume opens a fast move toward the 52 week low near $57,800. 📊 My reading is that the Fed decides it, because a hawkish December 9 pushes price toward $58,000, while any dovish surprise sends it straight for $66,000, and the market is too scared to pick a side before then. ⚠️
Do you vote $58,000 first, or $66,000 first? 👉
Follow for more trades.
#Crypto #Bitcoin #FuturesTrading #TradingSignals #BitcoinPrice
Bitcoin sits at $62,481 between two clear levels, with the $60,000 to $62,000 floor below and the $66,000 to $68,000 reclaim zone above, according to FXStreet, and a loss of $62,000 on high volume opens a fast move toward the 52 week low near $57,800. 📊 My reading is that the Fed decides it, because a hawkish December 9 pushes price toward $58,000, while any dovish surprise sends it straight for $66,000, and the market is too scared to pick a side before then. ⚠️
Do you vote $58,000 first, or $66,000 first? 👉
Follow for more trades.
#Crypto #Bitcoin #FuturesTrading #TradingSignals #BitcoinPrice
3
·
--
Bitcoin is back inside the July base, the $61,300 to $67,000 range where it traded for seven weeks after the July low. 📉
Bitfinex Alpha reports Bitcoin fell to $62,029 on November 15, its lowest since July 13, and closed the week at $65,386, down 12.6 percent, the largest weekly fall since June 1. 📊 The short term holder cost basis sits at $74,712 and the True Market Mean at $77,112, both far above price, which tells me buyers who bought recently are underwater. Options imply a $61,800 to $69,400 range this week, with risks skewed to a retest of the $62,029 low.
Do you trade this range with small size, or wait for a clean break of $67,000 first? 🤔
Follow for more trades.
#Crypto #Bitcoin #FuturesTrading #TradingSignals #BitcoinPrice
Bitcoin is back inside the July base, the $61,300 to $67,000 range where it traded for seven weeks after the July low. 📉
Bitfinex Alpha reports Bitcoin fell to $62,029 on November 15, its lowest since July 13, and closed the week at $65,386, down 12.6 percent, the largest weekly fall since June 1. 📊 The short term holder cost basis sits at $74,712 and the True Market Mean at $77,112, both far above price, which tells me buyers who bought recently are underwater. Options imply a $61,800 to $69,400 range this week, with risks skewed to a retest of the $62,029 low.
Do you trade this range with small size, or wait for a clean break of $67,000 first? 🤔
Follow for more trades.
#Crypto #Bitcoin #FuturesTrading #TradingSignals #BitcoinPrice
Bitfinex Alpha reports Bitcoin fell to $62,029 on November 15, its lowest since July 13, and closed the week at $65,386, down 12.6 percent, the largest weekly fall since June 1. 📊 The short term holder cost basis sits at $74,712 and the True Market Mean at $77,112, both far above price, which tells me buyers who bought recently are underwater. Options imply a $61,800 to $69,400 range this week, with risks skewed to a retest of the $62,029 low.
Do you trade this range with small size, or wait for a clean break of $67,000 first? 🤔
Follow for more trades.
#Crypto #Bitcoin #FuturesTrading #TradingSignals #BitcoinPrice
1
·
--
Bitcoin just printed its sixth weekly loss in a row, falling from $75,800 to a Sunday low of $61,970. 📉
Spartan Weekly reports Bitcoin lost 13.7 percent on the week, while the S&P 500 rose 2.5 percent and the Nasdaq rose 3.5 percent through the same hot CPI and PPI prints. 📰 That split tells me crypto is trading its own fear right now, not following stocks, and the weekend washout near $62,000 came with about 2 billion dollars of liquidations. My reading is that a sixth red week breaks weak hands, but it also sets up the bounce traders are watching into the $64,459 pivot.
Are you buying this weekly washout, or waiting for one green weekly close first? 🤔
Follow for more trades.
#Crypto #Bitcoin #FuturesTrading #TradingSignals #BitcoinPrice
Bitcoin just printed its sixth weekly loss in a row, falling from $75,800 to a Sunday low of $61,970. 📉
Spartan Weekly reports Bitcoin lost 13.7 percent on the week, while the S&P 500 rose 2.5 percent and the Nasdaq rose 3.5 percent through the same hot CPI and PPI prints. 📰 That split tells me crypto is trading its own fear right now, not following stocks, and the weekend washout near $62,000 came with about 2 billion dollars of liquidations. My reading is that a sixth red week breaks weak hands, but it also sets up the bounce traders are watching into the $64,459 pivot.
Are you buying this weekly washout, or waiting for one green weekly close first? 🤔
Follow for more trades.
#Crypto #Bitcoin #FuturesTrading #TradingSignals #BitcoinPrice
Spartan Weekly reports Bitcoin lost 13.7 percent on the week, while the S&P 500 rose 2.5 percent and the Nasdaq rose 3.5 percent through the same hot CPI and PPI prints. 📰 That split tells me crypto is trading its own fear right now, not following stocks, and the weekend washout near $62,000 came with about 2 billion dollars of liquidations. My reading is that a sixth red week breaks weak hands, but it also sets up the bounce traders are watching into the $64,459 pivot.
Are you buying this weekly washout, or waiting for one green weekly close first? 🤔
Follow for more trades.
#Crypto #Bitcoin #FuturesTrading #TradingSignals #BitcoinPrice
7
·
--
Bitcoin bounced off $61,970 and closed Sunday at $65,314, then slipped back to $64,486. Is this a real bottom or a trap? 📉
The Crypto Basic reports Bitcoin gained 1.87 percent on Sunday to close at $65,314.60 after trading between $61,970.30 and $66,086.70, and BusinessToday notes the early Asian move to $65,359 came after a weekend low near $62,000. 📰 Fresh CoinGecko data at 14:00 PKT puts Bitcoin back at $64,486, down 0.45 percent in 24 hours and down 13.4 percent in seven days. My reading is that the bounce off a 90 session low is real dip buying, but price is still below the falling 20 day and 50 day moving averages, so I treat it as relief, not a reversal.
Do you trust this rebound, or are you waiting for $65,400 to break first? 🤔
Follow for more trades.
#Crypto #Bitcoin #FuturesTrading #TradingSignals #BitcoinPrice
Bitcoin bounced off $61,970 and closed Sunday at $65,314, then slipped back to $64,486. Is this a real bottom or a trap? 📉
The Crypto Basic reports Bitcoin gained 1.87 percent on Sunday to close at $65,314.60 after trading between $61,970.30 and $66,086.70, and BusinessToday notes the early Asian move to $65,359 came after a weekend low near $62,000. 📰 Fresh CoinGecko data at 14:00 PKT puts Bitcoin back at $64,486, down 0.45 percent in 24 hours and down 13.4 percent in seven days. My reading is that the bounce off a 90 session low is real dip buying, but price is still below the falling 20 day and 50 day moving averages, so I treat it as relief, not a reversal.
Do you trust this rebound, or are you waiting for $65,400 to break first? 🤔
Follow for more trades.
#Crypto #Bitcoin #FuturesTrading #TradingSignals #BitcoinPrice
The Crypto Basic reports Bitcoin gained 1.87 percent on Sunday to close at $65,314.60 after trading between $61,970.30 and $66,086.70, and BusinessToday notes the early Asian move to $65,359 came after a weekend low near $62,000. 📰 Fresh CoinGecko data at 14:00 PKT puts Bitcoin back at $64,486, down 0.45 percent in 24 hours and down 13.4 percent in seven days. My reading is that the bounce off a 90 session low is real dip buying, but price is still below the falling 20 day and 50 day moving averages, so I treat it as relief, not a reversal.
Do you trust this rebound, or are you waiting for $65,400 to break first? 🤔
Follow for more trades.
#Crypto #Bitcoin #FuturesTrading #TradingSignals #BitcoinPrice
7
·
--
Bitcoin is stuck between $65,400 resistance and the $60,000 cluster. Which breaks first? 🤔
Crypto.news reports Bitcoin needs to clear $65,400, then $68,000 and the $69,000 to $70,000 zone, while Brave New Coin cites Glassnode data showing a liquidation cluster between $60,000 and $62,000 that can pull price down like a magnet. 📊 KuCoin adds that Bitcoin must reclaim the $67,000 to $70,000 range to ease the downward pressure. My reading is that $65,400 is the line in the sand, a daily close above it opens $68,000, and a loss of $62,000 opens the cluster and a fast move to $60,000.
Vote with your plan, long above $65,400 or short below $62,000, which side are you on? 👉
Follow for more trades.
#Crypto #Bitcoin #FuturesTrading #TradingSignals #BitcoinPrice
Bitcoin is stuck between $65,400 resistance and the $60,000 cluster. Which breaks first? 🤔
Crypto.news reports Bitcoin needs to clear $65,400, then $68,000 and the $69,000 to $70,000 zone, while Brave New Coin cites Glassnode data showing a liquidation cluster between $60,000 and $62,000 that can pull price down like a magnet. 📊 KuCoin adds that Bitcoin must reclaim the $67,000 to $70,000 range to ease the downward pressure. My reading is that $65,400 is the line in the sand, a daily close above it opens $68,000, and a loss of $62,000 opens the cluster and a fast move to $60,000.
Vote with your plan, long above $65,400 or short below $62,000, which side are you on? 👉
Follow for more trades.
#Crypto #Bitcoin #FuturesTrading #TradingSignals #BitcoinPrice
Crypto.news reports Bitcoin needs to clear $65,400, then $68,000 and the $69,000 to $70,000 zone, while Brave New Coin cites Glassnode data showing a liquidation cluster between $60,000 and $62,000 that can pull price down like a magnet. 📊 KuCoin adds that Bitcoin must reclaim the $67,000 to $70,000 range to ease the downward pressure. My reading is that $65,400 is the line in the sand, a daily close above it opens $68,000, and a loss of $62,000 opens the cluster and a fast move to $60,000.
Vote with your plan, long above $65,400 or short below $62,000, which side are you on? 👉
Follow for more trades.
#Crypto #Bitcoin #FuturesTrading #TradingSignals #BitcoinPrice
5
·
--
Bitcoin rebounded above $65,000, then faded again. The bounce did not hold. 📉
BusinessToday reports Bitcoin rose about 1.9 percent to $65,359 in early Asian trading on November 16, recovering from a weekend low near $62,000, but fresh CoinGecko data at 11:00 PKT puts it back at $64,427, down 0.23 percent in 24 hours and down 13.4 percent in seven days. 📰 Ethereum did the same, climbing to $1,837 then settling near $1,810. My reading is that this is dip buying, not a trend change, because ETF money is still leaving and the Fed picture is still tight, so I treat every push above $65,000 as a test, not a breakout.
Do you trust this rebound, or are you waiting for $65,400 to break first? 🤔
Follow for more trades.
#Crypto #Bitcoin #FuturesTrading #TradingSignals #BitcoinPrice
Bitcoin rebounded above $65,000, then faded again. The bounce did not hold. 📉
BusinessToday reports Bitcoin rose about 1.9 percent to $65,359 in early Asian trading on November 16, recovering from a weekend low near $62,000, but fresh CoinGecko data at 11:00 PKT puts it back at $64,427, down 0.23 percent in 24 hours and down 13.4 percent in seven days. 📰 Ethereum did the same, climbing to $1,837 then settling near $1,810. My reading is that this is dip buying, not a trend change, because ETF money is still leaving and the Fed picture is still tight, so I treat every push above $65,000 as a test, not a breakout.
Do you trust this rebound, or are you waiting for $65,400 to break first? 🤔
Follow for more trades.
#Crypto #Bitcoin #FuturesTrading #TradingSignals #BitcoinPrice
BusinessToday reports Bitcoin rose about 1.9 percent to $65,359 in early Asian trading on November 16, recovering from a weekend low near $62,000, but fresh CoinGecko data at 11:00 PKT puts it back at $64,427, down 0.23 percent in 24 hours and down 13.4 percent in seven days. 📰 Ethereum did the same, climbing to $1,837 then settling near $1,810. My reading is that this is dip buying, not a trend change, because ETF money is still leaving and the Fed picture is still tight, so I treat every push above $65,000 as a test, not a breakout.
Do you trust this rebound, or are you waiting for $65,400 to break first? 🤔
Follow for more trades.
#Crypto #Bitcoin #FuturesTrading #TradingSignals #BitcoinPrice
1

·
--
Bitcoin Down Again? $64,699 - What Next?
BTC at $64,699 📉 Sellers in control! Will Bitcoin bounce from support or fall to $63,700? Read full analysis 👇
#Bitcoin #BTC #BTCUSDT #Crypto #BinanceSquare #CryptoNews #BitcoinPrice
Bitcoin Down Again? $64,699 - What Next?
BTC at $64,699 📉 Sellers in control! Will Bitcoin bounce from support or fall to $63,700? Read full analysis 👇
#Bitcoin #BTC #BTCUSDT #Crypto #BinanceSquare #CryptoNews #BitcoinPrice
BTC at $64,699 📉 Sellers in control! Will Bitcoin bounce from support or fall to $63,700? Read full analysis 👇
#Bitcoin #BTC #BTCUSDT #Crypto #BinanceSquare #CryptoNews #BitcoinPrice

90
·
--
Bitcoin lost its 200 day average at 73,000 and its 200 week at 68,000. 📉
Halogen Capital reports Bitcoin lost key technical levels in a decline of more than 20 percent over the week, breaking the 200 day moving average near 73,000 dollars and the 200 week moving average near 68,000 in a single day as the rout accelerated on Friday. 📊 CryptoQuant data cited by Brave New Coin puts the short term holder realised price near 75,000 dollars against spot near 65,000, with recent buyers' unrealised returns falling from plus 35 percent in September to minus 15 percent, and resistance now at 68,700 to 76,000. My reading is that losing both long averages in one week is a trend change, not noise, and Bitcoin must reclaim 68,000 before anyone calls a bottom.
Does Bitcoin reclaim 68,000 this week, or test the 2026 low of 57,718 first? 🤔
Follow for more trades.
#Crypto #Bitcoin #FuturesTrading #TradingSignals #BitcoinPrice
Bitcoin lost its 200 day average at 73,000 and its 200 week at 68,000. 📉
Halogen Capital reports Bitcoin lost key technical levels in a decline of more than 20 percent over the week, breaking the 200 day moving average near 73,000 dollars and the 200 week moving average near 68,000 in a single day as the rout accelerated on Friday. 📊 CryptoQuant data cited by Brave New Coin puts the short term holder realised price near 75,000 dollars against spot near 65,000, with recent buyers' unrealised returns falling from plus 35 percent in September to minus 15 percent, and resistance now at 68,700 to 76,000. My reading is that losing both long averages in one week is a trend change, not noise, and Bitcoin must reclaim 68,000 before anyone calls a bottom.
Does Bitcoin reclaim 68,000 this week, or test the 2026 low of 57,718 first? 🤔
Follow for more trades.
#Crypto #Bitcoin #FuturesTrading #TradingSignals #BitcoinPrice
Halogen Capital reports Bitcoin lost key technical levels in a decline of more than 20 percent over the week, breaking the 200 day moving average near 73,000 dollars and the 200 week moving average near 68,000 in a single day as the rout accelerated on Friday. 📊 CryptoQuant data cited by Brave New Coin puts the short term holder realised price near 75,000 dollars against spot near 65,000, with recent buyers' unrealised returns falling from plus 35 percent in September to minus 15 percent, and resistance now at 68,700 to 76,000. My reading is that losing both long averages in one week is a trend change, not noise, and Bitcoin must reclaim 68,000 before anyone calls a bottom.
Does Bitcoin reclaim 68,000 this week, or test the 2026 low of 57,718 first? 🤔
Follow for more trades.
#Crypto #Bitcoin #FuturesTrading #TradingSignals #BitcoinPrice
28
·
--
Does Bitcoin hold 65,000 dollars, or does it retest 62,000 first? 🤔
Bitcoin is near 65,000 dollars after bouncing off a 62,081 low on Sunday, with fear and greed at 10, ETF outflows at 1.91 billion dollars over seven sessions, and about 2 billion dollars of liquidations in a day, almost all of it longs. 📊 The levels are clean, 62,081 is the support that held once, and 65,980 is the resistance that has to break before the bounce becomes a recovery, while Monday brings the first ETF flow print after the weekend. My own view is that I do not guess the bottom, I let the level decide, and I would rather miss the first bounce than catch a falling knife with leverage in a market that keeps wiping out longs.
Your call, does 65,000 hold into Monday, or do we see 62,000 again first? 👉
Follow for more trades.
#Crypto #Bitcoin #FuturesTrading #TradingSignals #BitcoinPrice
Does Bitcoin hold 65,000 dollars, or does it retest 62,000 first? 🤔
Bitcoin is near 65,000 dollars after bouncing off a 62,081 low on Sunday, with fear and greed at 10, ETF outflows at 1.91 billion dollars over seven sessions, and about 2 billion dollars of liquidations in a day, almost all of it longs. 📊 The levels are clean, 62,081 is the support that held once, and 65,980 is the resistance that has to break before the bounce becomes a recovery, while Monday brings the first ETF flow print after the weekend. My own view is that I do not guess the bottom, I let the level decide, and I would rather miss the first bounce than catch a falling knife with leverage in a market that keeps wiping out longs.
Your call, does 65,000 hold into Monday, or do we see 62,000 again first? 👉
Follow for more trades.
#Crypto #Bitcoin #FuturesTrading #TradingSignals #BitcoinPrice
Bitcoin is near 65,000 dollars after bouncing off a 62,081 low on Sunday, with fear and greed at 10, ETF outflows at 1.91 billion dollars over seven sessions, and about 2 billion dollars of liquidations in a day, almost all of it longs. 📊 The levels are clean, 62,081 is the support that held once, and 65,980 is the resistance that has to break before the bounce becomes a recovery, while Monday brings the first ETF flow print after the weekend. My own view is that I do not guess the bottom, I let the level decide, and I would rather miss the first bounce than catch a falling knife with leverage in a market that keeps wiping out longs.
Your call, does 65,000 hold into Monday, or do we see 62,000 again first? 👉
Follow for more trades.
#Crypto #Bitcoin #FuturesTrading #TradingSignals #BitcoinPrice
7
·
--
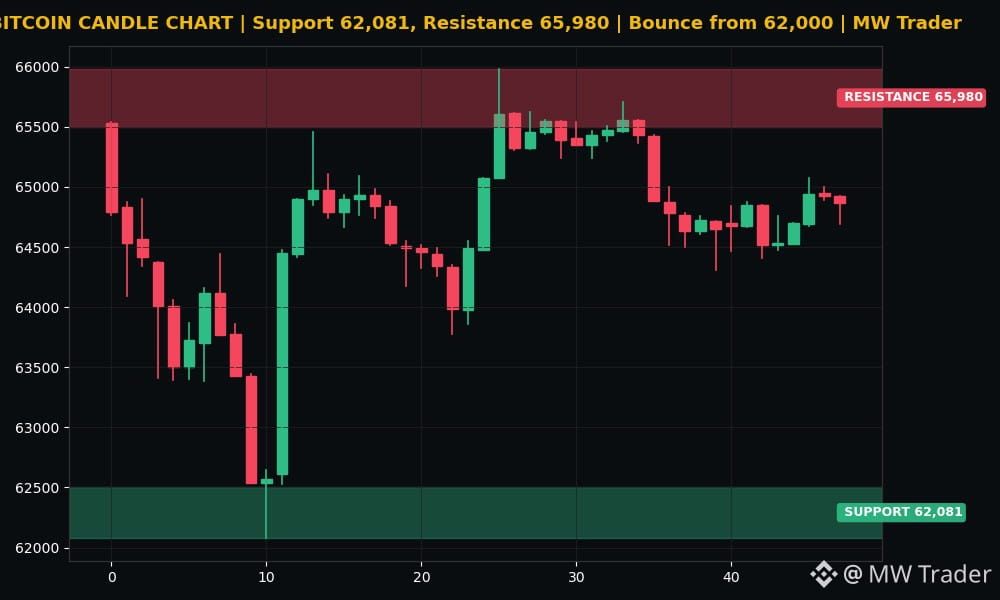
Bitcoin bounced off 62,081 dollars and climbed back above 65,000. 📈
CoinGecko data checked at 02:00 PKT puts Bitcoin near 64,864 dollars on the last 30 minute close, after a 24 hour range from 62,081 to 65,980 dollars, and crypto.news reports Bitcoin touched about 62,000 dollars on Sunday before buyers stepped in. 📊 Corgano reports the rebound came after one of the sharpest 10 day declines in crypto history, driven by steady ETF selling, forced liquidations and Fed hike fears, so this bounce is real buying, not just a quiet Sunday print. My reading is that 62,081 is now the line that matters, because holding above it keeps the bounce alive, while losing it again opens 60,000 fast.
Does Bitcoin hold 65,000 into Monday, or does the bounce fade back to 62,000? 🤔
Follow for more trades.
#Crypto #Bitcoin #FuturesTrading #TradingSignals #BitcoinPrice
Bitcoin bounced off 62,081 dollars and climbed back above 65,000. 📈
CoinGecko data checked at 02:00 PKT puts Bitcoin near 64,864 dollars on the last 30 minute close, after a 24 hour range from 62,081 to 65,980 dollars, and crypto.news reports Bitcoin touched about 62,000 dollars on Sunday before buyers stepped in. 📊 Corgano reports the rebound came after one of the sharpest 10 day declines in crypto history, driven by steady ETF selling, forced liquidations and Fed hike fears, so this bounce is real buying, not just a quiet Sunday print. My reading is that 62,081 is now the line that matters, because holding above it keeps the bounce alive, while losing it again opens 60,000 fast.
Does Bitcoin hold 65,000 into Monday, or does the bounce fade back to 62,000? 🤔
Follow for more trades.
#Crypto #Bitcoin #FuturesTrading #TradingSignals #BitcoinPrice
CoinGecko data checked at 02:00 PKT puts Bitcoin near 64,864 dollars on the last 30 minute close, after a 24 hour range from 62,081 to 65,980 dollars, and crypto.news reports Bitcoin touched about 62,000 dollars on Sunday before buyers stepped in. 📊 Corgano reports the rebound came after one of the sharpest 10 day declines in crypto history, driven by steady ETF selling, forced liquidations and Fed hike fears, so this bounce is real buying, not just a quiet Sunday print. My reading is that 62,081 is now the line that matters, because holding above it keeps the bounce alive, while losing it again opens 60,000 fast.
Does Bitcoin hold 65,000 into Monday, or does the bounce fade back to 62,000? 🤔
Follow for more trades.
#Crypto #Bitcoin #FuturesTrading #TradingSignals #BitcoinPrice
1
·
--
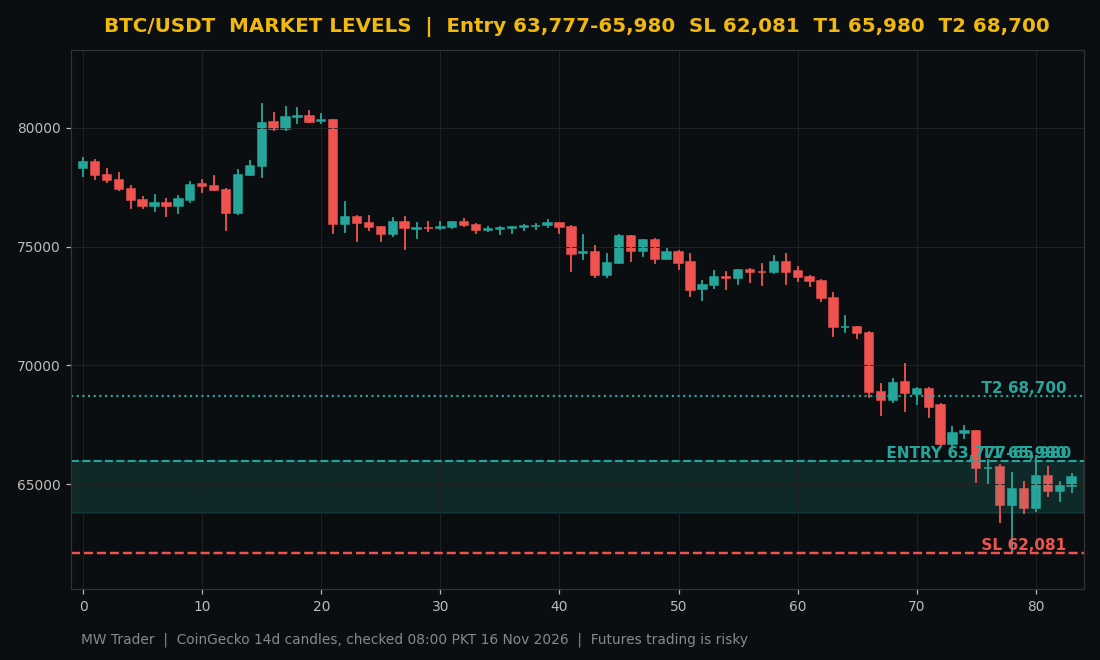
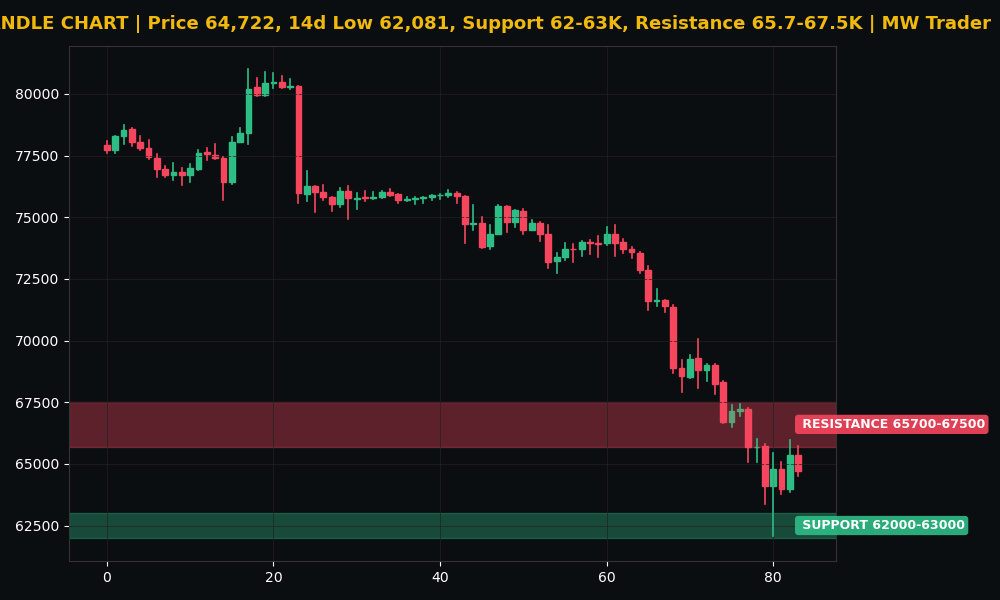
Bitcoin holds 64,700 dollars into the weekly close, and Monday decides everything. 📉
CoinGecko data checked at 23:00 PKT puts Bitcoin near 64,700 dollars after printing a 14 day low of 62,081 dollars on Saturday night, per crypto.news. 📊 United States spot Bitcoin ETFs lost about 1.91 billion dollars over seven straight sessions through November 13, per Farside Investors, and CoinGlass counted about 1.96 billion dollars of liquidations in 24 hours, with BlackRock's IBIT alone on an 11 session outflow streak worth 2.35 billion dollars since October 30. The chart shows real candles with the 62,000 to 63,000 support zone and the 65,700 to 67,500 resistance zone marked. My reading is that the bounce is holding for now, but it means little until Monday's ETF flows show whether buyers are back or the selling continues.
Does Bitcoin defend 62,000 dollars on Monday, or test 60,000 first? 🤔
Follow for more trades.
#Crypto #Bitcoin #FuturesTrading #TradingSignals #BitcoinPrice
Bitcoin holds 64,700 dollars into the weekly close, and Monday decides everything. 📉
CoinGecko data checked at 23:00 PKT puts Bitcoin near 64,700 dollars after printing a 14 day low of 62,081 dollars on Saturday night, per crypto.news. 📊 United States spot Bitcoin ETFs lost about 1.91 billion dollars over seven straight sessions through November 13, per Farside Investors, and CoinGlass counted about 1.96 billion dollars of liquidations in 24 hours, with BlackRock's IBIT alone on an 11 session outflow streak worth 2.35 billion dollars since October 30. The chart shows real candles with the 62,000 to 63,000 support zone and the 65,700 to 67,500 resistance zone marked. My reading is that the bounce is holding for now, but it means little until Monday's ETF flows show whether buyers are back or the selling continues.
Does Bitcoin defend 62,000 dollars on Monday, or test 60,000 first? 🤔
Follow for more trades.
#Crypto #Bitcoin #FuturesTrading #TradingSignals #BitcoinPrice
CoinGecko data checked at 23:00 PKT puts Bitcoin near 64,700 dollars after printing a 14 day low of 62,081 dollars on Saturday night, per crypto.news. 📊 United States spot Bitcoin ETFs lost about 1.91 billion dollars over seven straight sessions through November 13, per Farside Investors, and CoinGlass counted about 1.96 billion dollars of liquidations in 24 hours, with BlackRock's IBIT alone on an 11 session outflow streak worth 2.35 billion dollars since October 30. The chart shows real candles with the 62,000 to 63,000 support zone and the 65,700 to 67,500 resistance zone marked. My reading is that the bounce is holding for now, but it means little until Monday's ETF flows show whether buyers are back or the selling continues.
Does Bitcoin defend 62,000 dollars on Monday, or test 60,000 first? 🤔
Follow for more trades.
#Crypto #Bitcoin #FuturesTrading #TradingSignals #BitcoinPrice
9
·
--
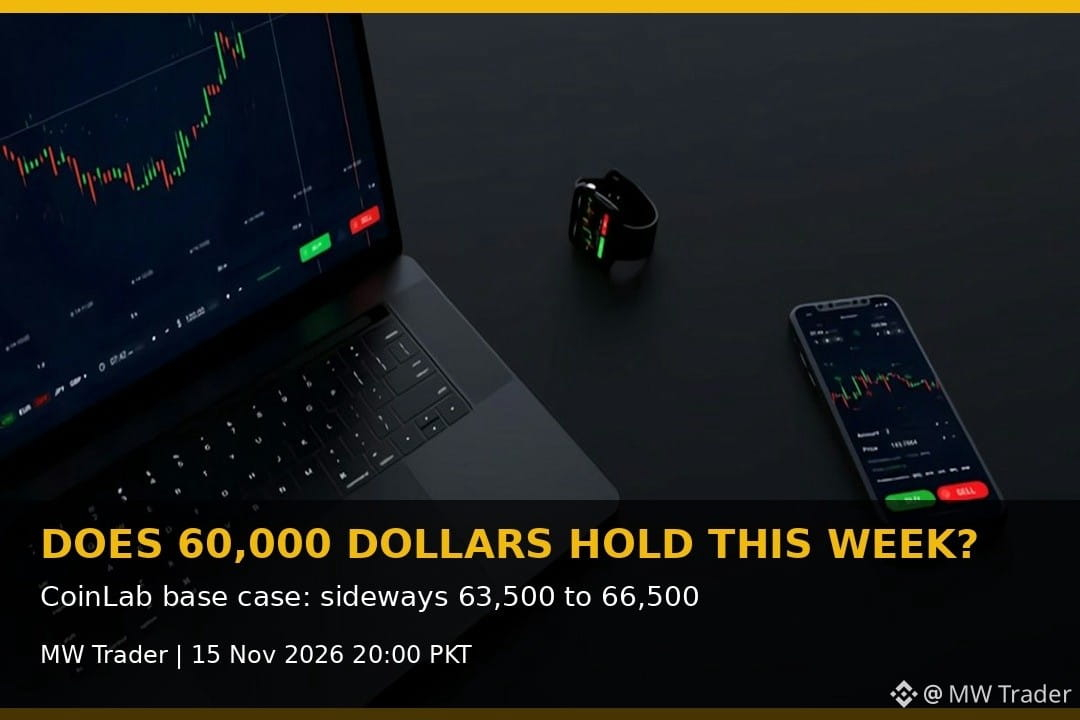
Does 60,000 dollars hold this week? 🤔
CoinLab gives a base case for the next 24 hours of sideways trading between 63,500 and 66,500 dollars at 48 percent probability, a pullback to 60,500 to 63,500 at 30 percent, and a rebound to 66,500 to 69,000 at 22 percent. 📊 Sunday liquidity is thin, the weekly close lands tonight, and Monday brings the first real test of whether buyers defend 62,000 or let the Glassnode liquidation cluster at 59,500 to 62,600 trigger the next leg. My view is that 60,000 is the level the whole market is watching, and a clean break there changes everything.
What is your call, does Bitcoin hold 60,000, or break it this week? 👉
Follow for more trades.
#Crypto #Bitcoin #FuturesTrading #TradingSignals #BitcoinPrice
Does 60,000 dollars hold this week? 🤔
CoinLab gives a base case for the next 24 hours of sideways trading between 63,500 and 66,500 dollars at 48 percent probability, a pullback to 60,500 to 63,500 at 30 percent, and a rebound to 66,500 to 69,000 at 22 percent. 📊 Sunday liquidity is thin, the weekly close lands tonight, and Monday brings the first real test of whether buyers defend 62,000 or let the Glassnode liquidation cluster at 59,500 to 62,600 trigger the next leg. My view is that 60,000 is the level the whole market is watching, and a clean break there changes everything.
What is your call, does Bitcoin hold 60,000, or break it this week? 👉
Follow for more trades.
#Crypto #Bitcoin #FuturesTrading #TradingSignals #BitcoinPrice
CoinLab gives a base case for the next 24 hours of sideways trading between 63,500 and 66,500 dollars at 48 percent probability, a pullback to 60,500 to 63,500 at 30 percent, and a rebound to 66,500 to 69,000 at 22 percent. 📊 Sunday liquidity is thin, the weekly close lands tonight, and Monday brings the first real test of whether buyers defend 62,000 or let the Glassnode liquidation cluster at 59,500 to 62,600 trigger the next leg. My view is that 60,000 is the level the whole market is watching, and a clean break there changes everything.
What is your call, does Bitcoin hold 60,000, or break it this week? 👉
Follow for more trades.
#Crypto #Bitcoin #FuturesTrading #TradingSignals #BitcoinPrice
2
·
--
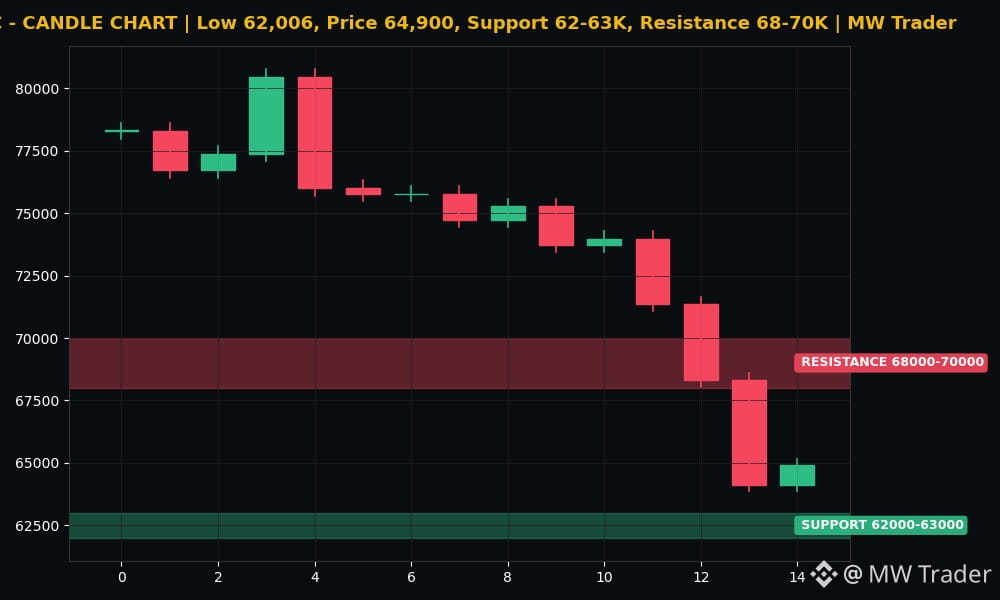
Bitcoin is at 64,900 dollars, and the 200 week moving average is gone. 📉
CoinGecko data checked at 20:00 PKT puts Bitcoin near 64,900 dollars after printing an intraday low of 62,006 dollars on Saturday night, per CoinLab. 📊 The chart shows real candles with the 62,000 to 63,000 support zone and the 68,000 to 70,000 resistance zone marked. Bitcoin has now lost its 200 week moving average near 67,850 dollars, short term holder realized price is 75,068 dollars, and CryptoQuant data shows under 45 percent of active supply still in profit. My reading is that the bounce is real but the trend is still down until 68,000 is reclaimed.
Does Bitcoin reclaim 68,000 dollars this week, or test 60,000 first? 🤔
Follow for more trades.
#Crypto #Bitcoin #FuturesTrading #TradingSignals #BitcoinPrice
Bitcoin is at 64,900 dollars, and the 200 week moving average is gone. 📉
CoinGecko data checked at 20:00 PKT puts Bitcoin near 64,900 dollars after printing an intraday low of 62,006 dollars on Saturday night, per CoinLab. 📊 The chart shows real candles with the 62,000 to 63,000 support zone and the 68,000 to 70,000 resistance zone marked. Bitcoin has now lost its 200 week moving average near 67,850 dollars, short term holder realized price is 75,068 dollars, and CryptoQuant data shows under 45 percent of active supply still in profit. My reading is that the bounce is real but the trend is still down until 68,000 is reclaimed.
Does Bitcoin reclaim 68,000 dollars this week, or test 60,000 first? 🤔
Follow for more trades.
#Crypto #Bitcoin #FuturesTrading #TradingSignals #BitcoinPrice
CoinGecko data checked at 20:00 PKT puts Bitcoin near 64,900 dollars after printing an intraday low of 62,006 dollars on Saturday night, per CoinLab. 📊 The chart shows real candles with the 62,000 to 63,000 support zone and the 68,000 to 70,000 resistance zone marked. Bitcoin has now lost its 200 week moving average near 67,850 dollars, short term holder realized price is 75,068 dollars, and CryptoQuant data shows under 45 percent of active supply still in profit. My reading is that the bounce is real but the trend is still down until 68,000 is reclaimed.
Does Bitcoin reclaim 68,000 dollars this week, or test 60,000 first? 🤔
Follow for more trades.
#Crypto #Bitcoin #FuturesTrading #TradingSignals #BitcoinPrice
5
#Bitcoin #BTC #BitcoinAnalysis #CryptoMarket #Cryptocurrency #CryptoNews #BitcoinTrading #Bitcoinprice
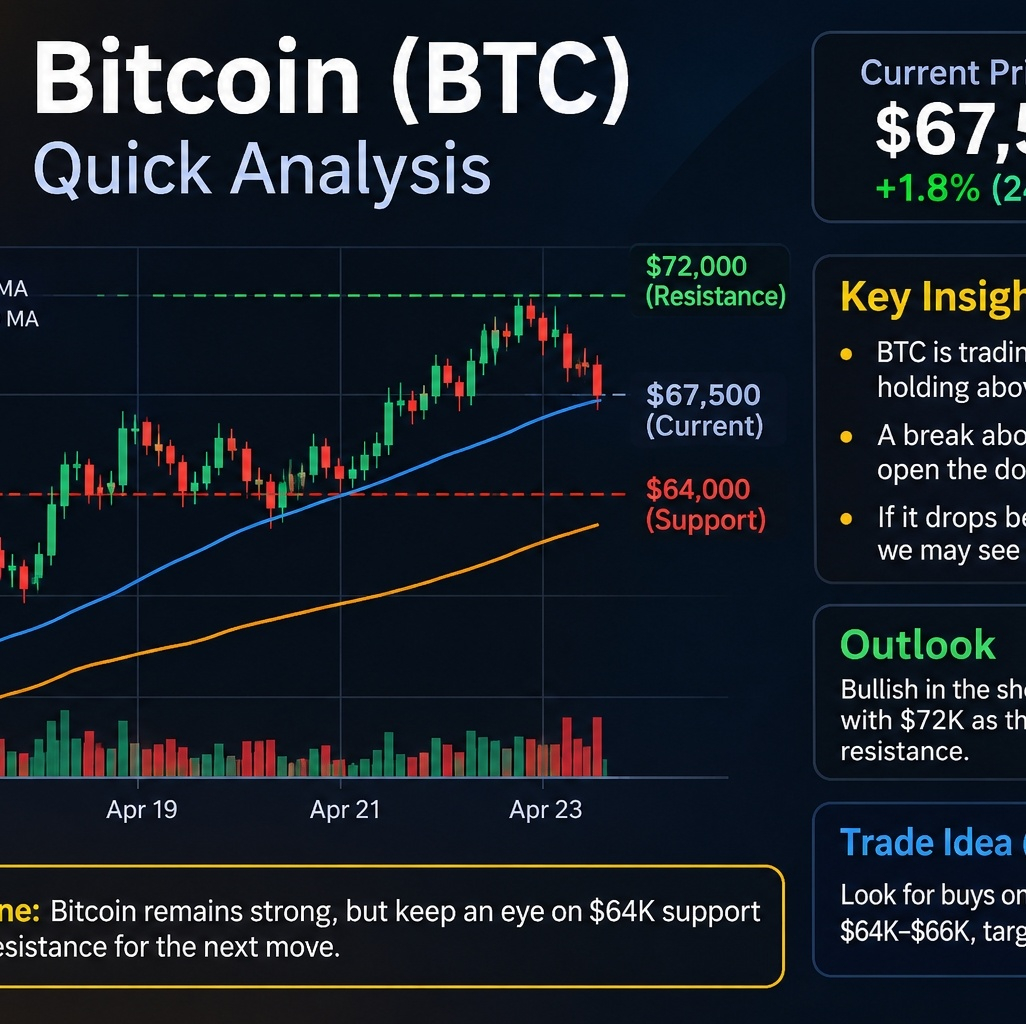
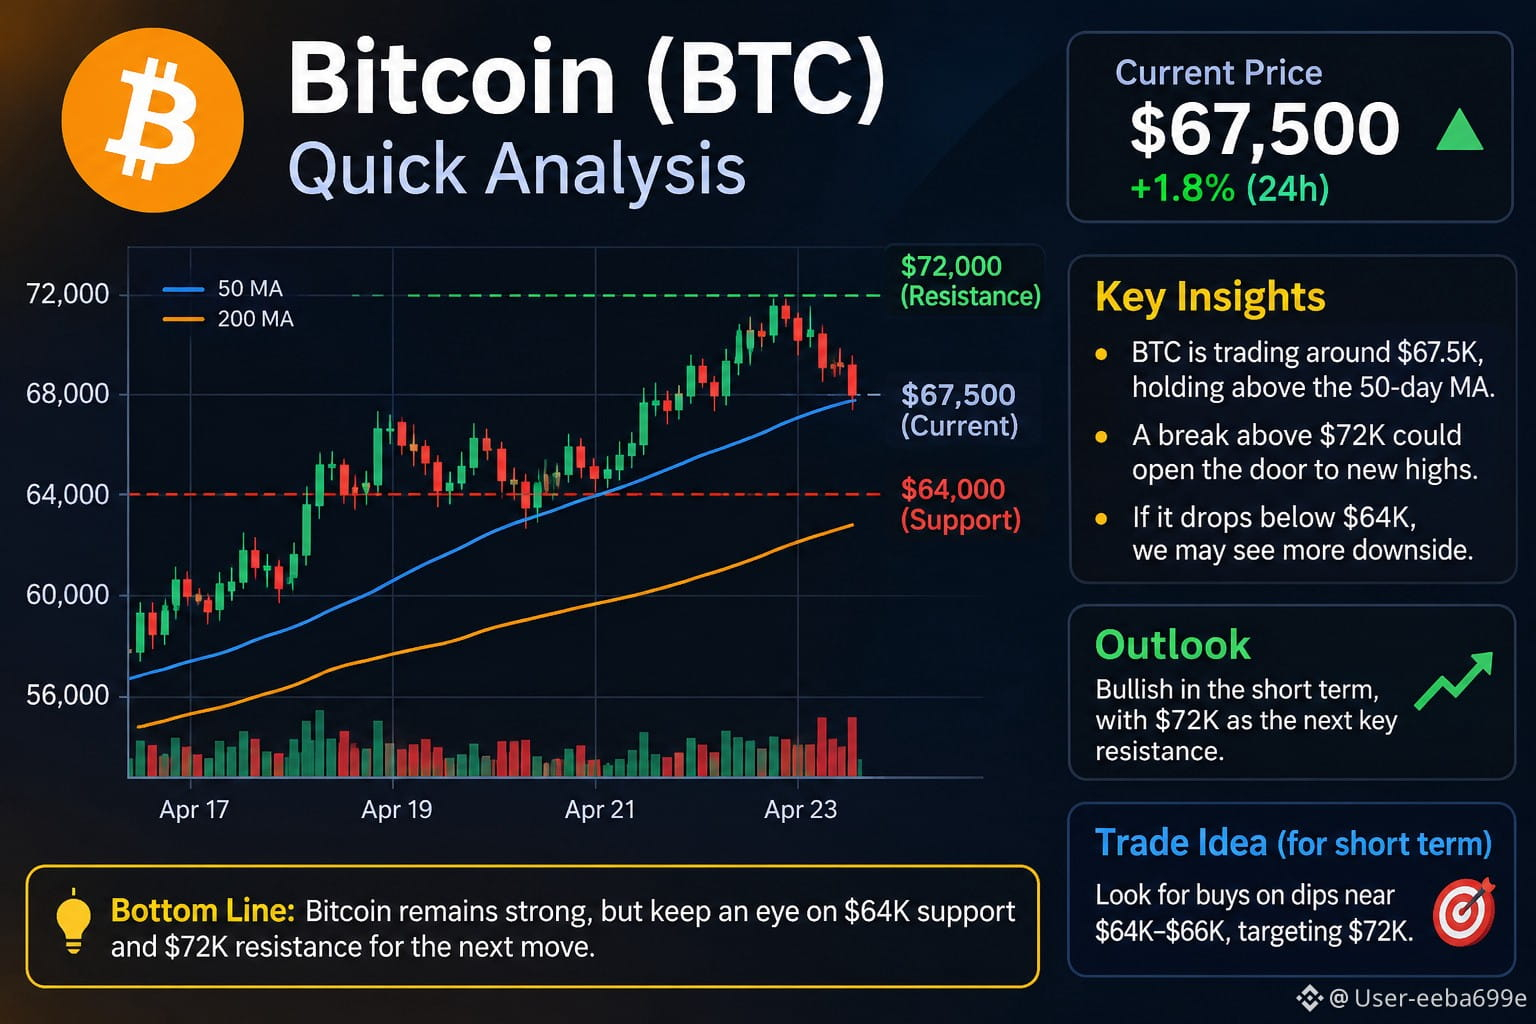
Bitcoin is currently trading around $65,000 USD. The market has experienced strong selling pressure, with BTC falling significantly over the past week. However, a small recovery is visible.
#Bitcoin #BTC #BitcoinAnalysis #CryptoMarket #Cryptocurrency #CryptoNews #BitcoinTrading #Bitcoinprice
Bitcoin is currently trading around $65,000 USD. The market has experienced strong selling pressure, with BTC falling significantly over the past week. However, a small recovery is visible.
Bitcoin is currently trading around $65,000 USD. The market has experienced strong selling pressure, with BTC falling significantly over the past week. However, a small recovery is visible.
140
Log in to explore more content
Join global crypto users on Binance Square
⚡️ Get latest and useful information about crypto.
💬 Trusted by the world’s largest crypto exchange.
👍 Discover real insights from verified creators.
Email / Phone number
Trending Topics
1
#AnthropicToDebutAfter$83IPOPricing
15,333 views
179 Discussing
2
#BTCRemainsUnderPressureAfterHawkishFOMCMinutes
57,463 views
1,451 Discussing
3
#NvidiaBoardReportedlySplitOverHuang’sReturn
19,065 views
721 Discussing
4
#MASToUpgradeSGDTestnetToSGDigitalLedger
0 views
19 Discussing
5
#CanGTA6'sLaunchLiftTTWOShares?
10,661 views
560 Discussing
6
#AnthropicRecord$107BRaiseSetToTopSpaceXIPO
0 views
20 Discussing
7
#TetherMakesStrategicInvestmentInSCRYPT
0 views
0 Discussing
8
#CapitalGroupAdds1264500StrategyShares
0 views
149 Discussing
9
#FOMCMinutesHighlightAIDebtRisks
19,609 views
587 Discussing
10
#AntInternationalLaunchesWhaleProtocol
0 views
83 Discussing