

#26
26
9,322 views
156 Discussing
Hot
Latest

·
--
26% increase, but the funding rate is negative?
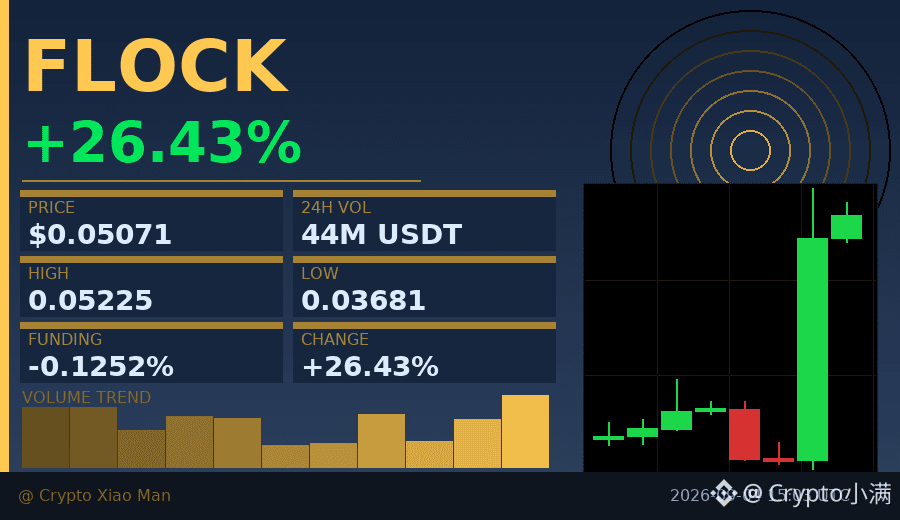
FLOCK rose to 0.05071 today, with trading volume of 44.2 million U, but the funding rate is -0.0125%.
This means shorts are still paying longs—the price is surging, yet no one believes it can last.
The hourly chart has closed green for three straight candles, with longs accounting for 57%, but the negative funding rate shows shorts are still holding on.
This kind of divergence usually appears in the early stage of a move: some traders are already in, while others insist it "will drop back."
The key is whether trading volume can be sustained. If volume keeps expanding, shorts may be forced to cover, accelerating the rally.
$FLOCK #资金费率背离 #26%
Click the small card below to quickly check the market 👇
26% increase, but the funding rate is negative?
FLOCK rose to 0.05071 today, with trading volume of 44.2 million U, but the funding rate is -0.0125%.
This means shorts are still paying longs—the price is surging, yet no one believes it can last.
The hourly chart has closed green for three straight candles, with longs accounting for 57%, but the negative funding rate shows shorts are still holding on.
This kind of divergence usually appears in the early stage of a move: some traders are already in, while others insist it "will drop back."
The key is whether trading volume can be sustained. If volume keeps expanding, shorts may be forced to cover, accelerating the rally.
$FLOCK #资金费率背离 #26%
Click the small card below to quickly check the market 👇
FLOCK rose to 0.05071 today, with trading volume of 44.2 million U, but the funding rate is -0.0125%.
This means shorts are still paying longs—the price is surging, yet no one believes it can last.
The hourly chart has closed green for three straight candles, with longs accounting for 57%, but the negative funding rate shows shorts are still holding on.
This kind of divergence usually appears in the early stage of a move: some traders are already in, while others insist it "will drop back."
The key is whether trading volume can be sustained. If volume keeps expanding, shorts may be forced to cover, accelerating the rally.
$FLOCK #资金费率背离 #26%
Click the small card below to quickly check the market 👇
170

·
--
$VIRTUAL This spot is a bit interesting.
At 15m, there’s a volume expansion of 2.12x and the price pushed up 0.8%. The volatility (Z) reached 2.06, and the closing price directly broke above the upper band of the last ~20 5m candles. This isn’t the kind of low-volume fake breakout; it’s pushing upward with volume behind it.
More importantly, it’s the OI (open interest). At 15m, +0.19%, and at 1h, +0.15%. The cumulative notional change is 357K USDT, increasing across multiple consecutive cycles. Price is rising while OI is rising too, alongside a 26.8% gap in aggressive/active trade execution and a buy-sell ratio of 1.73. The funding rate is also still in a high percentile recently—this setup looks more like newly added leveraged long positions squeezing in, not shorts covering and pushing.
At the unusual percentile of 93.1%, it ranks #15 in the whole pool, with notional change at #26. It’s also not far from its own historical extreme range.
Over the past 24h, the trading value is 37.76M. Liquidity depth is sufficient—not the kind of order book that slips just from a light touch. But on the flip side: high funding plus continuously rising OI means longs are already crowded. If they can’t push it further, a reversal liquidation wave can come quickly.
First, see whether this breakout can hold. If it can’t, it’s likely a bull trap; only if it holds can it be the real start.
$VIRTUAL This spot is a bit interesting.
At 15m, there’s a volume expansion of 2.12x and the price pushed up 0.8%. The volatility (Z) reached 2.06, and the closing price directly broke above the upper band of the last ~20 5m candles. This isn’t the kind of low-volume fake breakout; it’s pushing upward with volume behind it.
More importantly, it’s the OI (open interest). At 15m, +0.19%, and at 1h, +0.15%. The cumulative notional change is 357K USDT, increasing across multiple consecutive cycles. Price is rising while OI is rising too, alongside a 26.8% gap in aggressive/active trade execution and a buy-sell ratio of 1.73. The funding rate is also still in a high percentile recently—this setup looks more like newly added leveraged long positions squeezing in, not shorts covering and pushing.
At the unusual percentile of 93.1%, it ranks #15 in the whole pool, with notional change at #26. It’s also not far from its own historical extreme range.
Over the past 24h, the trading value is 37.76M. Liquidity depth is sufficient—not the kind of order book that slips just from a light touch. But on the flip side: high funding plus continuously rising OI means longs are already crowded. If they can’t push it further, a reversal liquidation wave can come quickly.
First, see whether this breakout can hold. If it can’t, it’s likely a bull trap; only if it holds can it be the real start.
At 15m, there’s a volume expansion of 2.12x and the price pushed up 0.8%. The volatility (Z) reached 2.06, and the closing price directly broke above the upper band of the last ~20 5m candles. This isn’t the kind of low-volume fake breakout; it’s pushing upward with volume behind it.
More importantly, it’s the OI (open interest). At 15m, +0.19%, and at 1h, +0.15%. The cumulative notional change is 357K USDT, increasing across multiple consecutive cycles. Price is rising while OI is rising too, alongside a 26.8% gap in aggressive/active trade execution and a buy-sell ratio of 1.73. The funding rate is also still in a high percentile recently—this setup looks more like newly added leveraged long positions squeezing in, not shorts covering and pushing.
At the unusual percentile of 93.1%, it ranks #15 in the whole pool, with notional change at #26. It’s also not far from its own historical extreme range.
Over the past 24h, the trading value is 37.76M. Liquidity depth is sufficient—not the kind of order book that slips just from a light touch. But on the flip side: high funding plus continuously rising OI means longs are already crowded. If they can’t push it further, a reversal liquidation wave can come quickly.
First, see whether this breakout can hold. If it can’t, it’s likely a bull trap; only if it holds can it be the real start.
52
·
--
$ENJ This 15m has something to it—the volume directly pushes to 2.98x. The price is pressed right along the upper edge of the 20x 5m range, pushing upward.
OI is rising too: 15m +0.51%, 1h +0.19%. This doesn’t look like short covering with a fake pull; it’s more like new longs are moving in. The active buy/sell ratio is 1.13, down 6.1%; the bids are still relatively aggressive.
The abnormal percentile is 83.9%, the whole pool #26—not the most explosive batch, but with this volume it could break out. Worth watching to see if it can hold and stay above.
$ENJ This 15m has something to it—the volume directly pushes to 2.98x. The price is pressed right along the upper edge of the 20x 5m range, pushing upward.
OI is rising too: 15m +0.51%, 1h +0.19%. This doesn’t look like short covering with a fake pull; it’s more like new longs are moving in. The active buy/sell ratio is 1.13, down 6.1%; the bids are still relatively aggressive.
The abnormal percentile is 83.9%, the whole pool #26—not the most explosive batch, but with this volume it could break out. Worth watching to see if it can hold and stay above.
OI is rising too: 15m +0.51%, 1h +0.19%. This doesn’t look like short covering with a fake pull; it’s more like new longs are moving in. The active buy/sell ratio is 1.13, down 6.1%; the bids are still relatively aggressive.
The abnormal percentile is 83.9%, the whole pool #26—not the most explosive batch, but with this volume it could break out. Worth watching to see if it can hold and stay above.
7

·
--
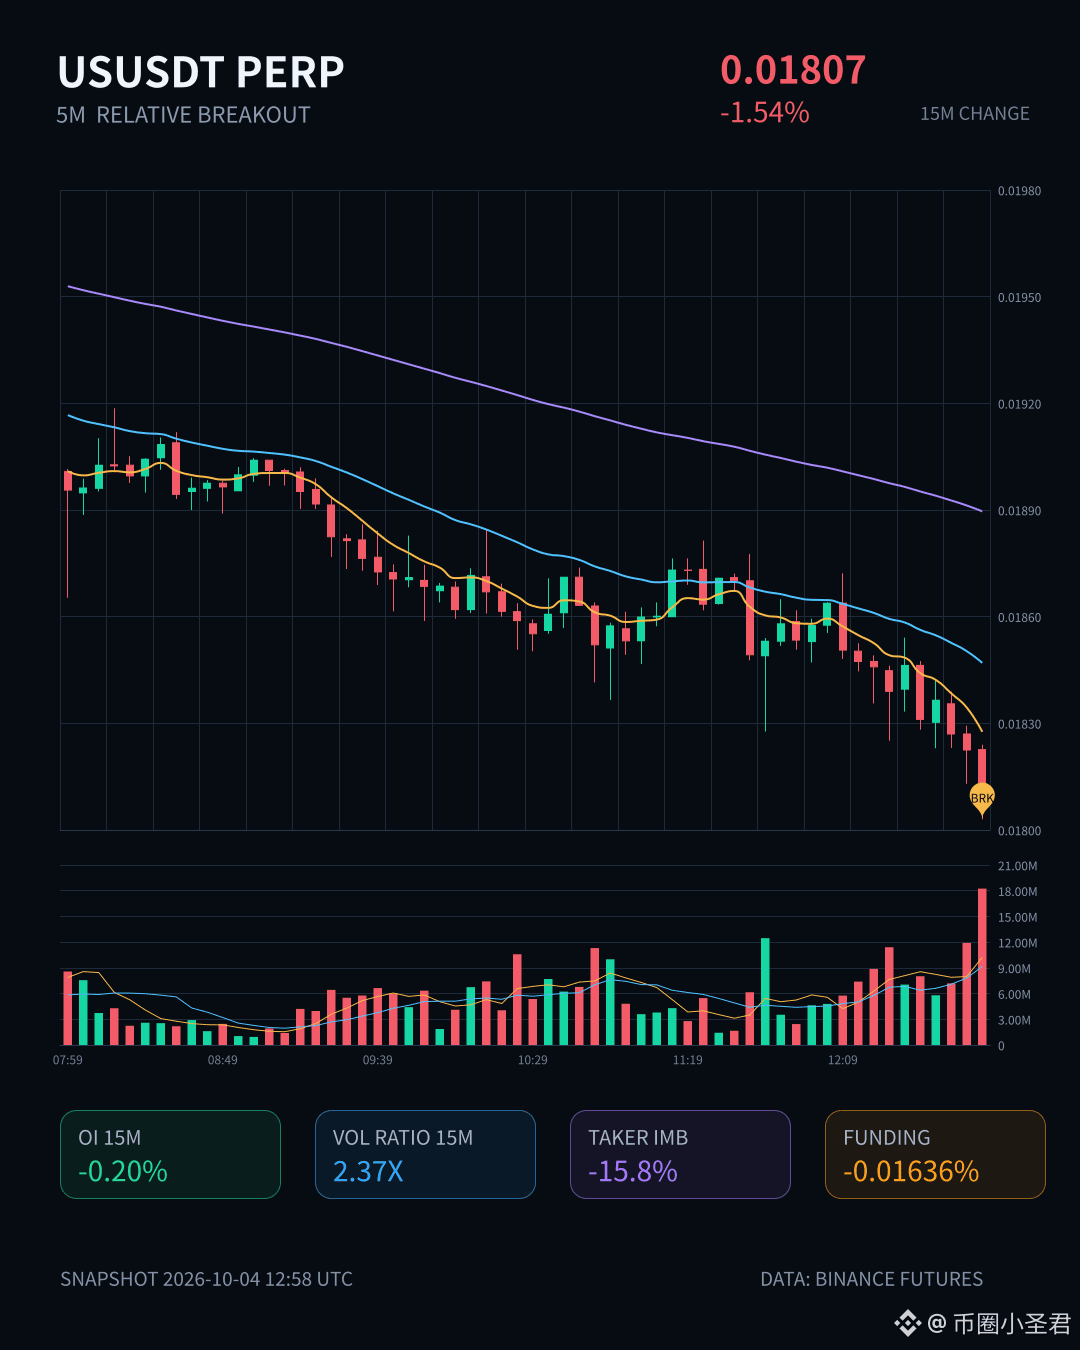
$US This drop isn’t particularly brutal, but the structure is quite interesting. In the 15m timeframe, it’s down 1.54%; volume expands to 2.37x; the Z value is 3.28. The price directly breaks below the lower band of roughly the last 20 5m candles—looks like someone was swept out.
The key is that OI didn’t rise, it actually fell: 15m is -0.20%. On the 1h, nominal is -335K. There’s a strong flavor of deleveraging by longs—not like a fresh short push coming in, but more like stop-loss liquidation and position contraction. Active traded amount is worse by -15.8%; buy/sell ratio is 0.73; sell pressure is indeed dominant.
Whole-pool anomaly #26, nominal change #28—not among the most explosive bunch, but combined with the volume expansion and the breakdown, short-term sentiment should still have some inertia. First, see whether it can regain the range here; if it can’t, then it continues to grind.
$US This drop isn’t particularly brutal, but the structure is quite interesting. In the 15m timeframe, it’s down 1.54%; volume expands to 2.37x; the Z value is 3.28. The price directly breaks below the lower band of roughly the last 20 5m candles—looks like someone was swept out.
The key is that OI didn’t rise, it actually fell: 15m is -0.20%. On the 1h, nominal is -335K. There’s a strong flavor of deleveraging by longs—not like a fresh short push coming in, but more like stop-loss liquidation and position contraction. Active traded amount is worse by -15.8%; buy/sell ratio is 0.73; sell pressure is indeed dominant.
Whole-pool anomaly #26, nominal change #28—not among the most explosive bunch, but combined with the volume expansion and the breakdown, short-term sentiment should still have some inertia. First, see whether it can regain the range here; if it can’t, then it continues to grind.
The key is that OI didn’t rise, it actually fell: 15m is -0.20%. On the 1h, nominal is -335K. There’s a strong flavor of deleveraging by longs—not like a fresh short push coming in, but more like stop-loss liquidation and position contraction. Active traded amount is worse by -15.8%; buy/sell ratio is 0.73; sell pressure is indeed dominant.
Whole-pool anomaly #26, nominal change #28—not among the most explosive bunch, but combined with the volume expansion and the breakdown, short-term sentiment should still have some inertia. First, see whether it can regain the range here; if it can’t, then it continues to grind.
20
·
--
$LYN A relative breakout appeared during the session. On 15m, price is +1.69%, and volume reached 2.25x. The volatility Z value is 2.05, and the trading activity is clearly higher than normal. Price closed above the upper boundary of the recent 20-swing 5m K-line range. The aggressive trade imbalance is -17.6%, and the buy/sell ratio is 1.43—indicating a fairly clear buy-leaning direction.
OI also rose slightly in parallel: 15m +0.09%, 1h +0.10%, with notional changes of 185K / 224K USDT. Structurally, it looks closer to new leveraged long participation rather than just a simple short-covering move. The abnormal percentile is 86.3%; the whole-pool abnormality is #22. Notional change rank is #26. Over the past 24h, trading volume is 33.48M USDT. Depth confirmation is still reasonably solid.
A typical volume-price + OI resonance breakout—first, see whether it can hold above the top of this range. $LYN
$LYN A relative breakout appeared during the session. On 15m, price is +1.69%, and volume reached 2.25x. The volatility Z value is 2.05, and the trading activity is clearly higher than normal. Price closed above the upper boundary of the recent 20-swing 5m K-line range. The aggressive trade imbalance is -17.6%, and the buy/sell ratio is 1.43—indicating a fairly clear buy-leaning direction.
OI also rose slightly in parallel: 15m +0.09%, 1h +0.10%, with notional changes of 185K / 224K USDT. Structurally, it looks closer to new leveraged long participation rather than just a simple short-covering move. The abnormal percentile is 86.3%; the whole-pool abnormality is #22. Notional change rank is #26. Over the past 24h, trading volume is 33.48M USDT. Depth confirmation is still reasonably solid.
A typical volume-price + OI resonance breakout—first, see whether it can hold above the top of this range. $LYN
OI also rose slightly in parallel: 15m +0.09%, 1h +0.10%, with notional changes of 185K / 224K USDT. Structurally, it looks closer to new leveraged long participation rather than just a simple short-covering move. The abnormal percentile is 86.3%; the whole-pool abnormality is #22. Notional change rank is #26. Over the past 24h, trading volume is 33.48M USDT. Depth confirmation is still reasonably solid.
A typical volume-price + OI resonance breakout—first, see whether it can hold above the top of this range. $LYN
24

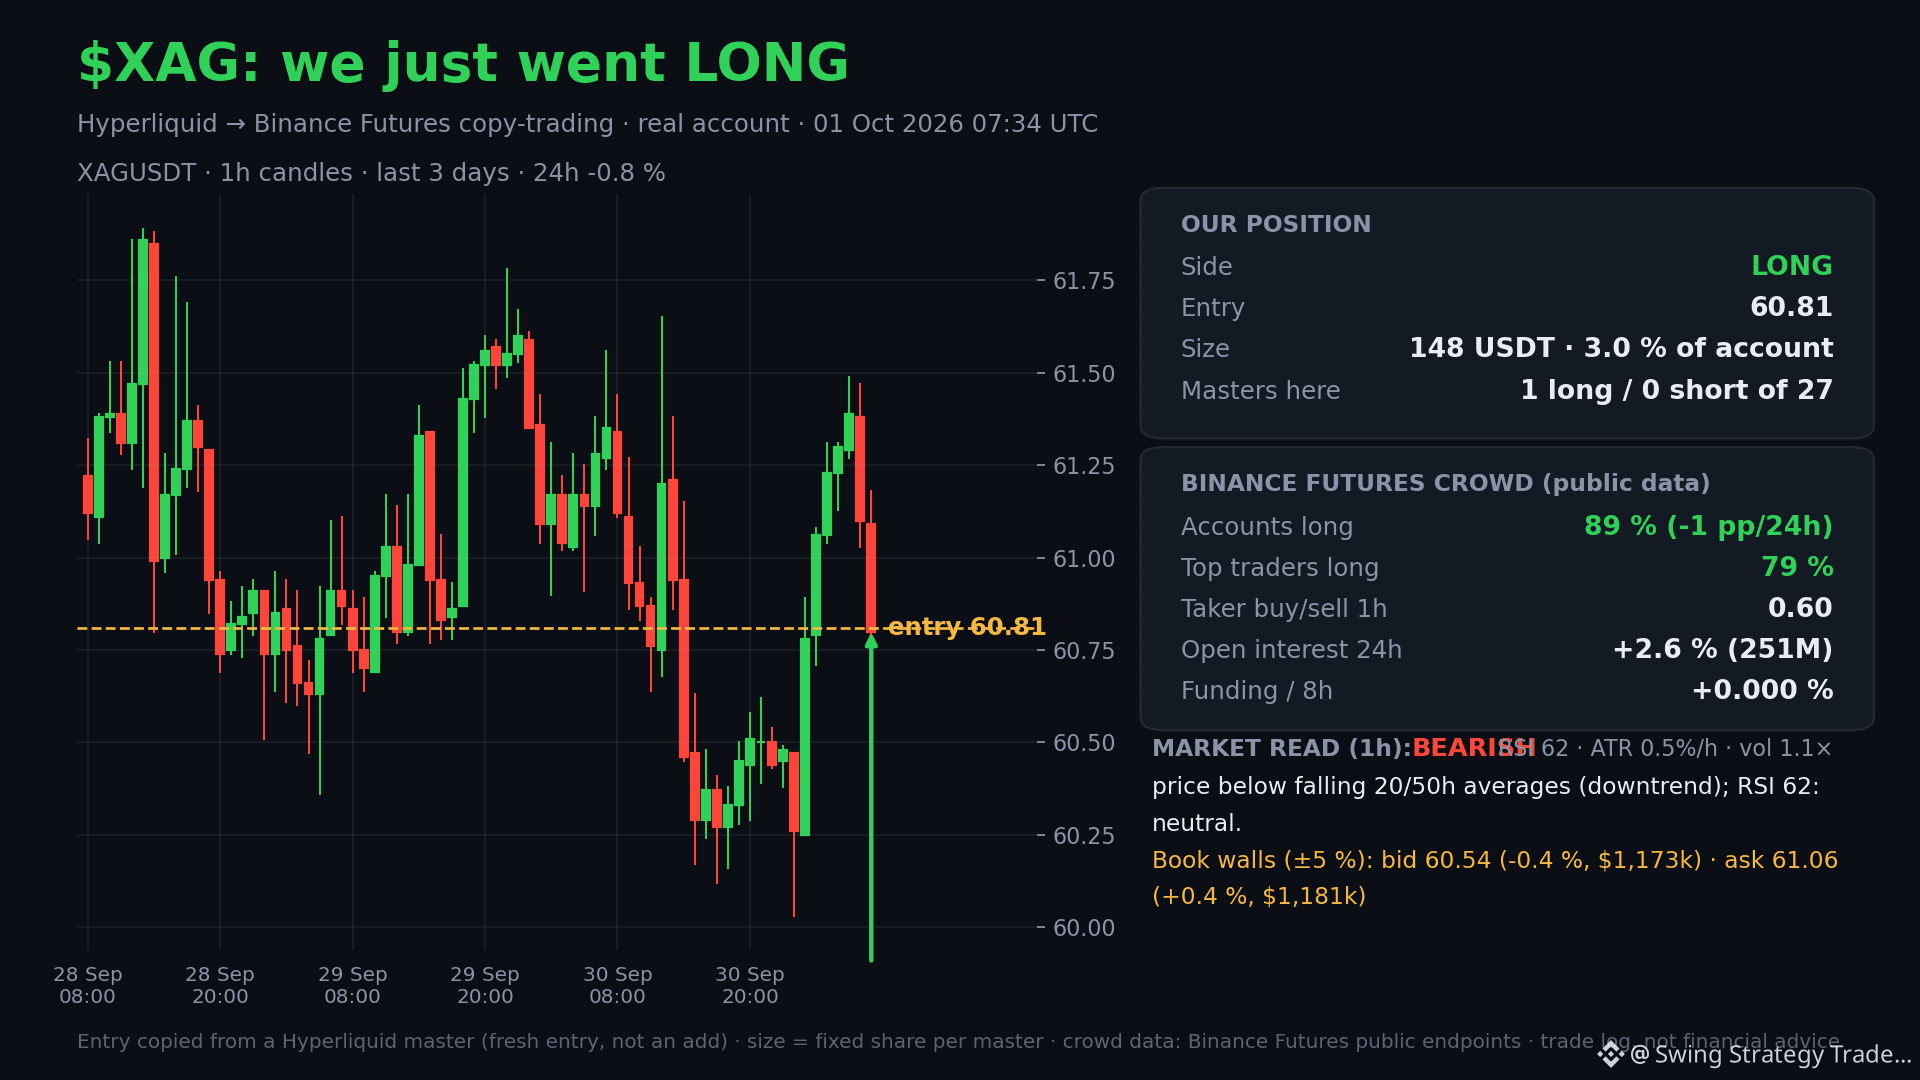
🟢 New trade on our real account: LONG $XAG @ 60.81 · size 148 USDT (3.0 % of the account) · master #26 of 27
Market read: bearish — price below falling 20/50h averages (downtrend); RSI 62: neutral.
Indicators (1h): RSI14 62, EMA20 60.8655 vs EMA50 60.9104, ATR 0.51 % per hour, 24h volume 1.10× the 3-day average, price at 41 % of the 3-day range.
Order book (Binance, ±5 %): biggest bid 60.54 at -0.4 % with $1,173,393; biggest ask 61.06 at +0.4 % with $1,180,771. Binance crowd: 89 % of accounts long, top traders 79 % long, open interest 24h +2.6 %, funding +0.000 %; Hyperliquid OI n/a, 24h volume n/a.
Our masters in $XAG: 1 long / 0 short. The entry is with the majority of Binance accounts.
Read it as a snapshot, not a forecast: the trader decided, we mirrored.
#copytrading #hyperliquid #binancefutures $XAG
If you copy by API like we do, or just want these entries and exits as they happen, we keep a small group on Binance: https://app.binance.com/uni-qr/DpuA7yYD
🟢 New trade on our real account: LONG $XAG @ 60.81 · size 148 USDT (3.0 % of the account) · master #26 of 27
Market read: bearish — price below falling 20/50h averages (downtrend); RSI 62: neutral.
Indicators (1h): RSI14 62, EMA20 60.8655 vs EMA50 60.9104, ATR 0.51 % per hour, 24h volume 1.10× the 3-day average, price at 41 % of the 3-day range.
Order book (Binance, ±5 %): biggest bid 60.54 at -0.4 % with $1,173,393; biggest ask 61.06 at +0.4 % with $1,180,771. Binance crowd: 89 % of accounts long, top traders 79 % long, open interest 24h +2.6 %, funding +0.000 %; Hyperliquid OI n/a, 24h volume n/a.
Our masters in $XAG : 1 long / 0 short. The entry is with the majority of Binance accounts.
Read it as a snapshot, not a forecast: the trader decided, we mirrored.
#copytrading #hyperliquid #binancefutures $XAG
If you copy by API like we do, or just want these entries and exits as they happen, we keep a small group on Binance: https://app.binance.com/uni-qr/DpuA7yYD
Market read: bearish — price below falling 20/50h averages (downtrend); RSI 62: neutral.
Indicators (1h): RSI14 62, EMA20 60.8655 vs EMA50 60.9104, ATR 0.51 % per hour, 24h volume 1.10× the 3-day average, price at 41 % of the 3-day range.
Order book (Binance, ±5 %): biggest bid 60.54 at -0.4 % with $1,173,393; biggest ask 61.06 at +0.4 % with $1,180,771. Binance crowd: 89 % of accounts long, top traders 79 % long, open interest 24h +2.6 %, funding +0.000 %; Hyperliquid OI n/a, 24h volume n/a.
Our masters in $XAG : 1 long / 0 short. The entry is with the majority of Binance accounts.
Read it as a snapshot, not a forecast: the trader decided, we mirrored.
#copytrading #hyperliquid #binancefutures $XAG
If you copy by API like we do, or just want these entries and exits as they happen, we keep a small group on Binance: https://app.binance.com/uni-qr/DpuA7yYD
14
·
--
GRASS This move has a bit of something.
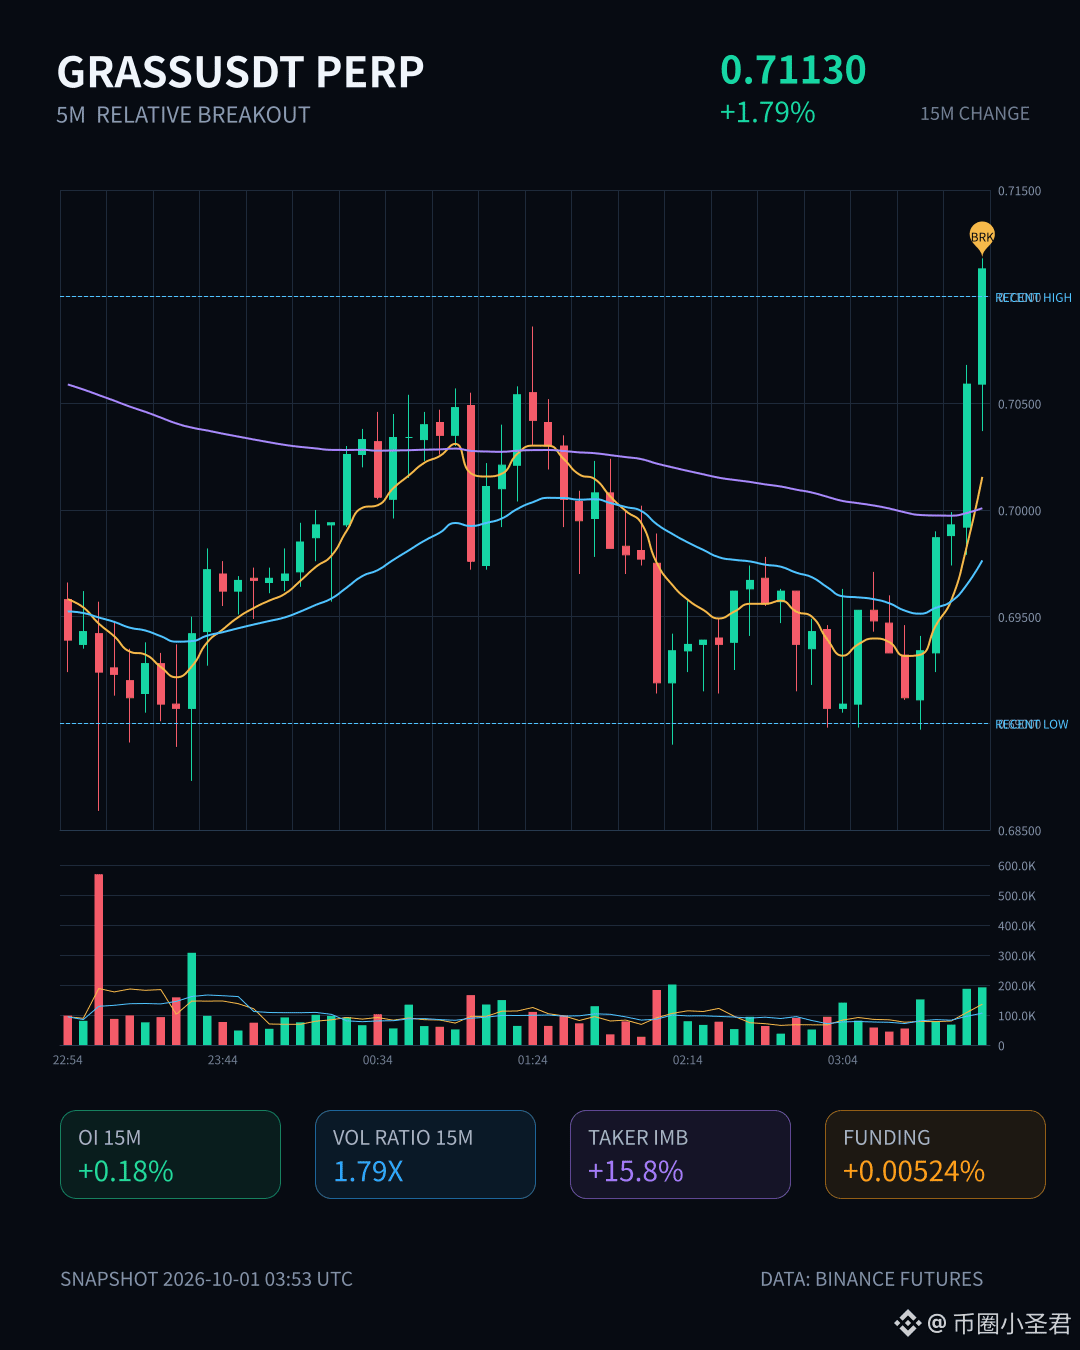
On the 15m timeframe, it’s up 1.79%—volume reached 1.79x, the Z-value is 3.83, and it directly broke through the upper edge of nearly 20 consecutive 5m candles. The key is the active trade imbalance +15.8% and the buy/sell ratio of 1.38—not propping it up with resting orders; there really are people eating upward.
OI is also following through continuously: 15m +0.18%, 1h +0.31%. The cumulative notional change adds up to nearly 900k U. Price is rising while OI is rising—this is the classic new-leverage long entry structure, not some “short covering” fluff.
The abnormal percentile is 84.7%, the whole pool is #17, and the notional change rank is #26, with multiple consecutive cycles showing continuation. In the last 24h, turnover is 76M; the pool isn’t that deep, so volume like this can push it and make it easier to sustain.
First, let’s see whether it can hold above and stand firmly at the top of this range. If it holds, there won’t be much trapped supply above.
GRASS This move has a bit of something.
On the 15m timeframe, it’s up 1.79%—volume reached 1.79x, the Z-value is 3.83, and it directly broke through the upper edge of nearly 20 consecutive 5m candles. The key is the active trade imbalance +15.8% and the buy/sell ratio of 1.38—not propping it up with resting orders; there really are people eating upward.
OI is also following through continuously: 15m +0.18%, 1h +0.31%. The cumulative notional change adds up to nearly 900k U. Price is rising while OI is rising—this is the classic new-leverage long entry structure, not some “short covering” fluff.
The abnormal percentile is 84.7%, the whole pool is #17, and the notional change rank is #26, with multiple consecutive cycles showing continuation. In the last 24h, turnover is 76M; the pool isn’t that deep, so volume like this can push it and make it easier to sustain.
First, let’s see whether it can hold above and stand firmly at the top of this range. If it holds, there won’t be much trapped supply above.
On the 15m timeframe, it’s up 1.79%—volume reached 1.79x, the Z-value is 3.83, and it directly broke through the upper edge of nearly 20 consecutive 5m candles. The key is the active trade imbalance +15.8% and the buy/sell ratio of 1.38—not propping it up with resting orders; there really are people eating upward.
OI is also following through continuously: 15m +0.18%, 1h +0.31%. The cumulative notional change adds up to nearly 900k U. Price is rising while OI is rising—this is the classic new-leverage long entry structure, not some “short covering” fluff.
The abnormal percentile is 84.7%, the whole pool is #17, and the notional change rank is #26, with multiple consecutive cycles showing continuation. In the last 24h, turnover is 76M; the pool isn’t that deep, so volume like this can push it and make it easier to sustain.
First, let’s see whether it can hold above and stand firmly at the top of this range. If it holds, there won’t be much trapped supply above.
14
·
--
LTC This move feels a bit off. On the 15m chart it dropped directly by 1.02%; volume surged to 3.68x, the Z value is 2.92. It broke below the recent 20 five-minute range lows; the active buy/sell ratio is 0.49 and sell pressure is clearly strong. More importantly, OI on the 15m is +0.34%, but the notional is -663K. Price is down while open interest is up—this is a classic case of new leveraged short positions being added, not a liquidation-driven long unwind. With the 88.7% abnormal percentile, on the whole pool #26, depth has been confirmed; the execution direction shows a bias. The 24h turnover is only 118M, and the pool isn’t deep. At this level, if the longs can’t hold, it’s easy for the move to accelerate. Watch the downside—don’t rush to catch it.
LTC This move feels a bit off. On the 15m chart it dropped directly by 1.02%; volume surged to 3.68x, the Z value is 2.92. It broke below the recent 20 five-minute range lows; the active buy/sell ratio is 0.49 and sell pressure is clearly strong. More importantly, OI on the 15m is +0.34%, but the notional is -663K. Price is down while open interest is up—this is a classic case of new leveraged short positions being added, not a liquidation-driven long unwind. With the 88.7% abnormal percentile, on the whole pool #26, depth has been confirmed; the execution direction shows a bias. The 24h turnover is only 118M, and the pool isn’t deep. At this level, if the longs can’t hold, it’s easy for the move to accelerate. Watch the downside—don’t rush to catch it.
1

·
--
“ While it drops 1.5%, why are you buying at ,697? Is NEAR’s 8% jump a ‘pump’ or real”Avalanche (AVAXUSDT) is trending right now!
Rank: #26
Shocking truth: the price only **‑1.476%** dropped, yet with **31 M** volume in the past 24 hours it’s still the most liquid asset in your hands. This shows that the word “drop” is just a “visual.” Most traders are shouting “ETH rekt,” but I think making **DCA** at this dip around **,697.20** is a smart move. On the other hand, the price of **** is missing in today’s dataset, but BTC’s move at the **1K** level from the previous week is still fueling “pump‑and‑dump” theories. BTC’s silence is further increasing volatility in altcoins—especially “overlooked” opportunities like **NEAR** and **BNB**. **NEARUSDT** climbed to **.289** with **+8.426%** in the past 24 hours, with volume of **10 M**. At the open it was at **.878**, and it approached the **.350** high—was that a “pump” signal, or a real “fundamental” jump? In my view, **NEAR**’s “Layer‑2” scaling solutions and new staking mechanics could drag its price into the **‑7** range. **LINKUSDT**, meanwhile, is down **‑6.395%** at **4.404**. Volume is still liquid with **0 M**, but the “dump” wave is still ongoing. This could create a “short squeeze” opportunity for risk-takers. **AVAXUSDT** and **ATOMUSDT** are showing a similar trend too: drops of **‑5.800%** and **‑2.978%**, with volumes of **0 M** and ** M**. These two tokens are under pressure due to integration delays in the “DeFi” ecosystem and reduced “staking rewards.” **BNBUSDT** is **+0.459%**
“ While it drops 1.5%, why are you buying at ,697? Is NEAR’s 8% jump a ‘pump’ or real”
Avalanche (AVAXUSDT) is trending right now!
Rank: #26
Shocking truth: the price only **‑1.476%** dropped, yet with **31 M** volume in the past 24 hours it’s still the most liquid asset in your hands. This shows that the word “drop” is just a “visual.” Most traders are shouting “ETH rekt,” but I think making **DCA** at this dip around **,697.20** is a smart move. On the other hand, the price of **** is missing in today’s dataset, but BTC’s move at the **1K** level from the previous week is still fueling “pump‑and‑dump” theories. BTC’s silence is further increasing volatility in altcoins—especially “overlooked” opportunities like **NEAR** and **BNB**. **NEARUSDT** climbed to **.289** with **+8.426%** in the past 24 hours, with volume of **10 M**. At the open it was at **.878**, and it approached the **.350** high—was that a “pump” signal, or a real “fundamental” jump? In my view, **NEAR**’s “Layer‑2” scaling solutions and new staking mechanics could drag its price into the **‑7** range. **LINKUSDT**, meanwhile, is down **‑6.395%** at **4.404**. Volume is still liquid with **0 M**, but the “dump” wave is still ongoing. This could create a “short squeeze” opportunity for risk-takers. **AVAXUSDT** and **ATOMUSDT** are showing a similar trend too: drops of **‑5.800%** and **‑2.978%**, with volumes of **0 M** and ** M**. These two tokens are under pressure due to integration delays in the “DeFi” ecosystem and reduced “staking rewards.” **BNBUSDT** is **+0.459%**
Rank: #26
Shocking truth: the price only **‑1.476%** dropped, yet with **31 M** volume in the past 24 hours it’s still the most liquid asset in your hands. This shows that the word “drop” is just a “visual.” Most traders are shouting “ETH rekt,” but I think making **DCA** at this dip around **,697.20** is a smart move. On the other hand, the price of **** is missing in today’s dataset, but BTC’s move at the **1K** level from the previous week is still fueling “pump‑and‑dump” theories. BTC’s silence is further increasing volatility in altcoins—especially “overlooked” opportunities like **NEAR** and **BNB**. **NEARUSDT** climbed to **.289** with **+8.426%** in the past 24 hours, with volume of **10 M**. At the open it was at **.878**, and it approached the **.350** high—was that a “pump” signal, or a real “fundamental” jump? In my view, **NEAR**’s “Layer‑2” scaling solutions and new staking mechanics could drag its price into the **‑7** range. **LINKUSDT**, meanwhile, is down **‑6.395%** at **4.404**. Volume is still liquid with **0 M**, but the “dump” wave is still ongoing. This could create a “short squeeze” opportunity for risk-takers. **AVAXUSDT** and **ATOMUSDT** are showing a similar trend too: drops of **‑5.800%** and **‑2.978%**, with volumes of **0 M** and ** M**. These two tokens are under pressure due to integration delays in the “DeFi” ecosystem and reduced “staking rewards.” **BNBUSDT** is **+0.459%**
26

Article
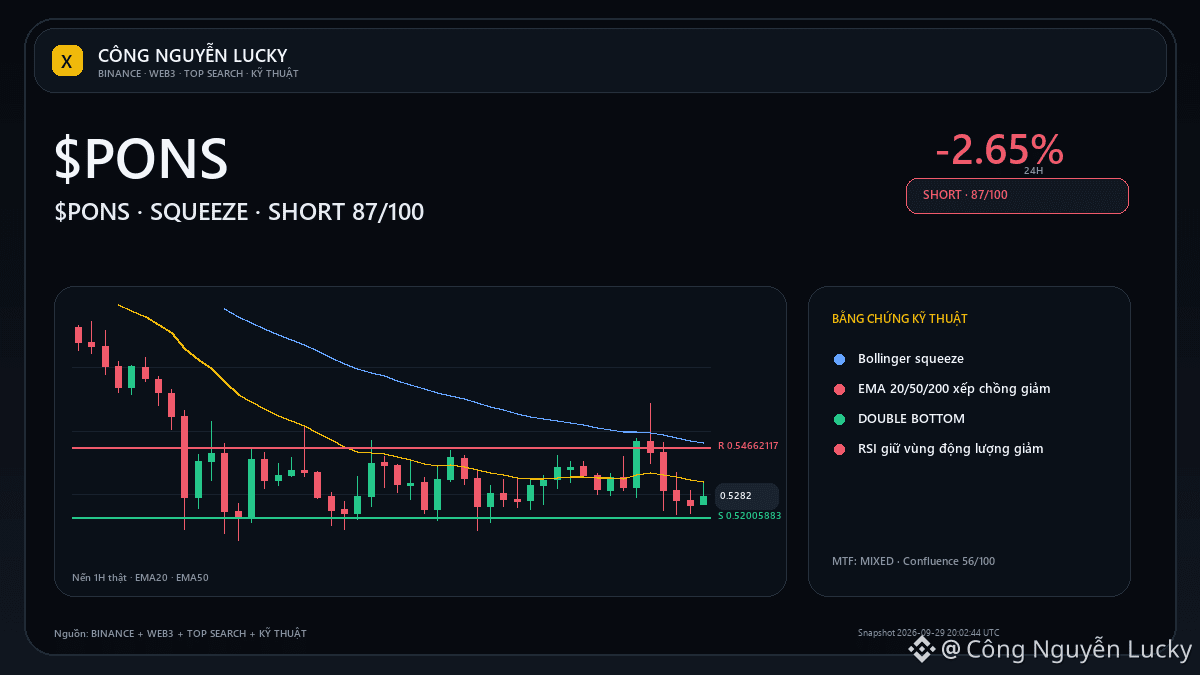
$PONS: Bollinger squeeze is compressing volatility$PONS is hovering around 0.5185. If you only look at the current price, you still miss the most important part: what confirms or invalidates the thesis? Market: 0.5185 · 24h -2.65% · volume ~65.2M USDT · 531,805 trades.
Bandwidth 4.98% · ATR14 2.60% price · structure: EXPANDING_RANGE. A breakout is more credible if price breaks above 0.54662117 or loses 0.52005883 with volume/expanded ATR.
If price pushes the band and quickly returns to the Bollinger mid, prioritize false-break/range rotation. The technical layers selected depend on the regime:
$PONS: Bollinger squeeze is compressing volatility
$PONS is hovering around 0.5185. If you only look at the current price, you still miss the most important part: what confirms or invalidates the thesis? Market: 0.5185 · 24h -2.65% · volume ~65.2M USDT · 531,805 trades.
Bandwidth 4.98% · ATR14 2.60% price · structure: EXPANDING_RANGE. A breakout is more credible if price breaks above 0.54662117 or loses 0.52005883 with volume/expanded ATR.
If price pushes the band and quickly returns to the Bollinger mid, prioritize false-break/range rotation. The technical layers selected depend on the regime:
Bandwidth 4.98% · ATR14 2.60% price · structure: EXPANDING_RANGE. A breakout is more credible if price breaks above 0.54662117 or loses 0.52005883 with volume/expanded ATR.
If price pushes the band and quickly returns to the Bollinger mid, prioritize false-break/range rotation. The technical layers selected depend on the regime:
5

·
--
$INIT This drop is a bit too decisive.
On the 15m chart, it directly smashed down 3.35%, with volume hitting 1.65x of the normal level, Z value at 2.04—this isn’t that slow, drifting kind of decline; it’s volume pushing price down. The close has already broken below the lower edge of the last ~20 5m K lines. Active trade imbalance is -15.2%, buy/sell ratio 0.74, and sell pressure is in control.
But what really caught my attention is the OI.
On the 15m contract: -1.35%, nominal -282K; on the 1h: -0.83%, nominal -252K. Price is falling while OI is also declining. This doesn’t look like shorts are opening new positions to press it down—it looks more like longs deleveraging, taking stops, or passively shrinking their positions. In other words, this selloff is clearing out some longs, not someone actively adding to short exposure.
The OI percentile is abnormal at 98.4%, the whole pool anomaly is #2, nominal change is #26, and it’s been continuing across multiple consecutive periods. Funding rate is also still in a high percentile recently—this combination is pretty interesting. A higher fee implies longs were crowded beforehand; once price breaks down, deleveraging is quite natural.
24h turnover is 26.58M, and depth is sufficient—so this isn’t a liquidity incident; it’s a genuine position adjustment.
My personal take: with this kind of structure, don’t rush to pick the bottom. Longs deleveraging often isn’t a one-off. Wait for OI to stabilize and for the active trade imbalance to return toward neutral before acting. After breaking the lower boundary of the range, first see whether it can quickly reclaim. If it can’t, then it becomes the start of a new round of pricing.
$INIT
$INIT This drop is a bit too decisive.
On the 15m chart, it directly smashed down 3.35%, with volume hitting 1.65x of the normal level, Z value at 2.04—this isn’t that slow, drifting kind of decline; it’s volume pushing price down. The close has already broken below the lower edge of the last ~20 5m K lines. Active trade imbalance is -15.2%, buy/sell ratio 0.74, and sell pressure is in control.
But what really caught my attention is the OI.
On the 15m contract: -1.35%, nominal -282K; on the 1h: -0.83%, nominal -252K. Price is falling while OI is also declining. This doesn’t look like shorts are opening new positions to press it down—it looks more like longs deleveraging, taking stops, or passively shrinking their positions. In other words, this selloff is clearing out some longs, not someone actively adding to short exposure.
The OI percentile is abnormal at 98.4%, the whole pool anomaly is #2, nominal change is #26, and it’s been continuing across multiple consecutive periods. Funding rate is also still in a high percentile recently—this combination is pretty interesting. A higher fee implies longs were crowded beforehand; once price breaks down, deleveraging is quite natural.
24h turnover is 26.58M, and depth is sufficient—so this isn’t a liquidity incident; it’s a genuine position adjustment.
My personal take: with this kind of structure, don’t rush to pick the bottom. Longs deleveraging often isn’t a one-off. Wait for OI to stabilize and for the active trade imbalance to return toward neutral before acting. After breaking the lower boundary of the range, first see whether it can quickly reclaim. If it can’t, then it becomes the start of a new round of pricing.
$INIT
On the 15m chart, it directly smashed down 3.35%, with volume hitting 1.65x of the normal level, Z value at 2.04—this isn’t that slow, drifting kind of decline; it’s volume pushing price down. The close has already broken below the lower edge of the last ~20 5m K lines. Active trade imbalance is -15.2%, buy/sell ratio 0.74, and sell pressure is in control.
But what really caught my attention is the OI.
On the 15m contract: -1.35%, nominal -282K; on the 1h: -0.83%, nominal -252K. Price is falling while OI is also declining. This doesn’t look like shorts are opening new positions to press it down—it looks more like longs deleveraging, taking stops, or passively shrinking their positions. In other words, this selloff is clearing out some longs, not someone actively adding to short exposure.
The OI percentile is abnormal at 98.4%, the whole pool anomaly is #2, nominal change is #26, and it’s been continuing across multiple consecutive periods. Funding rate is also still in a high percentile recently—this combination is pretty interesting. A higher fee implies longs were crowded beforehand; once price breaks down, deleveraging is quite natural.
24h turnover is 26.58M, and depth is sufficient—so this isn’t a liquidity incident; it’s a genuine position adjustment.
My personal take: with this kind of structure, don’t rush to pick the bottom. Longs deleveraging often isn’t a one-off. Wait for OI to stabilize and for the active trade imbalance to return toward neutral before acting. After breaking the lower boundary of the range, first see whether it can quickly reclaim. If it can’t, then it becomes the start of a new round of pricing.
$INIT
11
·
--
$Q This move on the 15m: up 2.47%. Volume directly went to 5x, and OI is rising along with it. In the last 1h, it’s already +3.7%, with nominal change ranking the whole pool down to #26.
From the order book, it looks more like fresh leveraged long positions are coming in. The aggressive buy/sell ratio is 1.39, and the trade imbalance is +16.3%—this doesn’t look like it’s just spot being pushed. The percentile anomaly is 80.8%, not yet at an extreme, but combined with this volume and the growth in open interest, short-term sentiment has already turned hot.
Over the past 24h, turnover is a bit over 160M. Liquidity depth is sufficient, and lots of people are chasing. With this kind of structure, either it keeps accelerating, or when longs crowd in too much, it’s easy for them to get a quick spike-wick “shakeout” to flush positions. Decide based on your position size—whether to follow or wait for a pullback.
$Q This move on the 15m: up 2.47%. Volume directly went to 5x, and OI is rising along with it. In the last 1h, it’s already +3.7%, with nominal change ranking the whole pool down to #26.
From the order book, it looks more like fresh leveraged long positions are coming in. The aggressive buy/sell ratio is 1.39, and the trade imbalance is +16.3%—this doesn’t look like it’s just spot being pushed. The percentile anomaly is 80.8%, not yet at an extreme, but combined with this volume and the growth in open interest, short-term sentiment has already turned hot.
Over the past 24h, turnover is a bit over 160M. Liquidity depth is sufficient, and lots of people are chasing. With this kind of structure, either it keeps accelerating, or when longs crowd in too much, it’s easy for them to get a quick spike-wick “shakeout” to flush positions. Decide based on your position size—whether to follow or wait for a pullback.
From the order book, it looks more like fresh leveraged long positions are coming in. The aggressive buy/sell ratio is 1.39, and the trade imbalance is +16.3%—this doesn’t look like it’s just spot being pushed. The percentile anomaly is 80.8%, not yet at an extreme, but combined with this volume and the growth in open interest, short-term sentiment has already turned hot.
Over the past 24h, turnover is a bit over 160M. Liquidity depth is sufficient, and lots of people are chasing. With this kind of structure, either it keeps accelerating, or when longs crowd in too much, it’s easy for them to get a quick spike-wick “shakeout” to flush positions. Decide based on your position size—whether to follow or wait for a pullback.
11

·
--
The strangest thing about $HBAR is not the +22.87%, but the $723M in trading volume colliding with a $5.10B market cap.
Over the past month, its daily trading volume was mostly between $50M and $110M. From September 21 to 23, it jumped above $200M for three days, pushing the price from $0.081 to $0.099. Then volume fell back to $80M, and the price also hovered around $0.09. Today it suddenly put up $723M, seven to eight times the previous average, and its market cap climbed to #26.
There are two ways to read it. One is a catch-up move plus narrative rotation: +55.85% in 30 days, still -44.28% over 1 year, and -79.52% from ATH. In the market, it was the one that got left behind, and when liquidity rotates in, it has strong elasticity. The confirmation signal would be a pullback that does not break the previous high zone of $0.095-$0.10, with volume holding above $300M.
The other is a one-day impulse of a pump-and-dump: a low of $0.093, a high of $0.1179, and an intraday range of 26%. Such huge volume looks more like turnover than new capital flowing in. The confirmation signal would be volume quickly shrinking below $150M over the next two days, and the price falling back below $0.10.
I lean toward the former, but I wouldn’t chase it now. What I really want to confirm is not the price, but how much of this $723M is sustained buy orders and how much is the same batch of chips being passed around. Which explanation do you trust more — if it can still hold above $0.10 on lower volume tomorrow, which side would you choose?
The strangest thing about $HBAR is not the +22.87%, but the $723M in trading volume colliding with a $5.10B market cap.
Over the past month, its daily trading volume was mostly between $50M and $110M. From September 21 to 23, it jumped above $200M for three days, pushing the price from $0.081 to $0.099. Then volume fell back to $80M, and the price also hovered around $0.09. Today it suddenly put up $723M, seven to eight times the previous average, and its market cap climbed to #26.
There are two ways to read it. One is a catch-up move plus narrative rotation: +55.85% in 30 days, still -44.28% over 1 year, and -79.52% from ATH. In the market, it was the one that got left behind, and when liquidity rotates in, it has strong elasticity. The confirmation signal would be a pullback that does not break the previous high zone of $0.095-$0.10, with volume holding above $300M.
The other is a one-day impulse of a pump-and-dump: a low of $0.093, a high of $0.1179, and an intraday range of 26%. Such huge volume looks more like turnover than new capital flowing in. The confirmation signal would be volume quickly shrinking below $150M over the next two days, and the price falling back below $0.10.
I lean toward the former, but I wouldn’t chase it now. What I really want to confirm is not the price, but how much of this $723M is sustained buy orders and how much is the same batch of chips being passed around. Which explanation do you trust more — if it can still hold above $0.10 on lower volume tomorrow, which side would you choose?
Over the past month, its daily trading volume was mostly between $50M and $110M. From September 21 to 23, it jumped above $200M for three days, pushing the price from $0.081 to $0.099. Then volume fell back to $80M, and the price also hovered around $0.09. Today it suddenly put up $723M, seven to eight times the previous average, and its market cap climbed to #26.
There are two ways to read it. One is a catch-up move plus narrative rotation: +55.85% in 30 days, still -44.28% over 1 year, and -79.52% from ATH. In the market, it was the one that got left behind, and when liquidity rotates in, it has strong elasticity. The confirmation signal would be a pullback that does not break the previous high zone of $0.095-$0.10, with volume holding above $300M.
The other is a one-day impulse of a pump-and-dump: a low of $0.093, a high of $0.1179, and an intraday range of 26%. Such huge volume looks more like turnover than new capital flowing in. The confirmation signal would be volume quickly shrinking below $150M over the next two days, and the price falling back below $0.10.
I lean toward the former, but I wouldn’t chase it now. What I really want to confirm is not the price, but how much of this $723M is sustained buy orders and how much is the same batch of chips being passed around. Which explanation do you trust more — if it can still hold above $0.10 on lower volume tomorrow, which side would you choose?
56
·
--
$SUI Now at this position, saying it is still in a bear market is no longer accurate. After crawling up from around 0.71 at the end of August, it surged 66% over 30 days, added another 29% over the next 7 days, and today is up 6% to reclaim 1.23. Trading volume has expanded from over $200 million to $1.4 billion. This is not the kind of scale that retail investors doing sporadic bottom-fishing could produce. Its market cap ranks at #26, a little over $5B, which suggests that capital is lifting it out of the "previous-cycle L1 narrative" and re-pricing it.
What’s truly worth watching isn’t the magnitude of the move, but the two long bullish candles with heavy volume on September 22 and September 26—single-day turnover breaking $2.0B and $1.8B. Turnover surged dramatically, yet it didn’t immediately collapse. Instead, it rebuilt a base between 1.0 and 1.26. This kind of structure usually means there is capital absorbing the earlier trapped positions, not just a pure emotional impulse.
However, it is still -77% away from the ATH, and on a one-year basis it remains -61%. These two sets of numbers, placed alongside the short-term strength, are what make the situation feel most awkward right now: it could be the early stage of a trend reversal, or it could simply be a sharp rebound deep within a bear market. What I care about most is the intraday low at 1.16—if a pullback does not break it, and volume stays above $1B, then this round still has room to test upward toward 1.3. If it retracts on shrinking volume back below 1.0, that would indicate the buyers are only short-term momentum funds.
The contradiction hanging in the air now is this: Sui’s fundamentals have not simultaneously produced a fresh narrative capable of matching a 66% surge. So what, exactly, is this repricing trading ahead of time?
$SUI Now at this position, saying it is still in a bear market is no longer accurate. After crawling up from around 0.71 at the end of August, it surged 66% over 30 days, added another 29% over the next 7 days, and today is up 6% to reclaim 1.23. Trading volume has expanded from over $200 million to $1.4 billion. This is not the kind of scale that retail investors doing sporadic bottom-fishing could produce. Its market cap ranks at #26, a little over $5B, which suggests that capital is lifting it out of the "previous-cycle L1 narrative" and re-pricing it.
What’s truly worth watching isn’t the magnitude of the move, but the two long bullish candles with heavy volume on September 22 and September 26—single-day turnover breaking $2.0B and $1.8B. Turnover surged dramatically, yet it didn’t immediately collapse. Instead, it rebuilt a base between 1.0 and 1.26. This kind of structure usually means there is capital absorbing the earlier trapped positions, not just a pure emotional impulse.
However, it is still -77% away from the ATH, and on a one-year basis it remains -61%. These two sets of numbers, placed alongside the short-term strength, are what make the situation feel most awkward right now: it could be the early stage of a trend reversal, or it could simply be a sharp rebound deep within a bear market. What I care about most is the intraday low at 1.16—if a pullback does not break it, and volume stays above $1B, then this round still has room to test upward toward 1.3. If it retracts on shrinking volume back below 1.0, that would indicate the buyers are only short-term momentum funds.
The contradiction hanging in the air now is this: Sui’s fundamentals have not simultaneously produced a fresh narrative capable of matching a 66% surge. So what, exactly, is this repricing trading ahead of time?
What’s truly worth watching isn’t the magnitude of the move, but the two long bullish candles with heavy volume on September 22 and September 26—single-day turnover breaking $2.0B and $1.8B. Turnover surged dramatically, yet it didn’t immediately collapse. Instead, it rebuilt a base between 1.0 and 1.26. This kind of structure usually means there is capital absorbing the earlier trapped positions, not just a pure emotional impulse.
However, it is still -77% away from the ATH, and on a one-year basis it remains -61%. These two sets of numbers, placed alongside the short-term strength, are what make the situation feel most awkward right now: it could be the early stage of a trend reversal, or it could simply be a sharp rebound deep within a bear market. What I care about most is the intraday low at 1.16—if a pullback does not break it, and volume stays above $1B, then this round still has room to test upward toward 1.3. If it retracts on shrinking volume back below 1.0, that would indicate the buyers are only short-term momentum funds.
The contradiction hanging in the air now is this: Sui’s fundamentals have not simultaneously produced a fresh narrative capable of matching a 66% surge. So what, exactly, is this repricing trading ahead of time?
62
·
--
Crypto Market UpdateSui (SUIUSDT) is trending right now!
Rank: #26
BIG PUMP: 🔥 6.7% daily gain! 💸 NEAR Protocol is on fire, surging **6.7%** in just 24 hours to **.199**! 🚀 I'm thinking this could be a sign of a growing interest in altcoins. With its strong performance, NEAR is definitely one to watch. What's driving this sudden surge? Is it a buy signal for you? 🤔
#bitcoin #ethereum #crypto
Crypto Market Update
Sui (SUIUSDT) is trending right now!
Rank: #26
BIG PUMP: 🔥 6.7% daily gain! 💸 NEAR Protocol is on fire, surging **6.7%** in just 24 hours to **.199**! 🚀 I'm thinking this could be a sign of a growing interest in altcoins. With its strong performance, NEAR is definitely one to watch. What's driving this sudden surge? Is it a buy signal for you? 🤔
#bitcoin #ethereum #crypto
Rank: #26
BIG PUMP: 🔥 6.7% daily gain! 💸 NEAR Protocol is on fire, surging **6.7%** in just 24 hours to **.199**! 🚀 I'm thinking this could be a sign of a growing interest in altcoins. With its strong performance, NEAR is definitely one to watch. What's driving this sudden surge? Is it a buy signal for you? 🤔
#bitcoin #ethereum #crypto
37
·
--
$LSK This 15m move is pretty vicious.
The volume can go directly to 2.75x, the Z value is 3.77, and the price has broken below the lower edge of the past 20 5m candles. The aggressive trade imbalance is -36.2%, and the buy-sell ratio is 0.47—clearly someone is smashing downward, and they’re doing it quite decisively.
But what’s interesting is the OI: 15m -0.53%, 1h -0.46%. The nominal changes are all on the order of hundreds of thousands of U. Price is down, open interest is shrinking—this isn’t fresh shorts entering. It looks more like longs are cutting losses or unwinding leverage. In other words, this drop is more like “our own side running,” not a shorts-driven offensive.
The OI abnormal percentile is 97.4%, the abnormal bucket in the whole pool is #4, and the nominal change is #26—what does this combination imply? It suggests LSK’s position shift intensity in this time window is already near its own historical extreme range, and it also ranks highly in comparison to the whole pool horizontally. 24h trading volume is 58.68M; the volume isn’t small. The order book depth confirms that the trades are higher than normal.
My take: At this level, if longs continue deleveraging, there’s tail-risk of a wave of forced liquidations. But if OI shrinks to a certain point and stabilizes, it’s easier for a corrective move in the opposite direction to appear. The key is whether the 15m aggressive trade imbalance can narrow next—don’t keep it pinned at a one-sided pressure of -30% or more.
Watch it first. No need to act immediately.
$LSK This 15m move is pretty vicious.
The volume can go directly to 2.75x, the Z value is 3.77, and the price has broken below the lower edge of the past 20 5m candles. The aggressive trade imbalance is -36.2%, and the buy-sell ratio is 0.47—clearly someone is smashing downward, and they’re doing it quite decisively.
But what’s interesting is the OI: 15m -0.53%, 1h -0.46%. The nominal changes are all on the order of hundreds of thousands of U. Price is down, open interest is shrinking—this isn’t fresh shorts entering. It looks more like longs are cutting losses or unwinding leverage. In other words, this drop is more like “our own side running,” not a shorts-driven offensive.
The OI abnormal percentile is 97.4%, the abnormal bucket in the whole pool is #4, and the nominal change is #26—what does this combination imply? It suggests LSK’s position shift intensity in this time window is already near its own historical extreme range, and it also ranks highly in comparison to the whole pool horizontally. 24h trading volume is 58.68M; the volume isn’t small. The order book depth confirms that the trades are higher than normal.
My take: At this level, if longs continue deleveraging, there’s tail-risk of a wave of forced liquidations. But if OI shrinks to a certain point and stabilizes, it’s easier for a corrective move in the opposite direction to appear. The key is whether the 15m aggressive trade imbalance can narrow next—don’t keep it pinned at a one-sided pressure of -30% or more.
Watch it first. No need to act immediately.
The volume can go directly to 2.75x, the Z value is 3.77, and the price has broken below the lower edge of the past 20 5m candles. The aggressive trade imbalance is -36.2%, and the buy-sell ratio is 0.47—clearly someone is smashing downward, and they’re doing it quite decisively.
But what’s interesting is the OI: 15m -0.53%, 1h -0.46%. The nominal changes are all on the order of hundreds of thousands of U. Price is down, open interest is shrinking—this isn’t fresh shorts entering. It looks more like longs are cutting losses or unwinding leverage. In other words, this drop is more like “our own side running,” not a shorts-driven offensive.
The OI abnormal percentile is 97.4%, the abnormal bucket in the whole pool is #4, and the nominal change is #26—what does this combination imply? It suggests LSK’s position shift intensity in this time window is already near its own historical extreme range, and it also ranks highly in comparison to the whole pool horizontally. 24h trading volume is 58.68M; the volume isn’t small. The order book depth confirms that the trades are higher than normal.
My take: At this level, if longs continue deleveraging, there’s tail-risk of a wave of forced liquidations. But if OI shrinks to a certain point and stabilizes, it’s easier for a corrective move in the opposite direction to appear. The key is whether the 15m aggressive trade imbalance can narrow next—don’t keep it pinned at a one-sided pressure of -30% or more.
Watch it first. No need to act immediately.
8
·
--
TAKE — This 15m drop of 2.29% came with volume only 0.65x. It doesn’t look like panic selling; it looks more like the bulls pulled back on their own first.
OI (15m) is -1.71%, with a notional decrease of 354K. Along with price moving lower, this is a typical de-leveraging script—not a short attack, but leveraged long positions stopping out or voluntarily shrinking. What’s interesting is that OI on the 1h timeframe is still +2.80%, which suggests this washout may be targeting short-term chasers who bought high; the mid-term positions haven’t really moved much.
Funding rates are still in the high percentile range recently. At this level, the bulls’ cost isn’t low. Passive/active trade imbalance is 0.0% and the buy/sell ratio is 1.00—so longs and shorts are basically stuck here; nobody is really willing to push hard.
24h trading volume is 257M, and the pool has an unusually high percentile of 82.5%. The change in notional across the whole pool ranks #26, and the heat isn’t low.
My take: with this kind of structure, don’t rush to pick the bottom. Wait for OI to stabilize a bit and funding rates to cool down before deciding—otherwise you risk catching the knife in mid-slope. $TAKE
TAKE — This 15m drop of 2.29% came with volume only 0.65x. It doesn’t look like panic selling; it looks more like the bulls pulled back on their own first.
OI (15m) is -1.71%, with a notional decrease of 354K. Along with price moving lower, this is a typical de-leveraging script—not a short attack, but leveraged long positions stopping out or voluntarily shrinking. What’s interesting is that OI on the 1h timeframe is still +2.80%, which suggests this washout may be targeting short-term chasers who bought high; the mid-term positions haven’t really moved much.
Funding rates are still in the high percentile range recently. At this level, the bulls’ cost isn’t low. Passive/active trade imbalance is 0.0% and the buy/sell ratio is 1.00—so longs and shorts are basically stuck here; nobody is really willing to push hard.
24h trading volume is 257M, and the pool has an unusually high percentile of 82.5%. The change in notional across the whole pool ranks #26, and the heat isn’t low.
My take: with this kind of structure, don’t rush to pick the bottom. Wait for OI to stabilize a bit and funding rates to cool down before deciding—otherwise you risk catching the knife in mid-slope. $TAKE
OI (15m) is -1.71%, with a notional decrease of 354K. Along with price moving lower, this is a typical de-leveraging script—not a short attack, but leveraged long positions stopping out or voluntarily shrinking. What’s interesting is that OI on the 1h timeframe is still +2.80%, which suggests this washout may be targeting short-term chasers who bought high; the mid-term positions haven’t really moved much.
Funding rates are still in the high percentile range recently. At this level, the bulls’ cost isn’t low. Passive/active trade imbalance is 0.0% and the buy/sell ratio is 1.00—so longs and shorts are basically stuck here; nobody is really willing to push hard.
24h trading volume is 257M, and the pool has an unusually high percentile of 82.5%. The change in notional across the whole pool ranks #26, and the heat isn’t low.
My take: with this kind of structure, don’t rush to pick the bottom. Wait for OI to stabilize a bit and funding rates to cool down before deciding—otherwise you risk catching the knife in mid-slope. $TAKE
4
Article
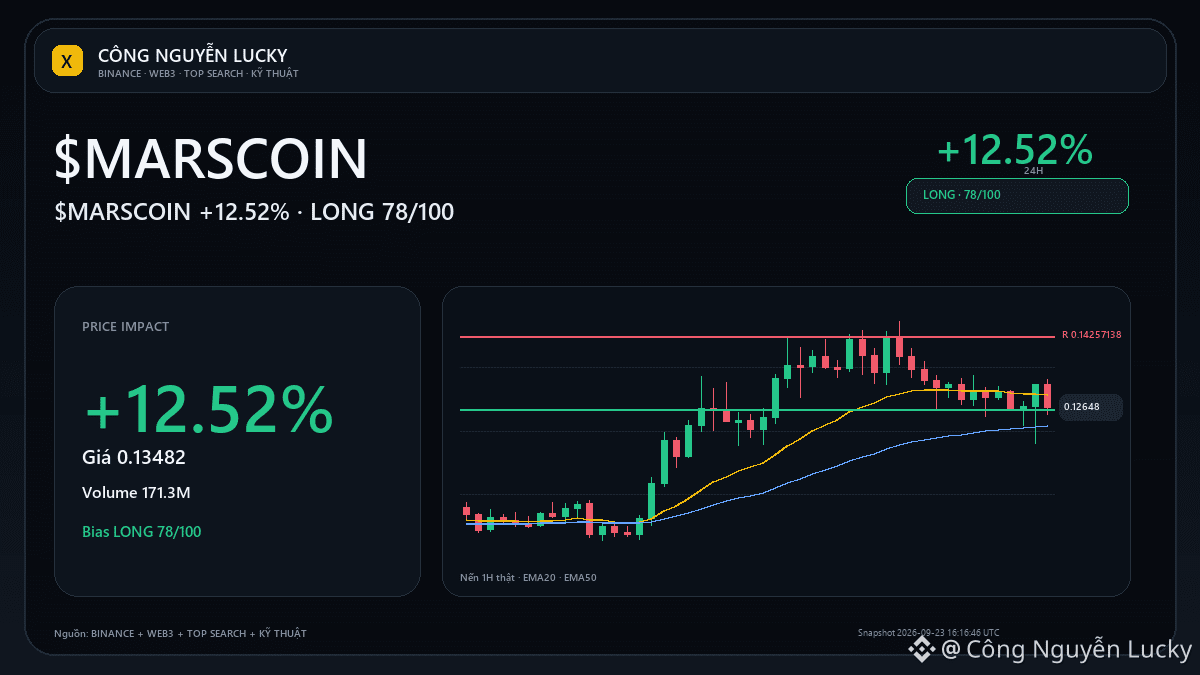
$MARSCOIN +12.52%: what other data confirms this strong run?$MARSCOIN shows notable signals — but which data will actually decide the next move? 1️⃣ +12.52% — 24h volatility.
2️⃣ 171.3M USDT — 24h quote volume.
3️⃣ 59/100 — position on the boundary day. A large number doesn't automatically turn into a setup. The next confirmation needed:
• Exceed 0.14593 with expanded mass, and the continuing scenario will be more trustworthy.
• Failing to hold the high area and dropping back below the midpoint 0.132215 will make the cooling-off scenario more evident. 📌 LONG/SHORT perspective: **LONG · MODERATE · 78/100**.
$MARSCOIN +12.52%: what other data confirms this strong run?
$MARSCOIN shows notable signals — but which data will actually decide the next move? 1️⃣ +12.52% — 24h volatility.
2️⃣ 171.3M USDT — 24h quote volume.
3️⃣ 59/100 — position on the boundary day. A large number doesn't automatically turn into a setup. The next confirmation needed:
• Exceed 0.14593 with expanded mass, and the continuing scenario will be more trustworthy.
• Failing to hold the high area and dropping back below the midpoint 0.132215 will make the cooling-off scenario more evident. 📌 LONG/SHORT perspective: **LONG · MODERATE · 78/100**.
2️⃣ 171.3M USDT — 24h quote volume.
3️⃣ 59/100 — position on the boundary day. A large number doesn't automatically turn into a setup. The next confirmation needed:
• Exceed 0.14593 with expanded mass, and the continuing scenario will be more trustworthy.
• Failing to hold the high area and dropping back below the midpoint 0.132215 will make the cooling-off scenario more evident. 📌 LONG/SHORT perspective: **LONG · MODERATE · 78/100**.
8
Article
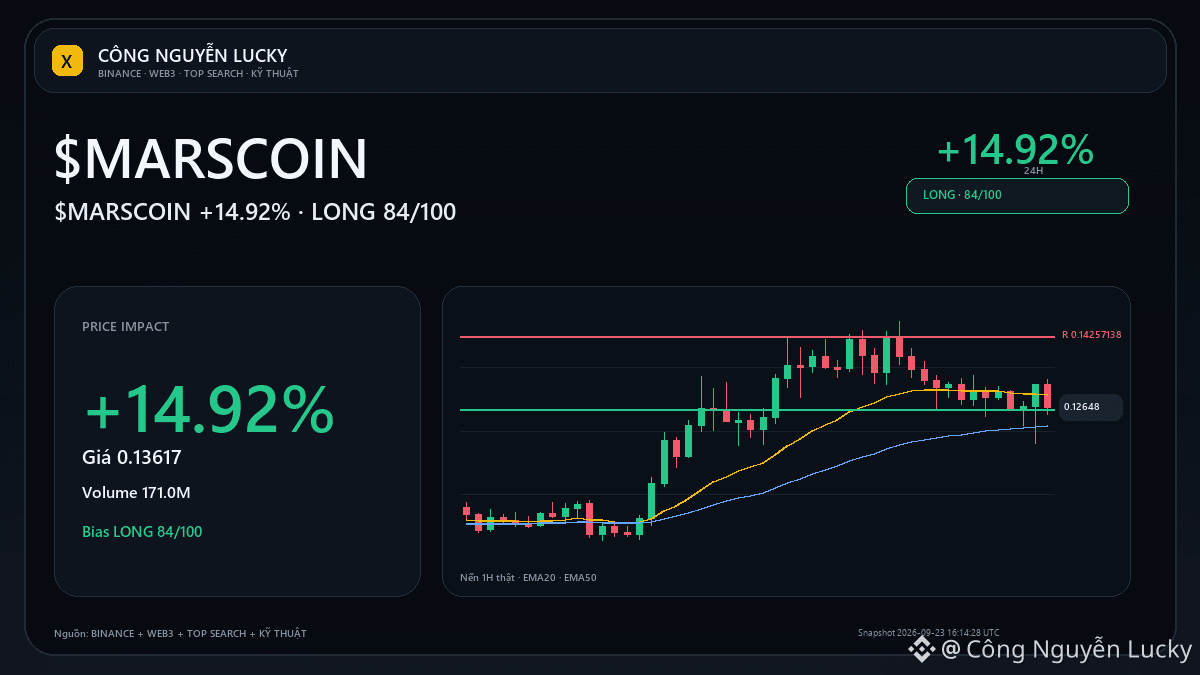
$MARSCOIN: Does RSI divergence have enough to change the bias?$MARSCOIN is showing notable signals — but which data will truly determine the next move? Market: 0.13617 · 24h +14.92% · volume ~171.0M USDT · 2,040,343 trades.
RSI14 47.9 · MIXED state · overall bias NEUTRAL 44/100. What you need to see next: price reaction at 0.14257138 and MACD/volume confirmation together.
If the price continues to break structure following the old trend, divergence will be considered a failure rather than something to hold onto. The technical layers being selected are based on the regime:
$MARSCOIN: Does RSI divergence have enough to change the bias?
$MARSCOIN is showing notable signals — but which data will truly determine the next move? Market: 0.13617 · 24h +14.92% · volume ~171.0M USDT · 2,040,343 trades.
RSI14 47.9 · MIXED state · overall bias NEUTRAL 44/100. What you need to see next: price reaction at 0.14257138 and MACD/volume confirmation together.
If the price continues to break structure following the old trend, divergence will be considered a failure rather than something to hold onto. The technical layers being selected are based on the regime:
RSI14 47.9 · MIXED state · overall bias NEUTRAL 44/100. What you need to see next: price reaction at 0.14257138 and MACD/volume confirmation together.
If the price continues to break structure following the old trend, divergence will be considered a failure rather than something to hold onto. The technical layers being selected are based on the regime:
109
·
--
$AVAX 15m It rose 0.98%, with volume at 1.48x. The candlestick closed above the upper boundary of the range formed by the past ~20 5-minute candles. But what’s really interesting is the OI: over 15m it’s -0.03%, yet the price is still going up. This combination feels more like shorts are being forced to close rather than new longs actively initiating a push.
On the 1h timeframe, OI is still +0.45%, suggesting that positions are indeed being rebuilt gradually over longer horizons—not just a single impulsive wave. Active trades are up +2.8%, with the buy/sell ratio at 1.06: bids are slightly dominant, but not to the point of a one-sided squeeze.
The abnormal status for the whole pool ranks #26, with nominal change #11, and 24h trading volume of 568M. The numbers aren’t exploding, but being able to get listed around that time (a little past 5) indicates there’s clearly capital watching and reacting at the edges of this range.
$AVAX 15m It rose 0.98%, with volume at 1.48x. The candlestick closed above the upper boundary of the range formed by the past ~20 5-minute candles. But what’s really interesting is the OI: over 15m it’s -0.03%, yet the price is still going up. This combination feels more like shorts are being forced to close rather than new longs actively initiating a push.
On the 1h timeframe, OI is still +0.45%, suggesting that positions are indeed being rebuilt gradually over longer horizons—not just a single impulsive wave. Active trades are up +2.8%, with the buy/sell ratio at 1.06: bids are slightly dominant, but not to the point of a one-sided squeeze.
The abnormal status for the whole pool ranks #26, with nominal change #11, and 24h trading volume of 568M. The numbers aren’t exploding, but being able to get listed around that time (a little past 5) indicates there’s clearly capital watching and reacting at the edges of this range.
On the 1h timeframe, OI is still +0.45%, suggesting that positions are indeed being rebuilt gradually over longer horizons—not just a single impulsive wave. Active trades are up +2.8%, with the buy/sell ratio at 1.06: bids are slightly dominant, but not to the point of a one-sided squeeze.
The abnormal status for the whole pool ranks #26, with nominal change #11, and 24h trading volume of 568M. The numbers aren’t exploding, but being able to get listed around that time (a little past 5) indicates there’s clearly capital watching and reacting at the edges of this range.
4
Log in to explore more content
Join global crypto users on Binance Square
⚡️ Get latest and useful information about crypto.
💬 Trusted by the world’s largest crypto exchange.
👍 Discover real insights from verified creators.
Email / Phone number
Trending Topics
1
#FedMinutesFocusOnOctoberPause
31,499 views
622 Discussing
2
#BinanceLaunchesBinanceIntelligence
958,581 views
5,858 Discussing
3
#EvernorthDelaysNasdaqDebutToOct12
432 views
67 Discussing
4
#RobinhoodAdds$25MInBitcoinToBalanceSheet
1,178 views
36 Discussing
5
#SP500AndNasdaqHitRecordHighs
6,684 views
281 Discussing
6
#USMortgageRatesRiseTo7.49%
6,986 views
250 Discussing
7
#BTCFallsBelow$84K
82,012 views
205 Discussing
8
#DubaiVARAIssuesReserveAssetAuditCircular
31,670 views
839 Discussing
9
#SECApproves3XBitcoinETF
30,668 views
679 Discussing
10
#WinklevossFilesSpotZcashETFApplication
39,106 views
794 Discussing