

#1000000mog
1000000mog
61,362 views
288 Discussing
Hot
Latest

$1000000MOG LONG
The trade setup is based on a precise mathematical relationship between risk and potential return, with each target set at a carefully calculated distance.
The success of the planned scenario depends entirely on the strength of support: as long as prices do not fall below the critical level, the upward trajectory remains the priority. Any unexpected deeper drop on the chart will require reassessing the planned targets.
➡️Entry: 0.1099
✅Take Profit 1: 0.11192419 (+1.84%)
✅Take Profit 2: 0.11404838 (+3.77%)
✅Take Profit 3: 0.11723467 (+6.67%)
⛔️Stop Loss: 0.10661371 (-2.99%)
⚠️ This is not financial advice. Trade at your own risk. DYOR.
#1000000MOG #HEI #AKEUSDT 📈
$1000000MOG
2

·
--
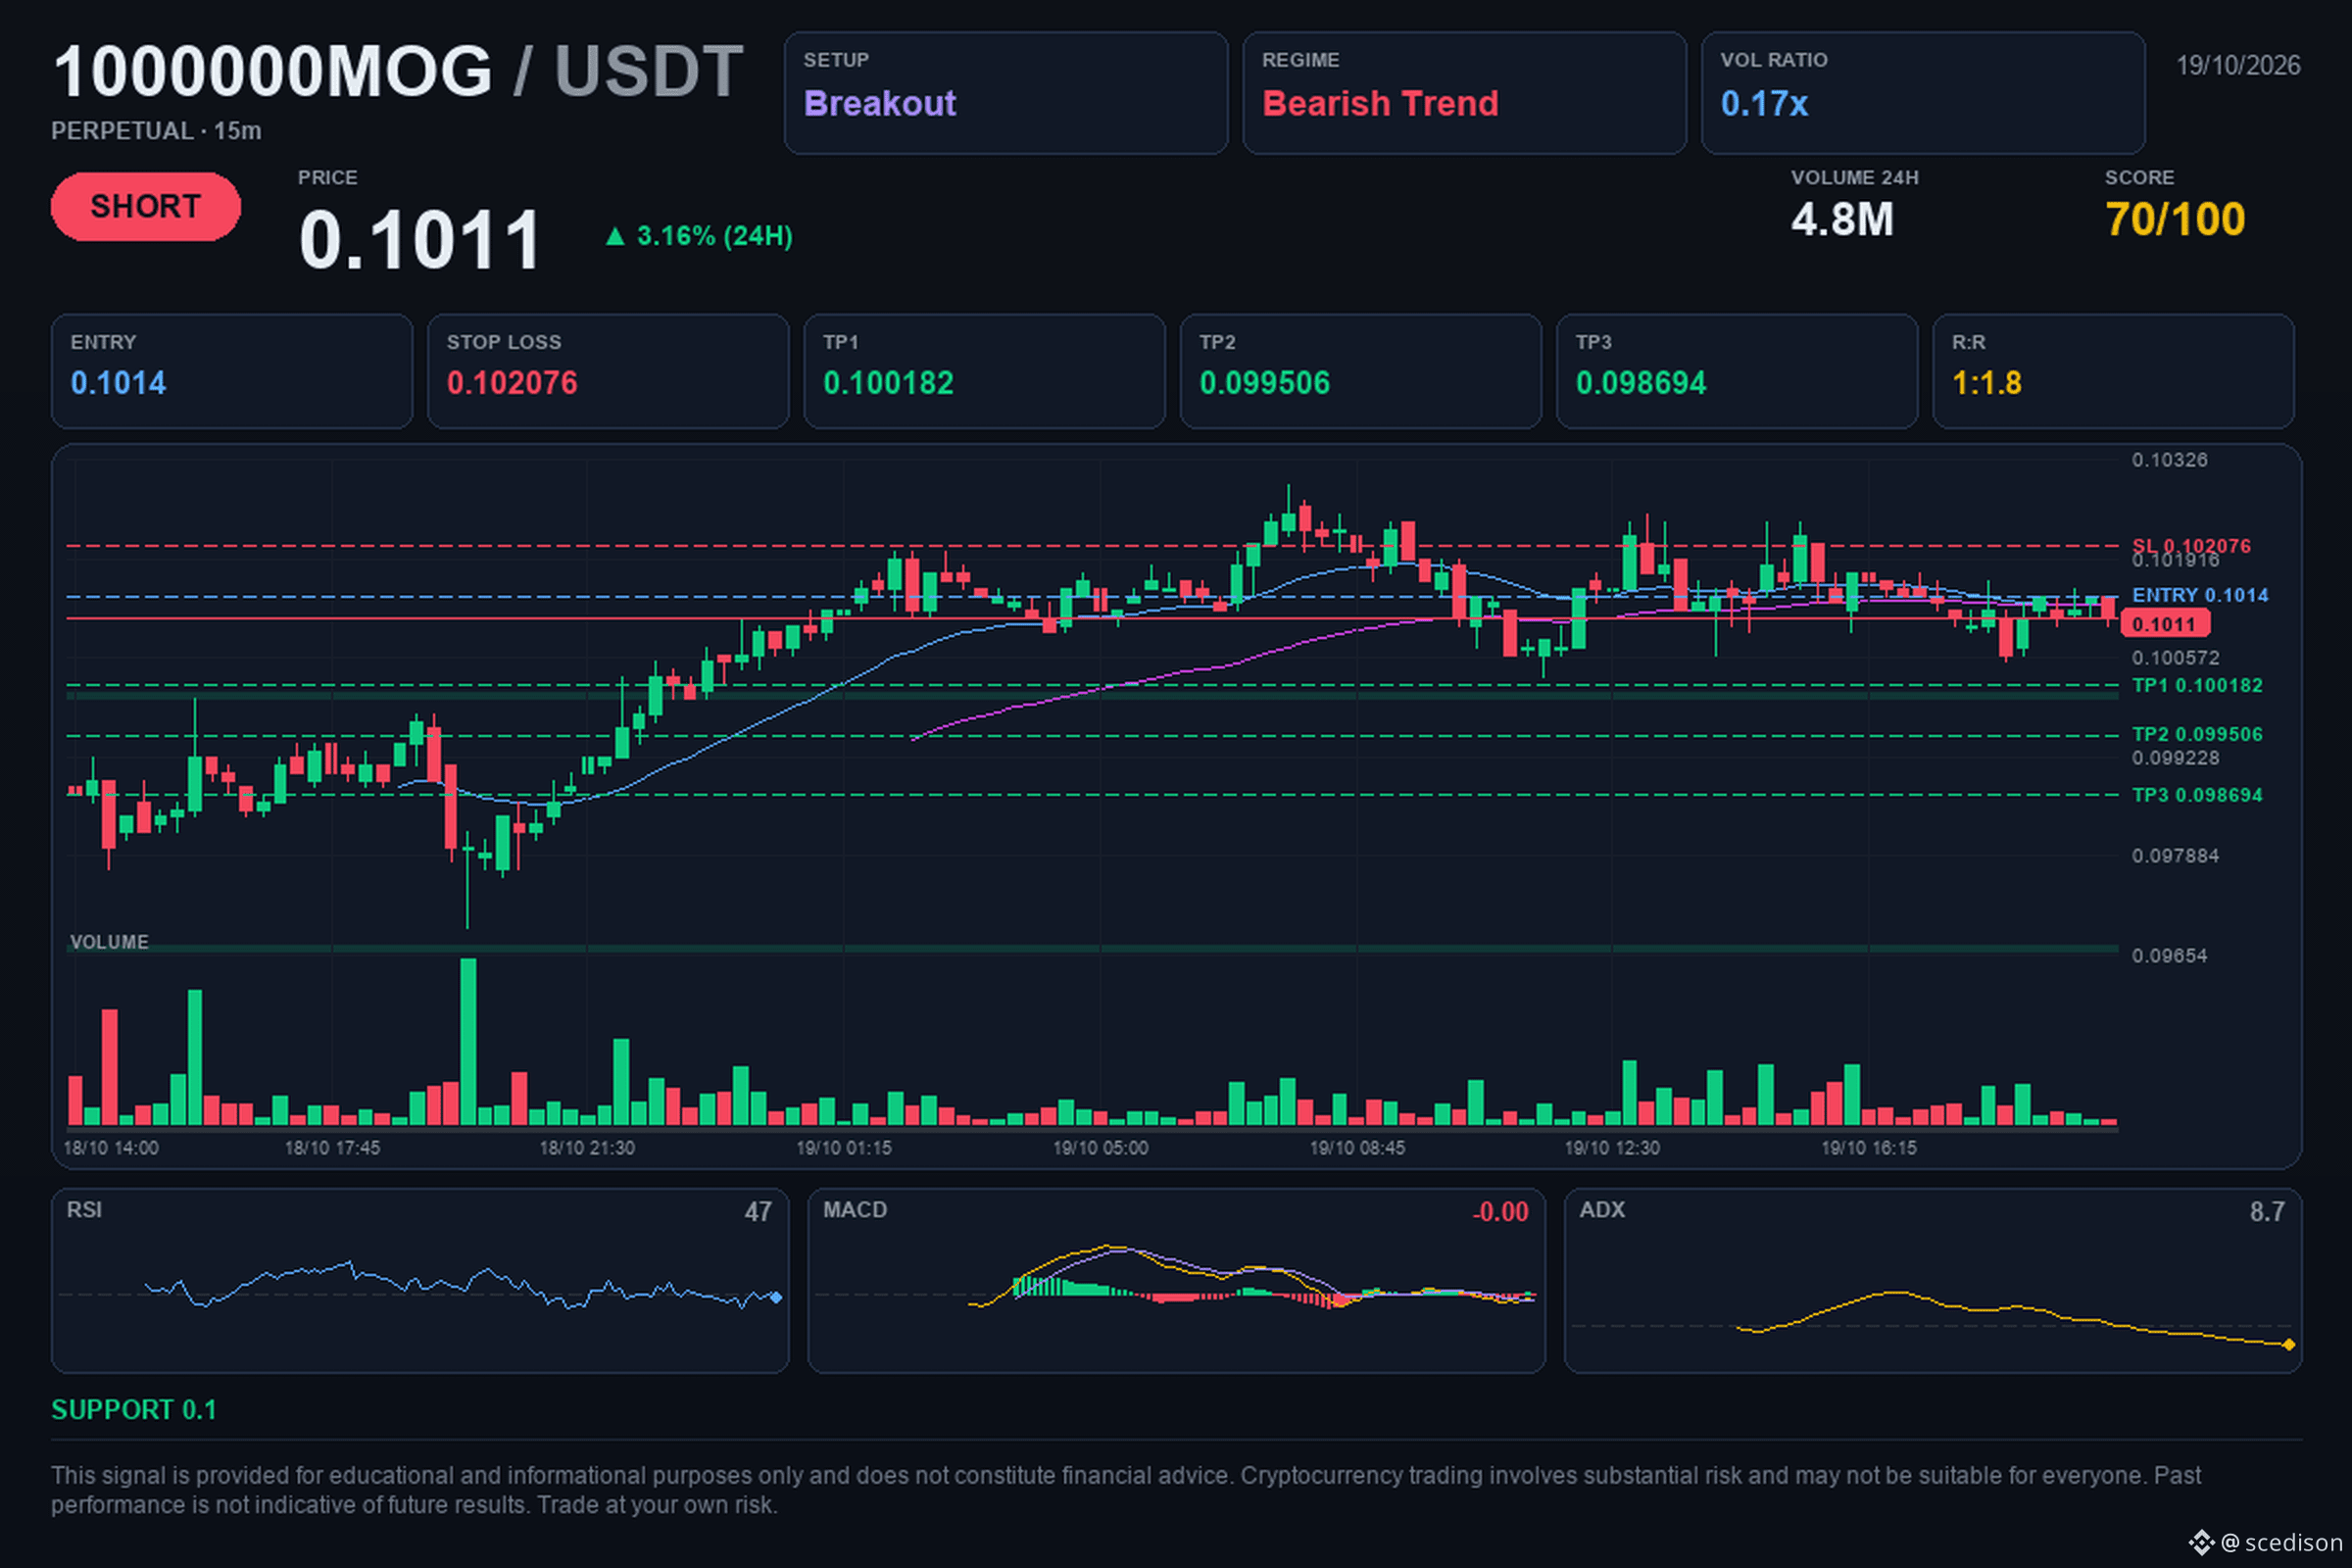
📢 $1000000MOG / USDT | 🔴 SHORT | ⭐ 71%
🎯 Target: $0.1001825. Will it reach it?
🎯 Trade levels:
🔴 Entry: $0.1014
🛑 Stop Loss: $0.102076
🏁 TP1: $0.100182
🏁 TP2: $0.099506
🏁 TP3: $0.098694
📈 Analysis:
The asset shows a clear bearish structure on the 4-hour timeframe, marked by lower highs and lower lows. A bearish breakout is visible around the 0.1 resistance zone, accompanied by a 23.5% increase in trading volume. This move suggests active selling pressure seeking to continue the prevailing market trend.
⚖️ Risk/Reward: 1:1.8
⏱️ Timeframe: 15M
💭 A bearish breakout occurs when the price moves through a previously established support or resistance level, often indicating a change in or continuation of the market's direction.
#crypto #1000000MOG #trading #Bearish
💡 This analysis is for educational purposes and does not constitute financial advice. Do your own research and make your decisions calmly.
11
·
--
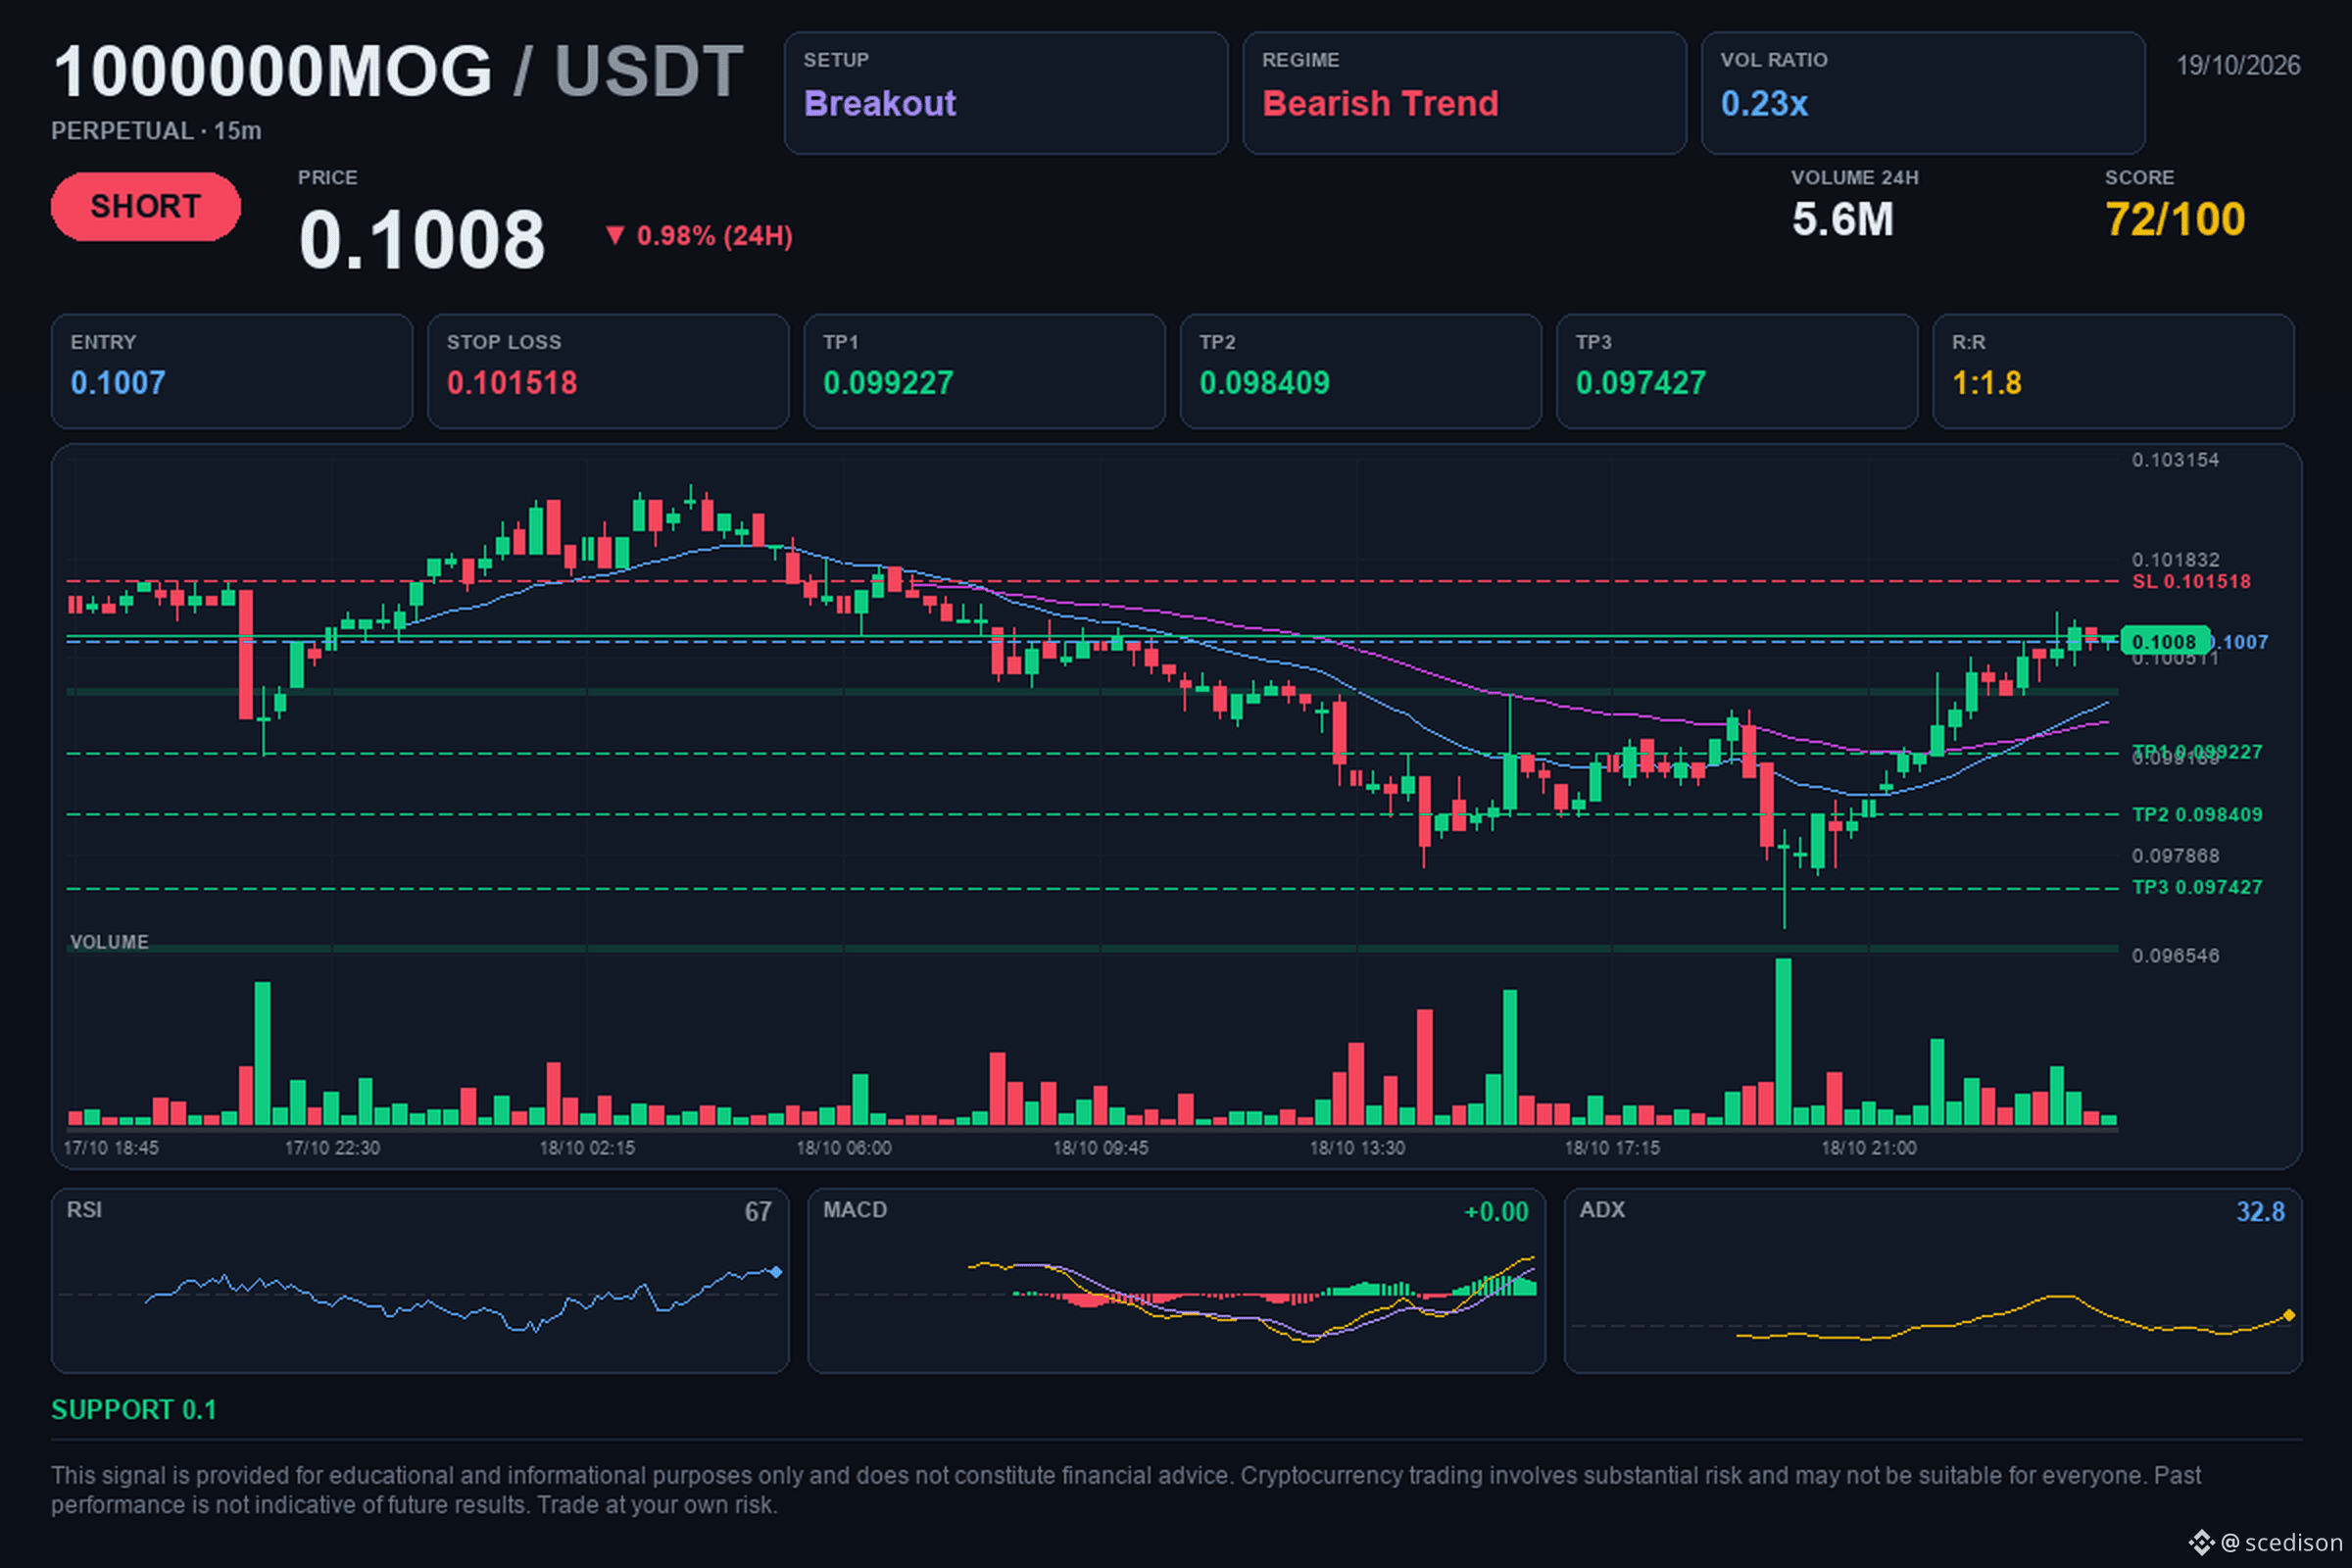
📢 $1000000MOG / USDT | 🔴 SHORT | ⭐ 73%
🎯 Target: $0.09922717. Will it reach it?
🎯 Trade levels:
🔴 Entry: $0.1007
🛑 Stop Loss: $0.101518
🏁 TP1: $0.099227
🏁 TP2: $0.098409
🏁 TP3: $0.097427
📈 Analysis:
The market shows a clear bearish structure, with lower highs on the 4-hour timeframes. A bearish break below the resistance at 0.1 is visible, accompanied by a 31.3% increase in volume, suggesting greater selling pressure. Volatility is in an expansion phase, indicating a strong move that sellers are capitalizing on to try to continue the current trend.
⚖️ Risk/Reward: 1:1.8
⏱️ Timeframe: 15M
💭 A bearish breakout occurs when the price crosses a previously established support or resistance level, which often signals a stronger trend reversal or continuation.
#crypto #1000000MOG #trading #Bearish
💡 This analysis is for educational purposes and does not constitute financial advice. Do your own research and make your decision carefully.
37
·
--
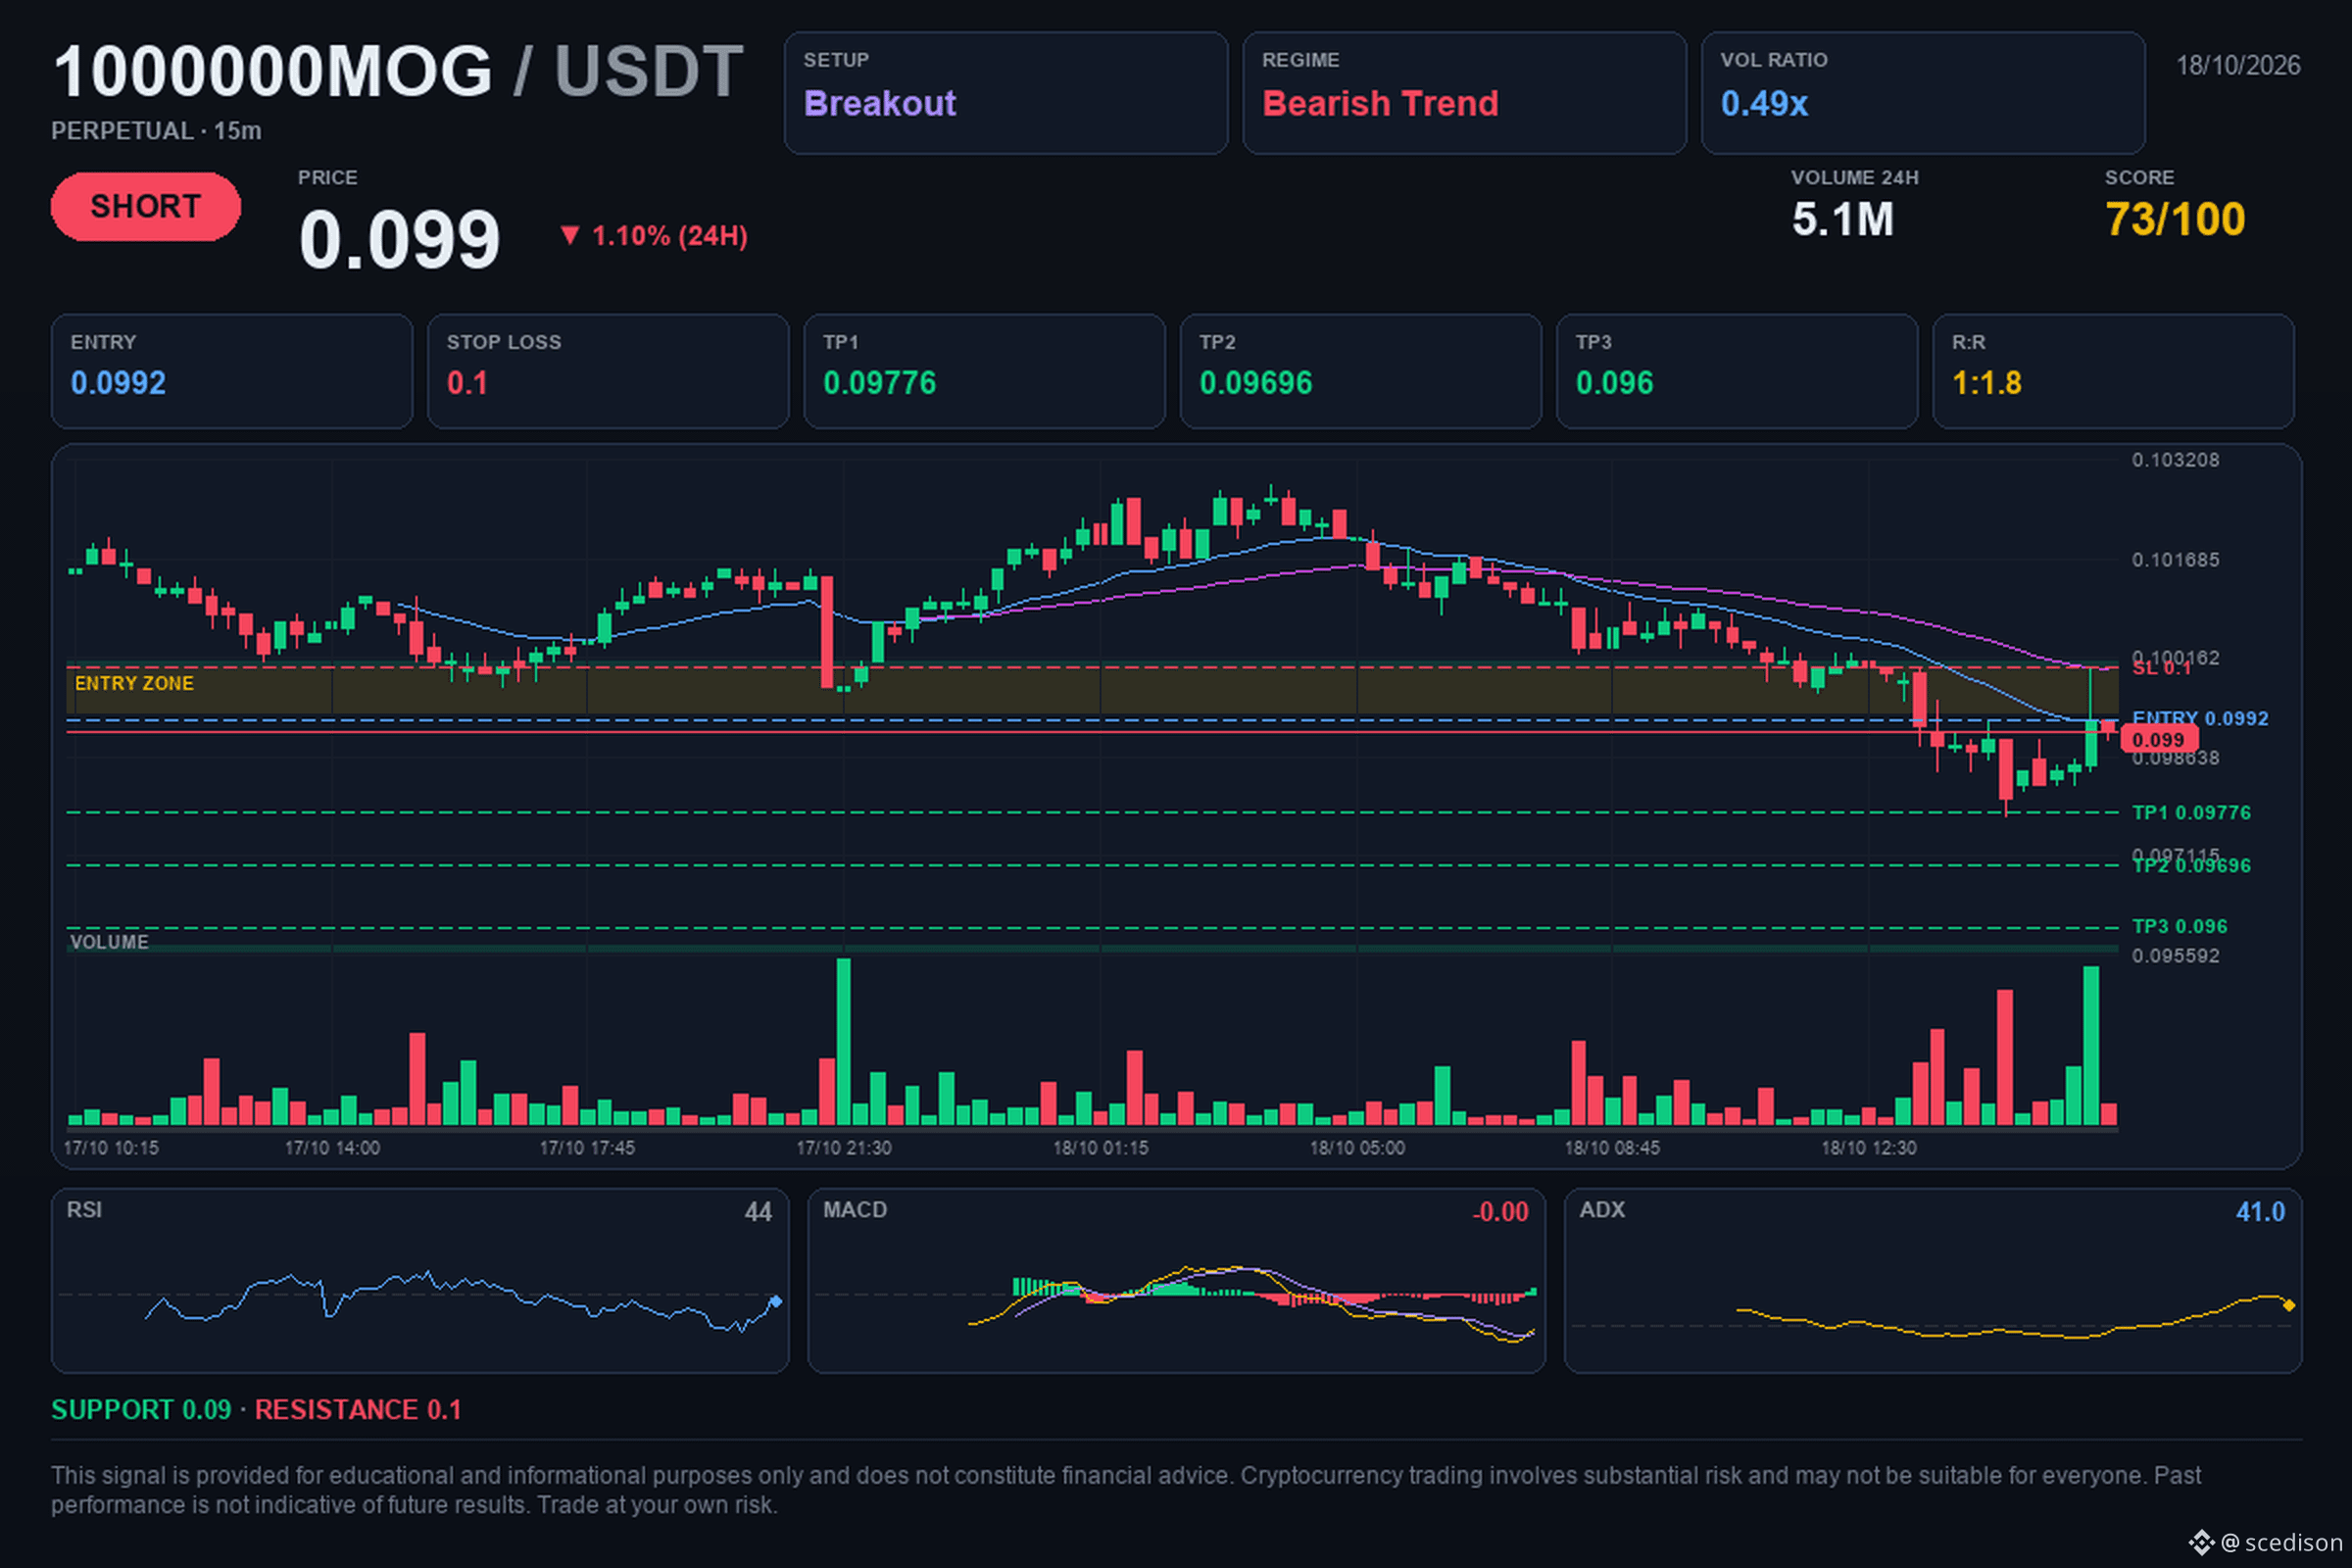
📢 $1000000MOG / USDT | 🔴 SHORT | ⭐ 73%
🎯 Target: $0.09776. Will it get there?
🎯 Trading levels:
🔴 Entry: $0.0992
🛑 Stop Loss: $0.1
🏁 TP1: $0.09776
🏁 TP2: $0.09696
🏁 TP3: $0.096
📈 Analysis:
The structure shows a clear downtrend, with lower highs and support breaks across multiple timeframes. Volume has increased significantly, exceeding the average, suggesting strong selling pressure in the market. With the MACD momentum indicator confirming current weakness, sellers remain in control of key support levels.
⚖️ Risk/Reward: 1:1.8
⏱️ Timeframe: 15M
💭 A “lower high” occurs when the price fails to surpass its previous peak, indicating a possible loss of buying strength.
#crypto #1000000MOG #trading #Bearish
💡 This analysis is for educational purposes and does not constitute financial advice. Do your own research and make your decision calmly.
6

·
--
Bullish
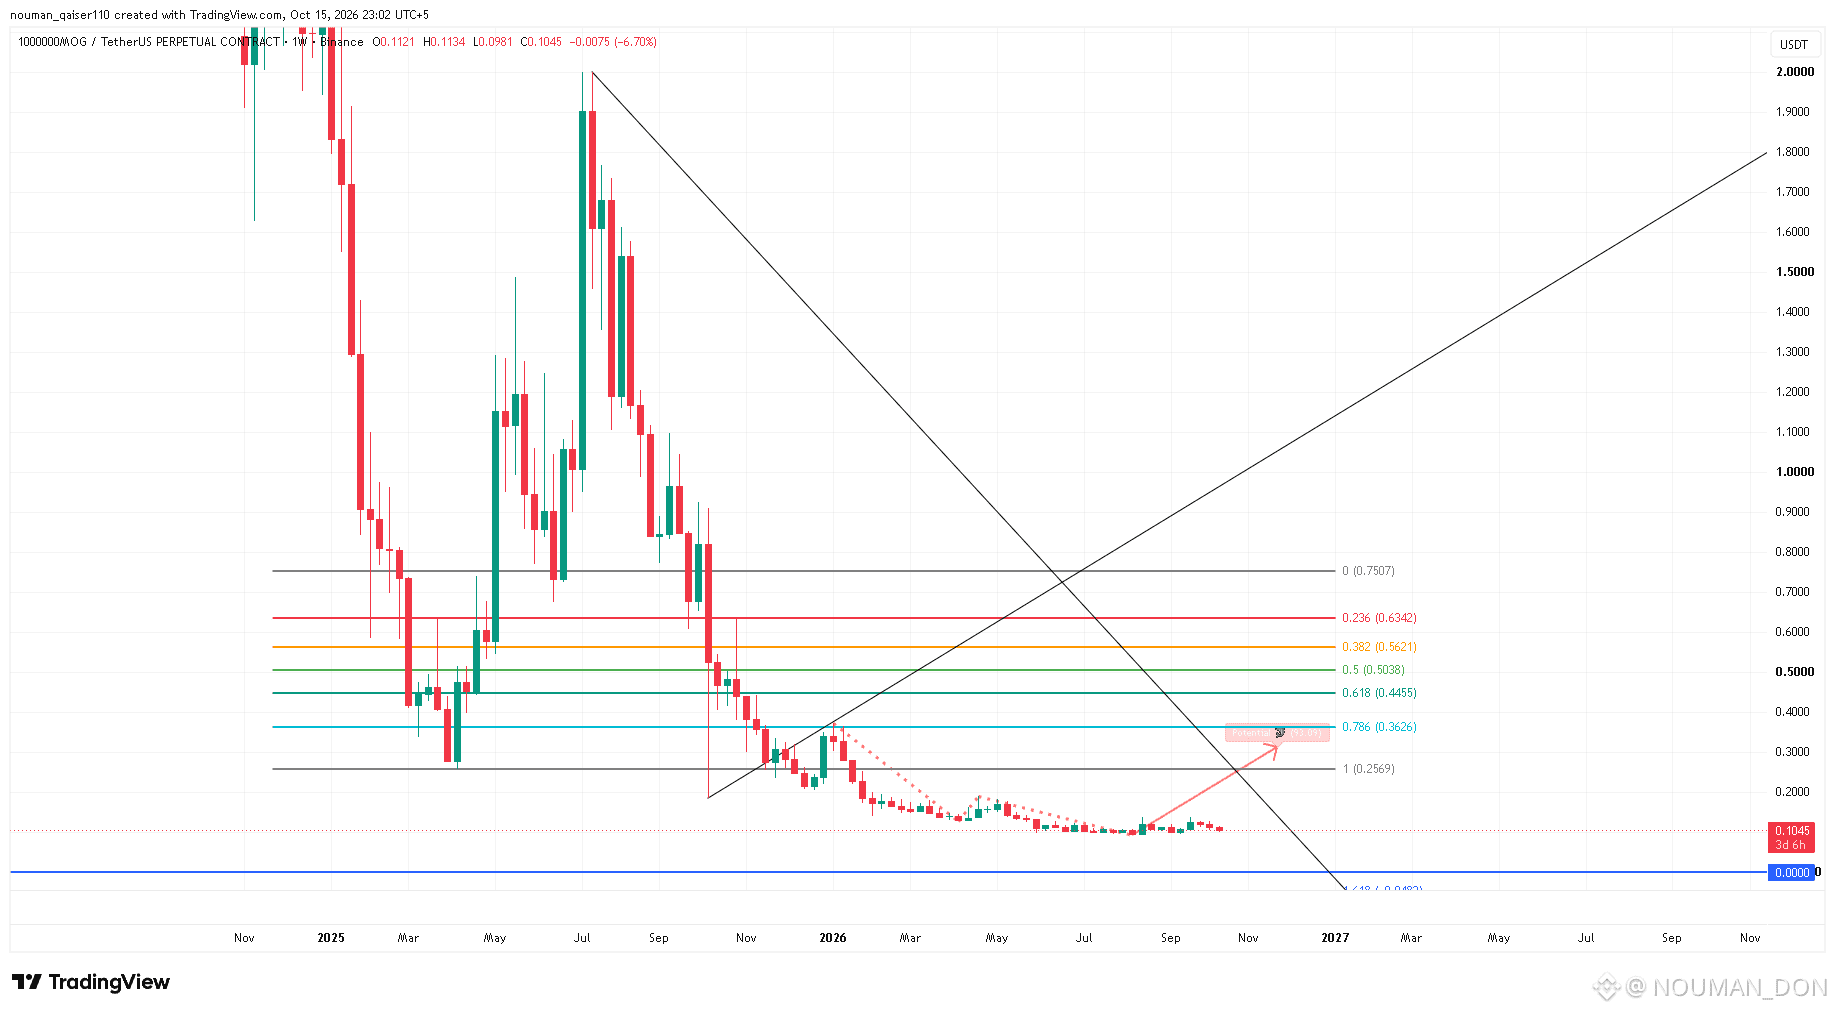
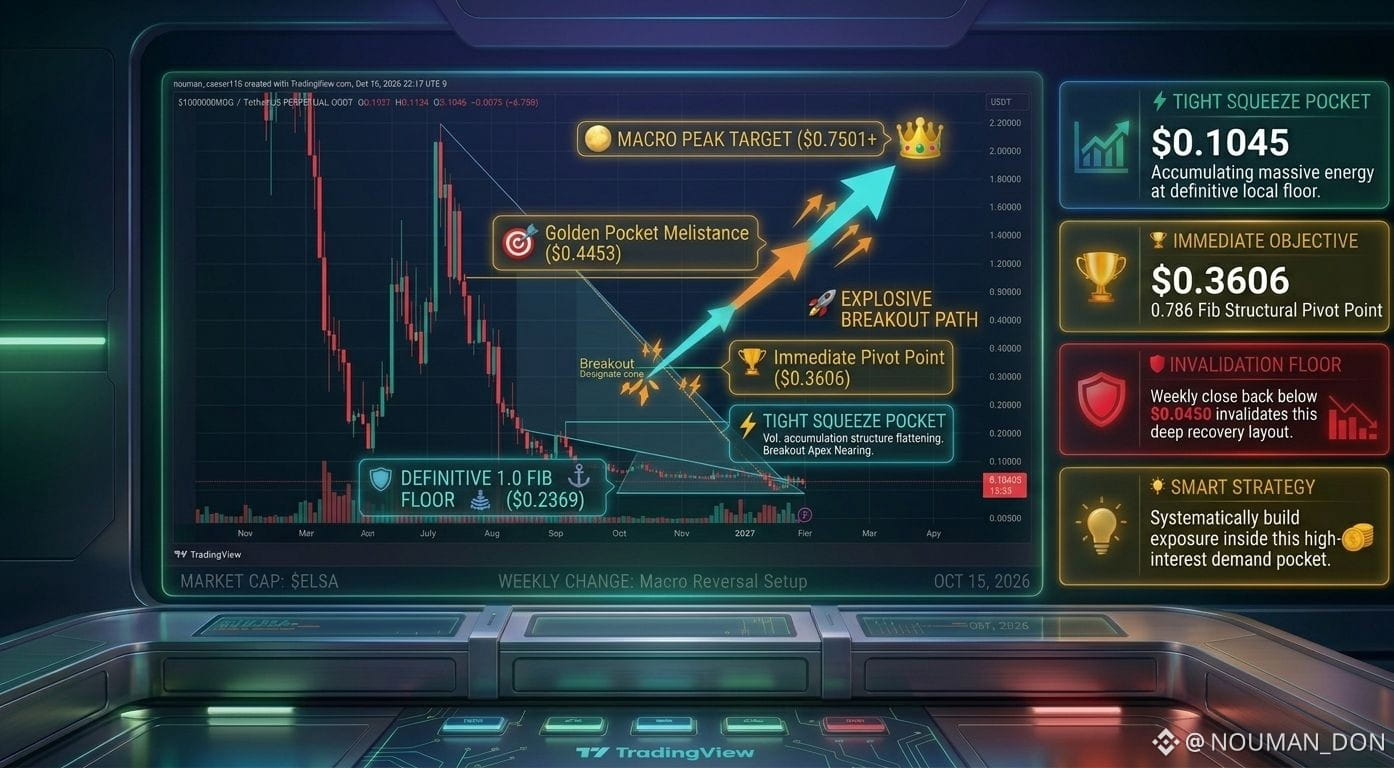
🚀 $1000000MOG /USDT: Macro Accumulation Phase Nearing Breakout Apex! 🔥
The weekly chart for 1000000MOG (TetherUS Perpetual Contract) exhibits an extensive, multi-month volume accumulation structure at its cyclical baseline. Following a prolonged corrective markdown phase, price action has completely flattened out near the absolute historical support to form a massive launchpad!
📊 Key Technical Levels:
• Current Situation: Trading at $0.1045, compressing tightly right around the definitive 1.0 Fibonacci floor ($0.2369).
• Immediate Objective: $0.3606 (0.786 Fibonacci structural pivot point).
• Golden Pocket Target: $0.4453 (0.618 Fibonacci resistance milestone).
• Macro Peak Target: $0.7501+ (0 Fibonacci multi-month market high).
• Invalidation Floor: A weekly close below $0.0450 invalidates this deep recovery layout.
💡 Smart Strategy: Systematically build spot or low-leverage positions within this tight squeeze pocket. The downside risk is heavily exhausted, creating an exceptionally high risk-to-reward ratio.
#1000000MOG #MOG #crypto #altcoins #TechnicalAnalysis
{alpha}(10xaaee1a9723aadb7afa2810263653a34ba2c21c7a)
{future}(1000000MOGUSDT)
🚀 $1000000MOG /USDT: Macro Accumulation Phase Nearing Breakout Apex! 🔥
The weekly chart for 1000000MOG (TetherUS Perpetual Contract) exhibits an extensive, multi-month volume accumulation structure at its cyclical baseline. Following a prolonged corrective markdown phase, price action has completely flattened out near the absolute historical support to form a massive launchpad!
📊 Key Technical Levels:
• Current Situation: Trading at $0.1045, compressing tightly right around the definitive 1.0 Fibonacci floor ($0.2369).
• Immediate Objective: $0.3606 (0.786 Fibonacci structural pivot point).
• Golden Pocket Target: $0.4453 (0.618 Fibonacci resistance milestone).
• Macro Peak Target: $0.7501+ (0 Fibonacci multi-month market high).
• Invalidation Floor: A weekly close below $0.0450 invalidates this deep recovery layout.
💡 Smart Strategy: Systematically build spot or low-leverage positions within this tight squeeze pocket. The downside risk is heavily exhausted, creating an exceptionally high risk-to-reward ratio.
#1000000MOG #MOG #crypto #altcoins #TechnicalAnalysis
1
199
$1000000MOG SHORT
🔹Entry zone: 0.1012
💰Target 1: 0.0998662 (+1.32%)
💰Target 2: 0.09833239 (+2.83%)
💰Target 3: 0.09603169 (+5.11%)
🛡Stop loss: 0.1037007 (-2.47%)
We are considering a downward move with a predefined risk limit. The strategy involves reaching three targets in sequence: the first listed target is followed by the next listed targets.
⚠️ This is not financial advice. Trade at your own risk. DYOR.
#1000000MOG #Home #priceaction 📈
$1000000MOG
24
·
--
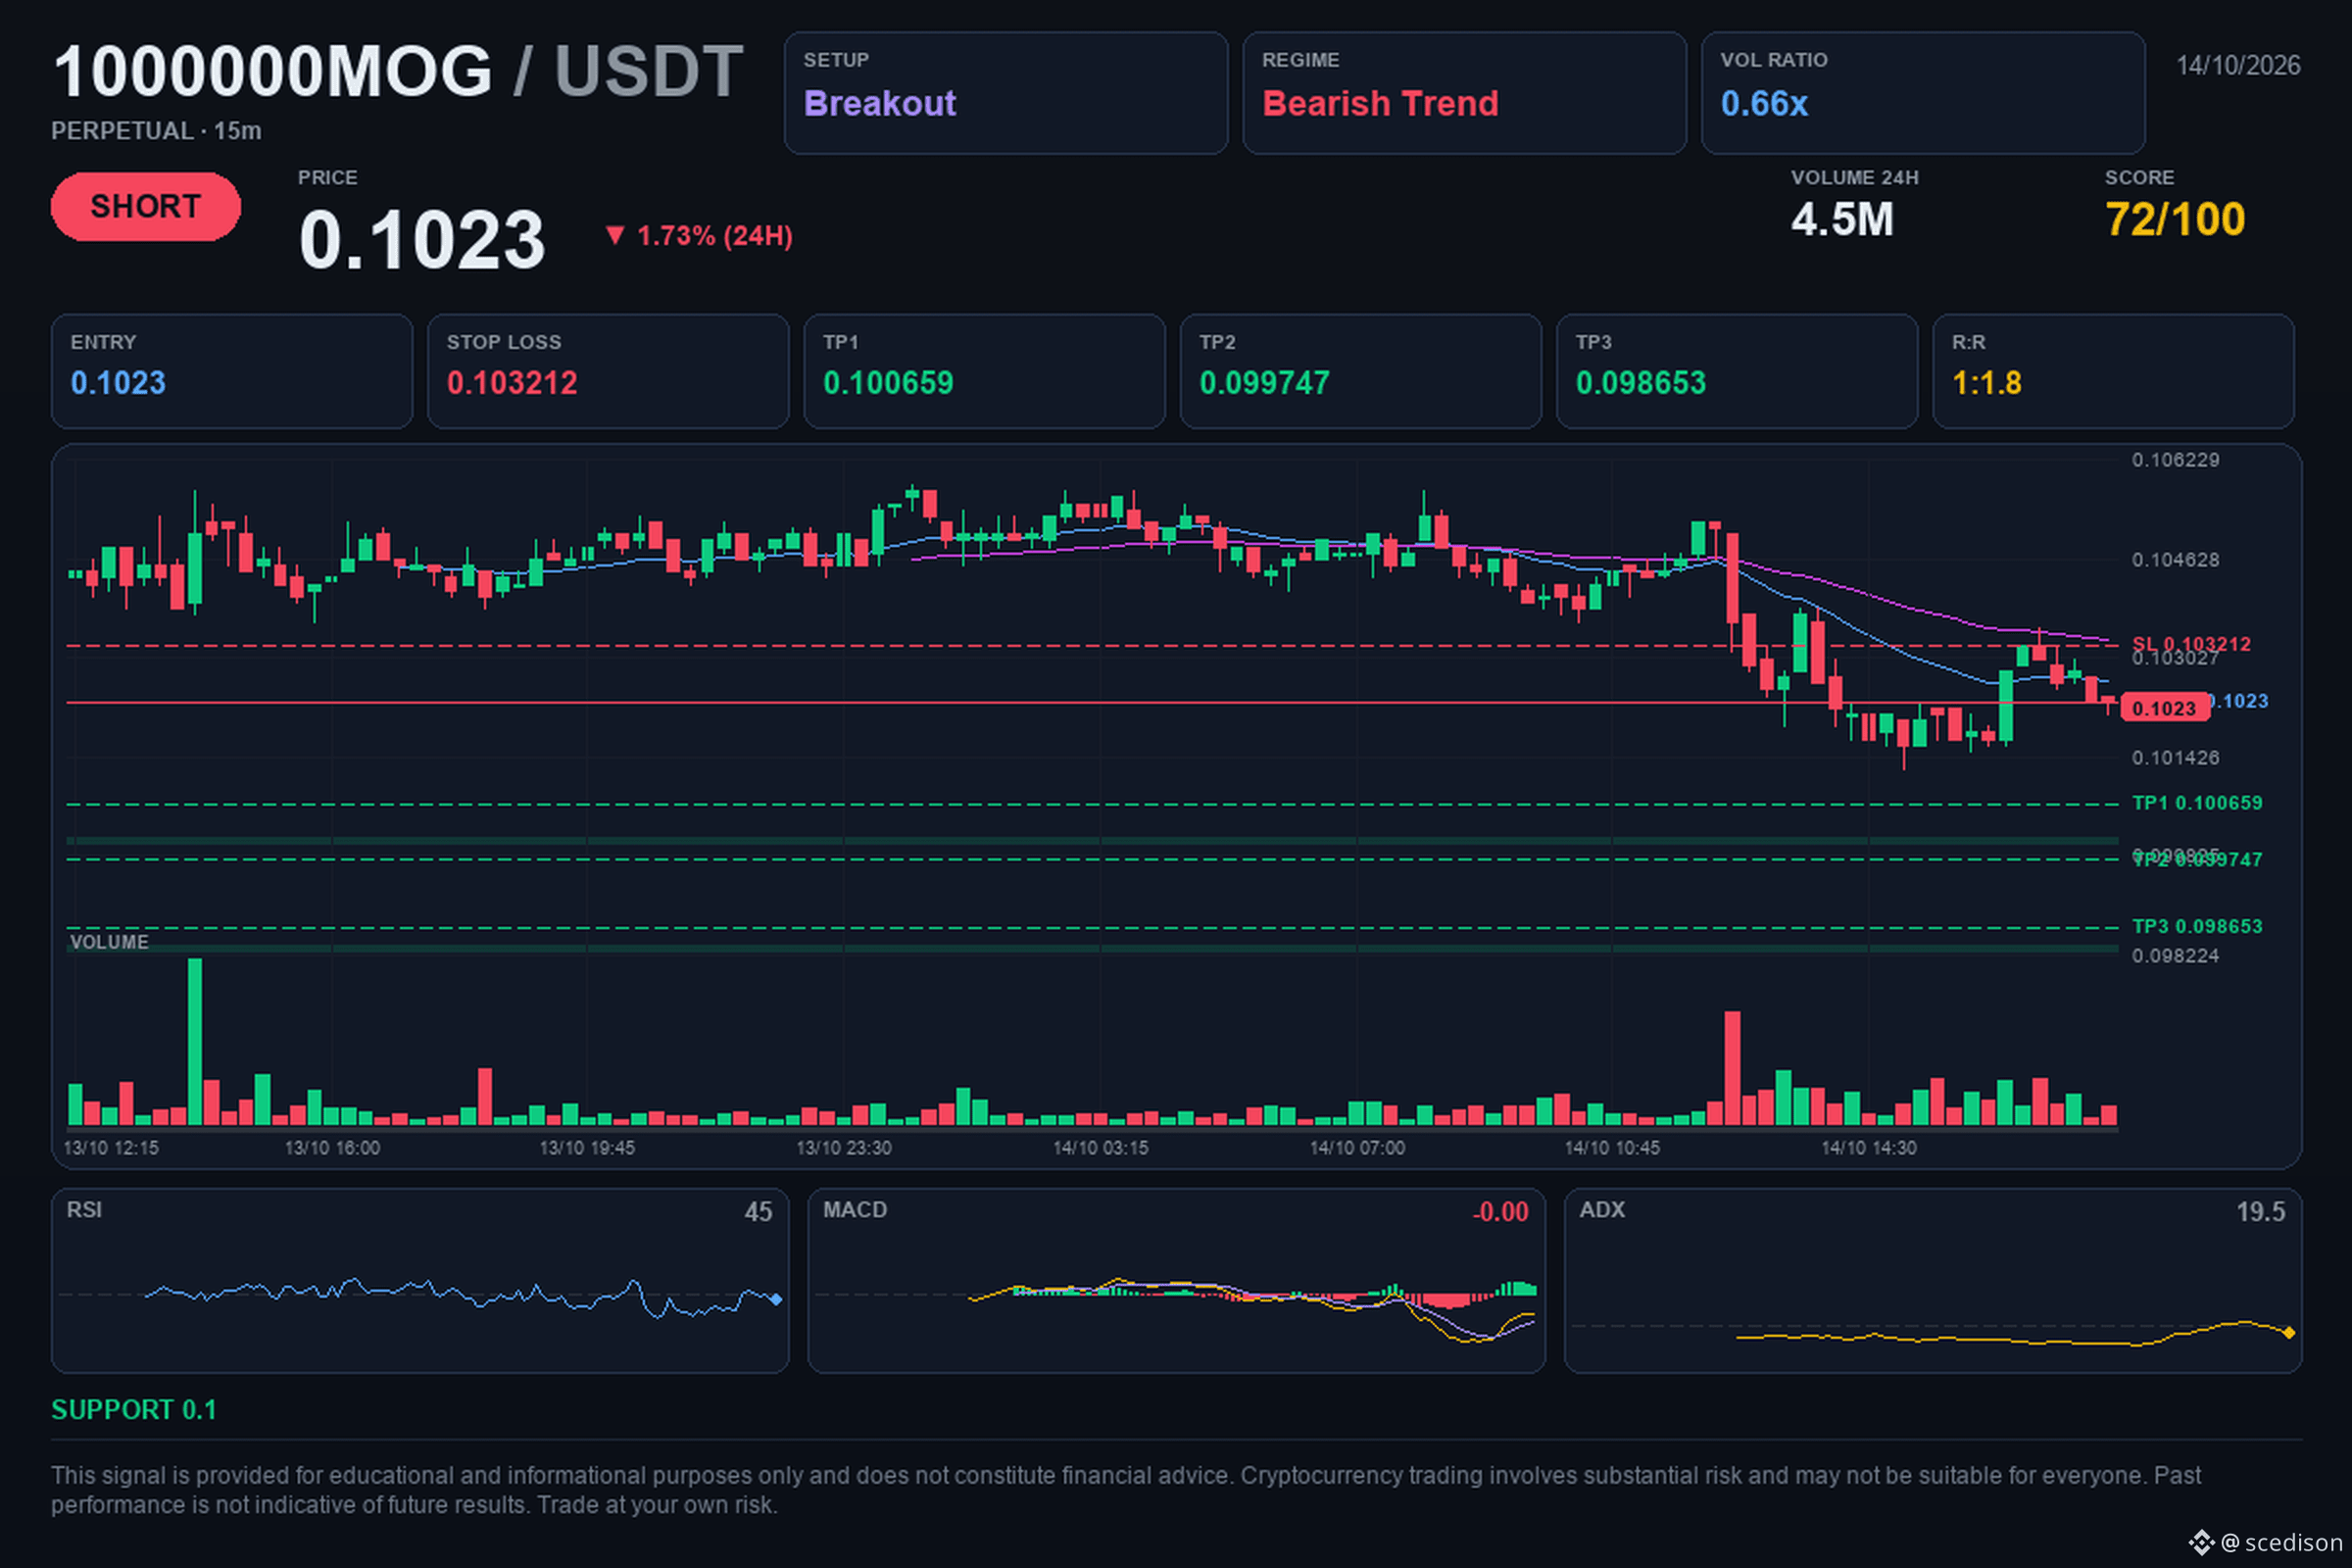
📢 $1000000MOG / USDT | 🔴 SHORT | ⭐ 73%
🎯 Target: $0.10065876. Will it reach it?
🎯 Trading levels:
🔴 Entry: $0.1023
🛑 Stop Loss: $0.103212
🏁 TP1: $0.100659
🏁 TP2: $0.099747
🏁 TP3: $0.098653
📈 Analysis:
The structure shows a clear downtrend, with lower highs on the 4-hour timeframes. Volume has increased by 53.6%, suggesting greater selling activity in the market. With the RSI at 38.07 and a bearish breakout setup, sellers remain in control of the current support levels.
⚖️ Risk/Reward: 1:1.8
⏱️ Timeframe: 15M
💭 A pattern of lower highs indicates that the price is struggling to rise, which is generally interpreted as a sign of weakness among buyers.
#crypto #1000000MOG #trading #Bearish
💡 This analysis is for educational purposes and does not constitute financial advice. Do your own research and make your decision carefully.
7
·
--
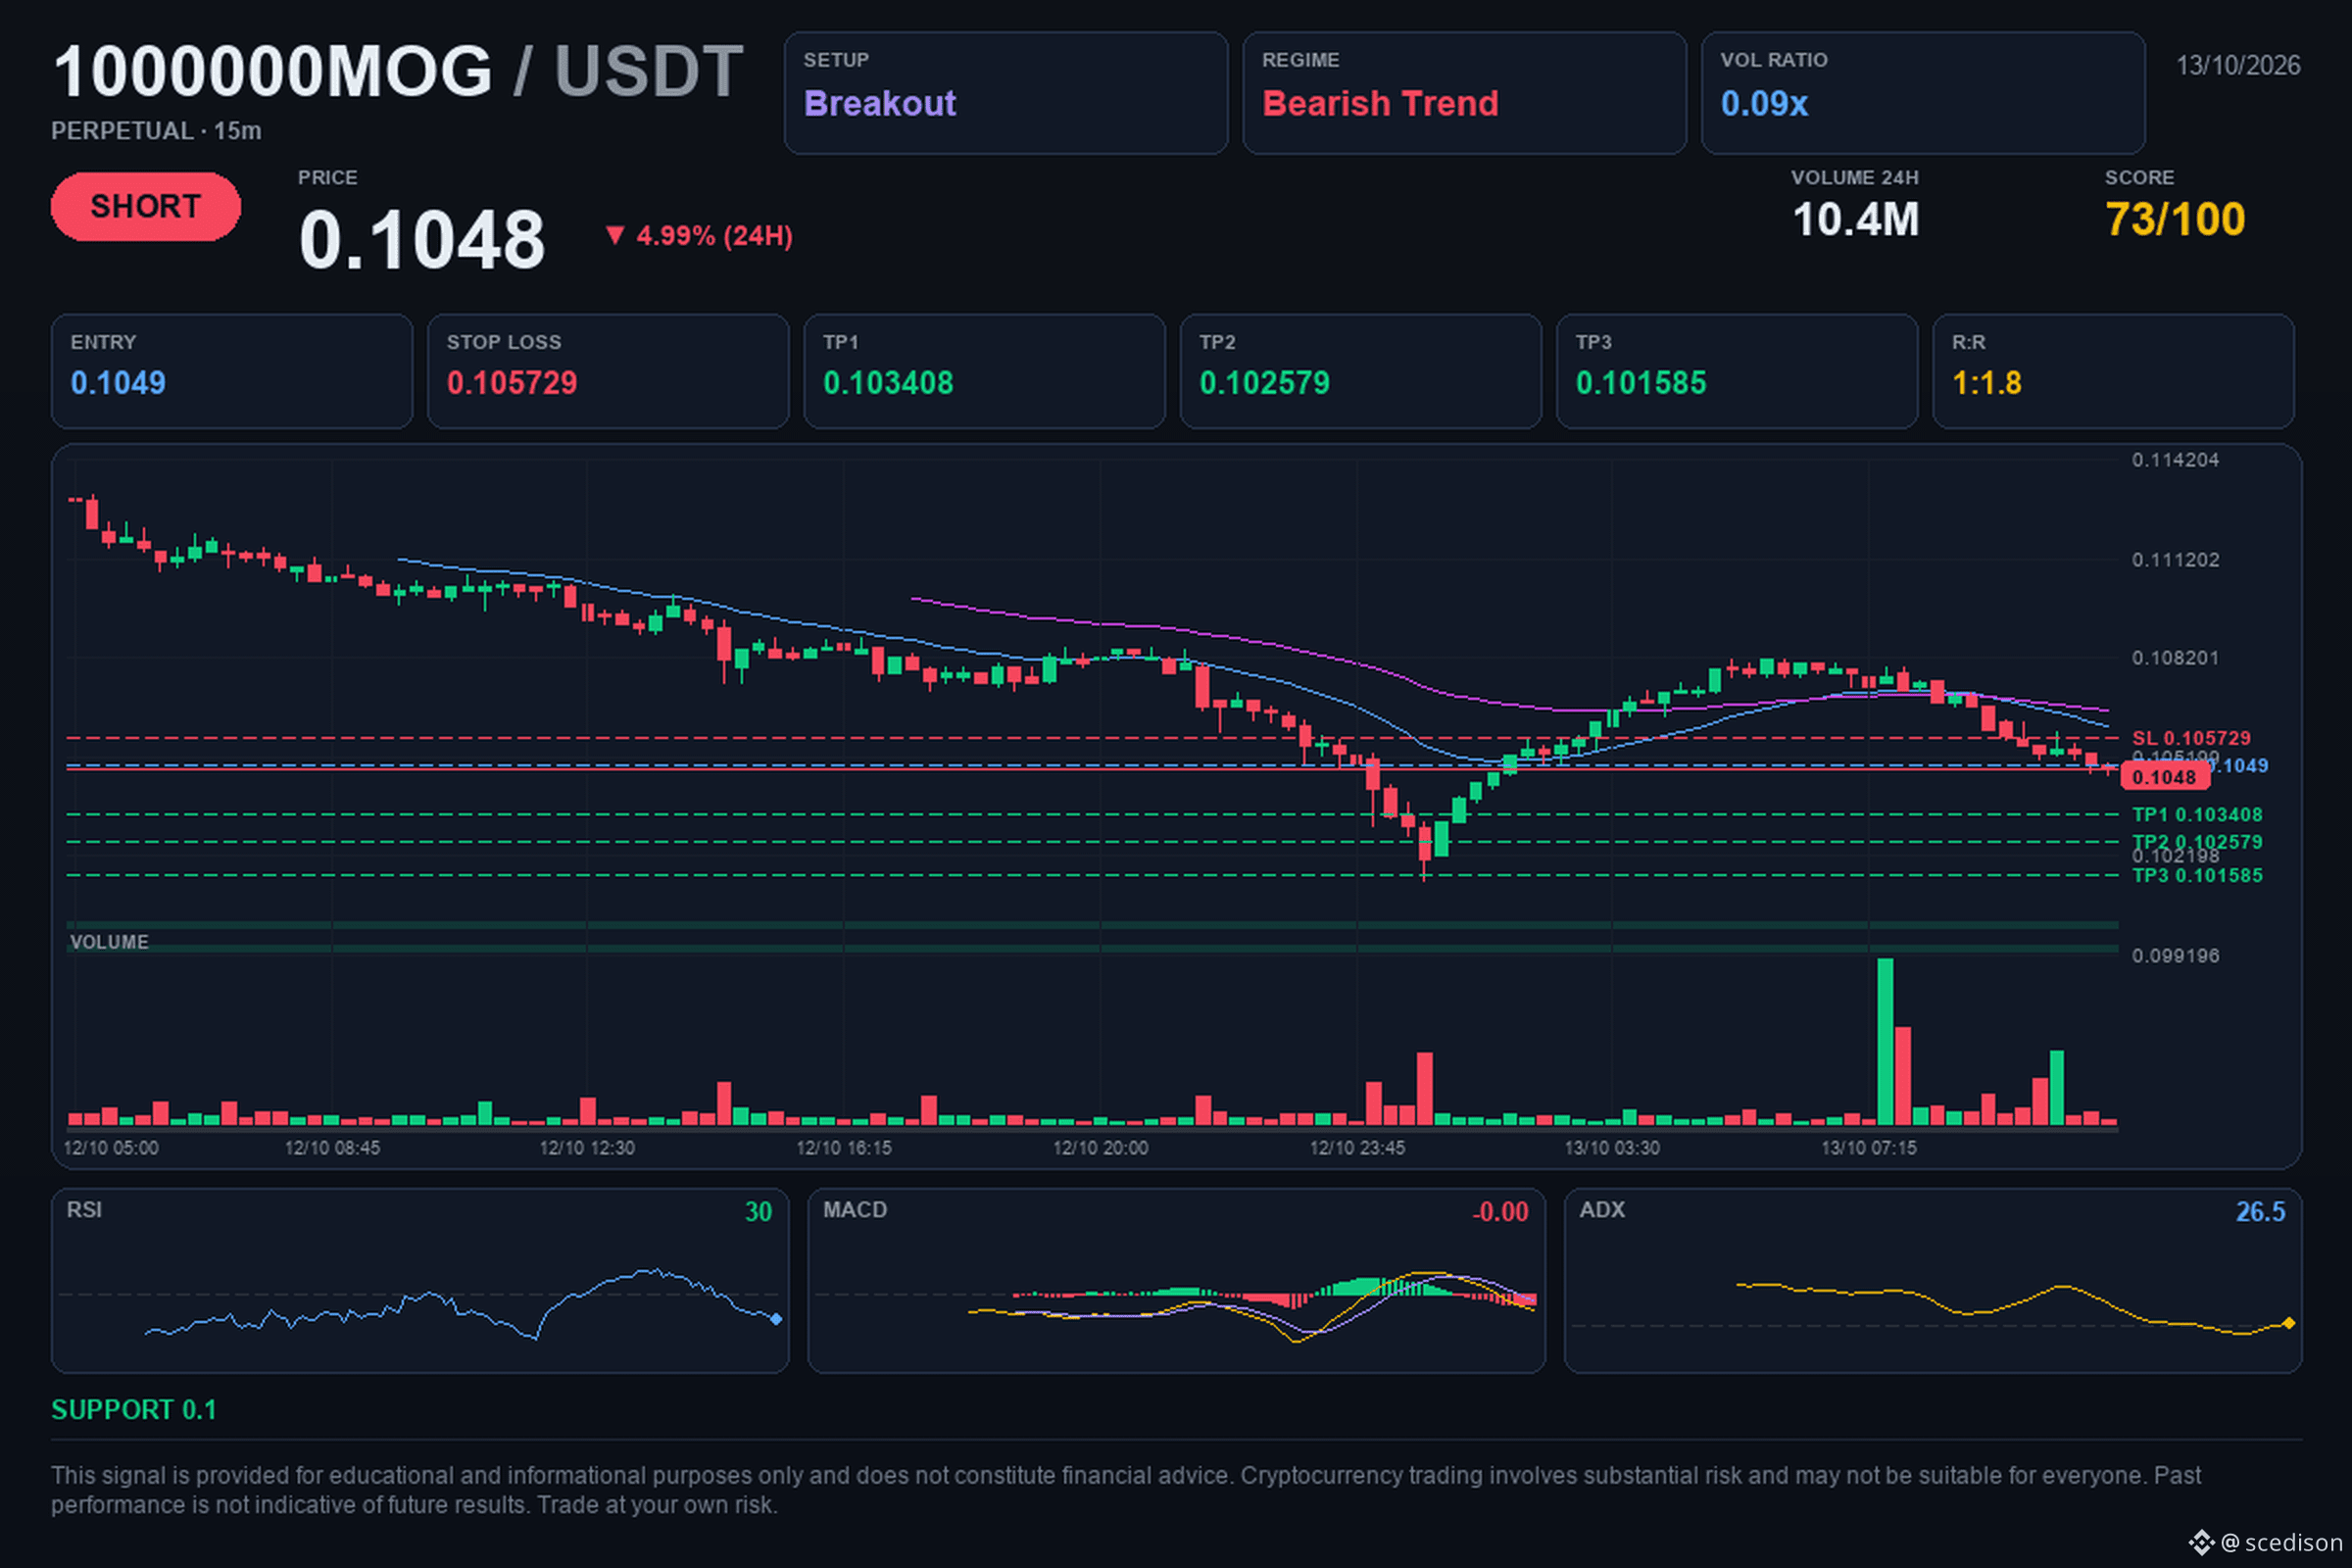
📢 $1000000MOG / USDT | 🔴 SHORT | ⭐ 73%
🎯 Target: $0.10340823. Will it reach it?
🎯 Trade levels:
🔴 Entry: $0.1049
🛑 Stop Loss: $0.105729
🏁 TP1: $0.103408
🏁 TP2: $0.102579
🏁 TP3: $0.101585
📈 Analysis:
The market is showing clear selling pressure, with a confirmed downtrend across multiple timeframes. A key support level has broken, accompanied by a significant increase in trading volume, suggesting strong seller interest. The current structure and bearish momentum support this move, while declining open interest is consistent with price weakness.
⚖️ Risk/Reward: 1:1.8
⏱️ Timeframe: 15M
💭 Relative volume measures how much more an asset is being traded compared with its recent average; a value above 1 indicates unusually high activity.
#crypto #1000000MOG #trading #Bearish
💡 This analysis is for educational purposes and does not constitute financial advice. Do your own research and make your decision carefully.
7

·
--
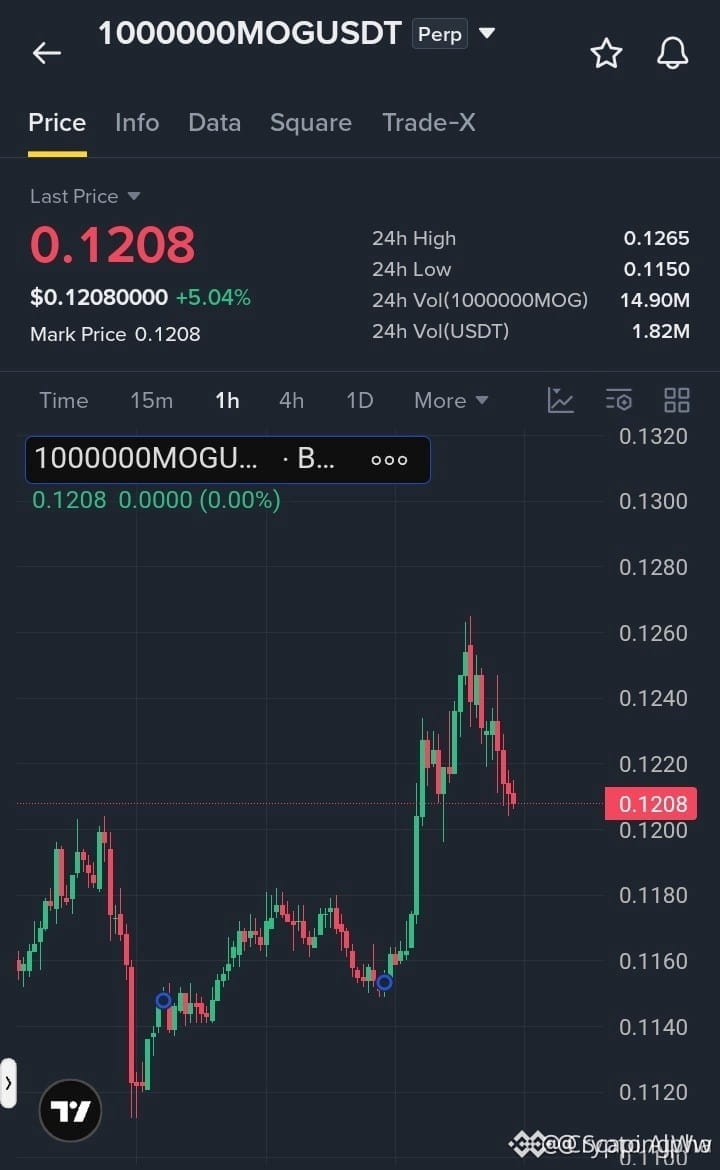
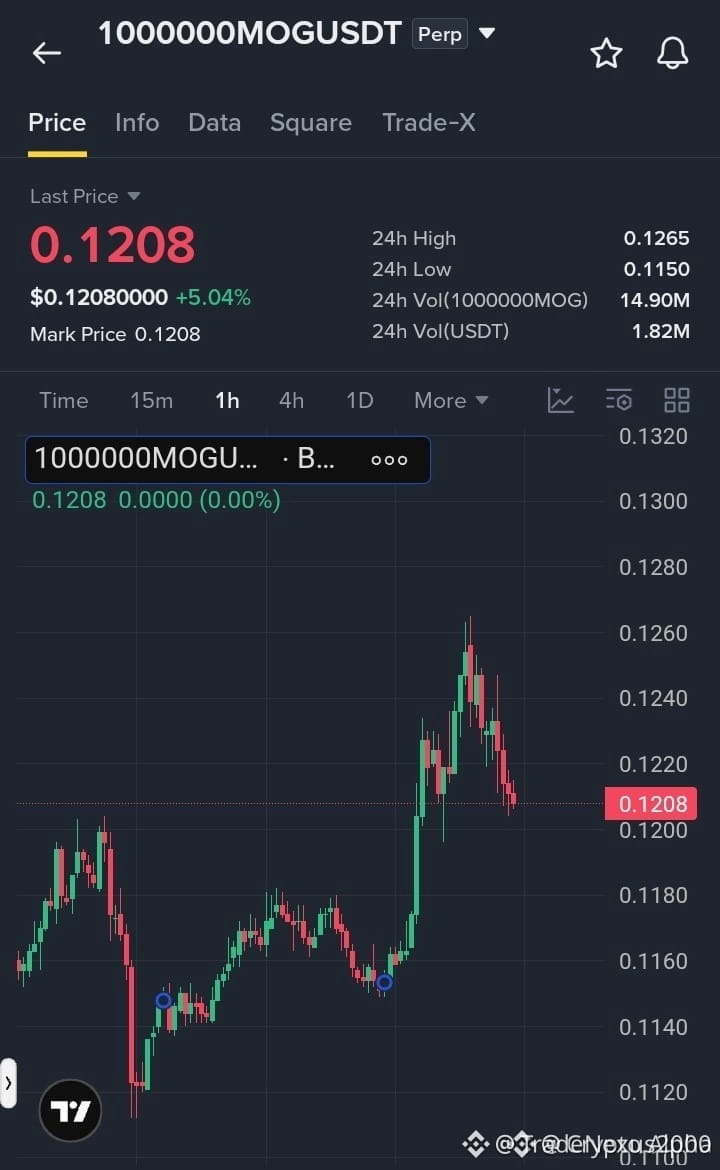
🔴 $1000000MOG REJECTS KEY RESISTANCE AS SELLERS STEP IN FOR A DOWNWARD FLUSH! 📉
Entry: 0.1208 ⚡
Target: 0.1120 🚀
Stop Loss: 0.1248 ⚠️
Sellers slammed the brakes right at the 0.1260 ceiling, leaving a clear trail of exhaustion on the 1H timeframe. 📊 Momentum is visibly draining near 0.1208, opening a clean window for price to slide back toward the lower demand zones.
📉 With buyers failing to defend the micro-bounce, order flow favors a systematic drift lower toward recent support liquidity. 💬 Are you capitalizing on this momentum short or waiting to buy the support retest? 👇
⚠️ Not financial advice. Always manage your risk. 🛡️
🏷️ #1000000MOG #ShortSetup #Bearish #Crypto #Trading
🐻 📉
16

🚨 $1000000MOG REJECTS KEY SUPPLY ZONE AS INSTITUTIONAL SELLERS TAKE CONTROL! 📉
Entry: 0.1208 ⚡
Target: 0.1120 🎯
Stop Loss: 0.1248 🛑
📌 The 1H timeframe prints a clear liquidity sweep and sharp rejection off the 0.1260 supply block. 📊 With price structure degrading into lower highs near 0.1208, upside momentum has evaporated, confirming smart money distribution.
🔍 A move down toward lower demand pools remains the high-probability path as selling volume expands into market inefficiencies. 💬 Are you shorting this structural breakdown or waiting for a deeper retest? 👇
⚠️ Not financial advice. Always manage your risk. 🛡️
🏷️ #1000000MOG #ShortSetup #Crypto #MarketStructure
🎯 📉
14

·
--
$1000000MOGUSDT Perpetual Contract Long Signal
Resistance Level: 0.11810
Support Level: 0.11410
Funding Rate: +0.005%
Volume: 1.84x
1h Change: -0.17%
2026-10-01 11:44
#1000000MOG #合约 #Market Analysis
The signal is for reference only and does not constitute investment advice.
$1000000MOGUSDT Perpetual Contract Long Signal
Resistance Level: 0.11810
Support Level: 0.11410
Funding Rate: +0.005%
Volume: 1.84x
1h Change: -0.17%
2026-10-01 11:44
#1000000MOG #合约 #Market Analysis
The signal is for reference only and does not constitute investment advice.
Resistance Level: 0.11810
Support Level: 0.11410
Funding Rate: +0.005%
Volume: 1.84x
1h Change: -0.17%
2026-10-01 11:44
#1000000MOG #合约 #Market Analysis
The signal is for reference only and does not constitute investment advice.
28

·
--
Crypto $1000000MOG Trading Tips 💹
Choppy Market Recommendations
Entry Range: 0.11211-0.11349
Stop Loss: 0.11143
Targets: 0.11423, 0.11537, 0.11680
Technical Analysis: The MOG chart is as stale and lengthy as grandma's foot binding—EMA is bouncing around 0.11 like it just rolled out of bed, can't even muster a crossover. RSI is lying flat at 44.7, while bulls and bears are just calling each other fools. Do they really think retail traders are just here to pump the exchange's fees? At the price point of 0.1128, it's stuck—can't break up or down. Just hang tight in this range until it breaks the stop loss at 0.111429, then you can cry about it. Don’t kid yourself about a one-way street; with this behavior, chasing the ups will smack you in the face, and if you set a stop loss, it’ll bounce back up. Pure PUA market vibes. I recommend setting a stop loss and closing your eyes—either go flat or get harvested by the whales—'cause I sure don't believe it’s gonna suddenly pump.
Recommended Stop Loss: 0.111429, please adjust your position based on your risk tolerance
#1000000MOG
63

·
--
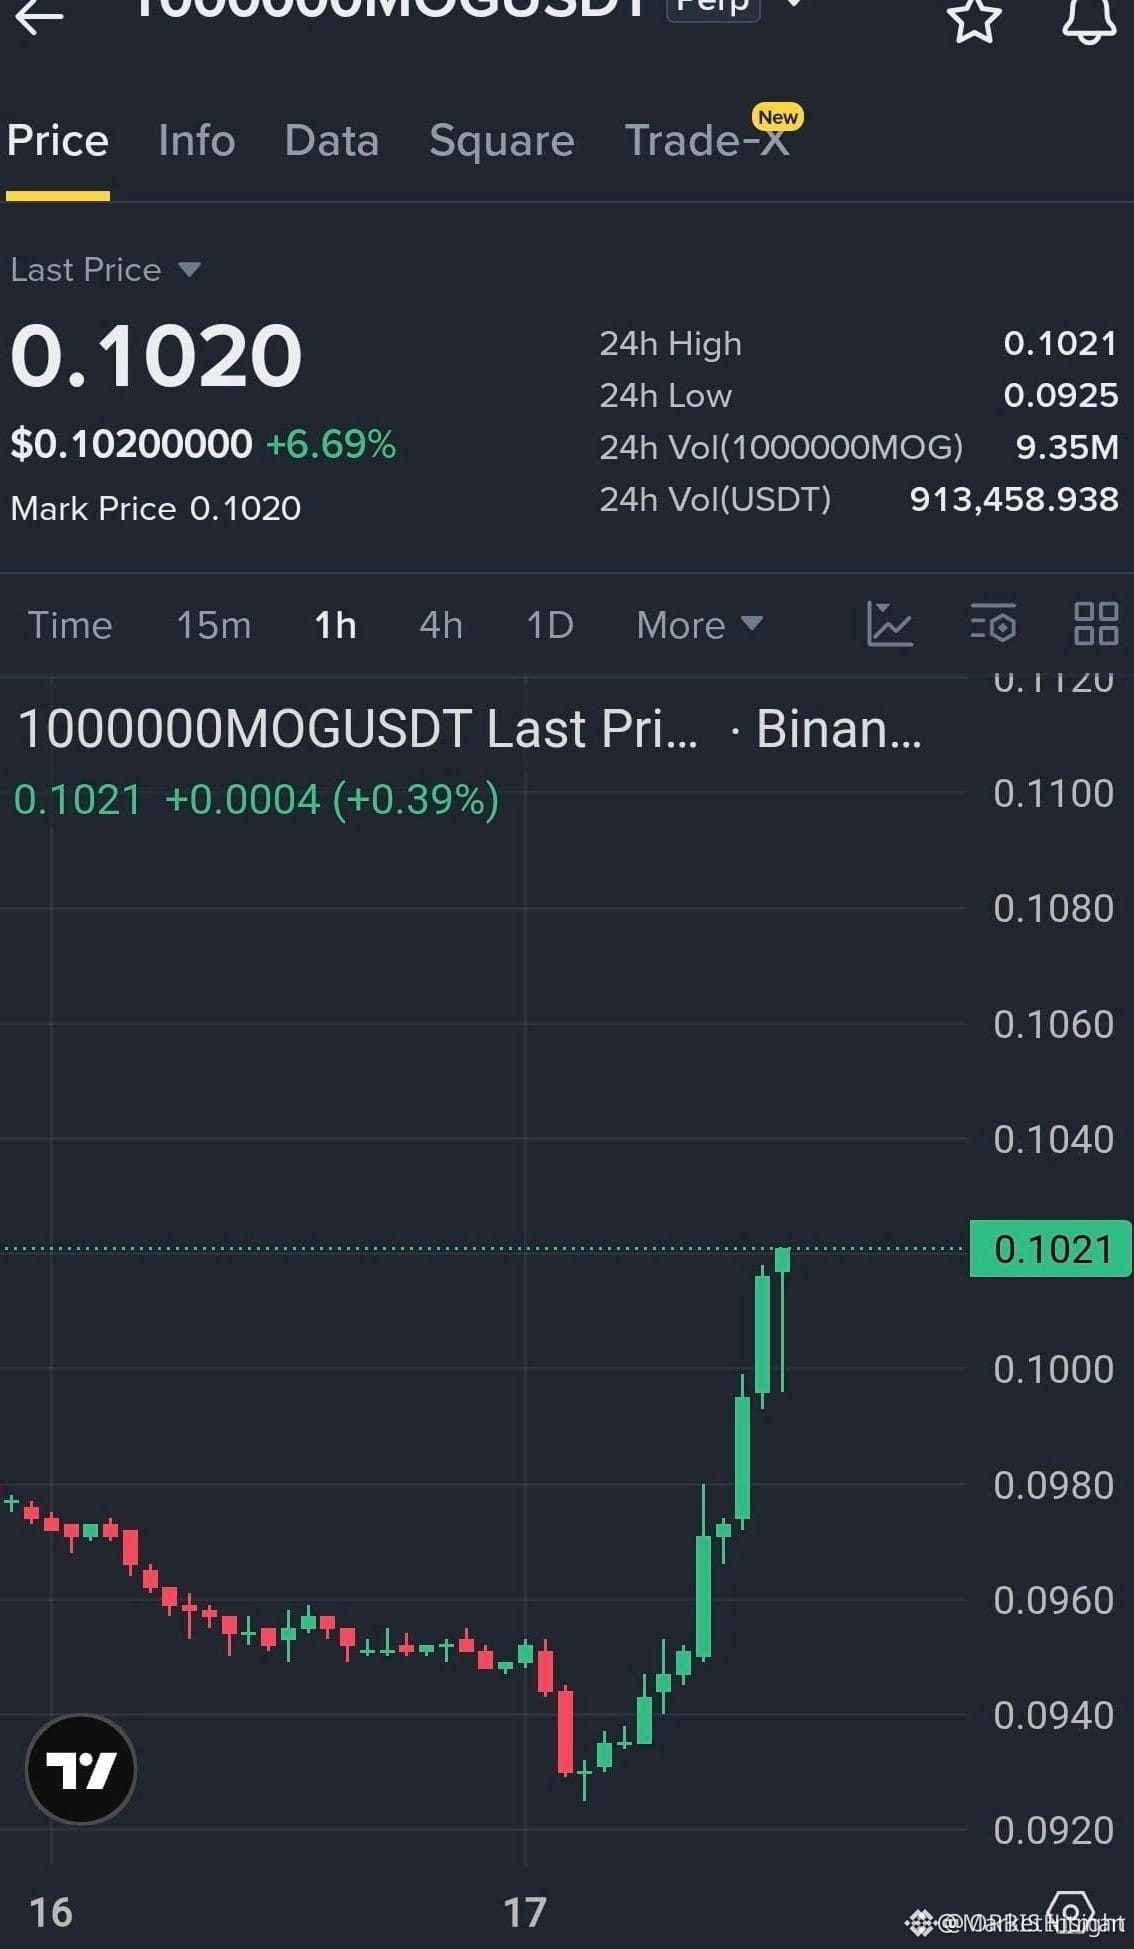
🚨 $1000000MOG CLEARS KEY RESISTANCE AS SMART MONEY DRIVES EXPANSION 💥
Entry: 0.1000 - 0.1020 ⚡
Target: 0.1040 - 0.1060 - 0.1090 🎯
Stop Loss: 0.0970 ⚠️
📌 Market structure on $1000000MOG has shifted aggressively as institutional buyers absorb overhead supply and reclaim the key breakout pivot. 🌊 Aggressive bid-side defense at lower boundaries confirms an ongoing liquidity expansion, leaving minimal structural inefficiency on the retracement.
📊 Volume profiles indicate a clean trend continuation setup with buy-side liquidity targeted above current levels. 💡 As price continues to hold firm above immediate support, order flow heavily favors momentum expansion toward upper liquidity pools. 💬 Are you positioning on this pullback or waiting for further structural confirmation? 👇
⚠️ Not financial advice. Always manage your risk. 🛡️
🏷️ #1000000MOG #Breakout #Crypto #MarketStructure
🔥 💎
59

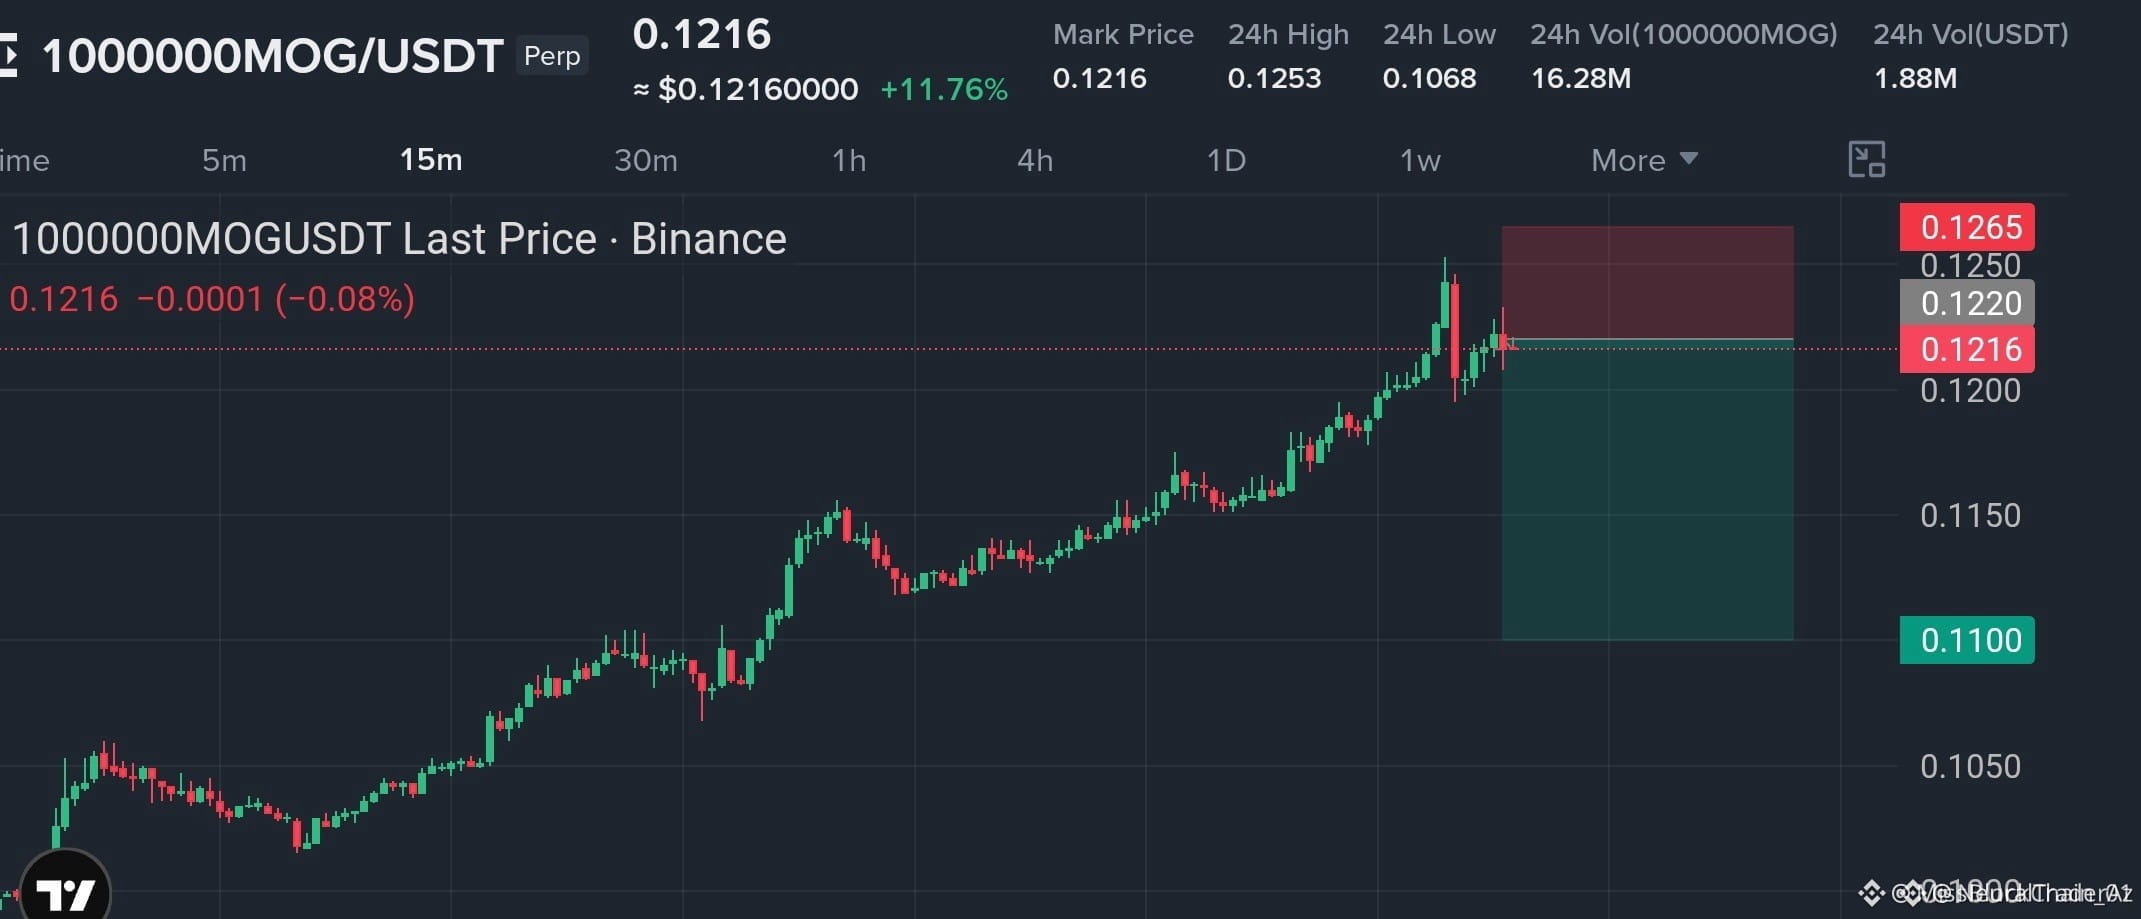
🔻 $1000000MOG FACES HEAVY SUPPLY AT OVERHEAD RESISTANCE AS BUYERS EXHAUST! 📉
Entry: $0.1216–$0.1220 🔴
Target: $0.1100 📉
Stop Loss: $0.1265 ⚠️
Price action on $1000000MOG shows clear momentum deceleration following the recent expansion into overhead supply. Institutional order flow is quietly building short inventory in the $0.1216–$0.1220 premium zone as buy-side liquidity gets absorbed. 📊
Wait for lower timeframe structural confirmation inside the entry range before executing, and avoid chasing if price breaks down impulsively. 🔍 A clean rejection opens the door for a high-probability rotation down toward the inefficiency target at $0.1100. ⚡
💬 Are you waiting for confirmation inside the supply zone or staying on the sidelines? 👇
⚠️ Not financial advice. Always manage your risk. 🛡️
🏷️ #1000000MOG #ShortSetup #MarketStructure #Crypto
🐻 📉
117

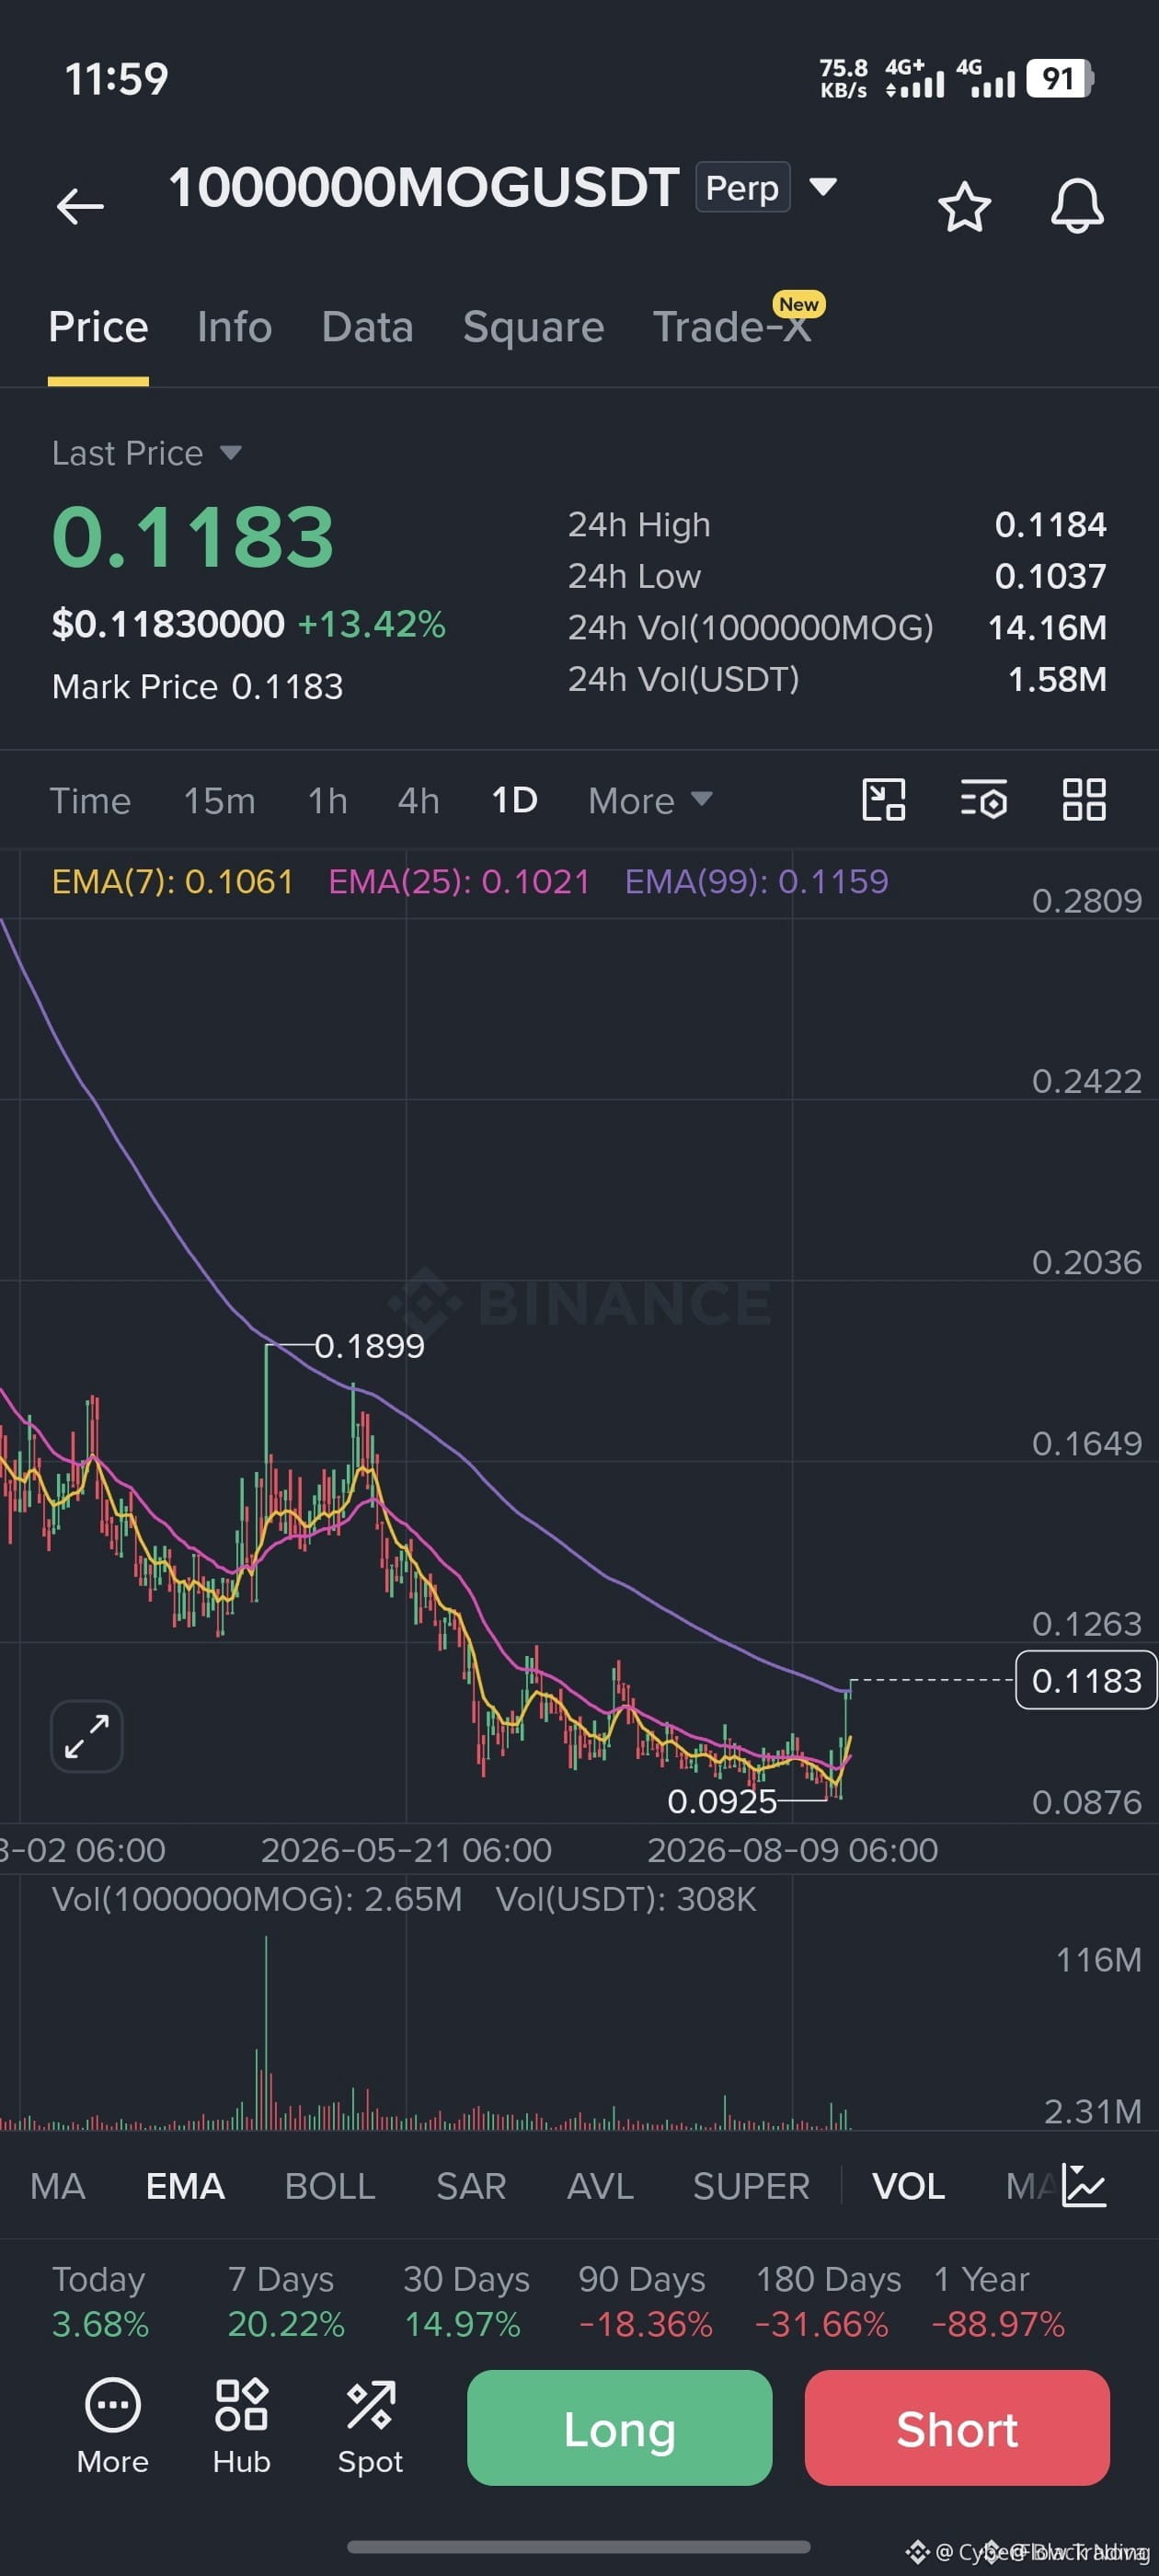
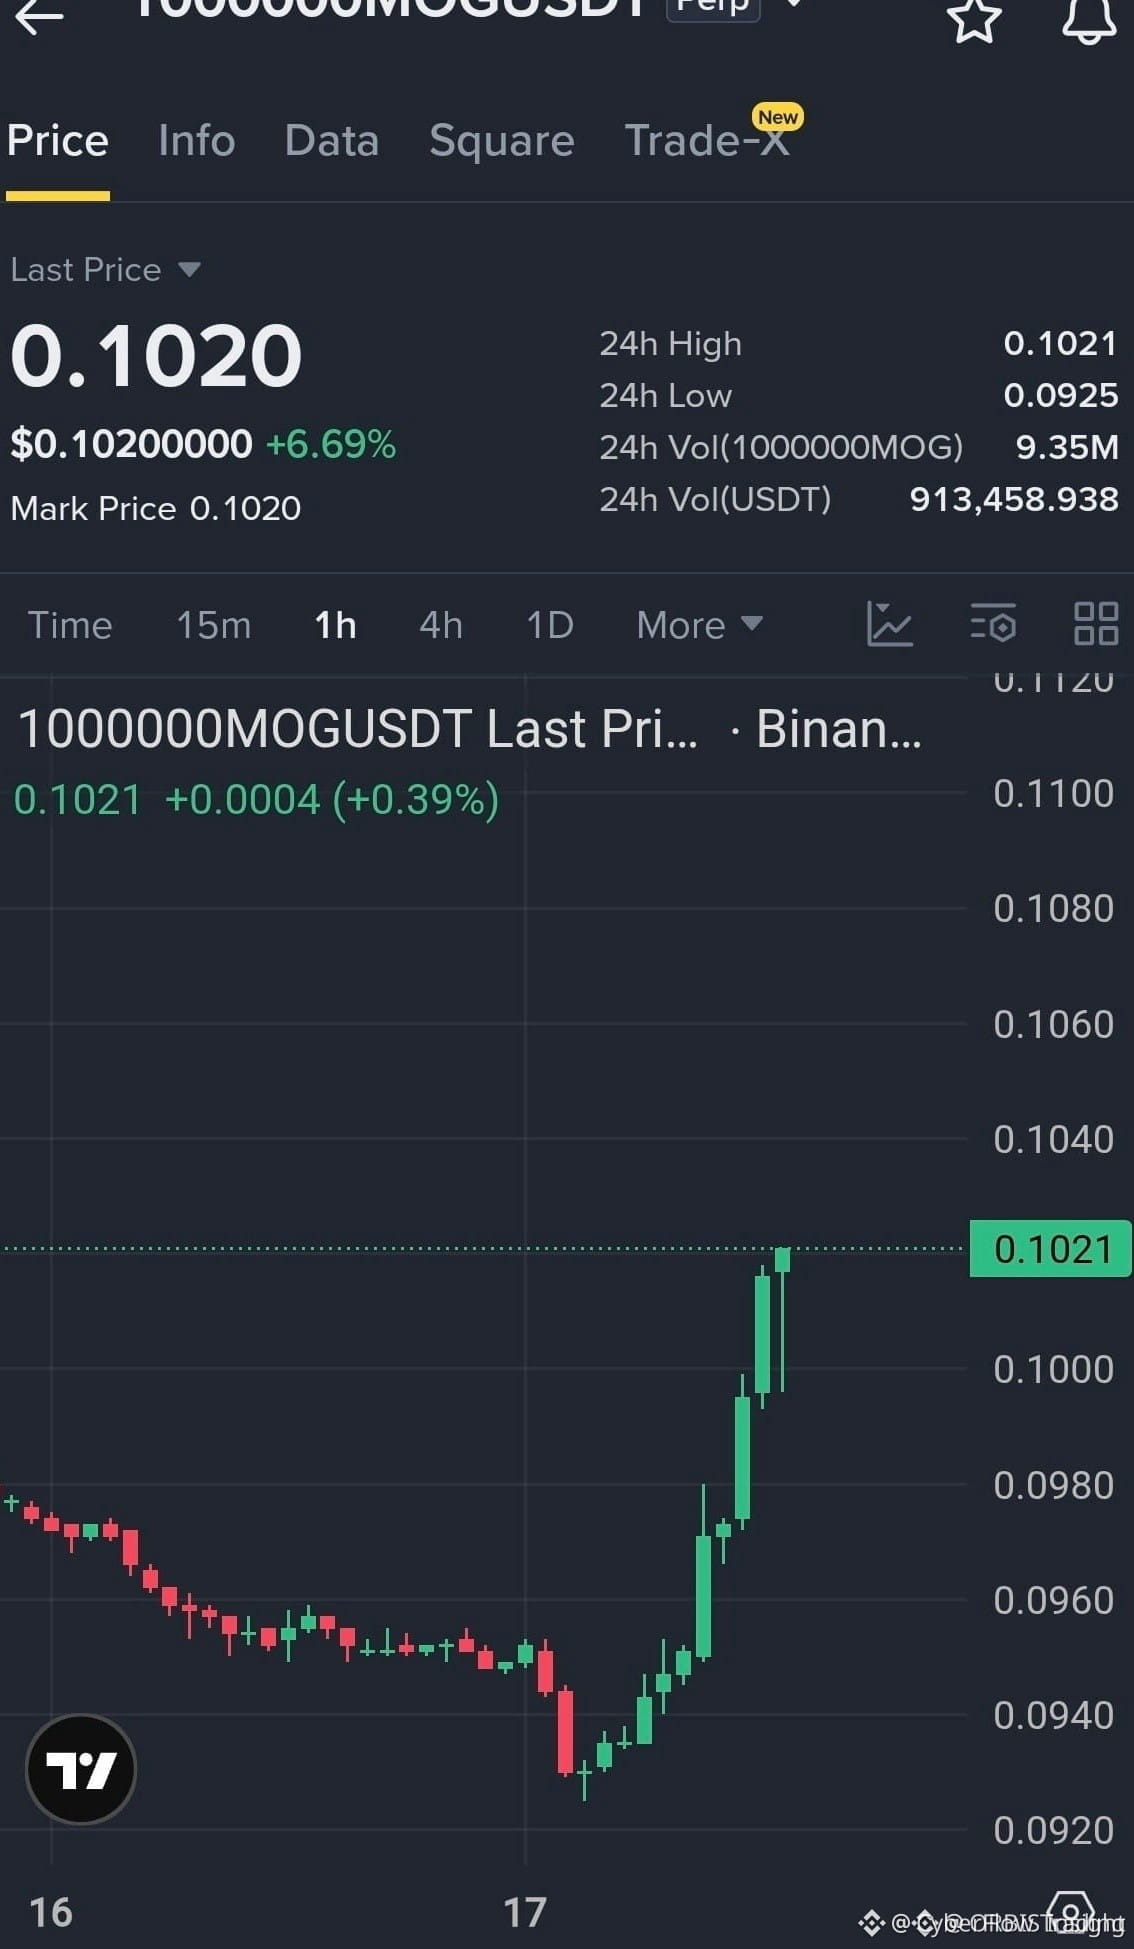
💥 $1000000MOG SMASHES THROUGH CONSOLIDATION WITH STRONG BULLISH MOMENTUM! 🚀
Entry: 0.114 - 0.118 ⚡
Target: 0.126 / 0.138 / 0.150 🚀
Stop Loss: 0.108 ⚠️
Buyers are aggressively absorbing supply, driving price clean out of the recent range and reclaiming short-term EMAs with authority. 📈 This structural shift indicates momentum is swinging heavily back into bull control.
As long as the entry zone holds strong, the pathway toward upper resistance levels remains clear with volume expanding on the breakout. 📊 💬 Are you riding this momentum wave or waiting for a pull-back retest? 👇
⚠️ Not financial advice. Always manage your risk. 🛡️
🏷️ #1000000MOG #LongSetup #Breakout #Crypto
🔥 💎
31
🚨 $1000000MOG SHATTERS KEY RESISTANCE WITH EXPLOSIVE MOMENTUM BUILDING FOR A PARABOLIC RUN! 💥
Entry: 0.1000 - 0.1020 ⚡
Target: 0.1040 - 0.1090 🚀
Stop Loss: 0.0970 ⚠️
Buyers have seized absolute control on $1000000MOG, tearing right through critical overhead supply and carving out a pristine higher-high market structure. 📊 Heavy bid defense around the retest zone confirms aggressive demand stepping in to absorb sell pressure.
⚡ Order flow volume is surging as sell-side liquidity near these levels rapidly evaporates. 💡 With overhead resistance cleared, price is primed to move with swift velocity toward upper target expansion. 💬 Are you riding this momentum flip or waiting to chase at higher levels? 👇
⚠️ Not financial advice. Always manage your risk. 🛡️
🏷️ #1000000MOG #LongSetup #Breakout #Crypto
🔥 ⚡
107
$1000000MOG LONG
The local setup is built on holding positions by buyers.
The target levels above remain a priority for execution.
The risk per trade is clearly limited by a protective stop.
🏁Entry: 0.1105
💰Target 1: 0.1123937 (+1.71%)
💰Target 2: 0.11438741 (+3.52%)
💰Target 3: 0.11737797 (+6.22%)
⛔️Stop: 0.10740944 (-2.80%)
⚠️ This is not financial advice. Trade at your own risk. DYOR.
#1000000MOG #CryptoCommunity #BTCUSDT 📈
$1000000MOG
25

·
--
Bullish
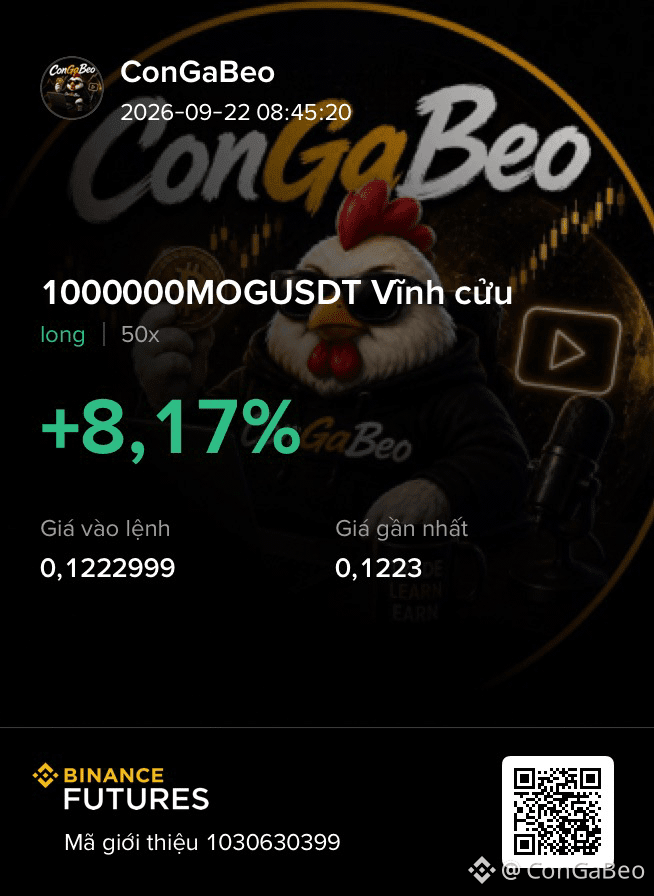
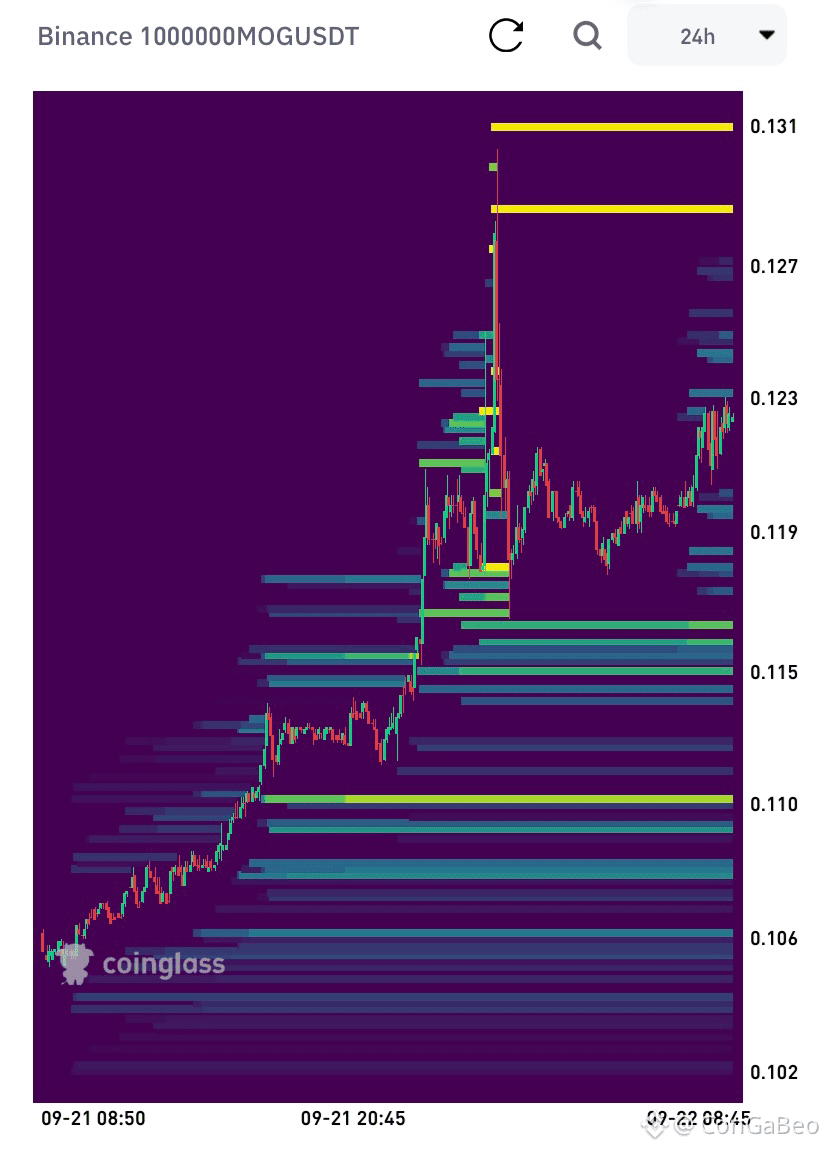
$1000000MOG With waves starting to surge strongly, grab the chance to earn a bowl of pho, everyone 🤩
LONG NOW🔥🔥
Tp1: 0.135
Tp2: 0.15
Tp3: 0.17
Sl: 0.102
#1000000mog #congabeo
$AKE $BTW
{future}(BTWUSDT)
{future}(AKEUSDT)
{future}(1000000MOGUSDT)
$1000000MOG With waves starting to surge strongly, grab the chance to earn a bowl of pho, everyone 🤩
LONG NOW🔥🔥
Tp1: 0.135
Tp2: 0.15
Tp3: 0.17
Sl: 0.102
#1000000mog #congabeo
$AKE $BTW
LONG NOW🔥🔥
Tp1: 0.135
Tp2: 0.15
Tp3: 0.17
Sl: 0.102
#1000000mog #congabeo
$AKE $BTW
1
335

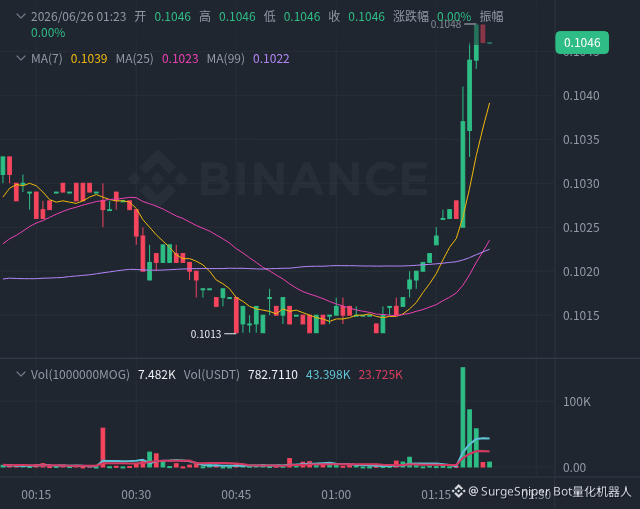
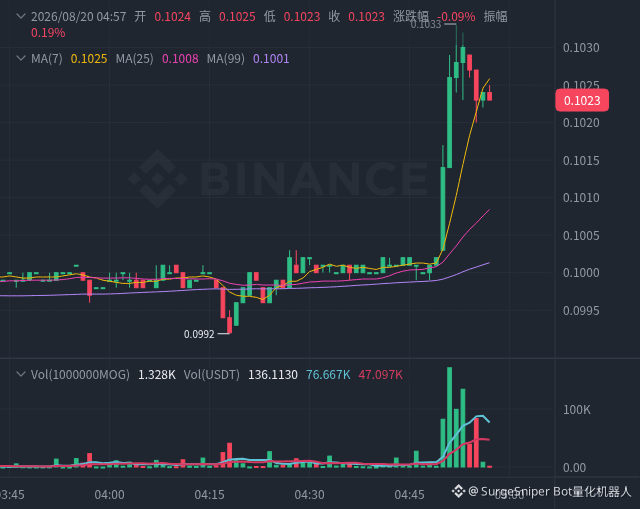
$1000000MOG [Accumulating] 1000000MOG The main force secretly accumulating? OI explodes and rockets the price, but it's still staying down!
[VIP Signal] OI +3.0%, the price only barely moves -0.0%—classic “volume before price”—those in the know are already watching.
I scanned the on-chain data: the main force is building positions; OI has surged, but the price hasn’t started yet.
Plain language:
Remember one sentence: OI doesn’t lie. More positions without higher price = building up power; more positions and also higher price = distribution (selling). This is the former.
In the past 30 minutes, OI jumped 3.0%, but the price only moved -0.02%—volume clearly comes first.
That kind of structure—“capital leads, price lags”—when it appears in history, it is very likely followed by a run-up. The market hasn’t reacted yet, but OI won’t tell lies.
═══ Interpretation of Liquidity ═══
[Big players watching] The big player long/short ratio is 1.06. The main force hasn’t made a statement yet—right now, go by the order book.
[Retail FOMO] The retail long/short ratio has spiked to 3.30—sentiment is overheated. Historically, when retail gets collectively euphoric, it’s often a contrarian indicator.
═══ One-sentence summary ═══
The main force’s signal for taking chips is already very clear; when the market reacts is just a matter of time. Being half a step early makes you the winner.
[Quant Strategy Engine OI Signal V3.2]
#1000000MOG
{future}(1000000MOGUSDT)
$1000000MOG [Accumulating] 1000000MOG The main force secretly accumulating? OI explodes and rockets the price, but it's still staying down!
[VIP Signal] OI +3.0%, the price only barely moves -0.0%—classic “volume before price”—those in the know are already watching.
I scanned the on-chain data: the main force is building positions; OI has surged, but the price hasn’t started yet.
Plain language:
Remember one sentence: OI doesn’t lie. More positions without higher price = building up power; more positions and also higher price = distribution (selling). This is the former.
In the past 30 minutes, OI jumped 3.0%, but the price only moved -0.02%—volume clearly comes first.
That kind of structure—“capital leads, price lags”—when it appears in history, it is very likely followed by a run-up. The market hasn’t reacted yet, but OI won’t tell lies.
═══ Interpretation of Liquidity ═══
[Big players watching] The big player long/short ratio is 1.06. The main force hasn’t made a statement yet—right now, go by the order book.
[Retail FOMO] The retail long/short ratio has spiked to 3.30—sentiment is overheated. Historically, when retail gets collectively euphoric, it’s often a contrarian indicator.
═══ One-sentence summary ═══
The main force’s signal for taking chips is already very clear; when the market reacts is just a matter of time. Being half a step early makes you the winner.
[Quant Strategy Engine OI Signal V3.2]
#1000000MOG
41
$1000000MOG [Accumulating Shares] 1000000MOG Is the main force secretly accumulating? OI explodes and the price is still lying down!
[Volume-Price Divergence] Catching a volume-price divergence! OI +3.1% vs price +0.15%—I’ve seen this script before.
I flipped through the on-chain data: the main force is building positions. OI has surged, but the price hasn’t started moving yet.
In plain words:
OI is open interest; price is the surface. If OI spikes and the price doesn’t rise, it means someone is taking orders at the bottom while the people up top haven’t noticed yet.
OI in 30 minutes +3.1%, price crawled up only +0.15%—this isn’t “stagnation.” It’s position-building under pressure.
Don’t wait for the price to take off before chasing—OI already tells you where the money is. What’s left is waiting for the wind.
═══ Liquidity Interpretation ═══
[Big Players Cautious] The big players’ long/short ratio is 1.02. The main force hasn’t made a move yet—follow the order book for now.
[Retail FOMO] Retail is hyped: the long/short ratio is 3.12. When everyone is bullish, who’s left to buy?
═══ One-Sentence Summary ═══
The signal that the main force is loading up is already very clear. When the market responds is just a matter of time. A half-step early makes you the winner.
[OI Signal Strategy V3.2]
#1000000MOG
{future}(1000000MOGUSDT)
$1000000MOG [Accumulating Shares] 1000000MOG Is the main force secretly accumulating? OI explodes and the price is still lying down!
[Volume-Price Divergence] Catching a volume-price divergence! OI +3.1% vs price +0.15%—I’ve seen this script before.
I flipped through the on-chain data: the main force is building positions. OI has surged, but the price hasn’t started moving yet.
In plain words:
OI is open interest; price is the surface. If OI spikes and the price doesn’t rise, it means someone is taking orders at the bottom while the people up top haven’t noticed yet.
OI in 30 minutes +3.1%, price crawled up only +0.15%—this isn’t “stagnation.” It’s position-building under pressure.
Don’t wait for the price to take off before chasing—OI already tells you where the money is. What’s left is waiting for the wind.
═══ Liquidity Interpretation ═══
[Big Players Cautious] The big players’ long/short ratio is 1.02. The main force hasn’t made a move yet—follow the order book for now.
[Retail FOMO] Retail is hyped: the long/short ratio is 3.12. When everyone is bullish, who’s left to buy?
═══ One-Sentence Summary ═══
The signal that the main force is loading up is already very clear. When the market responds is just a matter of time. A half-step early makes you the winner.
[OI Signal Strategy V3.2]
#1000000MOG
29
Log in to explore more content
Join global crypto users on Binance Square
⚡️ Get latest and useful information about crypto.
💬 Trusted by the world’s largest crypto exchange.
👍 Discover real insights from verified creators.
Email / Phone number
Trending Topics
1
#FedWatch
16.2M views
38,533 Discussing
2
#EarningsSeason
6.3M views
31,252 Discussing
3
#USMidtermElections
4,610 views
207 Discussing
4
#BitcoinDropsBelow$80K
5,935 views
46 Discussing
5
#BoEOpensConsultationOnTokenizedCollateralForClearing
3 views
3 Discussing
6
#BrazilCryptoExchangesMustApplyForLicensesByFriday
2,458 views
175 Discussing
7
#ICEPartnersWithTradeXYZToBringPerpetualContractsToUS
372 views
12 Discussing
8
#SolidusLabsReportsSuspected$170MSpoofingOnHyperliquidOilContracts
747 views
20 Discussing
9
#StanDruckenmillerBecomesInvestorInTradeXYZ
4,221 views
190 Discussing
10
#RussiaProposedNonCustodialWalletLimitsExcludeIntlSettlements
1,280 views
36 Discussing