
合约涨跌AI预判-VIP-0907版
9.3k Posts

合约涨跌AI预判-VIP-0907版
 Square Verified+
Report
Block User
以咨询级视角拆解 AI 趋势、智能工具与商业应用,过滤信息噪音,提炼真正有价值的前沿洞察 | 任何帖子非财务投资建议 | Opinions are my own & Not Financial Advice

Creator Awards 2024

原创之星

Level 1 Creator
Open Trade
Occasional Trader
5.7 Years
0 Following
72.5K+ Followers
691.0K+ Liked
4 Badges
Posts
Portfolio
All
Quotes
Videos
Live
Contract Order Book Daily | 9/14 Sentiment leans greedy; leverage increases in step
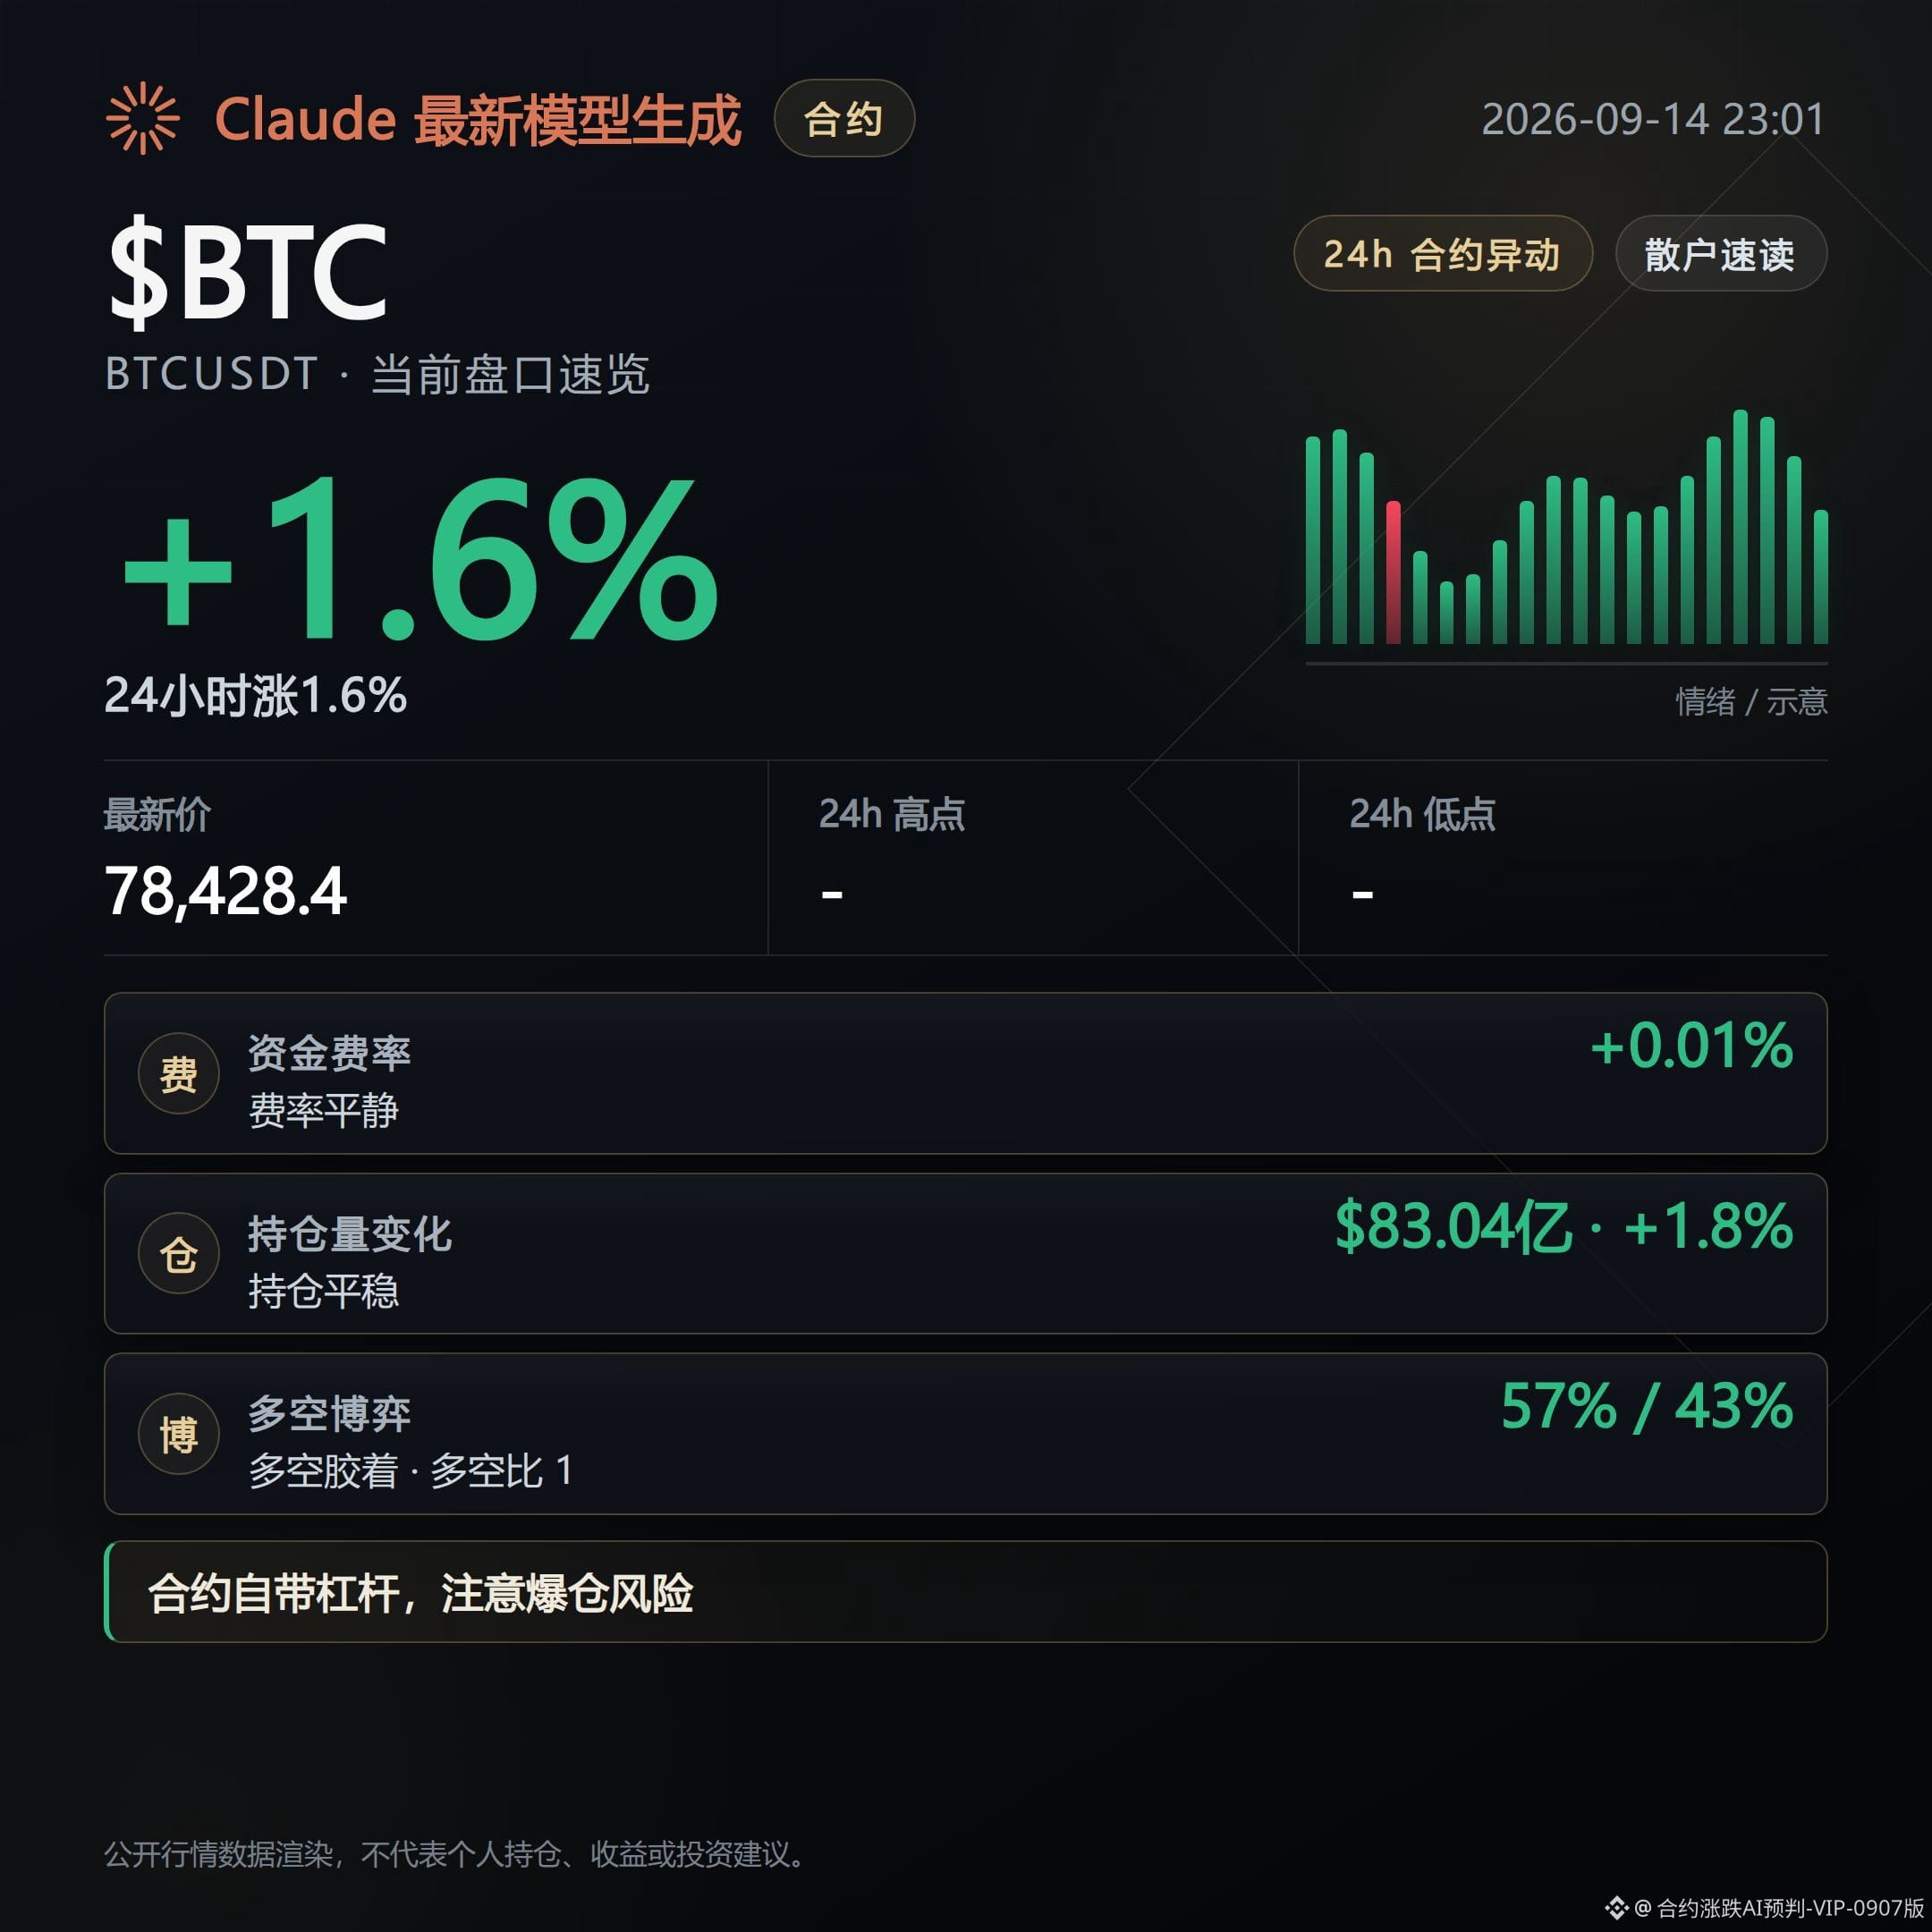
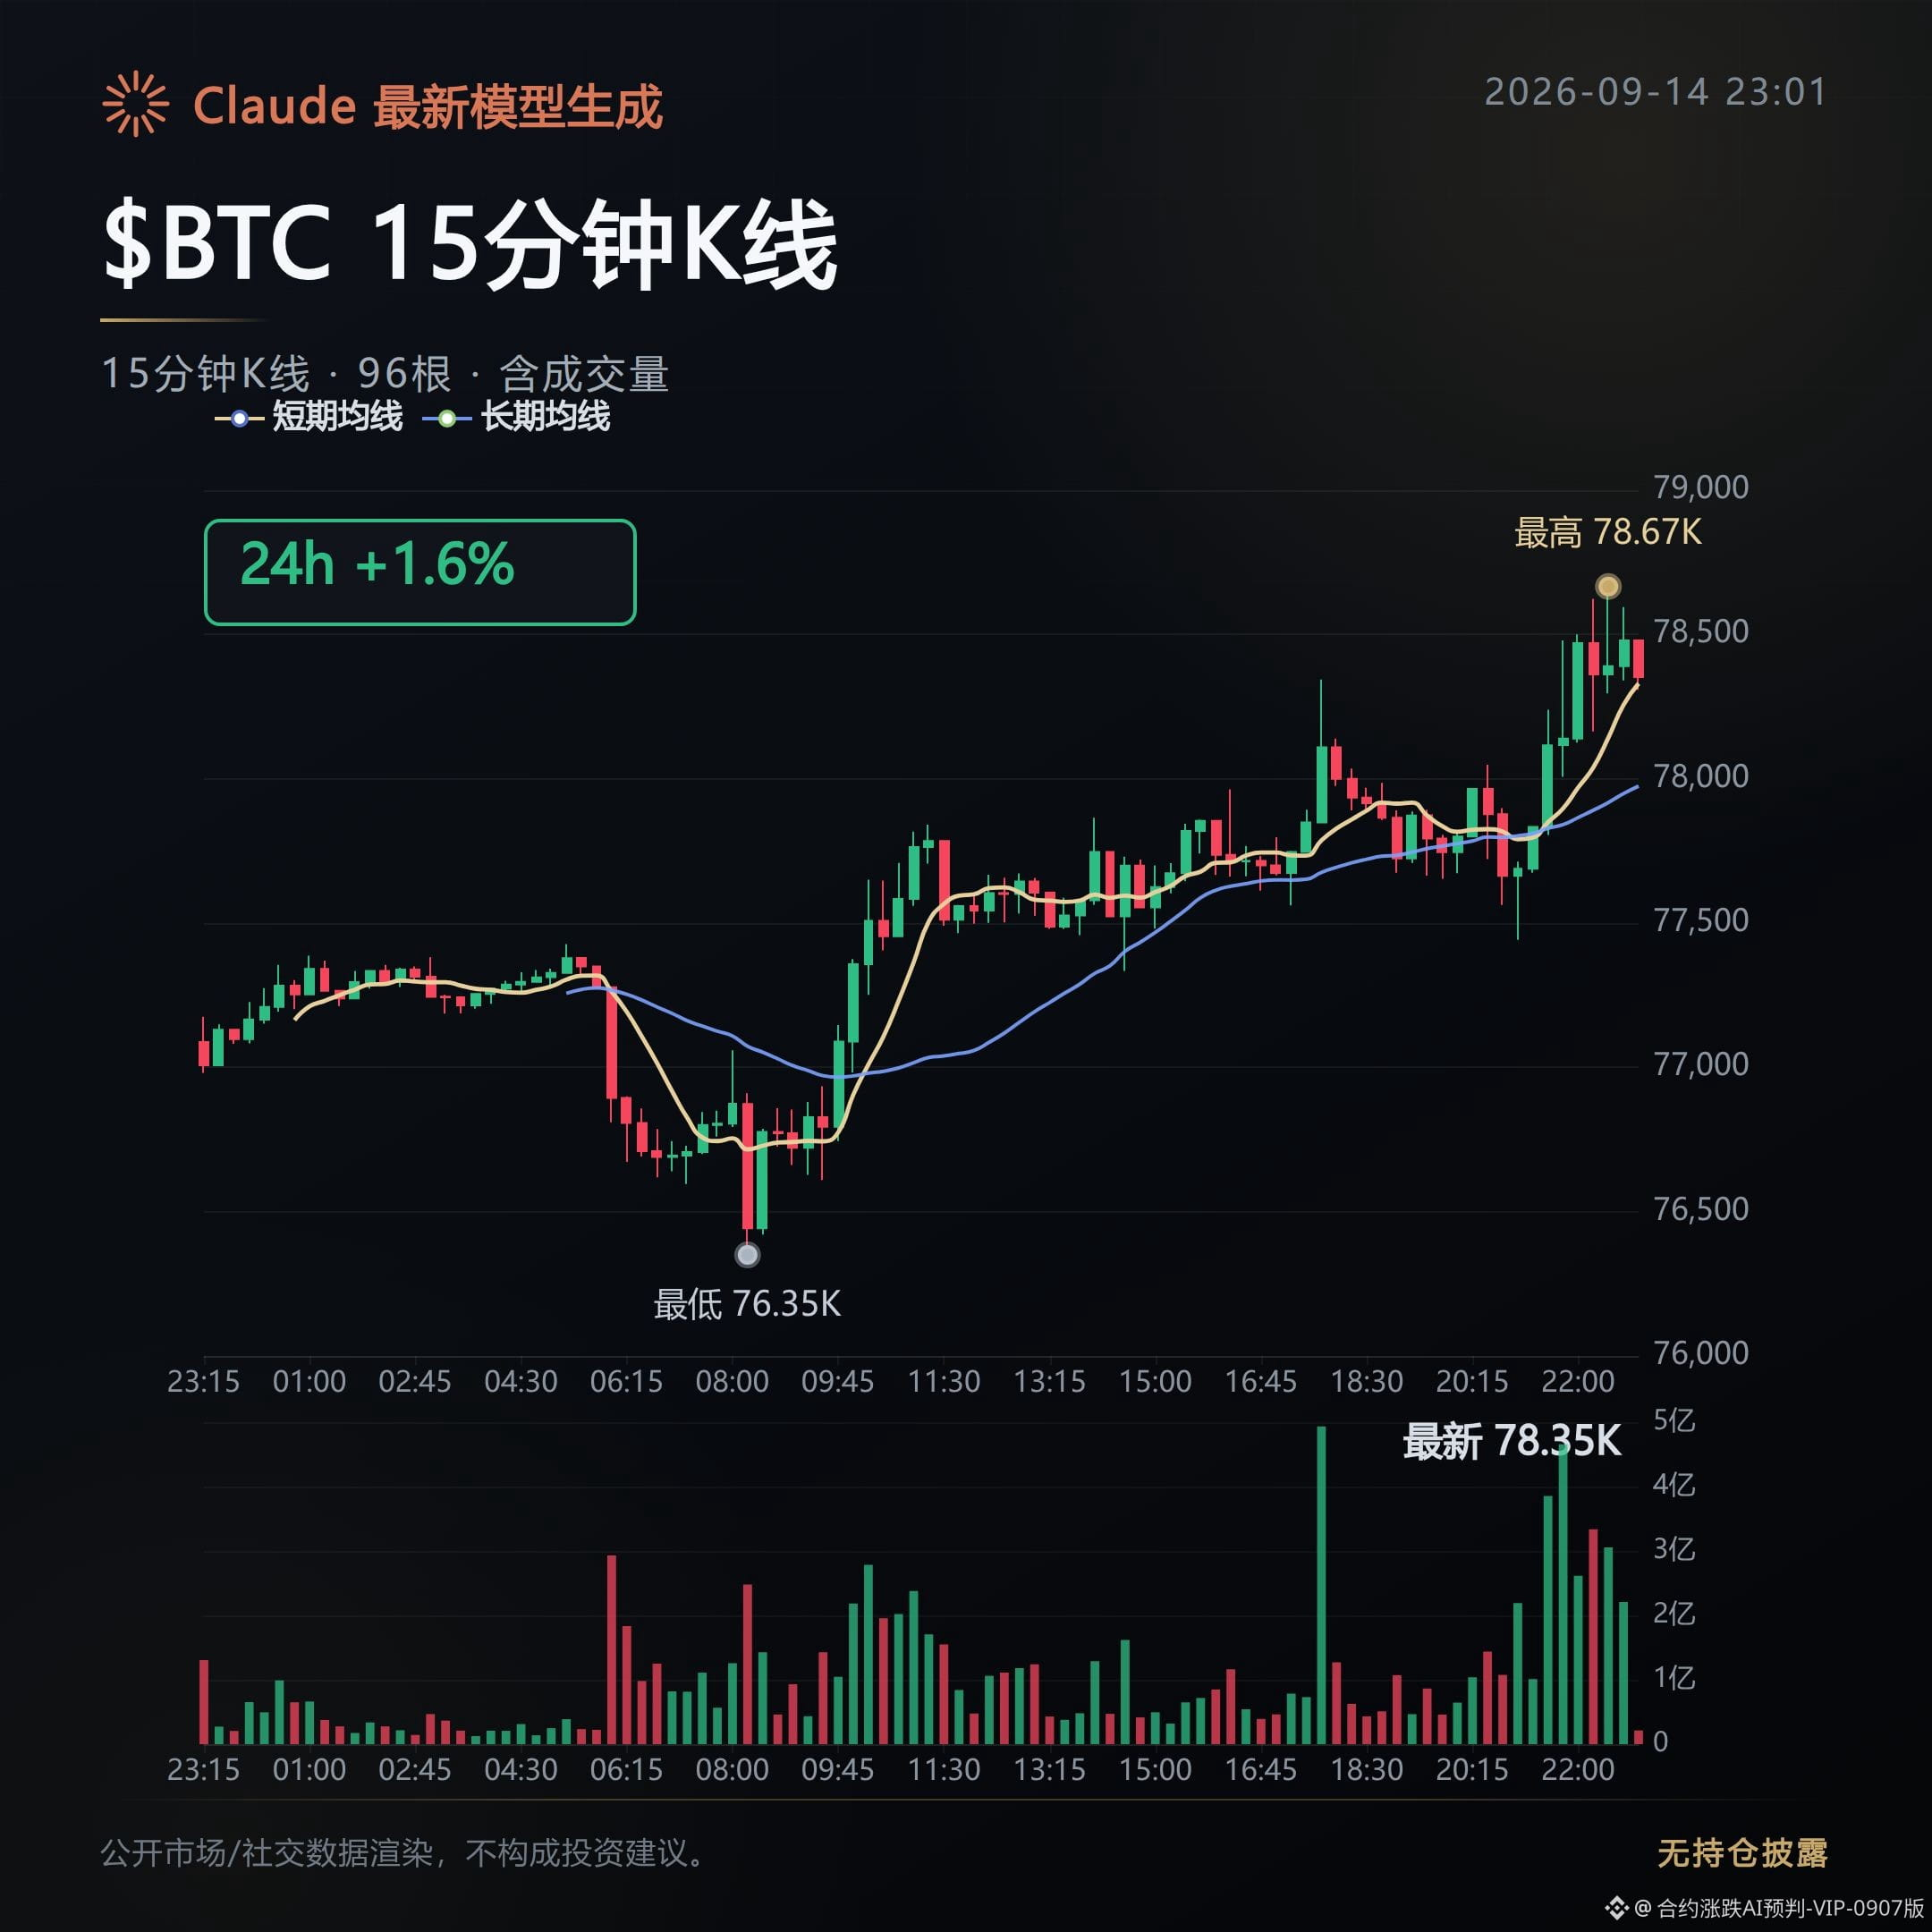
$BTC current price 78428, up 1.63% in 24 hours.
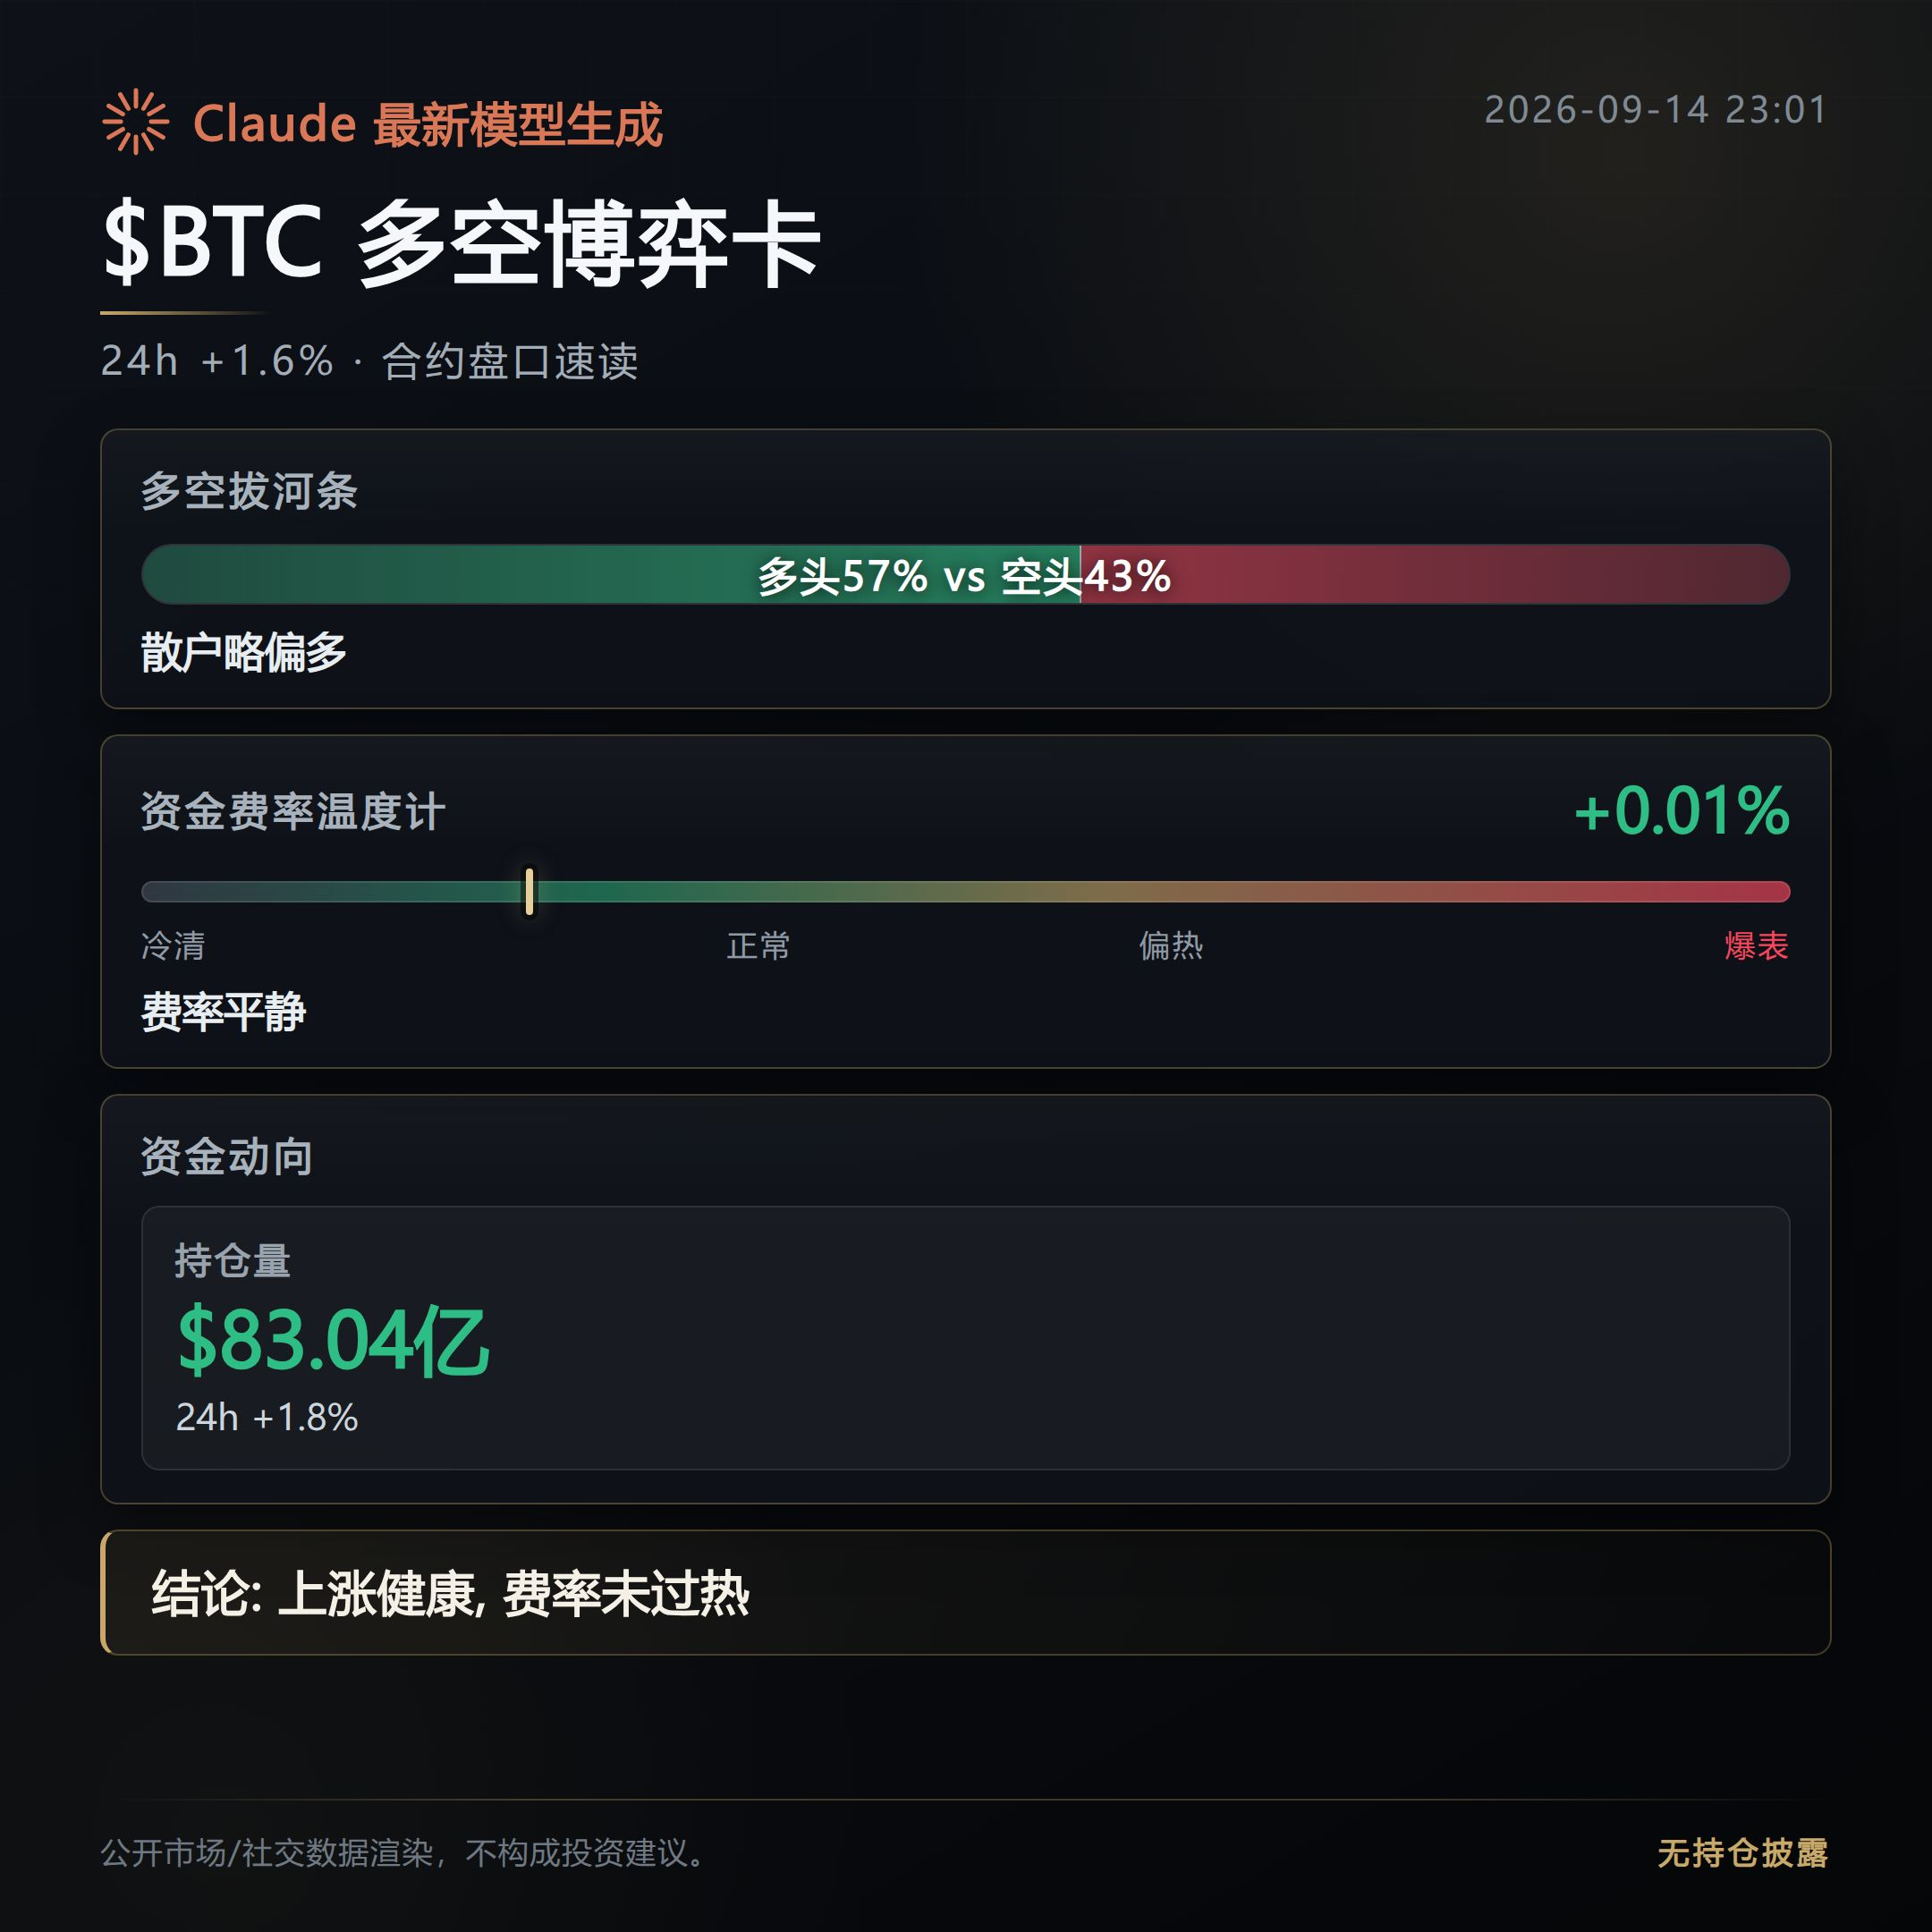
The funding rate is 0.0056%, which isn’t high, but open interest has surged to $8.304 billion—jumping 1.8% in a single day.
Long accounts make up 57%, with a slightly higher number of participants, but the long-vs-short order ratio is only 0.98. In actual executed trades, the sell side is more aggressive than the buy side, so the price rise is hard to sustain.
$ETH current price 2498.61, up 0.3%. Funding rate 0.0043%. It’s tracking higher, but it isn’t rushing.
There are institutions adding another 27,180 ETH in these past couple of days. An advisor has come out to say there may be a sudden move ahead, and positions are already set, but the direction hasn’t been made clear.
At the same time, some analysis points out that Binance may take an extra slice from trading revenue. Once this kind of platform-fee news comes out, the profits retail traders can earn will be discounted first.
Fear & Greed Index is 57. Sentiment has just stepped into the greed zone, but leverage has already run ahead.
The harshest funding rates for shorts are on CAP, CVC, and LSK—between -0.7% and -1.2%. Shorts are crowded on these coins; if there’s a rebound, they’re likely to get squeezed out.
On the long side, NATGAS, ESPORTS, and VRT funding rates have all turned positive, but the magnitude is still small—for now, it hasn’t reached the danger zone.
Next, watch these two things: whether the open-interest growth rate can keep up with the price—if it can’t, the move is “illusory.” Also, once the crowded shorts’ coins rebound, first see how they respond to the speed of the bounce.
$BTC $ETH #Contracts
Position details: This account holds $FOGO long contracts in live trading. Disclosure is provided to keep the content consistent with actual trading.
Contract data was assisted and organized by Claude Fable 5, for information reference only—please verify yourself.
Contract Order Book Daily | 9/14 Sentiment leans greedy; leverage increases in step
$BTC current price 78428, up 1.63% in 24 hours.
The funding rate is 0.0056%, which isn’t high, but open interest has surged to $8.304 billion—jumping 1.8% in a single day.
Long accounts make up 57%, with a slightly higher number of participants, but the long-vs-short order ratio is only 0.98. In actual executed trades, the sell side is more aggressive than the buy side, so the price rise is hard to sustain.
$ETH current price 2498.61, up 0.3%. Funding rate 0.0043%. It’s tracking higher, but it isn’t rushing.
There are institutions adding another 27,180 ETH in these past couple of days. An advisor has come out to say there may be a sudden move ahead, and positions are already set, but the direction hasn’t been made clear.
At the same time, some analysis points out that Binance may take an extra slice from trading revenue. Once this kind of platform-fee news comes out, the profits retail traders can earn will be discounted first.
Fear & Greed Index is 57. Sentiment has just stepped into the greed zone, but leverage has already run ahead.
The harshest funding rates for shorts are on CAP, CVC, and LSK—between -0.7% and -1.2%. Shorts are crowded on these coins; if there’s a rebound, they’re likely to get squeezed out.
On the long side, NATGAS, ESPORTS, and VRT funding rates have all turned positive, but the magnitude is still small—for now, it hasn’t reached the danger zone.
Next, watch these two things: whether the open-interest growth rate can keep up with the price—if it can’t, the move is “illusory.” Also, once the crowded shorts’ coins rebound, first see how they respond to the speed of the bounce.
$BTC $ETH #Contracts
Position details: This account holds $FOGO long contracts in live trading. Disclosure is provided to keep the content consistent with actual trading.
Contract data was assisted and organized by Claude Fable 5, for information reference only—please verify yourself.
$BTC current price 78428, up 1.63% in 24 hours.
The funding rate is 0.0056%, which isn’t high, but open interest has surged to $8.304 billion—jumping 1.8% in a single day.
Long accounts make up 57%, with a slightly higher number of participants, but the long-vs-short order ratio is only 0.98. In actual executed trades, the sell side is more aggressive than the buy side, so the price rise is hard to sustain.
$ETH current price 2498.61, up 0.3%. Funding rate 0.0043%. It’s tracking higher, but it isn’t rushing.
There are institutions adding another 27,180 ETH in these past couple of days. An advisor has come out to say there may be a sudden move ahead, and positions are already set, but the direction hasn’t been made clear.
At the same time, some analysis points out that Binance may take an extra slice from trading revenue. Once this kind of platform-fee news comes out, the profits retail traders can earn will be discounted first.
Fear & Greed Index is 57. Sentiment has just stepped into the greed zone, but leverage has already run ahead.
The harshest funding rates for shorts are on CAP, CVC, and LSK—between -0.7% and -1.2%. Shorts are crowded on these coins; if there’s a rebound, they’re likely to get squeezed out.
On the long side, NATGAS, ESPORTS, and VRT funding rates have all turned positive, but the magnitude is still small—for now, it hasn’t reached the danger zone.
Next, watch these two things: whether the open-interest growth rate can keep up with the price—if it can’t, the move is “illusory.” Also, once the crowded shorts’ coins rebound, first see how they respond to the speed of the bounce.
$BTC $ETH #Contracts
Position details: This account holds $FOGO long contracts in live trading. Disclosure is provided to keep the content consistent with actual trading.
Contract data was assisted and organized by Claude Fable 5, for information reference only—please verify yourself.
269
About 13 hours ago, we sent a set of high-position distribution alerts, taking a bearish direction.
The first observation was: the chips were dispersed.
After 13 hours, 1 out of every 3 weakened and realized gains, while 2 were still rebounding, but it had not yet turned into a unilateral downtrend.
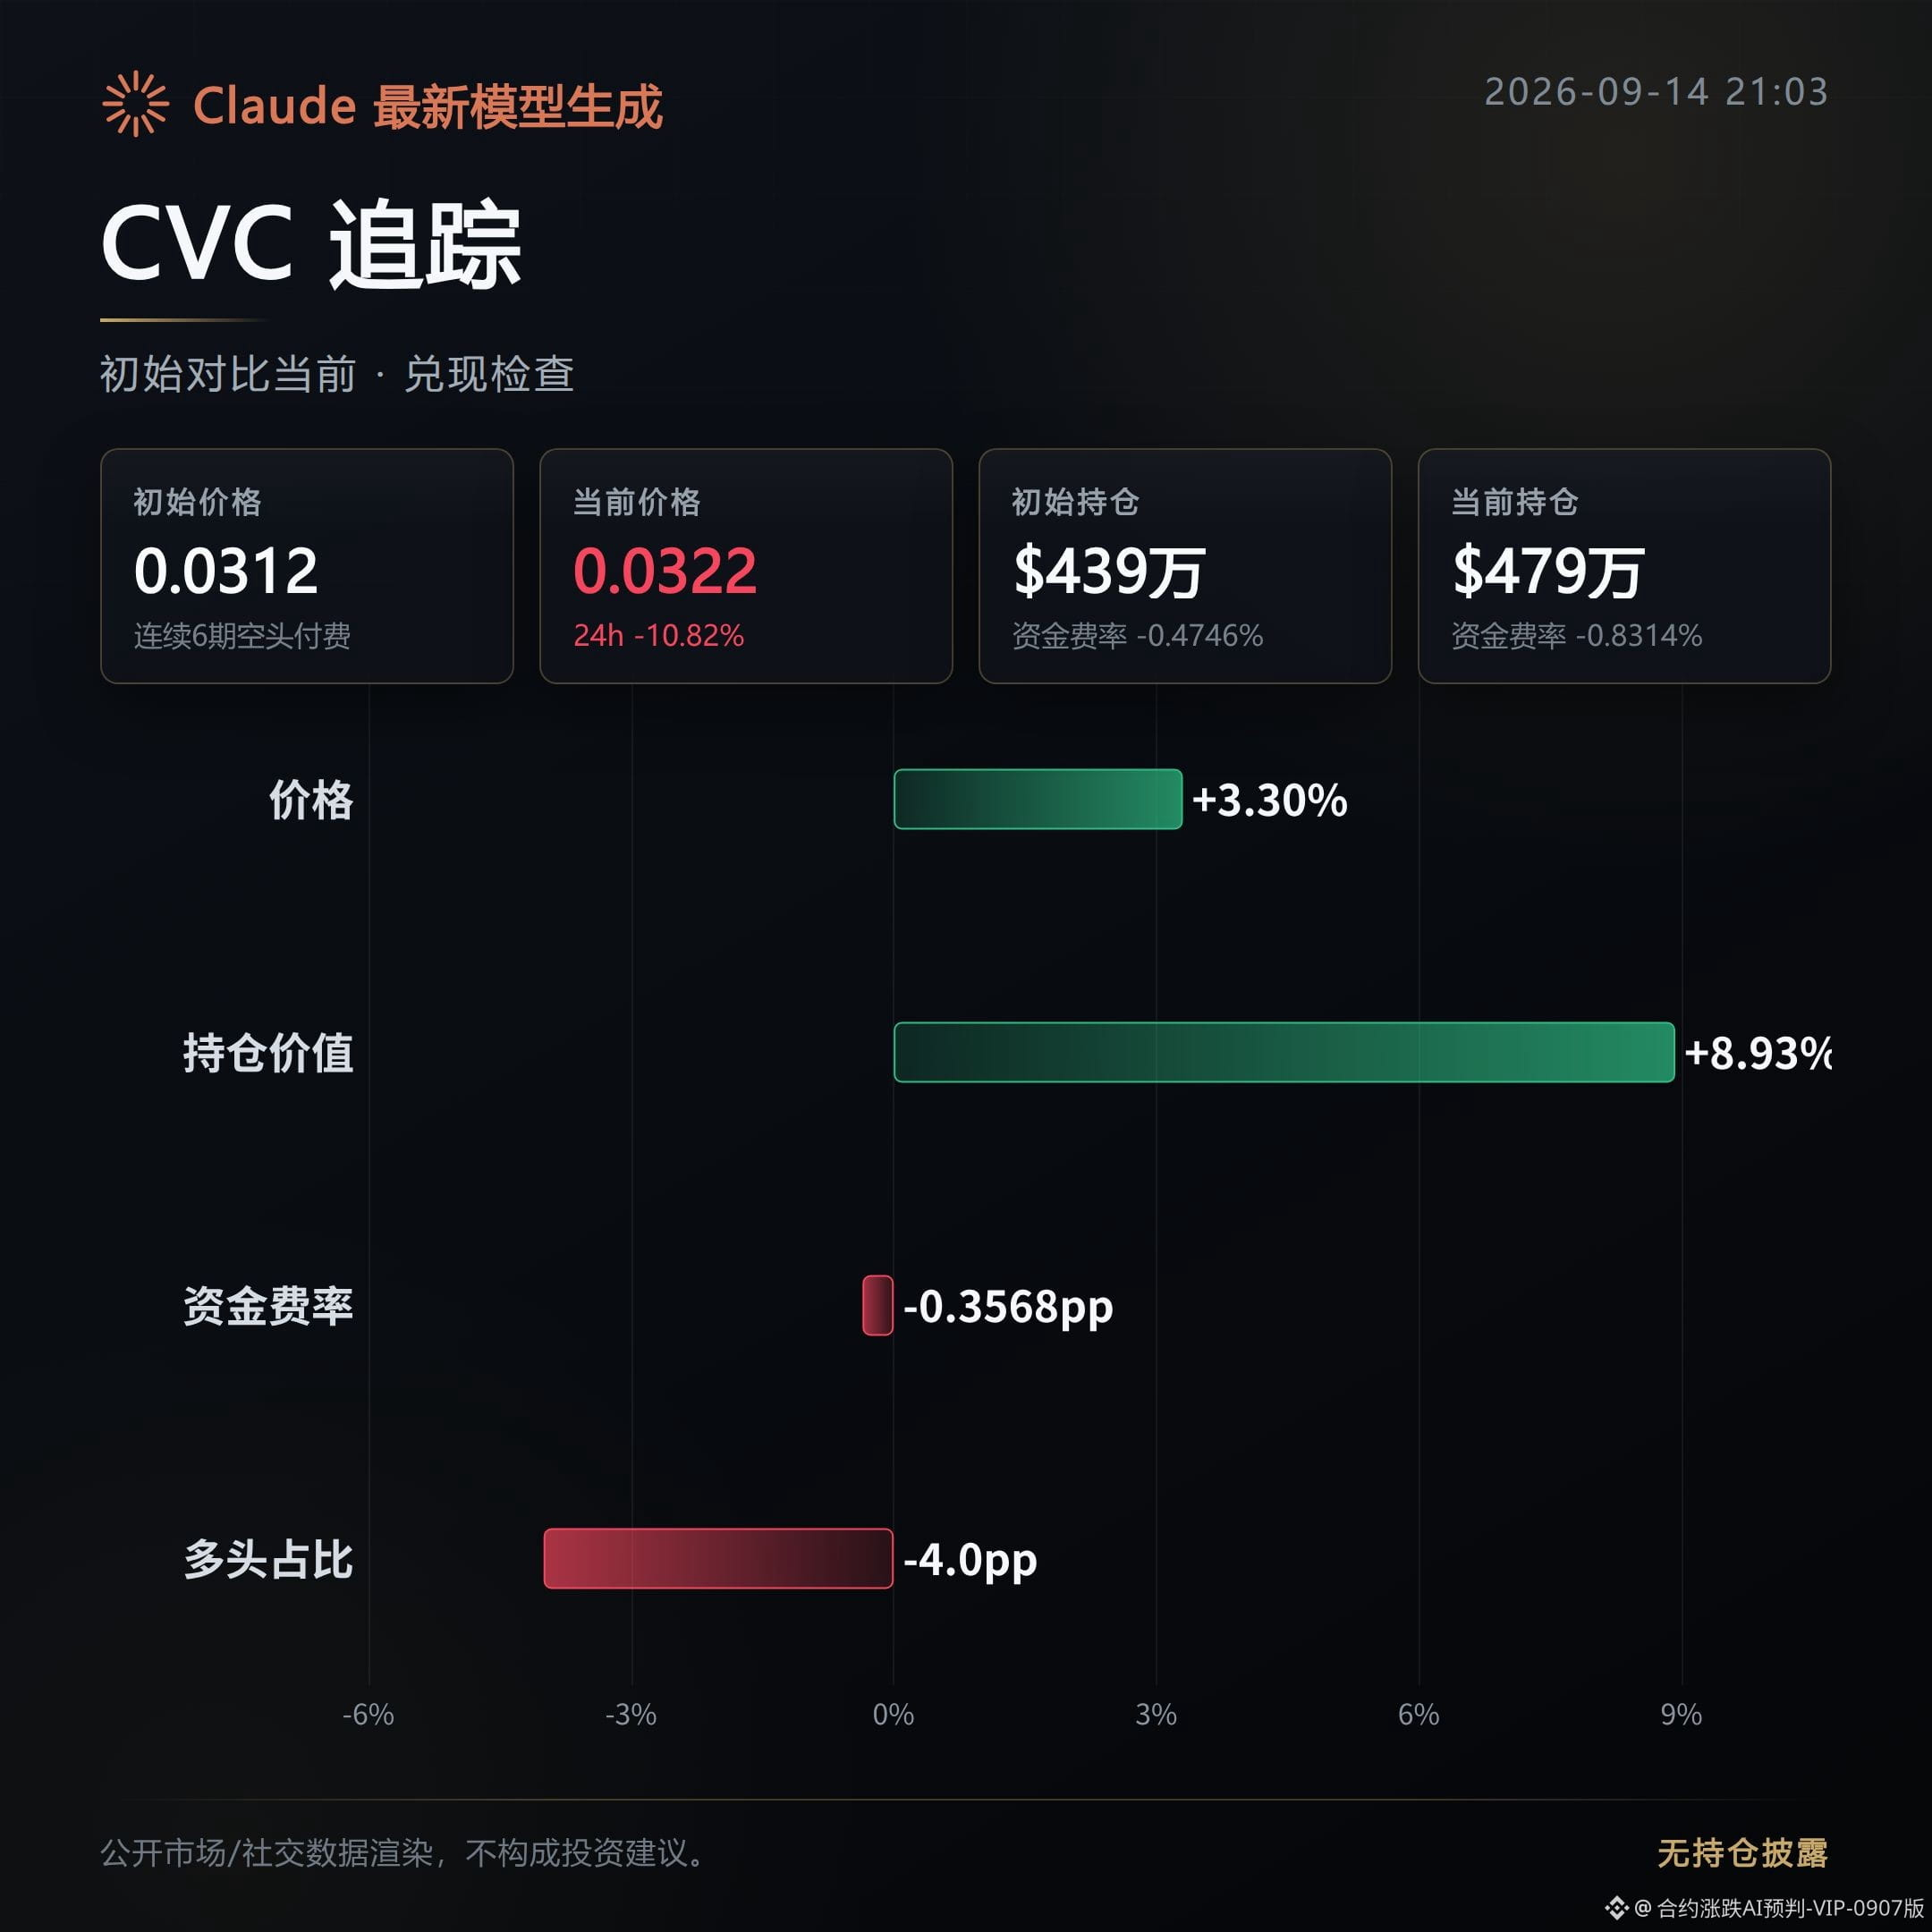
CVC: A rebound—early bearish signals did not get fulfilled.
After the initial release, price instead rose 3.3%, going in the opposite direction from the alert.
Open interest is still increasing by 8.93%, and the aggressive buy-side ratio remains around 97%. There’s no clear ebb, indicating selling pressure hasn’t truly taken control of the order book.
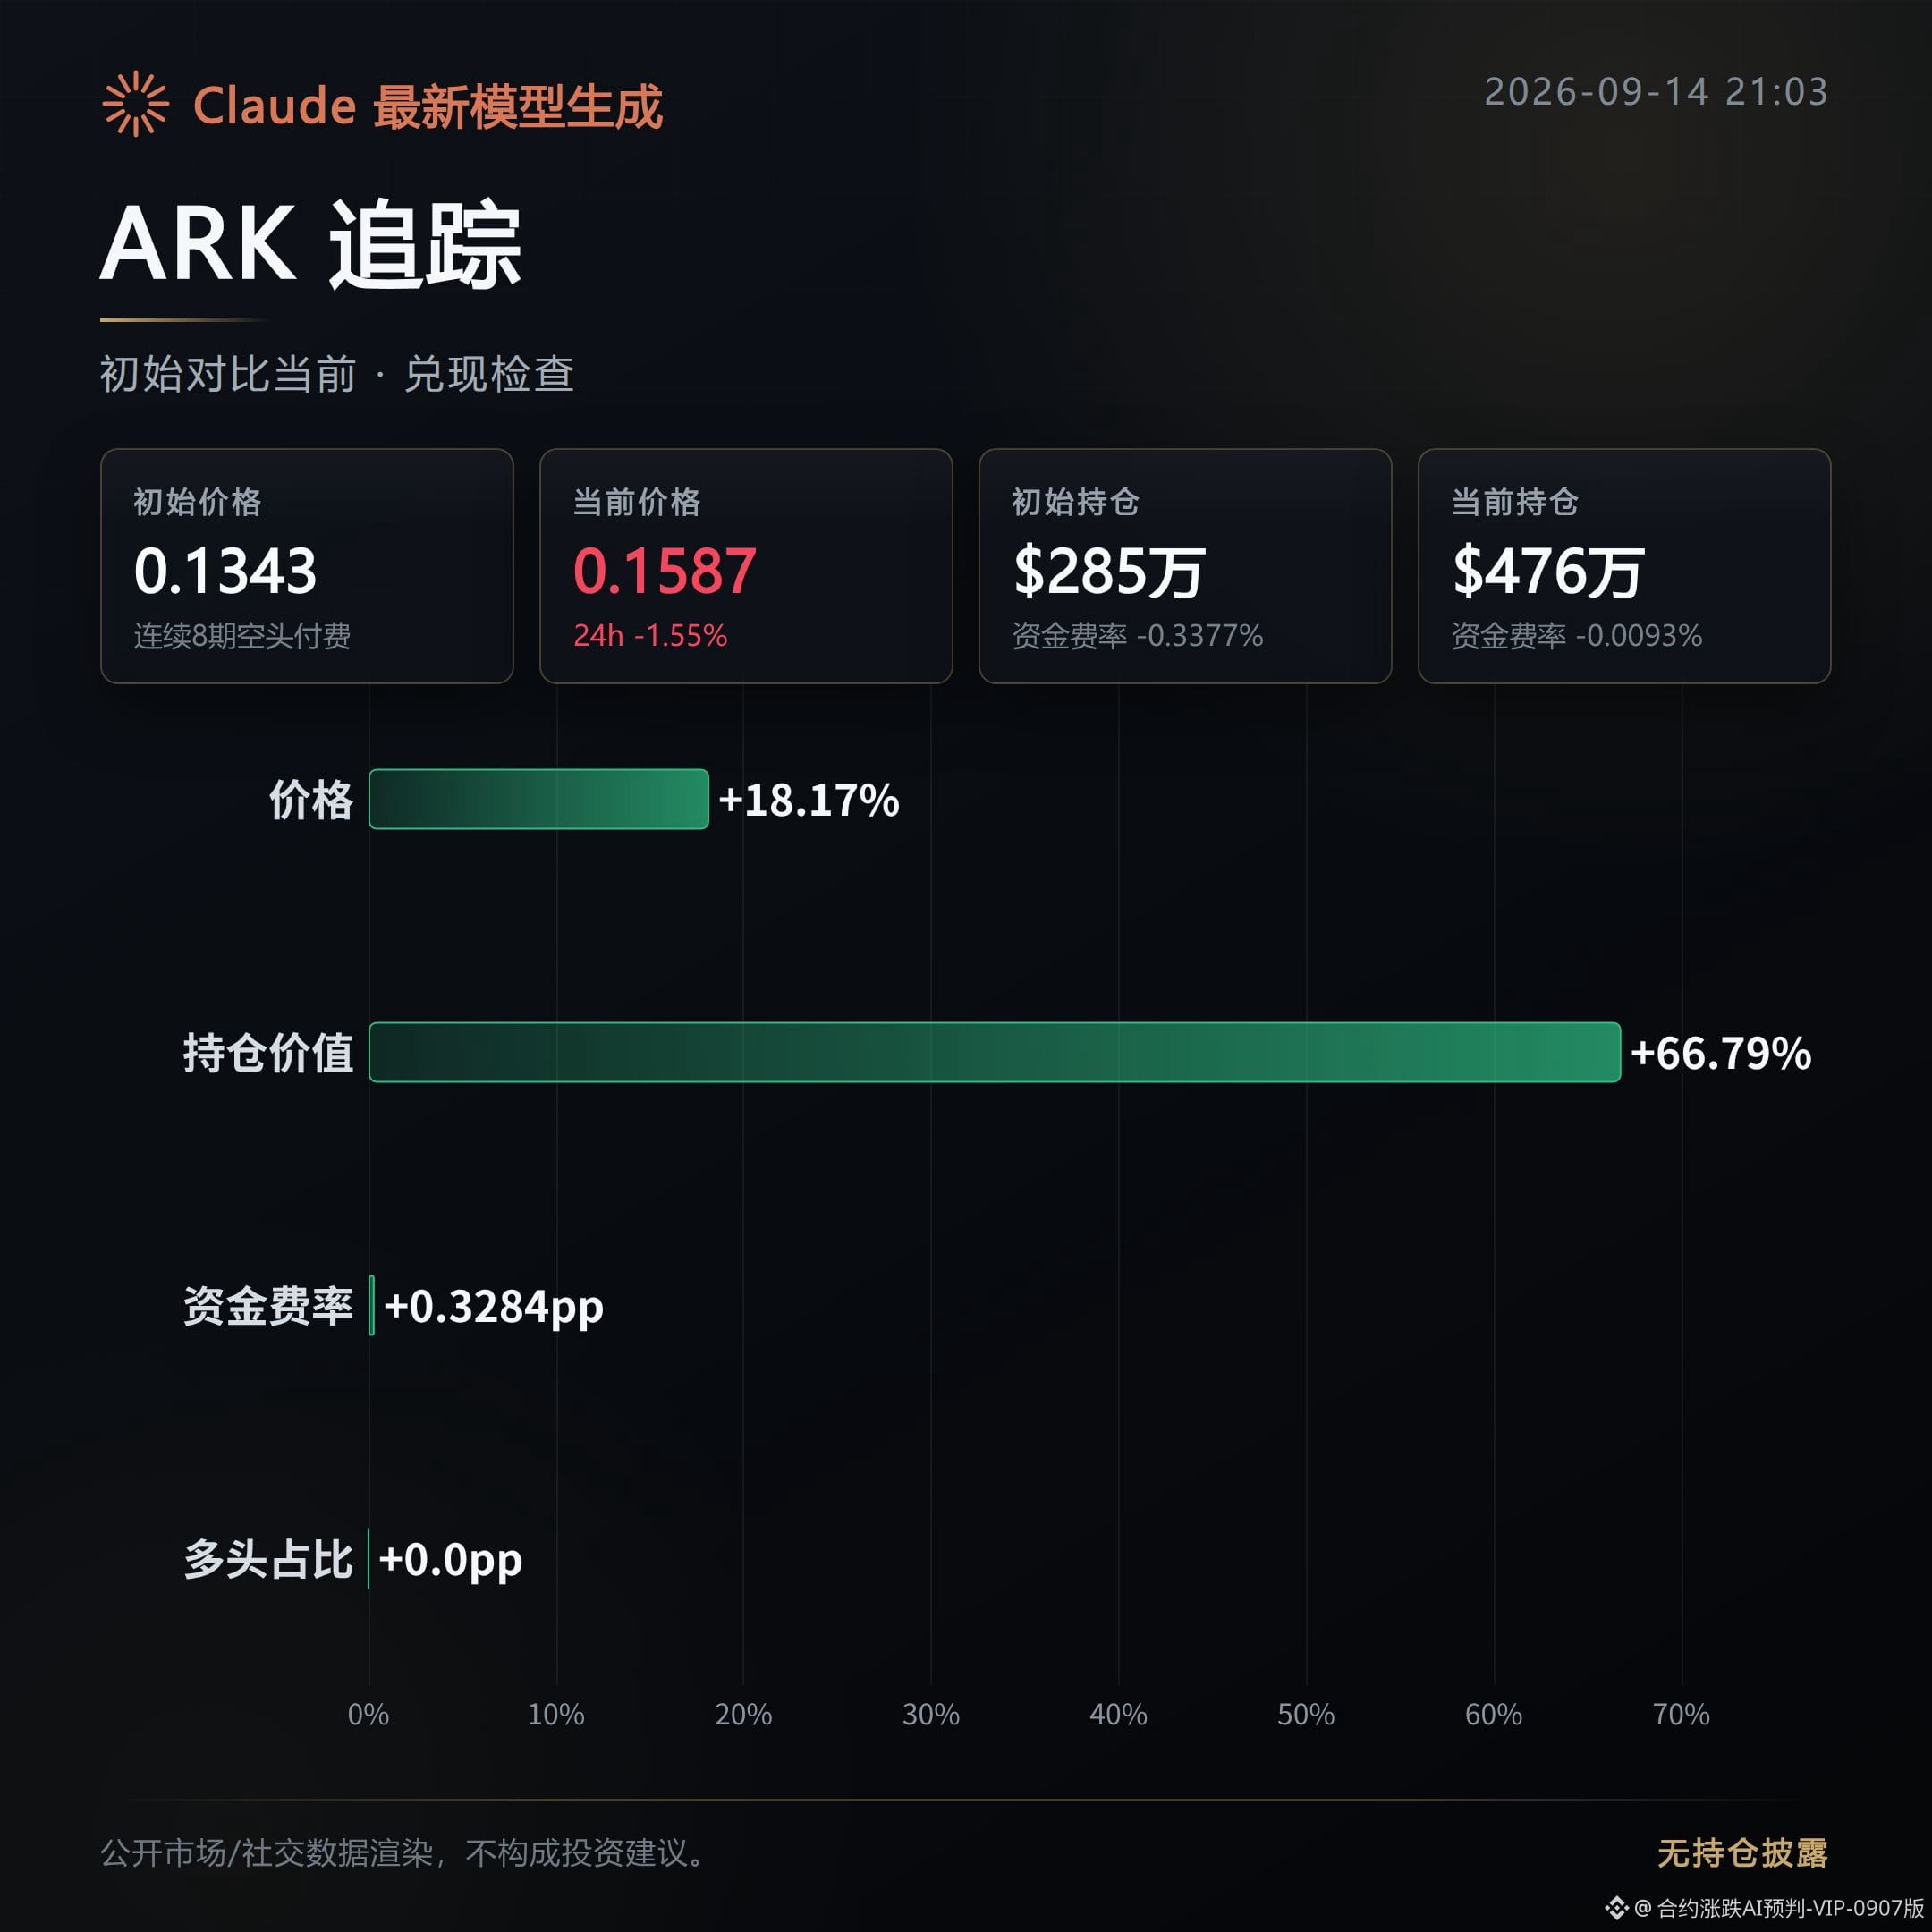
ARK: A rebound—the most obvious reversal in this set.
After the initial release, price rose 18.17%, fully going against the bearish call.
The aggressive buy-side ratio jumped from 66% to 92%, and open interest expanded in sync by 67%. The bulls are entering with real money; this time, the bearish judgment did not get confirmed.
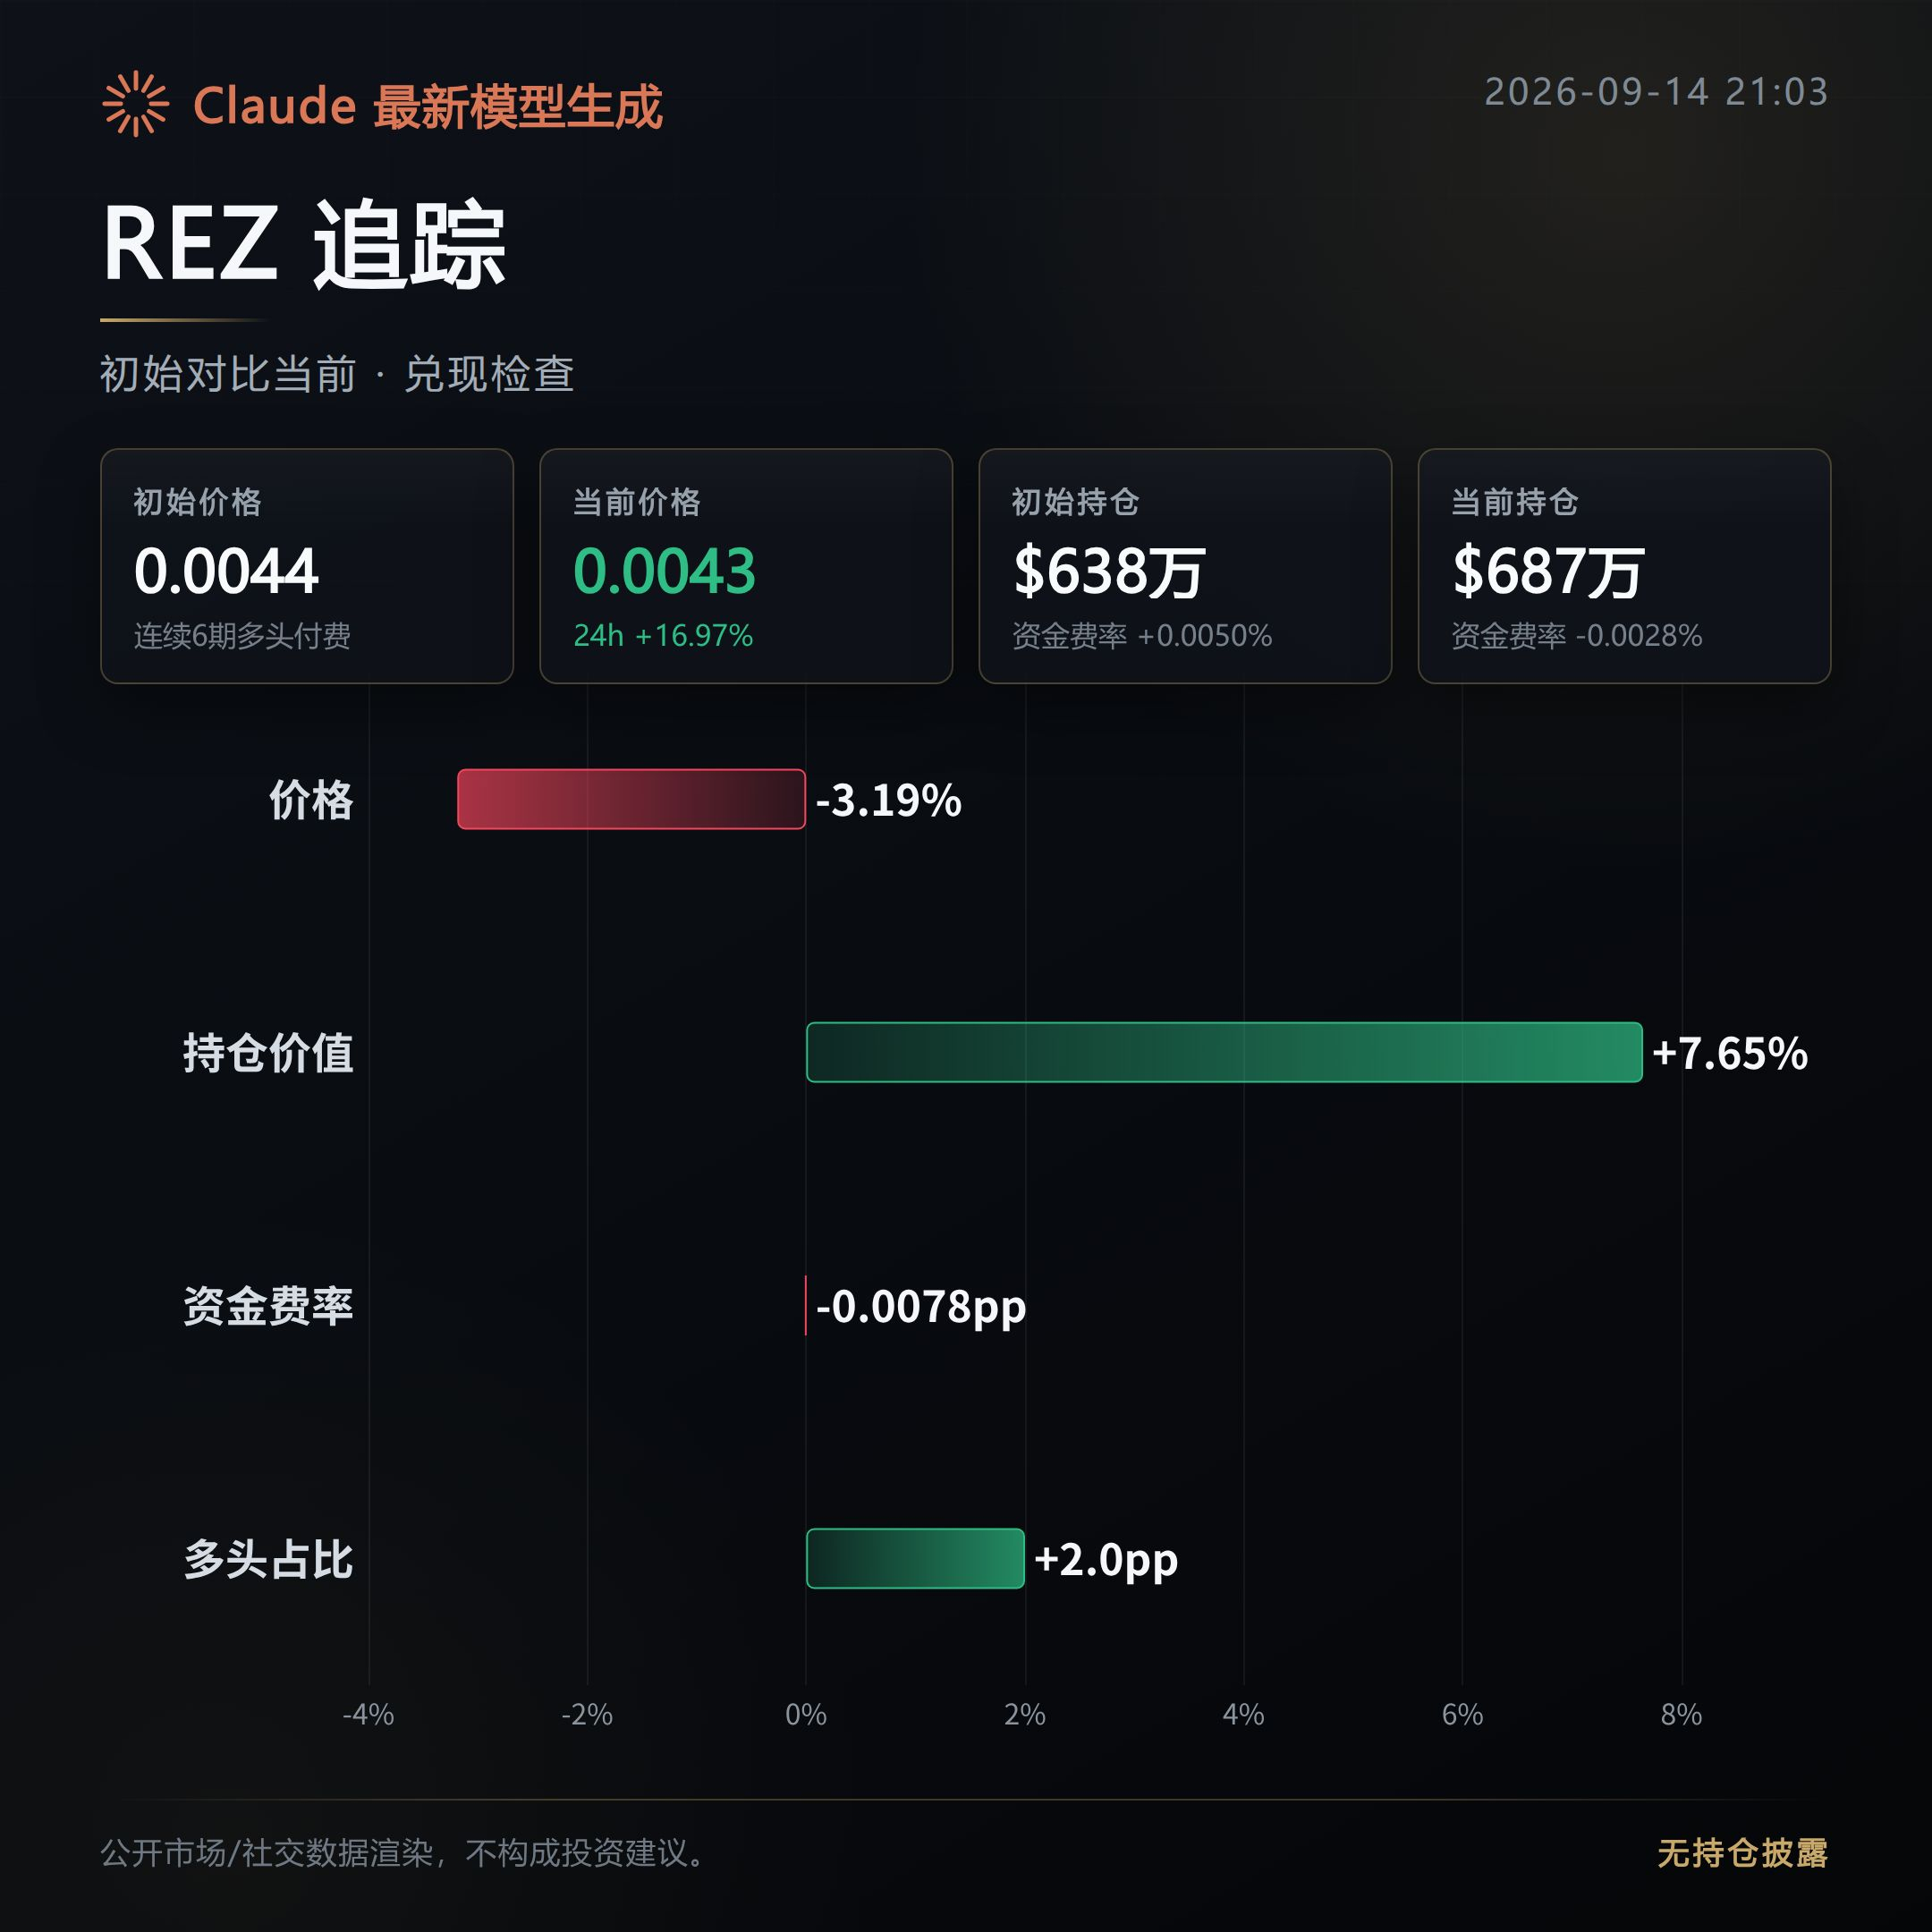
REZ: Fulfilled—one of the bearish moves from the morning did play out.
After the initial release, price continued to weaken by 3.19%, aligning with the alert.
Open interest is still edging up by 7.65%, suggesting that the decline came with new shorts adding positions, not merely an exodus of selling. This “chips are dispersed” observation currently holds.
Next, focus on three signals: whether CVC’s aggressive buying really cools off, whether ARK’s upward momentum will start to fade, and whether REZ’s open interest can continue to follow price into weakness.
Whichever signal changes, this bearish line must be re-evaluated; only if all three remain as they are now can this high-position distribution alert be considered to have fully played out.
#CVC #ARK #REZ #Contract recap
Live record: This account currently holds $FOGO long positions. As long as the logic remains unchanged, we will continue to hold.
This content was assisted and generated with Claude Fable 5 for informational reference only—please verify independently.
About 13 hours ago, we sent a set of high-position distribution alerts, taking a bearish direction.
The first observation was: the chips were dispersed.
After 13 hours, 1 out of every 3 weakened and realized gains, while 2 were still rebounding, but it had not yet turned into a unilateral downtrend.
CVC: A rebound—early bearish signals did not get fulfilled.
After the initial release, price instead rose 3.3%, going in the opposite direction from the alert.
Open interest is still increasing by 8.93%, and the aggressive buy-side ratio remains around 97%. There’s no clear ebb, indicating selling pressure hasn’t truly taken control of the order book.
ARK: A rebound—the most obvious reversal in this set.
After the initial release, price rose 18.17%, fully going against the bearish call.
The aggressive buy-side ratio jumped from 66% to 92%, and open interest expanded in sync by 67%. The bulls are entering with real money; this time, the bearish judgment did not get confirmed.
REZ: Fulfilled—one of the bearish moves from the morning did play out.
After the initial release, price continued to weaken by 3.19%, aligning with the alert.
Open interest is still edging up by 7.65%, suggesting that the decline came with new shorts adding positions, not merely an exodus of selling. This “chips are dispersed” observation currently holds.
Next, focus on three signals: whether CVC’s aggressive buying really cools off, whether ARK’s upward momentum will start to fade, and whether REZ’s open interest can continue to follow price into weakness.
Whichever signal changes, this bearish line must be re-evaluated; only if all three remain as they are now can this high-position distribution alert be considered to have fully played out.
#CVC #ARK #REZ #Contract recap
Live record: This account currently holds $FOGO long positions. As long as the logic remains unchanged, we will continue to hold.
This content was assisted and generated with Claude Fable 5 for informational reference only—please verify independently.
The first observation was: the chips were dispersed.
After 13 hours, 1 out of every 3 weakened and realized gains, while 2 were still rebounding, but it had not yet turned into a unilateral downtrend.
CVC: A rebound—early bearish signals did not get fulfilled.
After the initial release, price instead rose 3.3%, going in the opposite direction from the alert.
Open interest is still increasing by 8.93%, and the aggressive buy-side ratio remains around 97%. There’s no clear ebb, indicating selling pressure hasn’t truly taken control of the order book.
ARK: A rebound—the most obvious reversal in this set.
After the initial release, price rose 18.17%, fully going against the bearish call.
The aggressive buy-side ratio jumped from 66% to 92%, and open interest expanded in sync by 67%. The bulls are entering with real money; this time, the bearish judgment did not get confirmed.
REZ: Fulfilled—one of the bearish moves from the morning did play out.
After the initial release, price continued to weaken by 3.19%, aligning with the alert.
Open interest is still edging up by 7.65%, suggesting that the decline came with new shorts adding positions, not merely an exodus of selling. This “chips are dispersed” observation currently holds.
Next, focus on three signals: whether CVC’s aggressive buying really cools off, whether ARK’s upward momentum will start to fade, and whether REZ’s open interest can continue to follow price into weakness.
Whichever signal changes, this bearish line must be re-evaluated; only if all three remain as they are now can this high-position distribution alert be considered to have fully played out.
#CVC #ARK #REZ #Contract recap
Live record: This account currently holds $FOGO long positions. As long as the logic remains unchanged, we will continue to hold.
This content was assisted and generated with Claude Fable 5 for informational reference only—please verify independently.
314
A set of bullish observations from about 12 hours ago—now let’s reconcile.
Among the three coins: 0 have been cashed out, 2 have stalled (gone cold), 1 is still getting tangled/whipsawing. The bullish line the market was targeting in the morning has not been able to hold.
Review of the initial observations: the positioning/participation (chips/volume) is coming in tightly (accumulating then compressing).
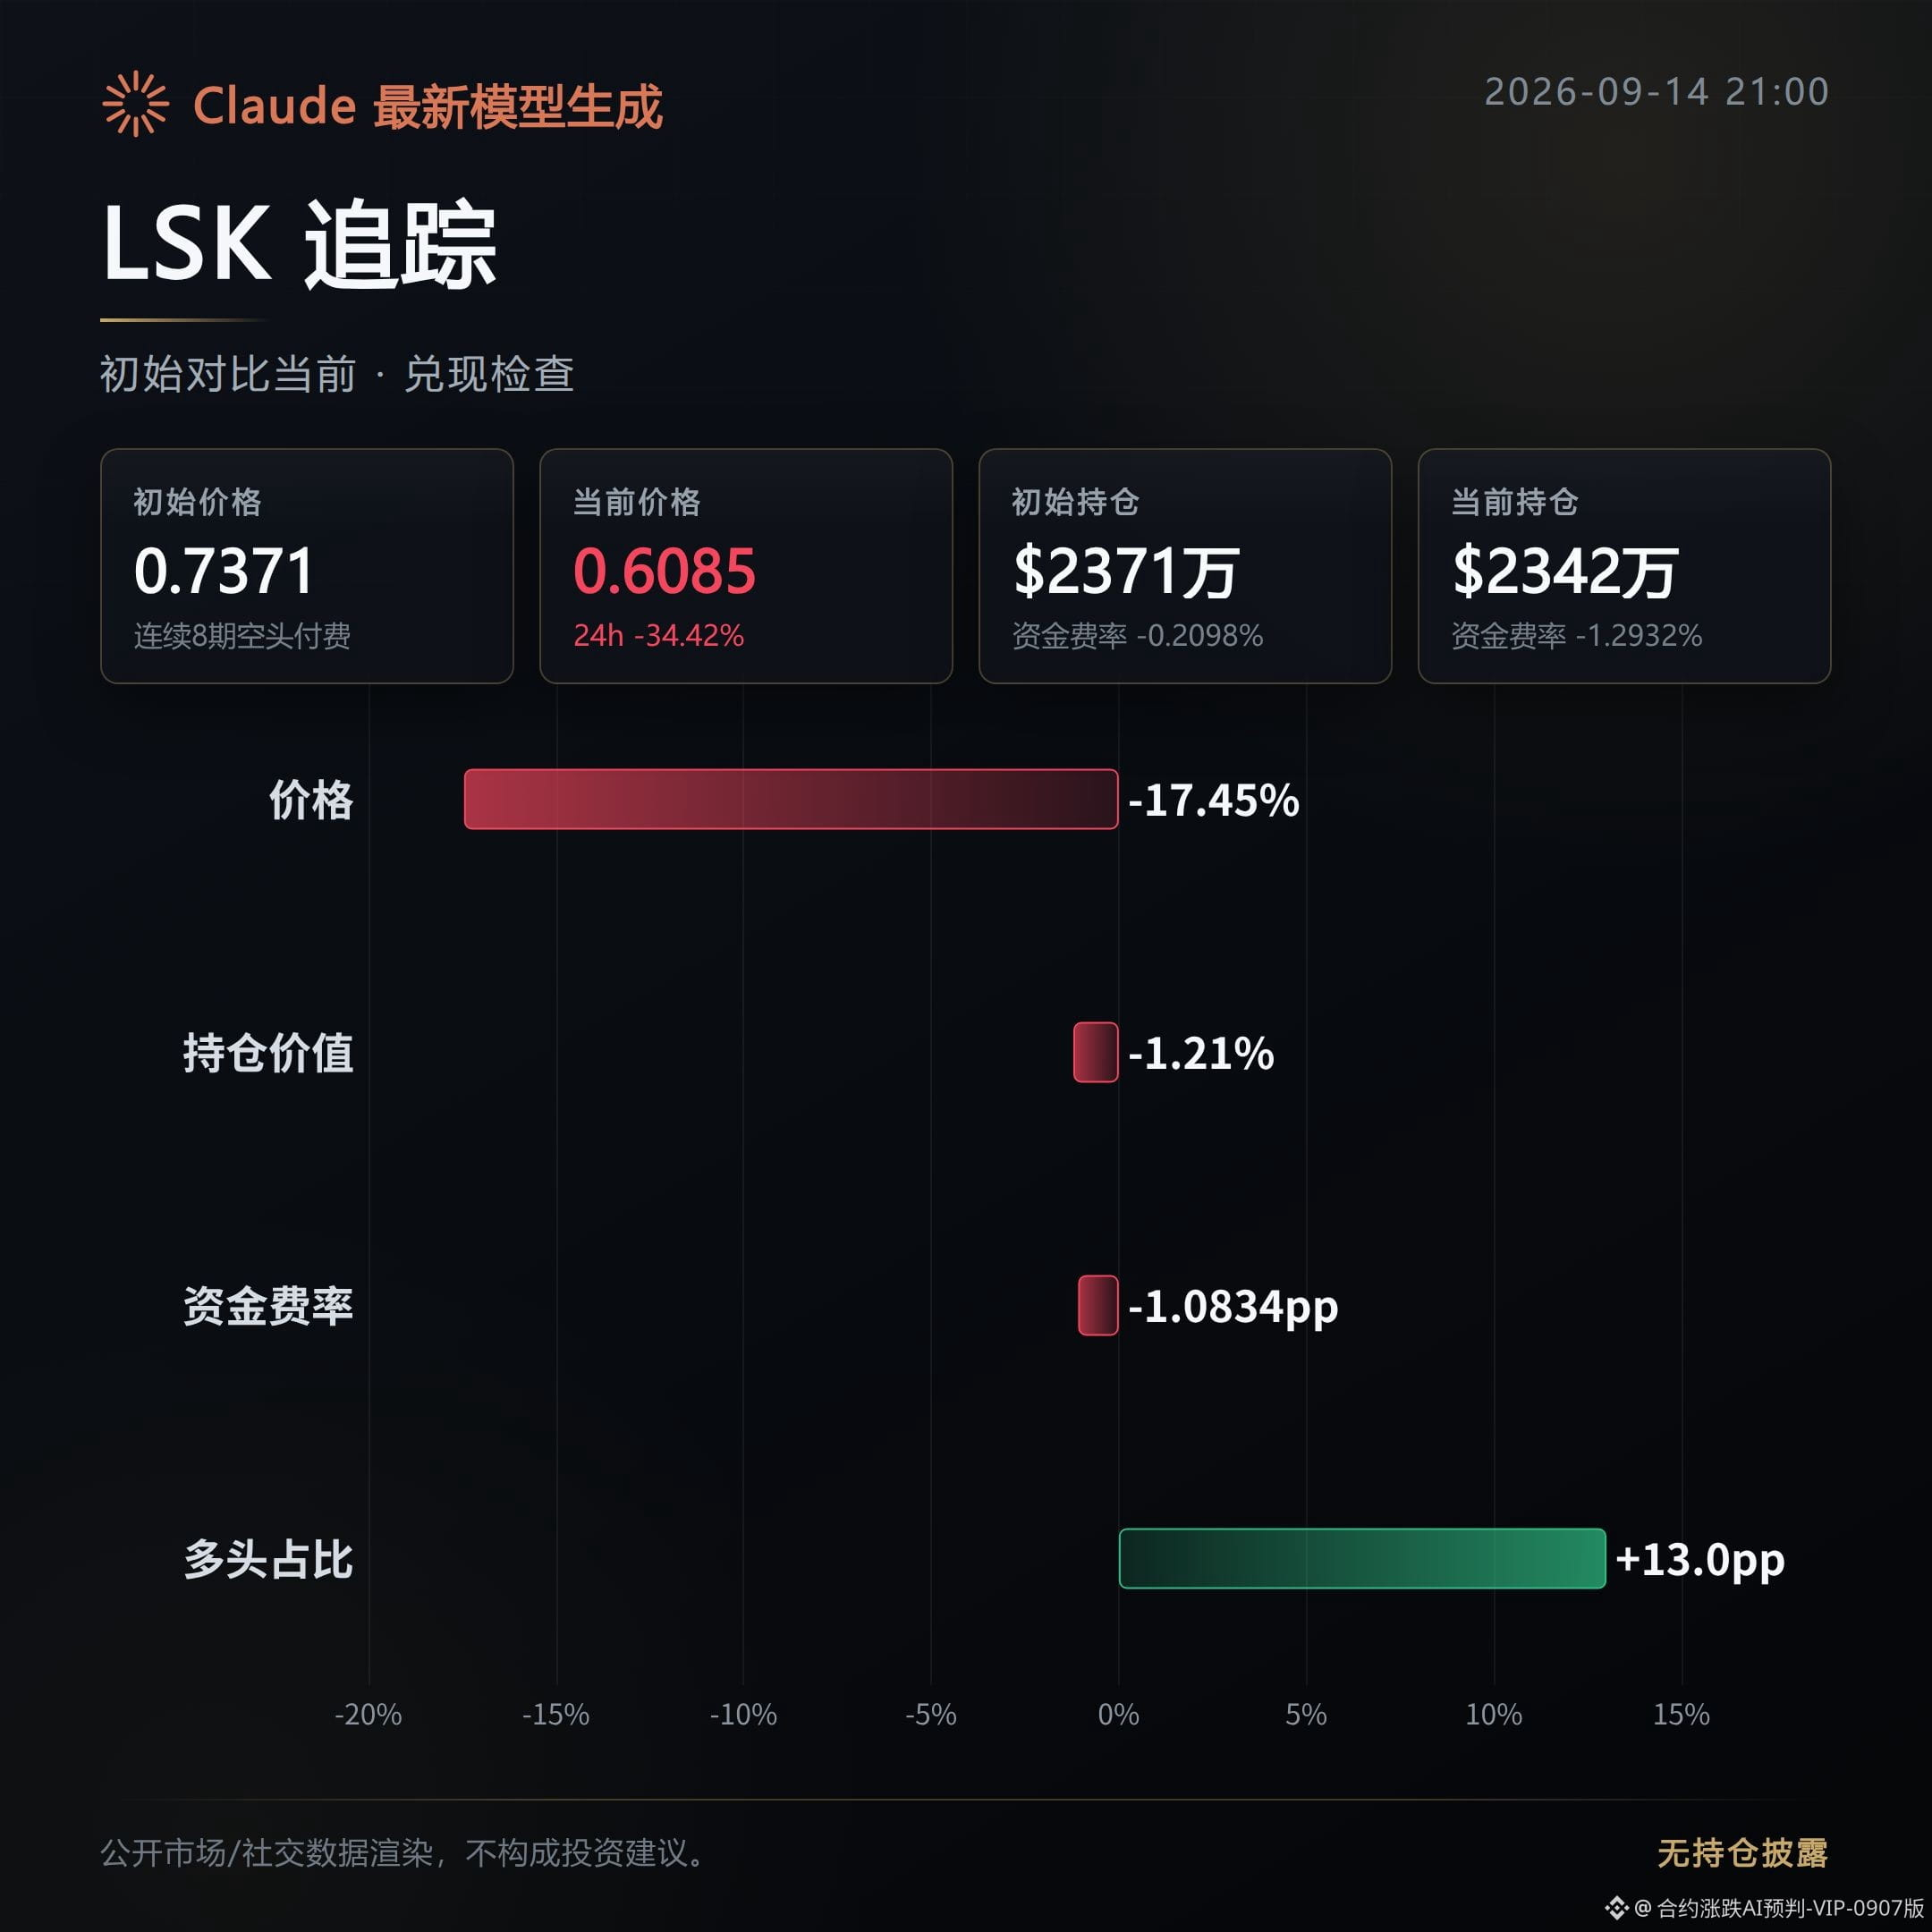
LSK: stalled. The bullish move in the morning didn’t break out. After the initial launch, the price fell 17.45%, and the direction has already turned opposite to the bullish thesis. The funding rate slid from -0.21% to -1.29%, compounded by成交量 (trading volume) shrinking by nearly 48%. Intraday enthusiasm clearly pulled back.
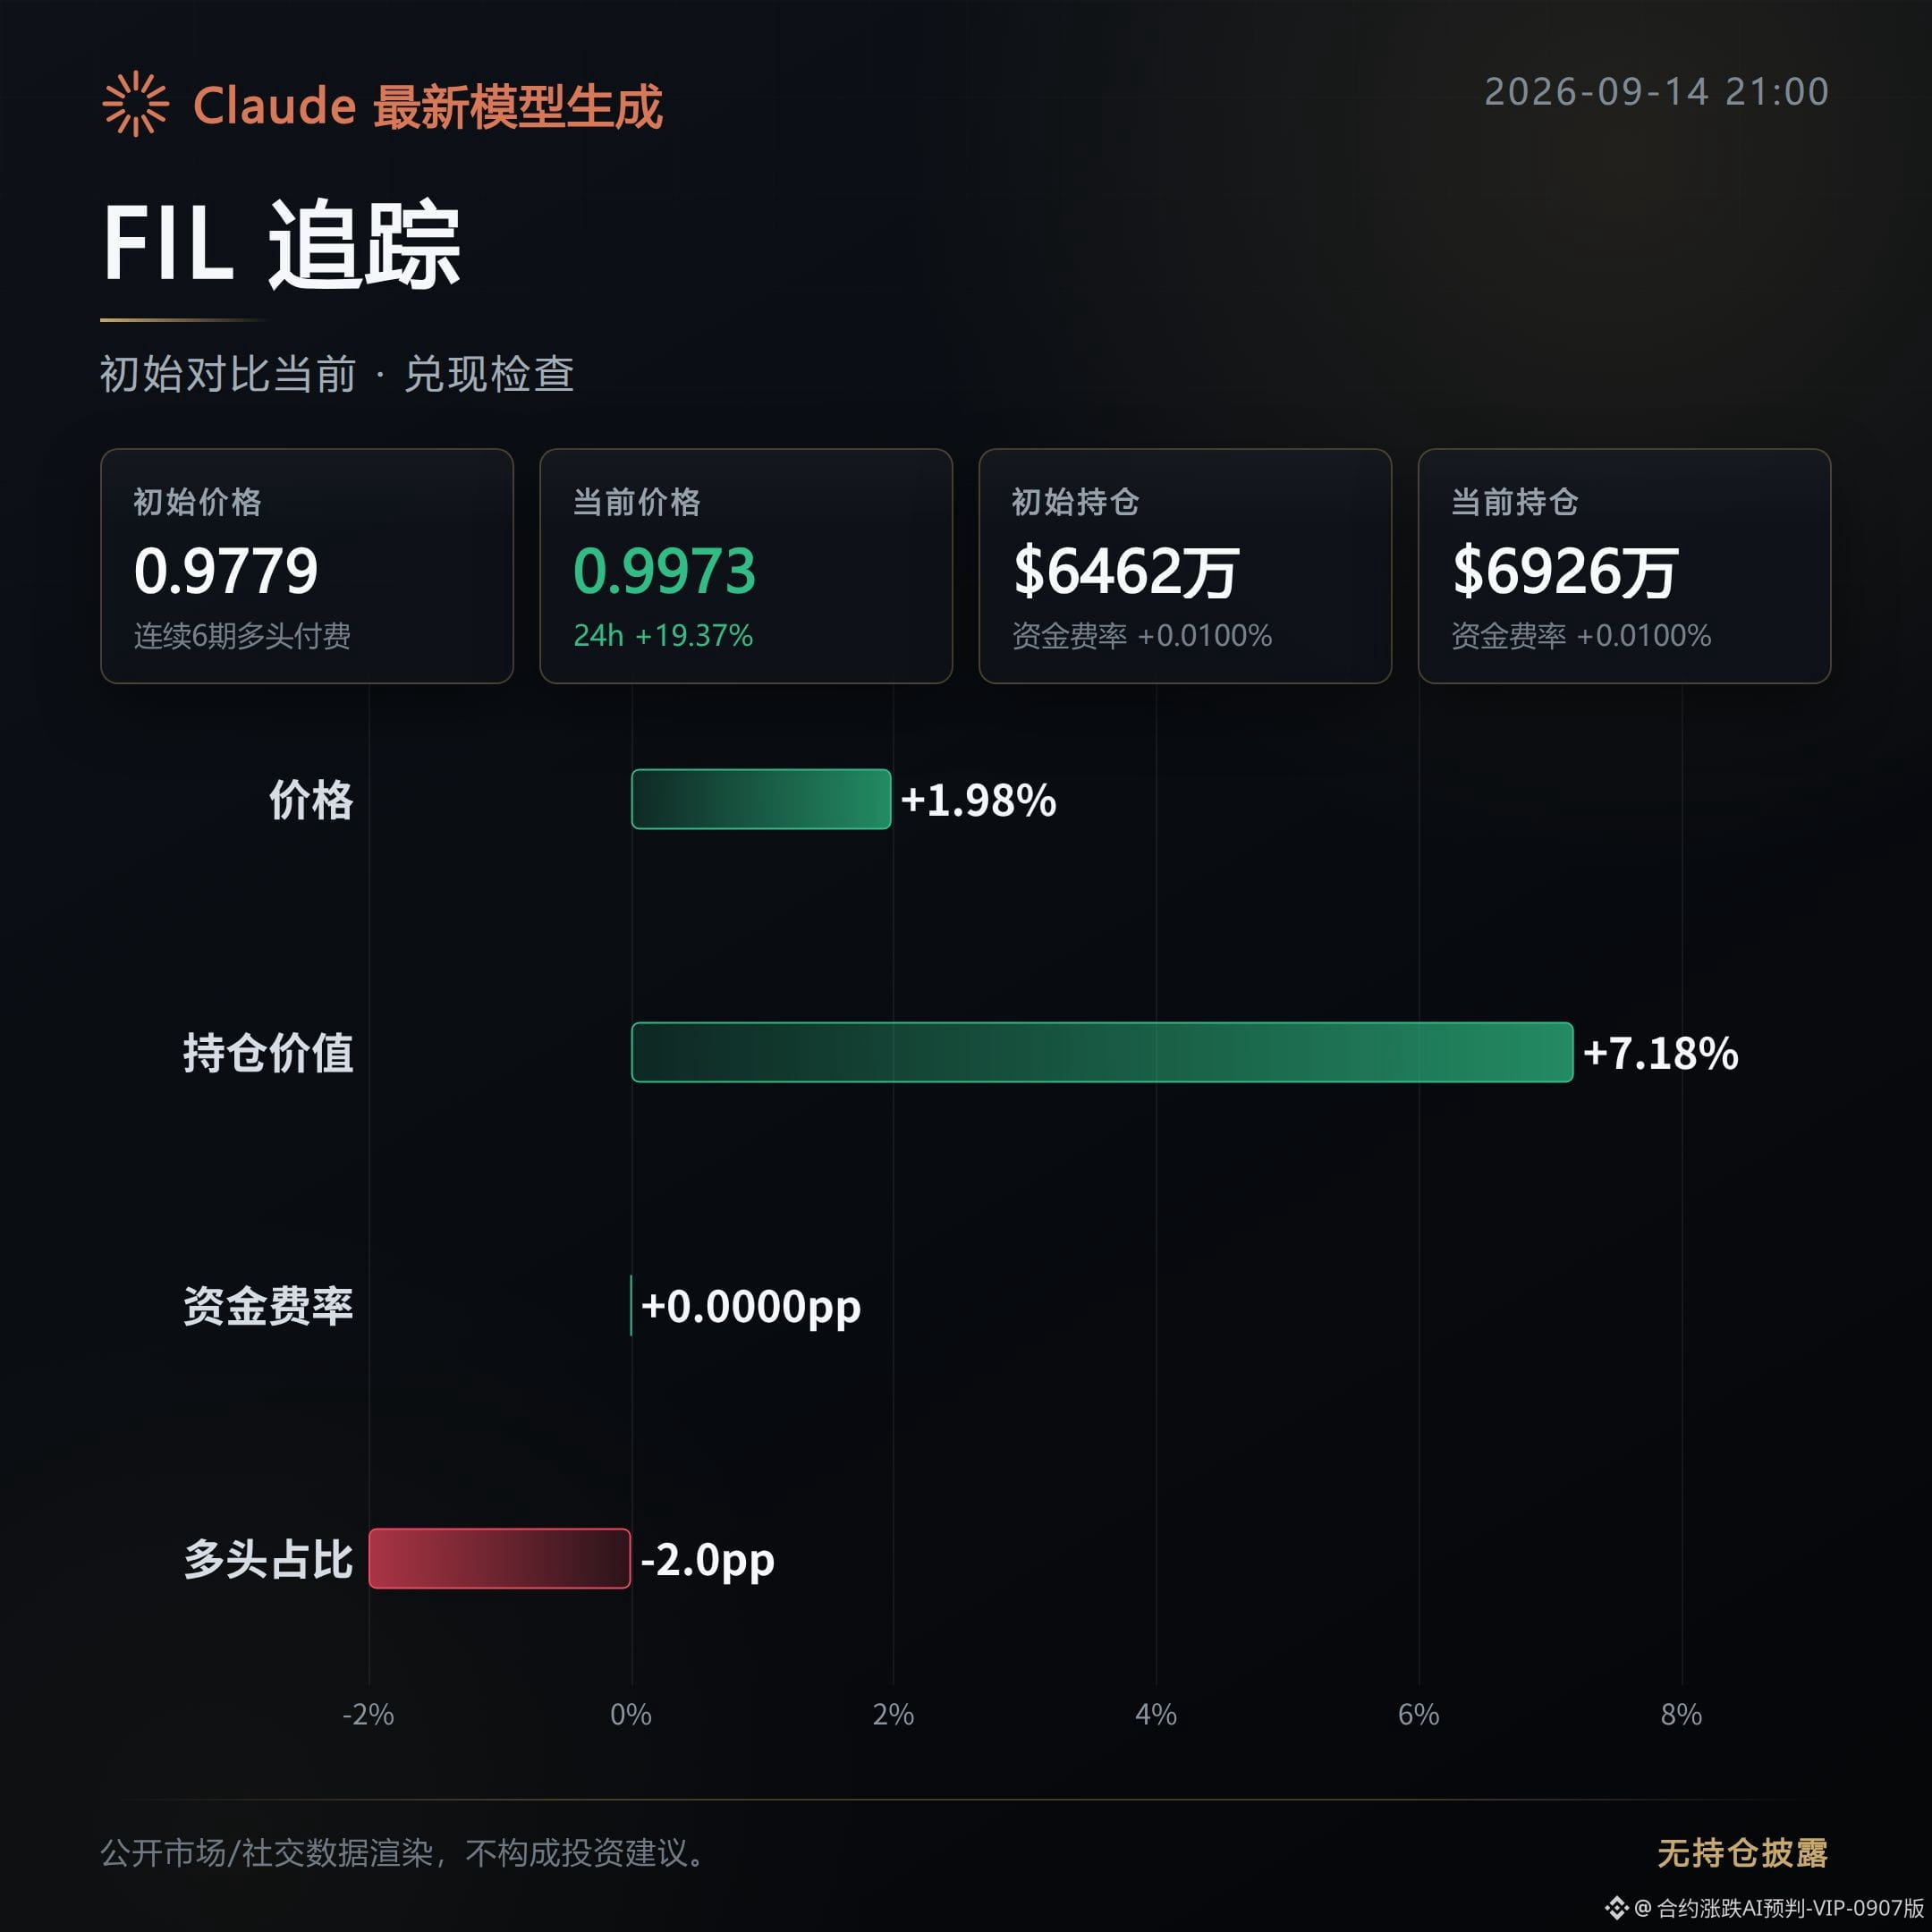
FIL: tangled. The price and funding structure have not formed a one-way confirmation. The price is up slightly by 1.98%, still hovering near the initial launch area, and the move hasn’t extended further. Open interest increased against the trend by 7.18%, but the strength of active buy orders dropped from 1.18 to 0.92—there’s inventory being built in the market, but buyers aren’t chasing it.
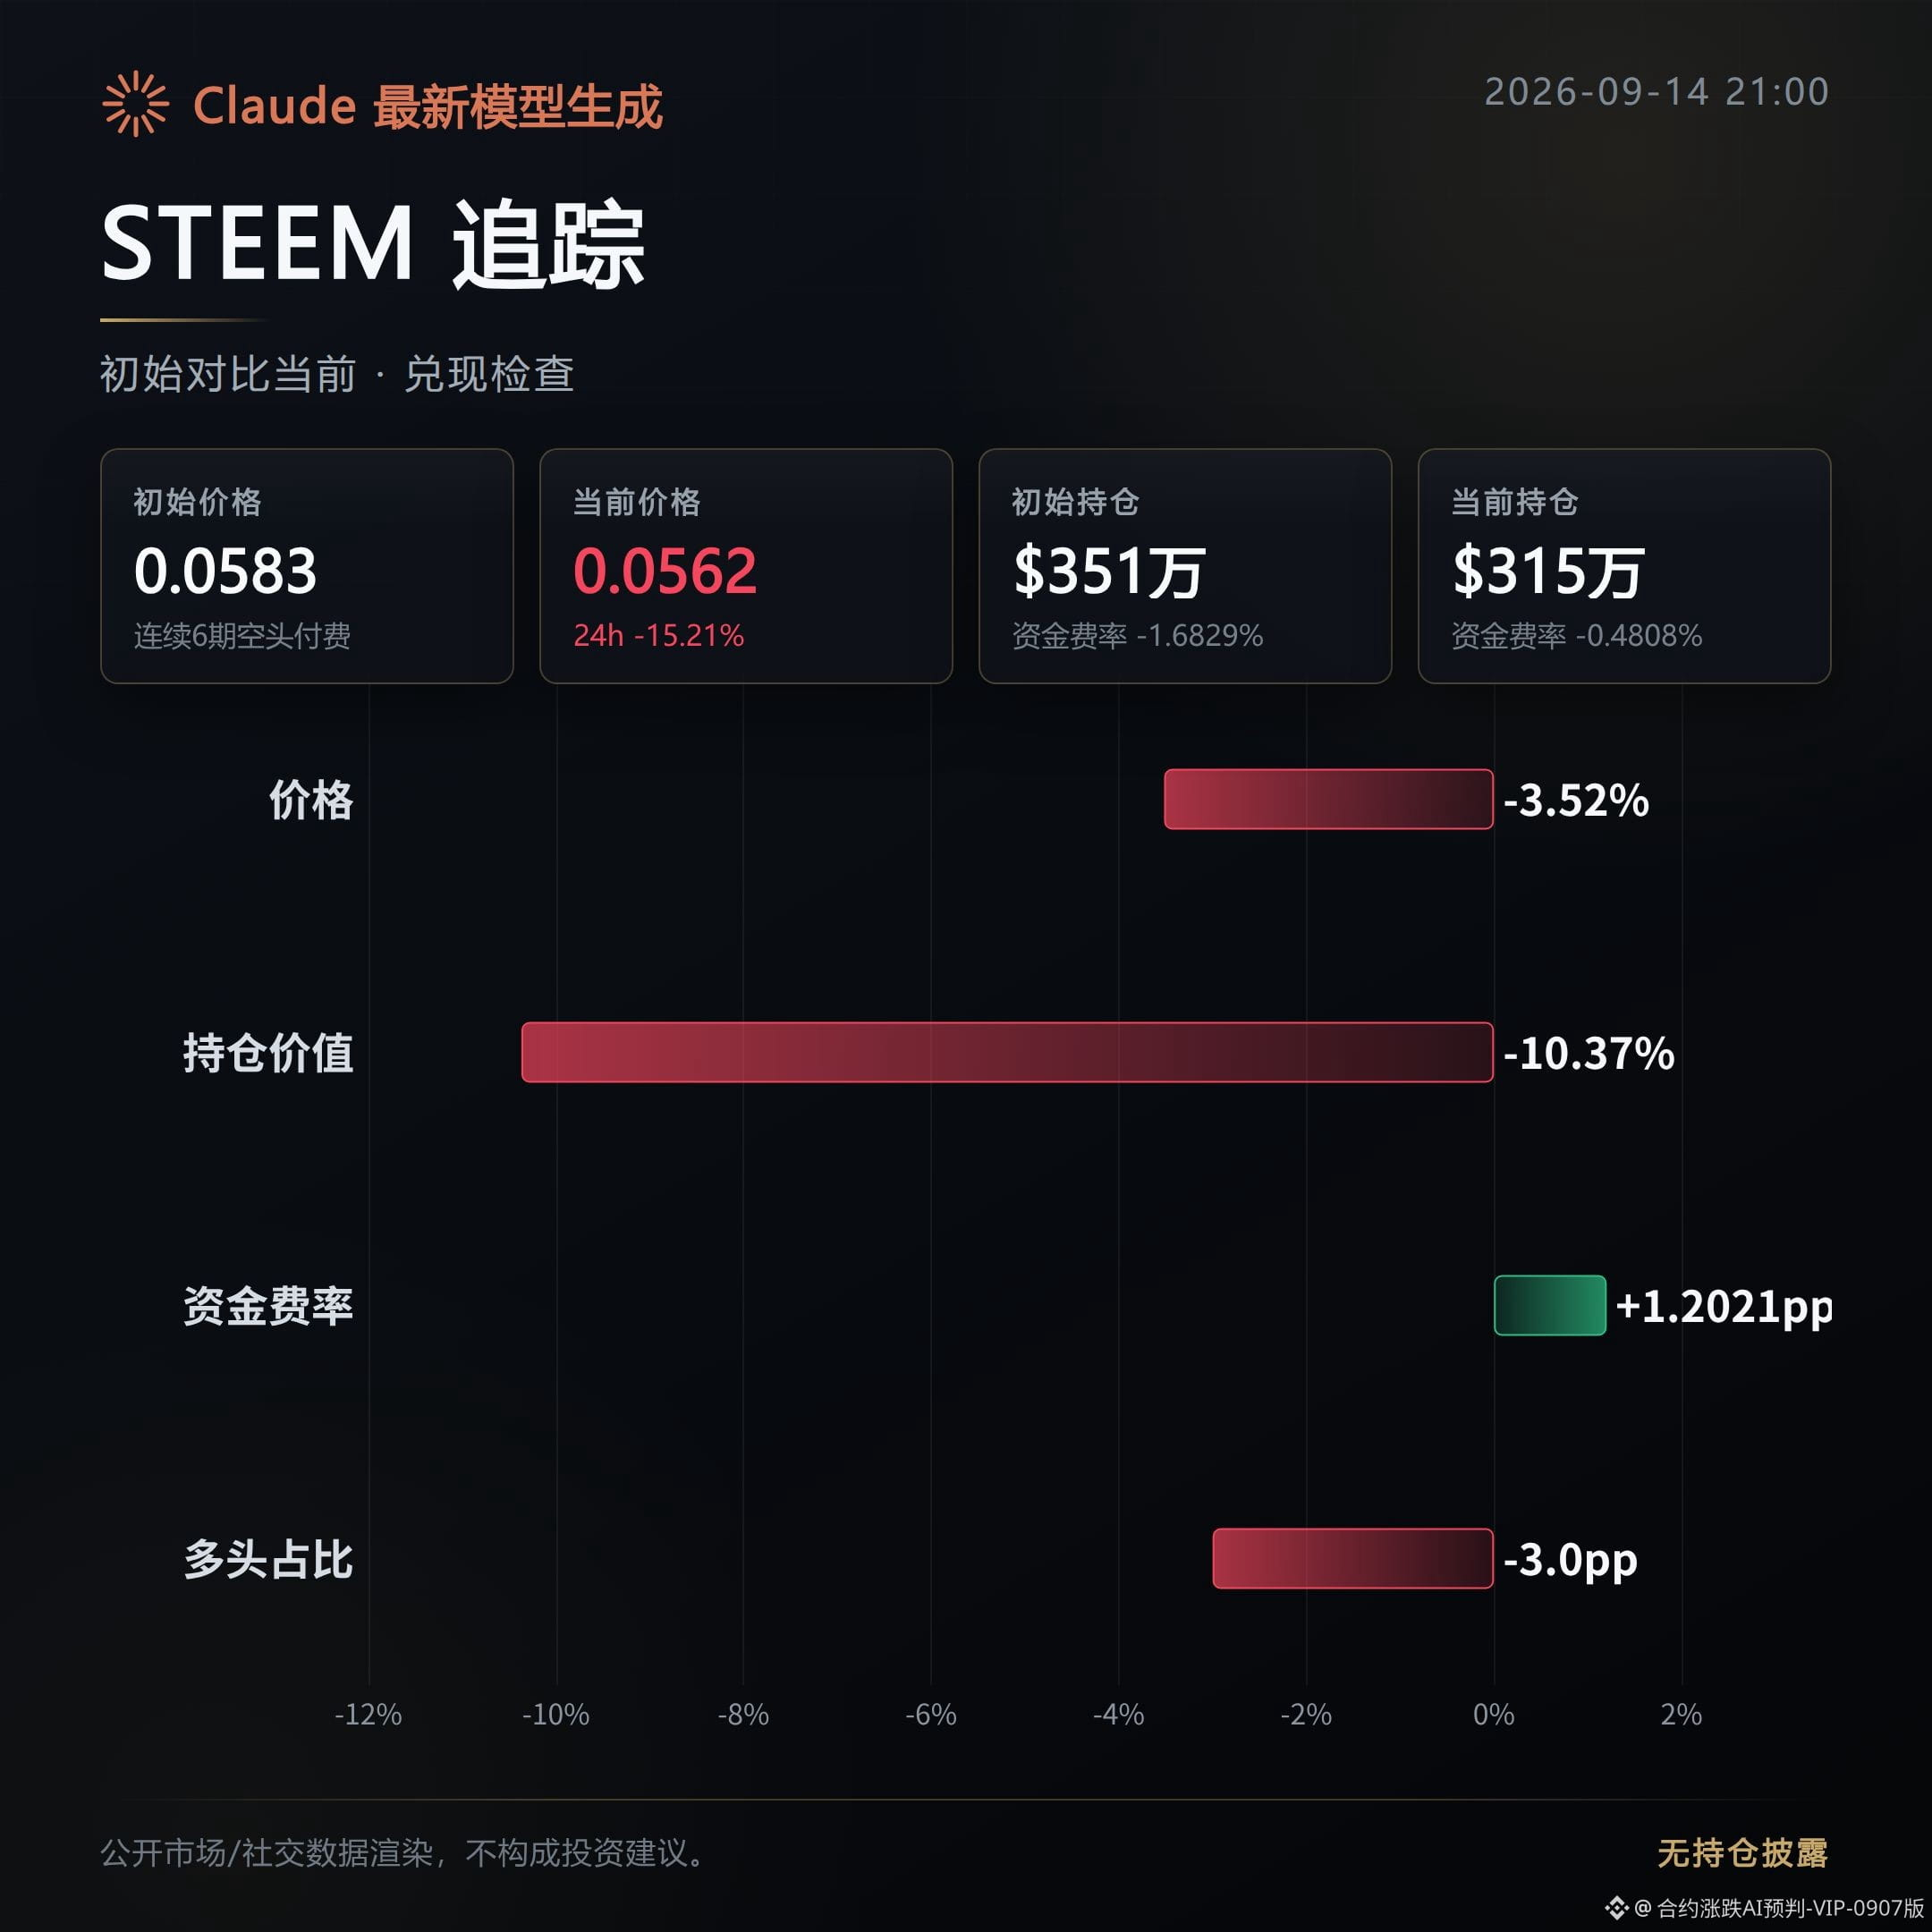
STEEM: stalled. The bullish attempt in the morning also wasn’t sustained. Price fell 3.52%. Open interest contracted in step by 10.37%, and trading volume shrank even more—by nearly 60%. Both funding and price weakened together; the original bullish judgment couldn’t carry through.
For whether this bullish line should be followed further, you can watch a few points: with LSK, whether the funding rate can stop digging lower, and whether trading volume can recover—these are key to judging whether it’s truly stalled or just a temporary pullback.
For FIL, whether active buy pressure can expand again is the line between being stuck in tangling and getting confirmed.
If STEEM’s open interest and trading volume continue to shrink in sync, then it can basically serve as a counterproof that the morning’s bullish observation doesn’t have room to play out.
#LSK #FIL #STEEM #Contract recap
Live account note: this account currently holds $FOGO long positions. With the logic unchanged, I will continue to hold.
Compiled with assistance from Claude Fable 5. For information reference only—please verify for yourself.
A set of bullish observations from about 12 hours ago—now let’s reconcile.
Among the three coins: 0 have been cashed out, 2 have stalled (gone cold), 1 is still getting tangled/whipsawing. The bullish line the market was targeting in the morning has not been able to hold.
Review of the initial observations: the positioning/participation (chips/volume) is coming in tightly (accumulating then compressing).
LSK: stalled. The bullish move in the morning didn’t break out. After the initial launch, the price fell 17.45%, and the direction has already turned opposite to the bullish thesis. The funding rate slid from -0.21% to -1.29%, compounded by成交量 (trading volume) shrinking by nearly 48%. Intraday enthusiasm clearly pulled back.
FIL: tangled. The price and funding structure have not formed a one-way confirmation. The price is up slightly by 1.98%, still hovering near the initial launch area, and the move hasn’t extended further. Open interest increased against the trend by 7.18%, but the strength of active buy orders dropped from 1.18 to 0.92—there’s inventory being built in the market, but buyers aren’t chasing it.
STEEM: stalled. The bullish attempt in the morning also wasn’t sustained. Price fell 3.52%. Open interest contracted in step by 10.37%, and trading volume shrank even more—by nearly 60%. Both funding and price weakened together; the original bullish judgment couldn’t carry through.
For whether this bullish line should be followed further, you can watch a few points: with LSK, whether the funding rate can stop digging lower, and whether trading volume can recover—these are key to judging whether it’s truly stalled or just a temporary pullback.
For FIL, whether active buy pressure can expand again is the line between being stuck in tangling and getting confirmed.
If STEEM’s open interest and trading volume continue to shrink in sync, then it can basically serve as a counterproof that the morning’s bullish observation doesn’t have room to play out.
#LSK #FIL #STEEM #Contract recap
Live account note: this account currently holds $FOGO long positions. With the logic unchanged, I will continue to hold.
Compiled with assistance from Claude Fable 5. For information reference only—please verify for yourself.
Among the three coins: 0 have been cashed out, 2 have stalled (gone cold), 1 is still getting tangled/whipsawing. The bullish line the market was targeting in the morning has not been able to hold.
Review of the initial observations: the positioning/participation (chips/volume) is coming in tightly (accumulating then compressing).
LSK: stalled. The bullish move in the morning didn’t break out. After the initial launch, the price fell 17.45%, and the direction has already turned opposite to the bullish thesis. The funding rate slid from -0.21% to -1.29%, compounded by成交量 (trading volume) shrinking by nearly 48%. Intraday enthusiasm clearly pulled back.
FIL: tangled. The price and funding structure have not formed a one-way confirmation. The price is up slightly by 1.98%, still hovering near the initial launch area, and the move hasn’t extended further. Open interest increased against the trend by 7.18%, but the strength of active buy orders dropped from 1.18 to 0.92—there’s inventory being built in the market, but buyers aren’t chasing it.
STEEM: stalled. The bullish attempt in the morning also wasn’t sustained. Price fell 3.52%. Open interest contracted in step by 10.37%, and trading volume shrank even more—by nearly 60%. Both funding and price weakened together; the original bullish judgment couldn’t carry through.
For whether this bullish line should be followed further, you can watch a few points: with LSK, whether the funding rate can stop digging lower, and whether trading volume can recover—these are key to judging whether it’s truly stalled or just a temporary pullback.
For FIL, whether active buy pressure can expand again is the line between being stuck in tangling and getting confirmed.
If STEEM’s open interest and trading volume continue to shrink in sync, then it can basically serve as a counterproof that the morning’s bullish observation doesn’t have room to play out.
#LSK #FIL #STEEM #Contract recap
Live account note: this account currently holds $FOGO long positions. With the logic unchanged, I will continue to hold.
Compiled with assistance from Claude Fable 5. For information reference only—please verify for yourself.
481
In the top 3 gainers this morning, we’re now past the last 8 hours—let’s check the numbers.
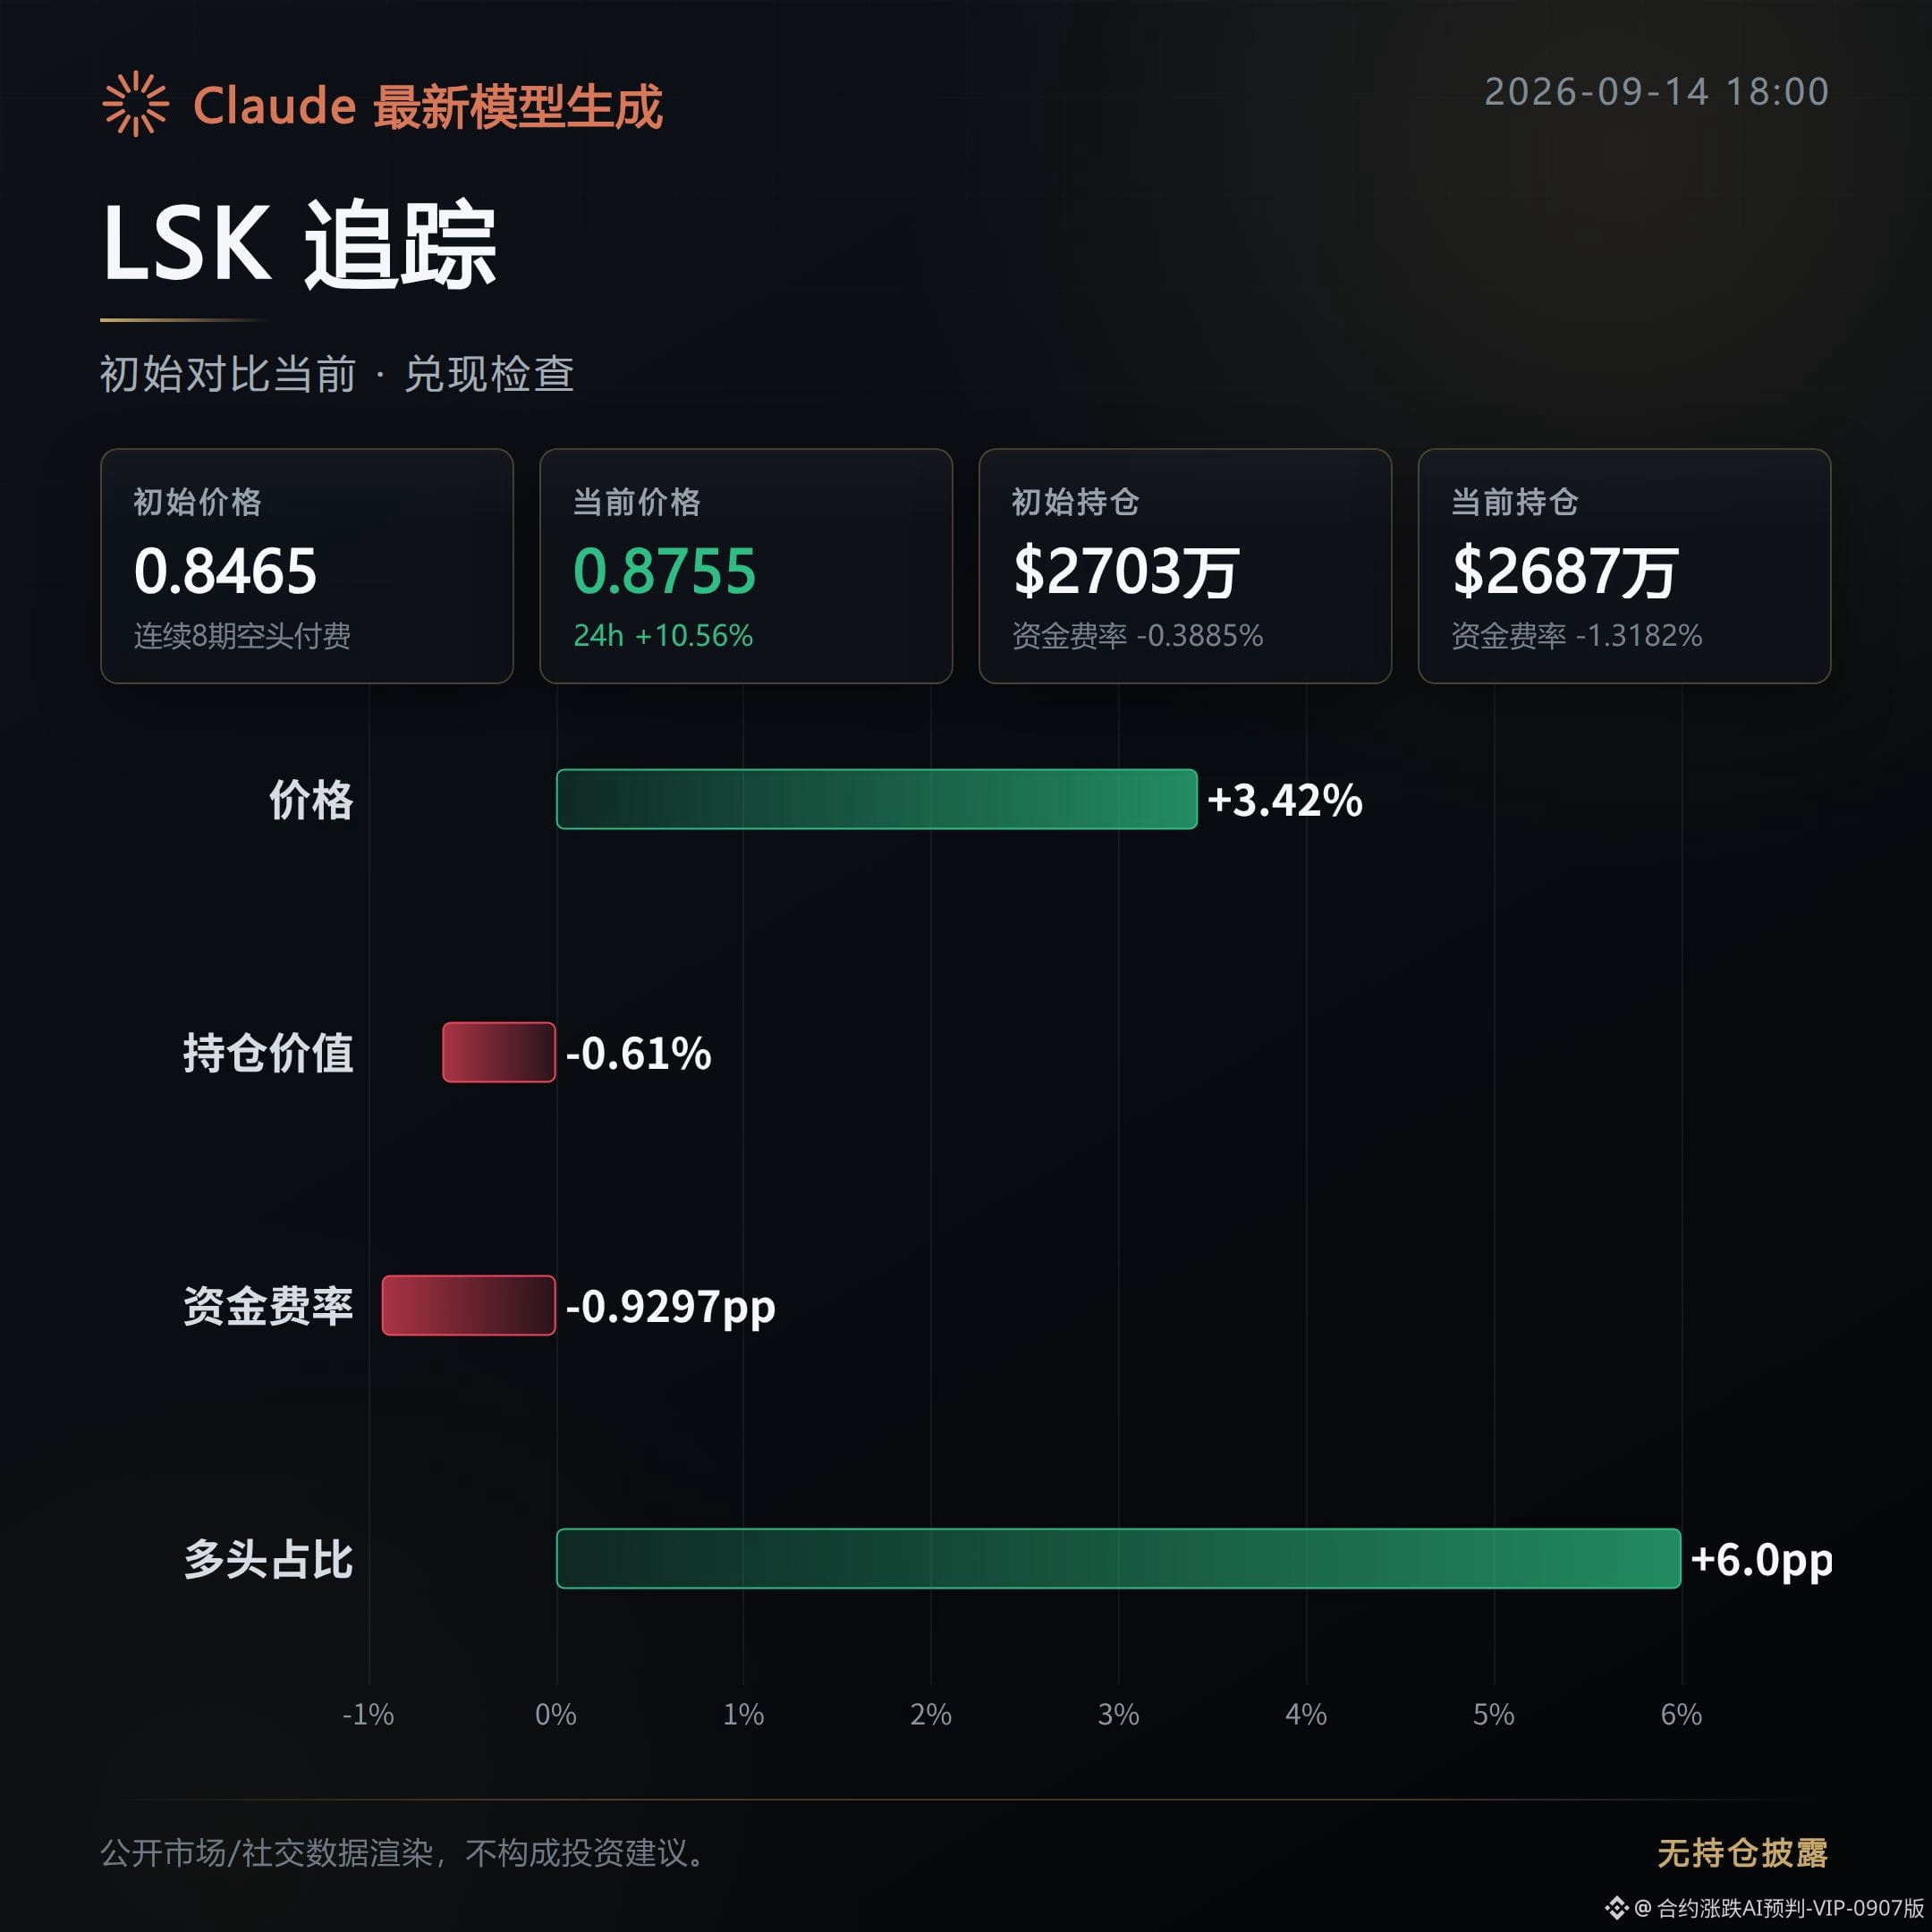
LSK’s conclusion is that it’s being realized.
The initial price was 0.84654, now it’s 0.87551, and the rise continues to expand by 3.42%.
However, the funding rate has dropped from -0.3885% to -1.3182%, the open interest has slightly fallen by 0.61%, and the momentum of FOMO buying is cooling.
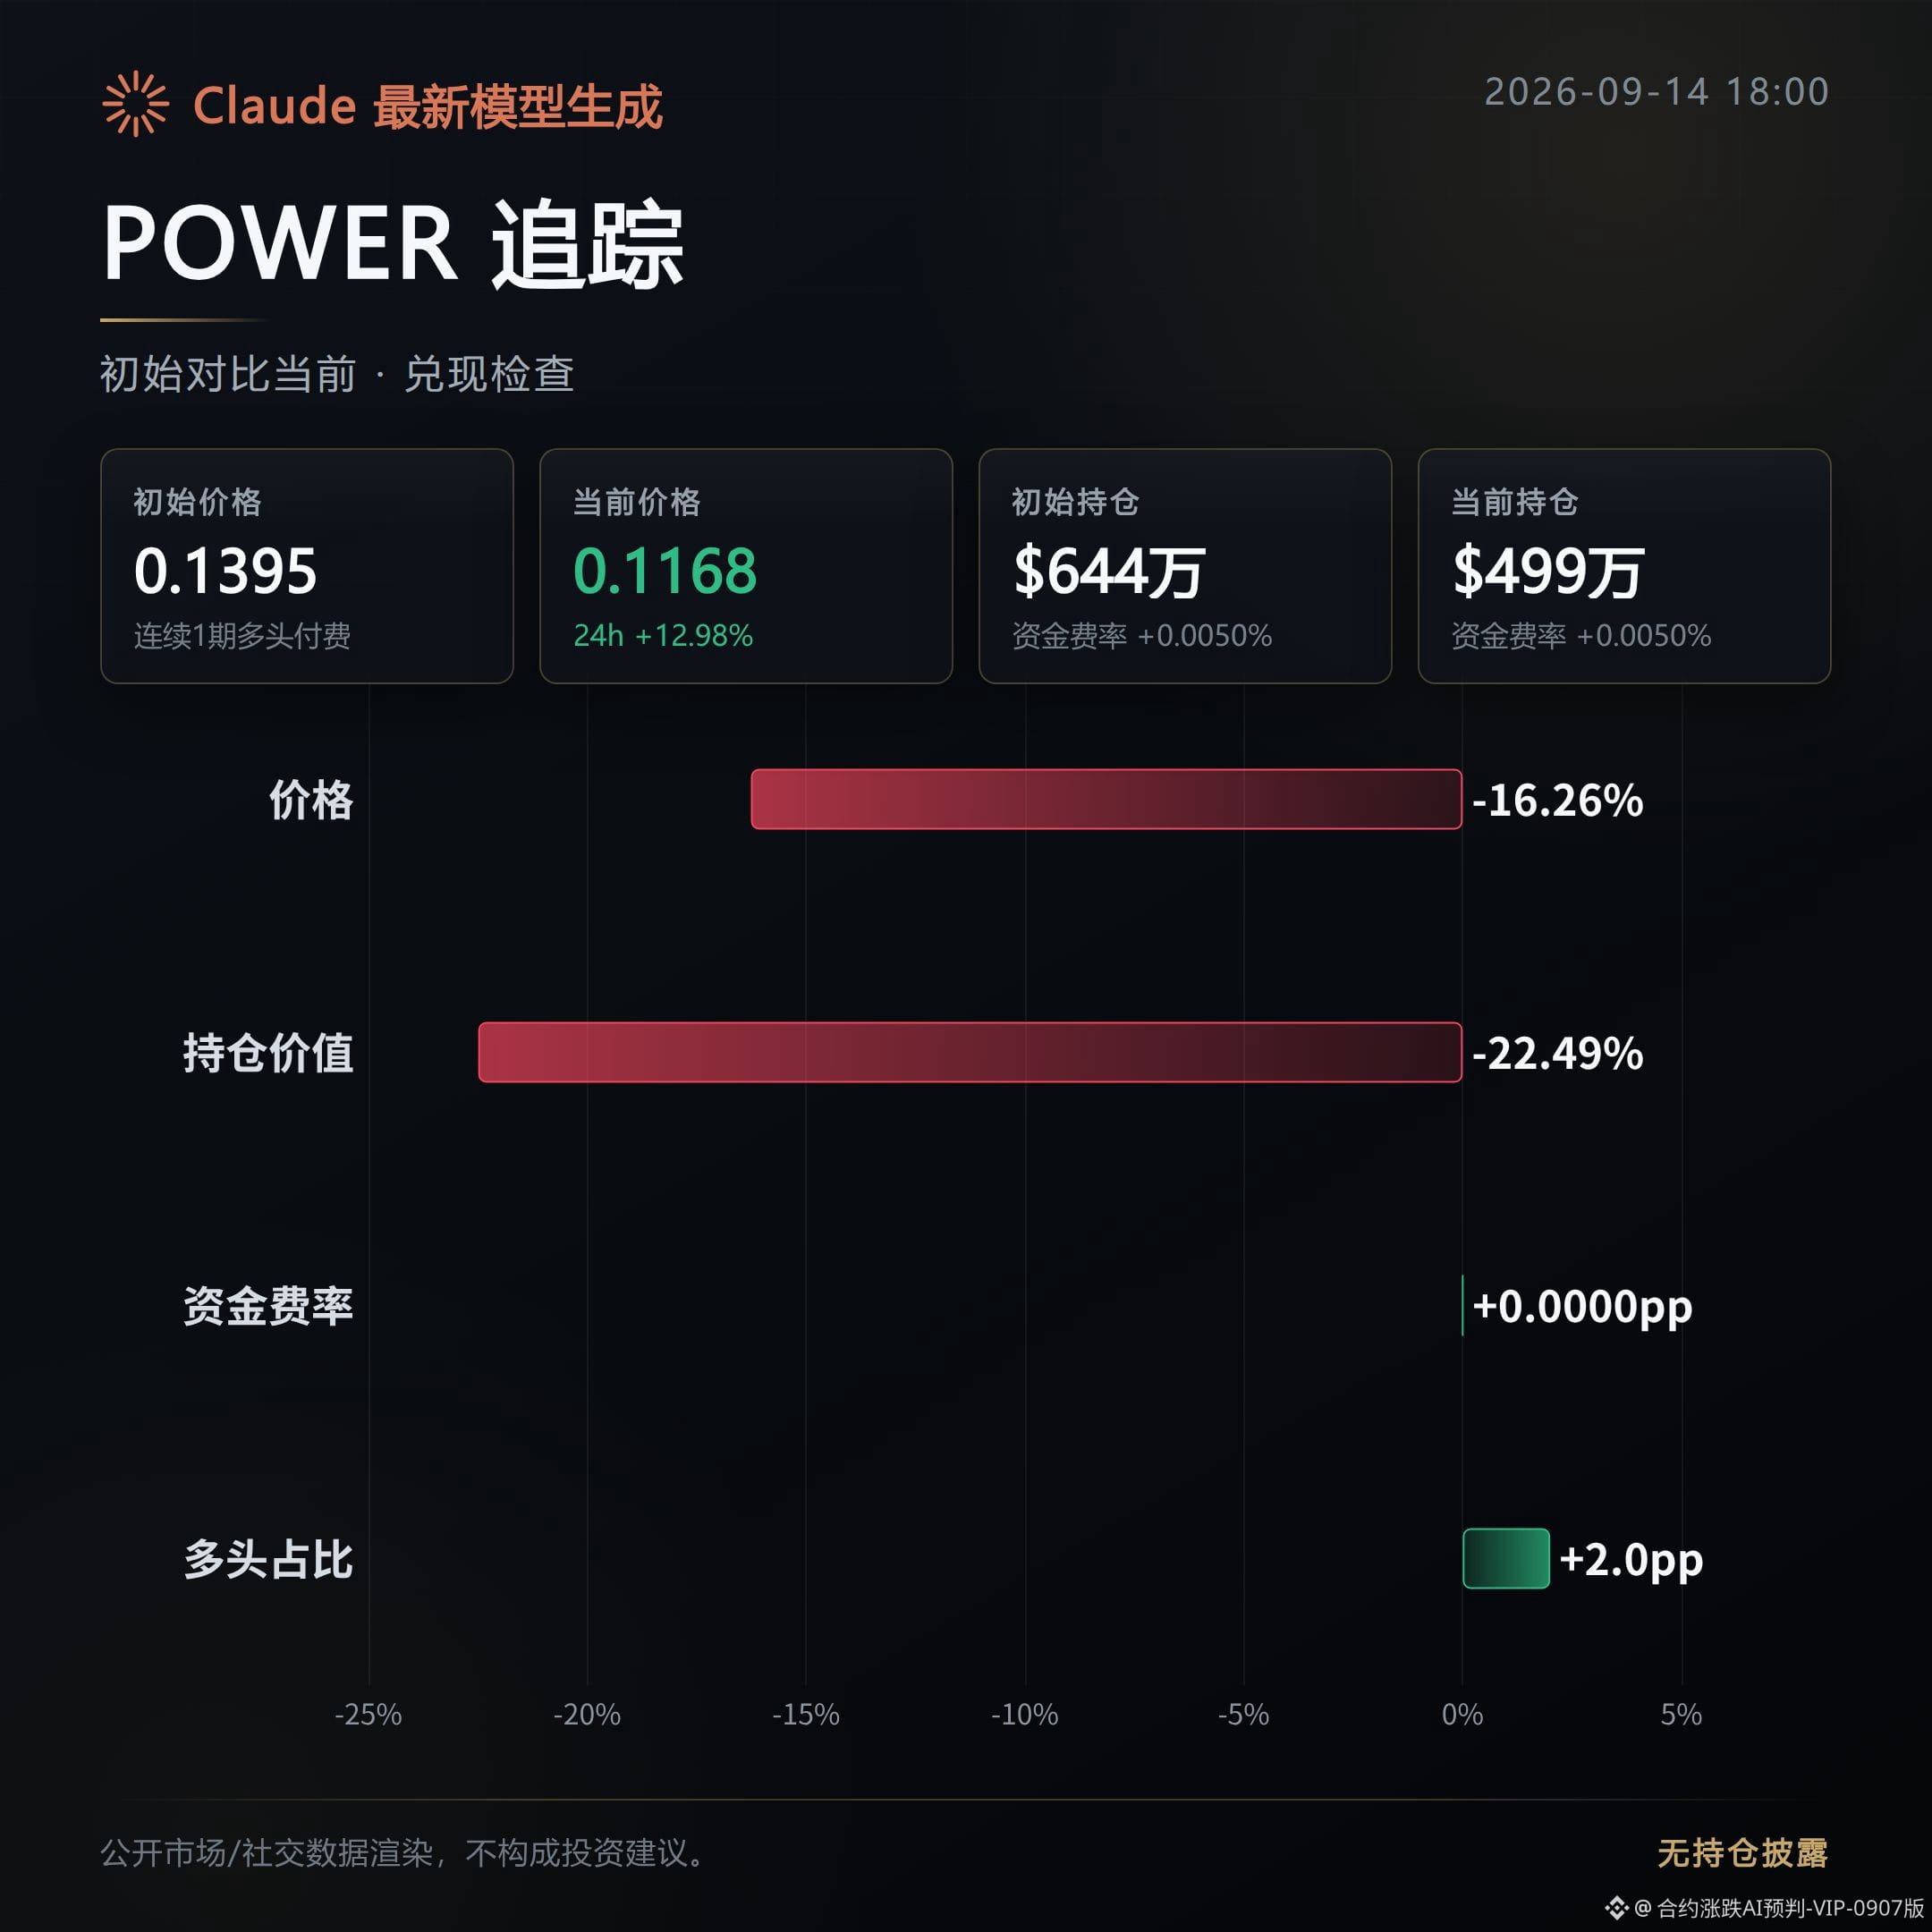
POWER’s conclusion is that it has stalled.
The initial price was 0.13952, now it has fallen back to 0.11683, a decline of 16.26%.
Open interest has also decreased by 22.49% in sync, indicating capital is withdrawing; the longs that chased at the highs should watch the risk of a pullback.
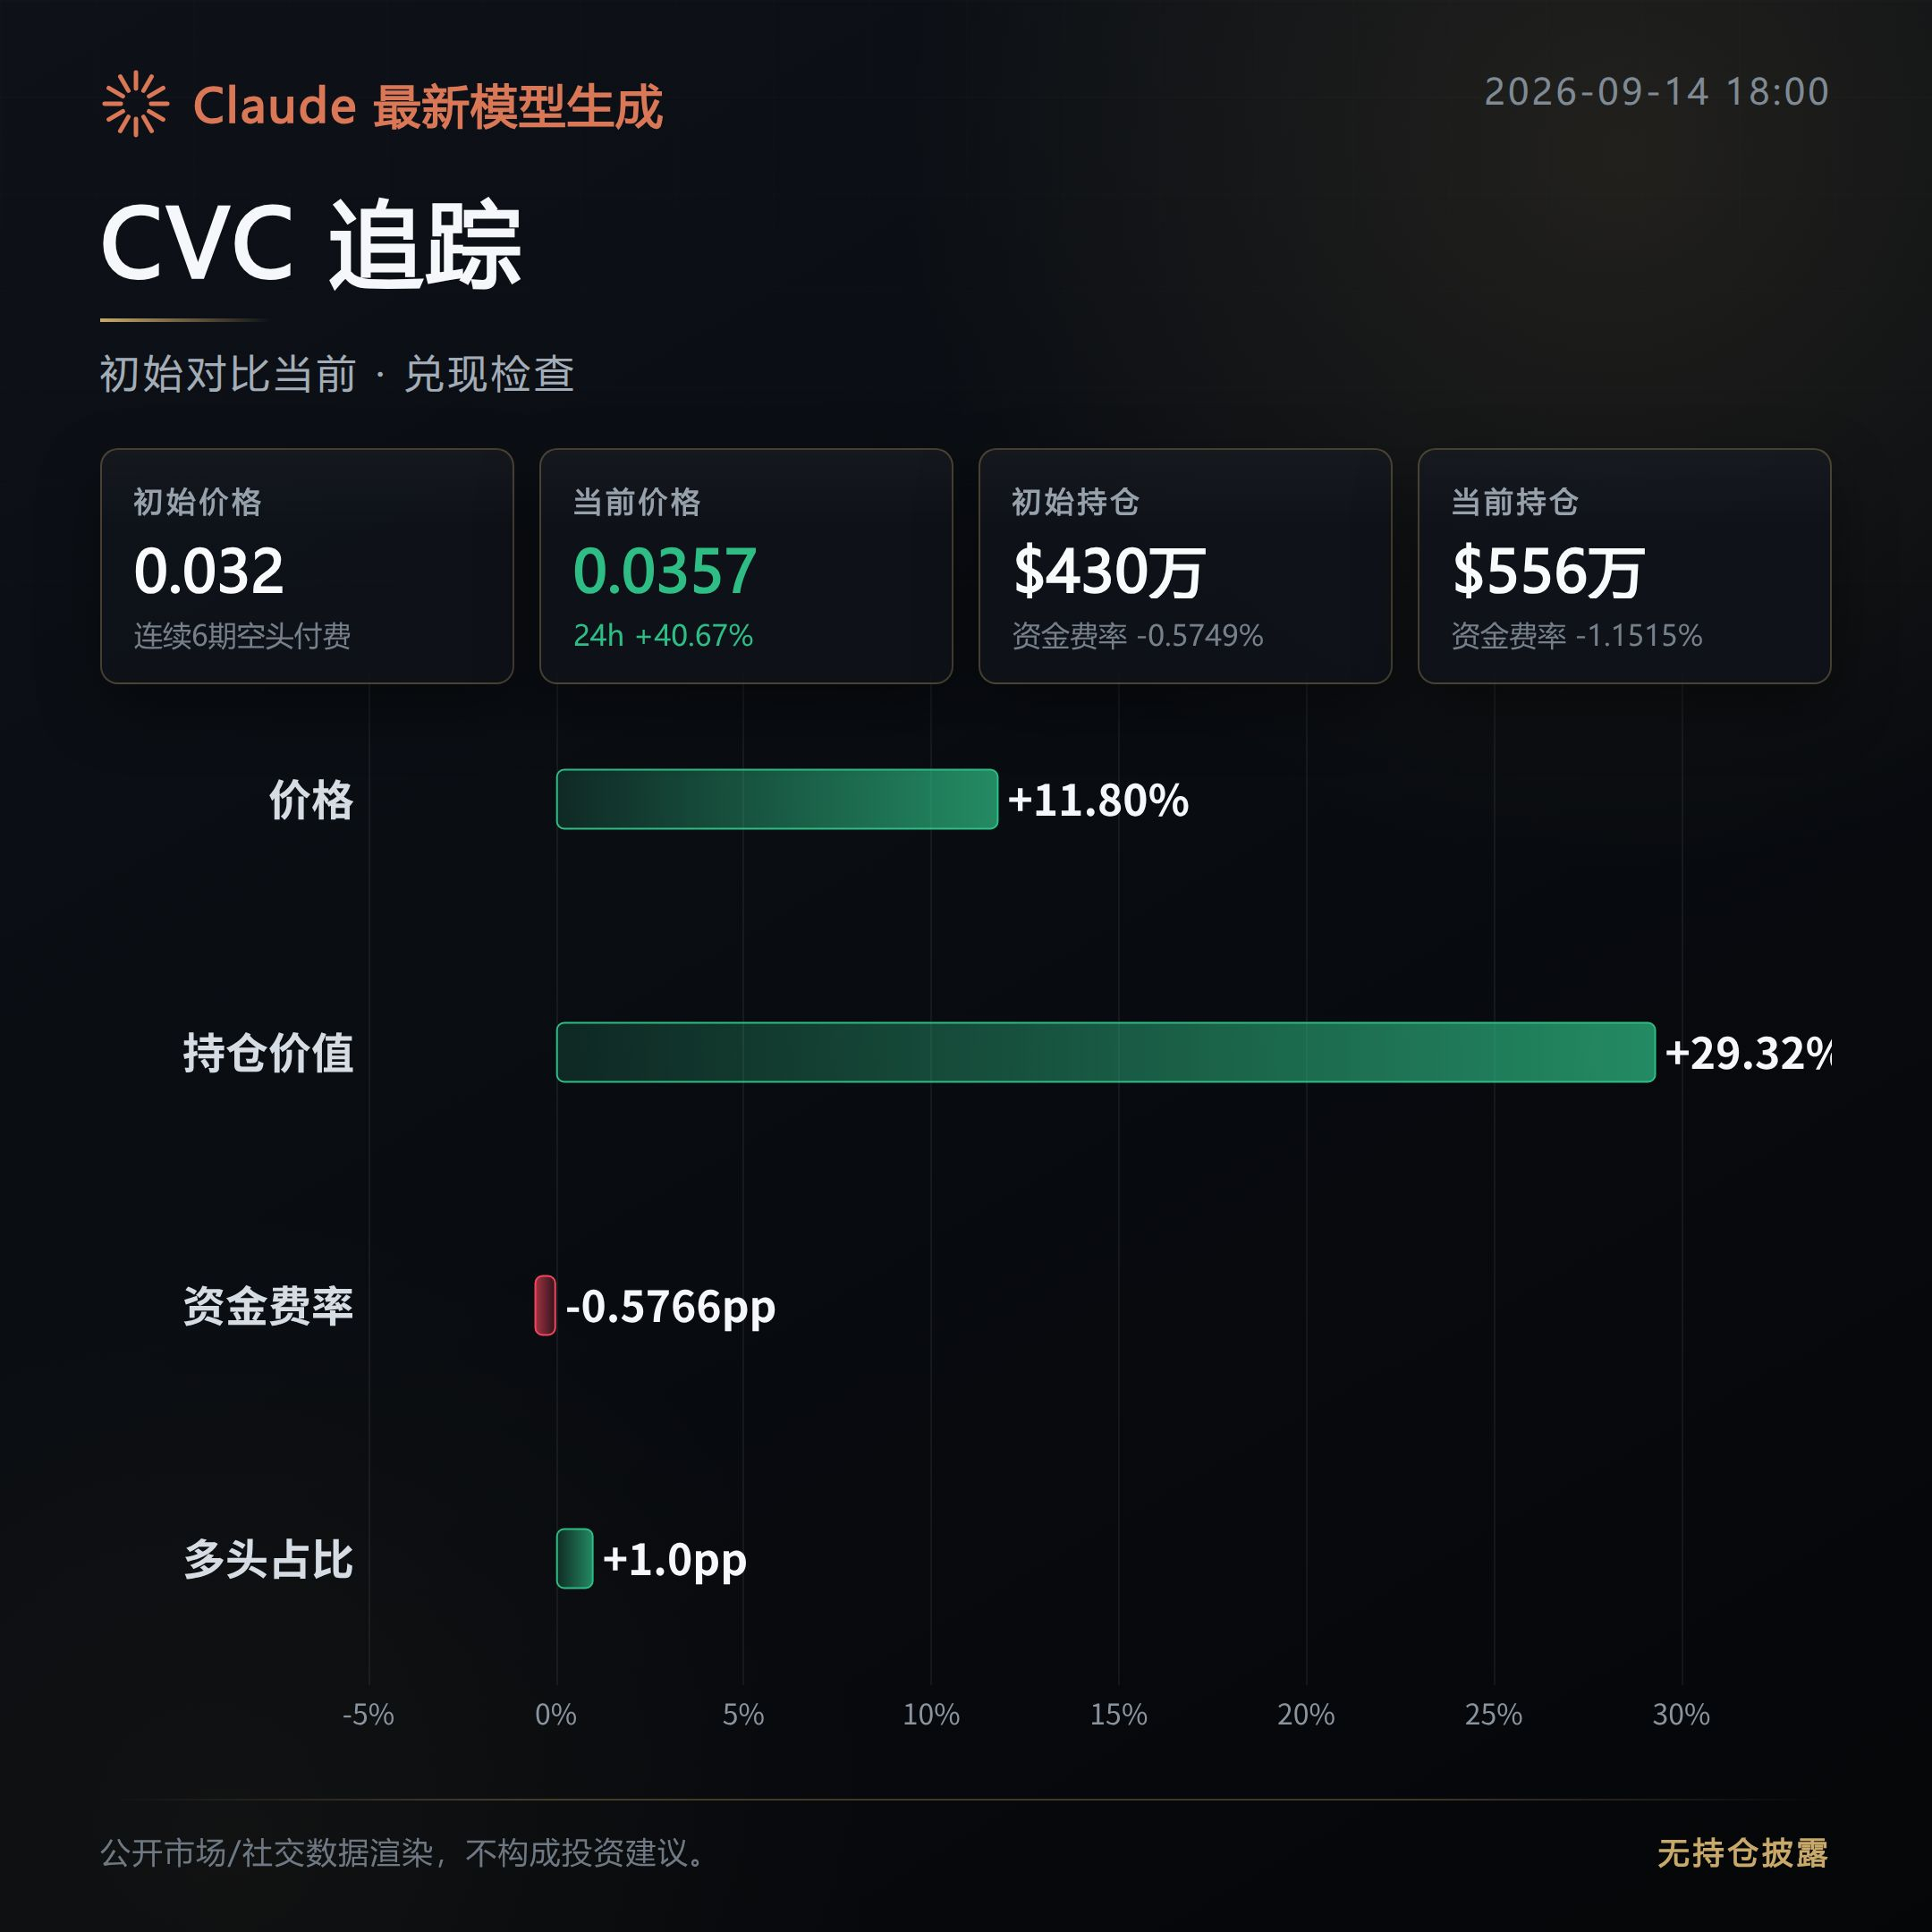
CVC’s conclusion is that it’s being realized—and it’s still applying pressure.
The initial price was 0.03196, now it’s up to 0.03573, continuing to rise by 11.8%.
Open interest has increased by 29.32%, and the funding rate has dropped from -0.5749% to -1.1515%, meaning long costs are being pushed higher.
Among the three coins, LSK and CVC are still continuing, while POWER has turned around; the most direct signal is the simultaneous drop in both open interest and price.
Funding rates are generally becoming more negative, suggesting bearish (short) willingness to pay is rising. Before chasing, take another look at how open interest and funding-rate timing are changing.
#LSK #CVC #POWER
#Futures contract recap
Spot record: This account currently holds $FOGO long positions; the logic hasn’t changed, so continue holding.
Compiled with assistance from Claude Fable 5 for organizing contract data; for informational purposes only—please verify for yourself.
In the top 3 gainers this morning, we’re now past the last 8 hours—let’s check the numbers.
LSK’s conclusion is that it’s being realized.
The initial price was 0.84654, now it’s 0.87551, and the rise continues to expand by 3.42%.
However, the funding rate has dropped from -0.3885% to -1.3182%, the open interest has slightly fallen by 0.61%, and the momentum of FOMO buying is cooling.
POWER’s conclusion is that it has stalled.
The initial price was 0.13952, now it has fallen back to 0.11683, a decline of 16.26%.
Open interest has also decreased by 22.49% in sync, indicating capital is withdrawing; the longs that chased at the highs should watch the risk of a pullback.
CVC’s conclusion is that it’s being realized—and it’s still applying pressure.
The initial price was 0.03196, now it’s up to 0.03573, continuing to rise by 11.8%.
Open interest has increased by 29.32%, and the funding rate has dropped from -0.5749% to -1.1515%, meaning long costs are being pushed higher.
Among the three coins, LSK and CVC are still continuing, while POWER has turned around; the most direct signal is the simultaneous drop in both open interest and price.
Funding rates are generally becoming more negative, suggesting bearish (short) willingness to pay is rising. Before chasing, take another look at how open interest and funding-rate timing are changing.
#LSK #CVC #POWER
#Futures contract recap
Spot record: This account currently holds $FOGO long positions; the logic hasn’t changed, so continue holding.
Compiled with assistance from Claude Fable 5 for organizing contract data; for informational purposes only—please verify for yourself.
LSK’s conclusion is that it’s being realized.
The initial price was 0.84654, now it’s 0.87551, and the rise continues to expand by 3.42%.
However, the funding rate has dropped from -0.3885% to -1.3182%, the open interest has slightly fallen by 0.61%, and the momentum of FOMO buying is cooling.
POWER’s conclusion is that it has stalled.
The initial price was 0.13952, now it has fallen back to 0.11683, a decline of 16.26%.
Open interest has also decreased by 22.49% in sync, indicating capital is withdrawing; the longs that chased at the highs should watch the risk of a pullback.
CVC’s conclusion is that it’s being realized—and it’s still applying pressure.
The initial price was 0.03196, now it’s up to 0.03573, continuing to rise by 11.8%.
Open interest has increased by 29.32%, and the funding rate has dropped from -0.5749% to -1.1515%, meaning long costs are being pushed higher.
Among the three coins, LSK and CVC are still continuing, while POWER has turned around; the most direct signal is the simultaneous drop in both open interest and price.
Funding rates are generally becoming more negative, suggesting bearish (short) willingness to pay is rising. Before chasing, take another look at how open interest and funding-rate timing are changing.
#LSK #CVC #POWER
#Futures contract recap
Spot record: This account currently holds $FOGO long positions; the logic hasn’t changed, so continue holding.
Compiled with assistance from Claude Fable 5 for organizing contract data; for informational purposes only—please verify for yourself.
603
【Morning Bearish Recap · High-Level Distribution Early-Warning Performance Sheet】The high-level distribution warning sent about 6 hours ago isn’t looking great this time: none of the 3 coins followed through with a unidirectional drop, 2 directly bounced back, and 1 is still tangled. The proportion of the bearish setup not being realized is on the high side; at the first issuance, the observational recap was “chips are scattered.”
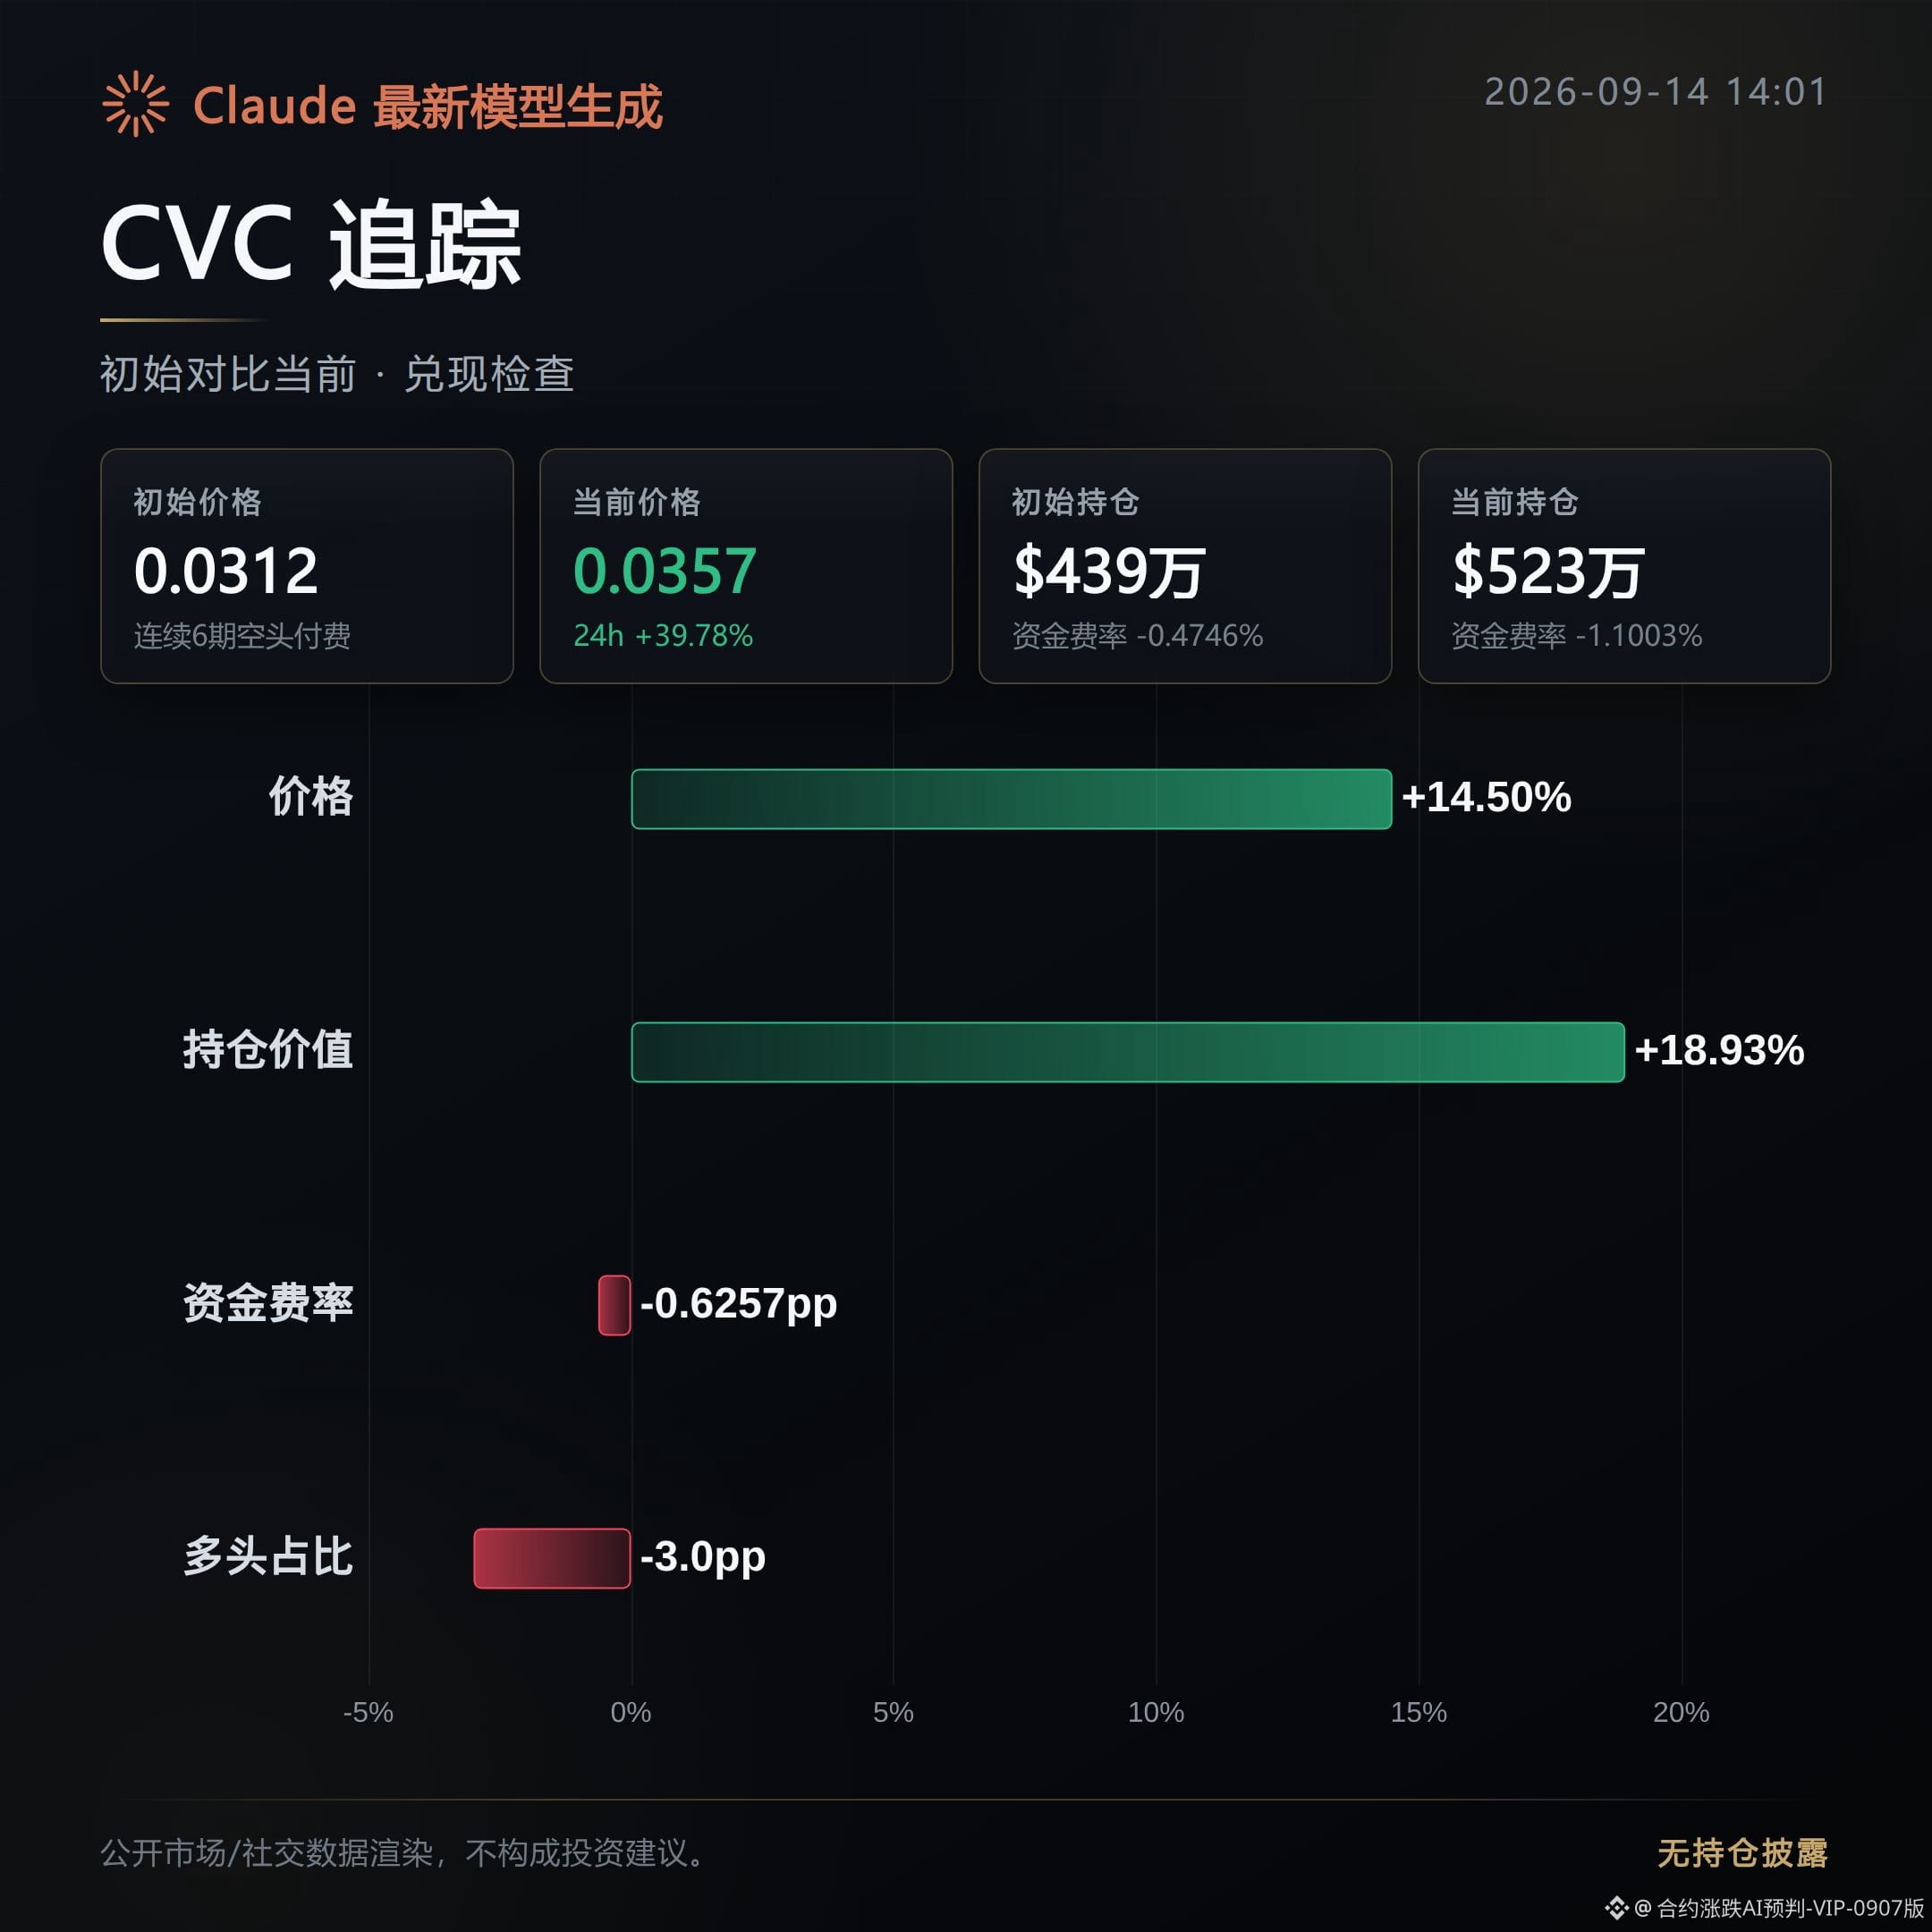
CVC: a bounce back; the morning bearish move didn’t play out. After the initial release, price didn’t fall but instead rose 14.5%. Open interest rose nearly 19% in sync, and the funding rate further turned negative to -1.1%. Shorts are adding, but price isn’t cooperating. The passive buying/selling order ratio also edged up to 1.01. This suggests selling pressure couldn’t hold the market down, and long-side support is stronger than expected.
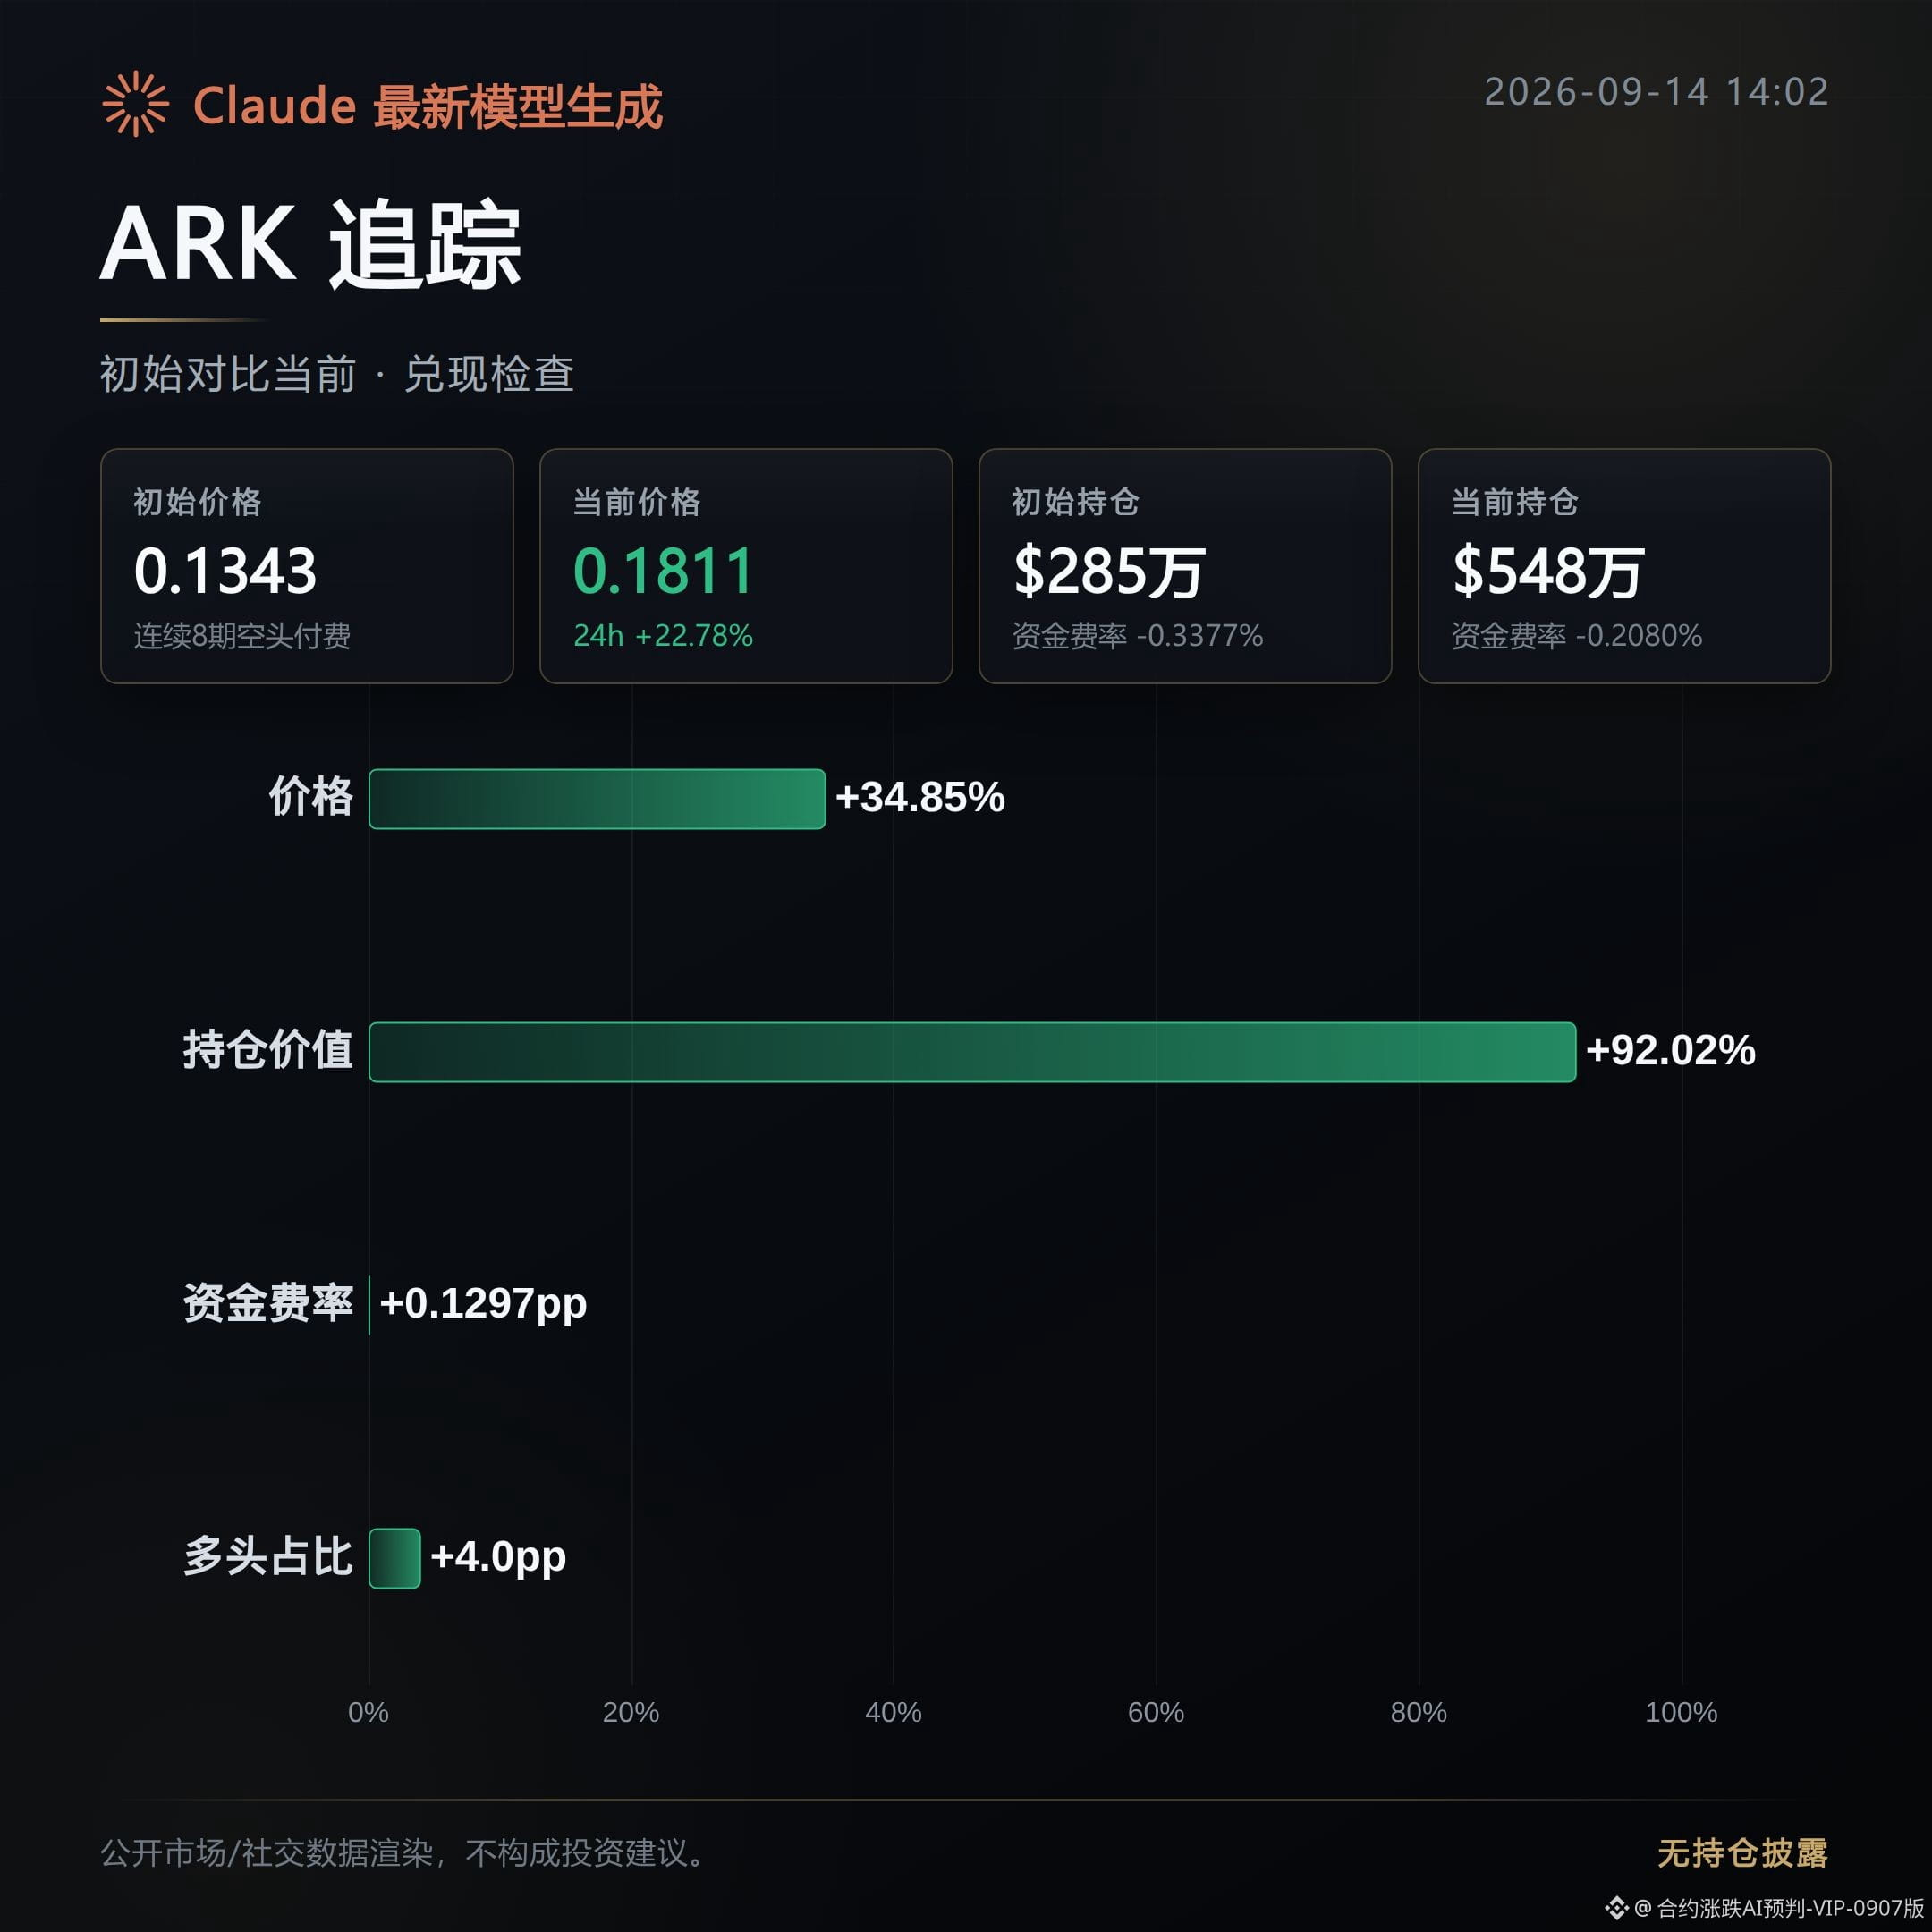
ARK: a bounce back—among the three, it deviated the most from the intended direction. After the initial release, price surged 34.85%, open interest climbed by over 90%. The active buying/selling order ratio rose from 0.66 to 0.94, showing clearly strengthening buy-side momentum. The original high-level distribution observation is falsified by both capital and price moving stronger. This isn’t a low-volume rebound; there’s incremental inflow entering.
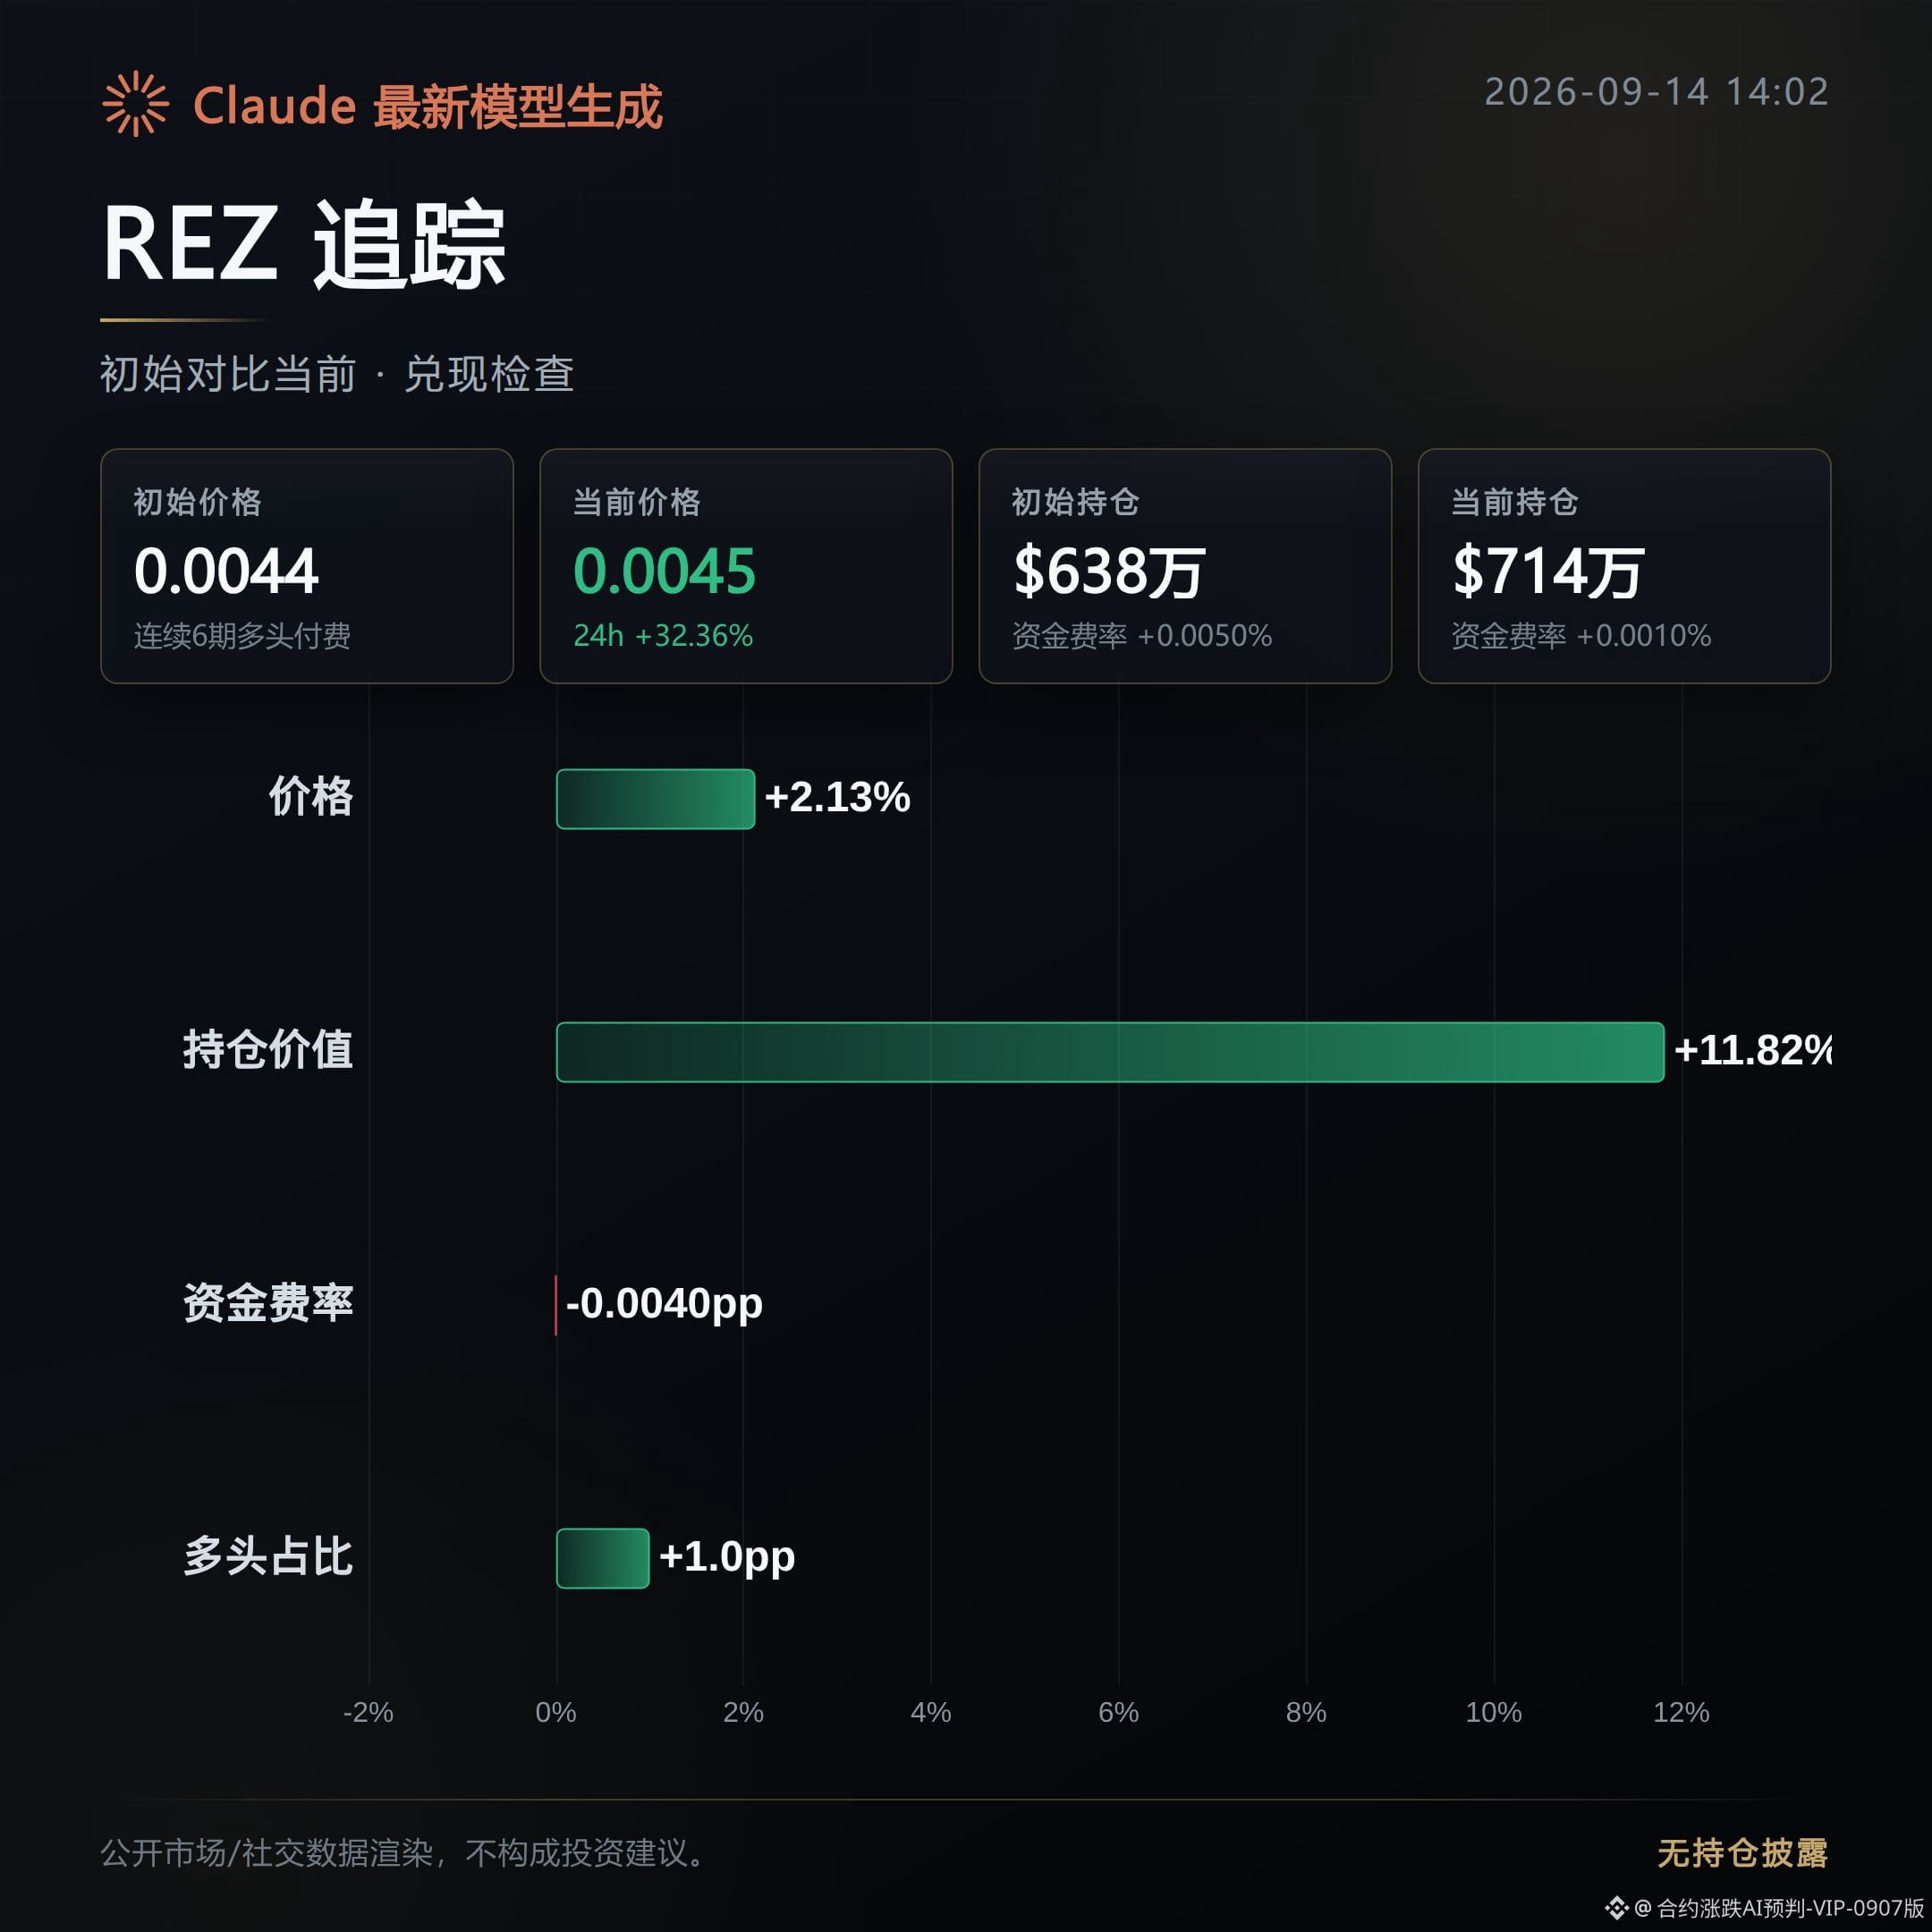
REZ: tangled— the only one among the three neither falsified nor confirmed. After the initial release, price only rose 2.13%, basically going nowhere. Open interest inched up slightly, while the active buying/selling order ratio drifted from 0.87 down to 0.85. Buying fervor hasn’t clearly cooled, but it also hasn’t formed downward pressure. The direction is still hanging; drawing a conclusion now is too early.
Next, watch: whether the open-interest increment in CVC and ARK can be sustained. Once the funding rate turns negative and price begins to fall with it, only then does the bearish logic regain dominance. For REZ, check whether the active buying ratio weakens further; only if it breaks below the prior value can the “tangled” phase be considered over and the direction become clear. At present, the public order books for all three coins have not shown a confirmed unidirectional downturn. Future changes in signals are the key to judging whether this line holds.
Position note: This account holds $FOGO long positions in real trading; the disclosure is to keep the content consistent with actual trades.
Compiled with assistance from Claude Fable 5. For reference only—please verify independently.
【Morning Bearish Recap · High-Level Distribution Early-Warning Performance Sheet】The high-level distribution warning sent about 6 hours ago isn’t looking great this time: none of the 3 coins followed through with a unidirectional drop, 2 directly bounced back, and 1 is still tangled. The proportion of the bearish setup not being realized is on the high side; at the first issuance, the observational recap was “chips are scattered.”
CVC: a bounce back; the morning bearish move didn’t play out. After the initial release, price didn’t fall but instead rose 14.5%. Open interest rose nearly 19% in sync, and the funding rate further turned negative to -1.1%. Shorts are adding, but price isn’t cooperating. The passive buying/selling order ratio also edged up to 1.01. This suggests selling pressure couldn’t hold the market down, and long-side support is stronger than expected.
ARK: a bounce back—among the three, it deviated the most from the intended direction. After the initial release, price surged 34.85%, open interest climbed by over 90%. The active buying/selling order ratio rose from 0.66 to 0.94, showing clearly strengthening buy-side momentum. The original high-level distribution observation is falsified by both capital and price moving stronger. This isn’t a low-volume rebound; there’s incremental inflow entering.
REZ: tangled— the only one among the three neither falsified nor confirmed. After the initial release, price only rose 2.13%, basically going nowhere. Open interest inched up slightly, while the active buying/selling order ratio drifted from 0.87 down to 0.85. Buying fervor hasn’t clearly cooled, but it also hasn’t formed downward pressure. The direction is still hanging; drawing a conclusion now is too early.
Next, watch: whether the open-interest increment in CVC and ARK can be sustained. Once the funding rate turns negative and price begins to fall with it, only then does the bearish logic regain dominance. For REZ, check whether the active buying ratio weakens further; only if it breaks below the prior value can the “tangled” phase be considered over and the direction become clear. At present, the public order books for all three coins have not shown a confirmed unidirectional downturn. Future changes in signals are the key to judging whether this line holds.
Position note: This account holds $FOGO long positions in real trading; the disclosure is to keep the content consistent with actual trades.
Compiled with assistance from Claude Fable 5. For reference only—please verify independently.
CVC: a bounce back; the morning bearish move didn’t play out. After the initial release, price didn’t fall but instead rose 14.5%. Open interest rose nearly 19% in sync, and the funding rate further turned negative to -1.1%. Shorts are adding, but price isn’t cooperating. The passive buying/selling order ratio also edged up to 1.01. This suggests selling pressure couldn’t hold the market down, and long-side support is stronger than expected.
ARK: a bounce back—among the three, it deviated the most from the intended direction. After the initial release, price surged 34.85%, open interest climbed by over 90%. The active buying/selling order ratio rose from 0.66 to 0.94, showing clearly strengthening buy-side momentum. The original high-level distribution observation is falsified by both capital and price moving stronger. This isn’t a low-volume rebound; there’s incremental inflow entering.
REZ: tangled— the only one among the three neither falsified nor confirmed. After the initial release, price only rose 2.13%, basically going nowhere. Open interest inched up slightly, while the active buying/selling order ratio drifted from 0.87 down to 0.85. Buying fervor hasn’t clearly cooled, but it also hasn’t formed downward pressure. The direction is still hanging; drawing a conclusion now is too early.
Next, watch: whether the open-interest increment in CVC and ARK can be sustained. Once the funding rate turns negative and price begins to fall with it, only then does the bearish logic regain dominance. For REZ, check whether the active buying ratio weakens further; only if it breaks below the prior value can the “tangled” phase be considered over and the direction become clear. At present, the public order books for all three coins have not shown a confirmed unidirectional downturn. Future changes in signals are the key to judging whether this line holds.
Position note: This account holds $FOGO long positions in real trading; the disclosure is to keep the content consistent with actual trades.
Compiled with assistance from Claude Fable 5. For reference only—please verify independently.
305
This is the follow-up recap of that “Pump Observation · Bullish” set from this morning, posted about 5 hours ago. At the initial release, the observation was that the chips were in accumulation.
At the start, there were 3 bullish contracts in the morning; now 2 have moved out, and 1 is still being wrestled—LSK and STEEM have realized, while FIL didn’t catch on.
LSK: Realized. The morning bullish line moved out.
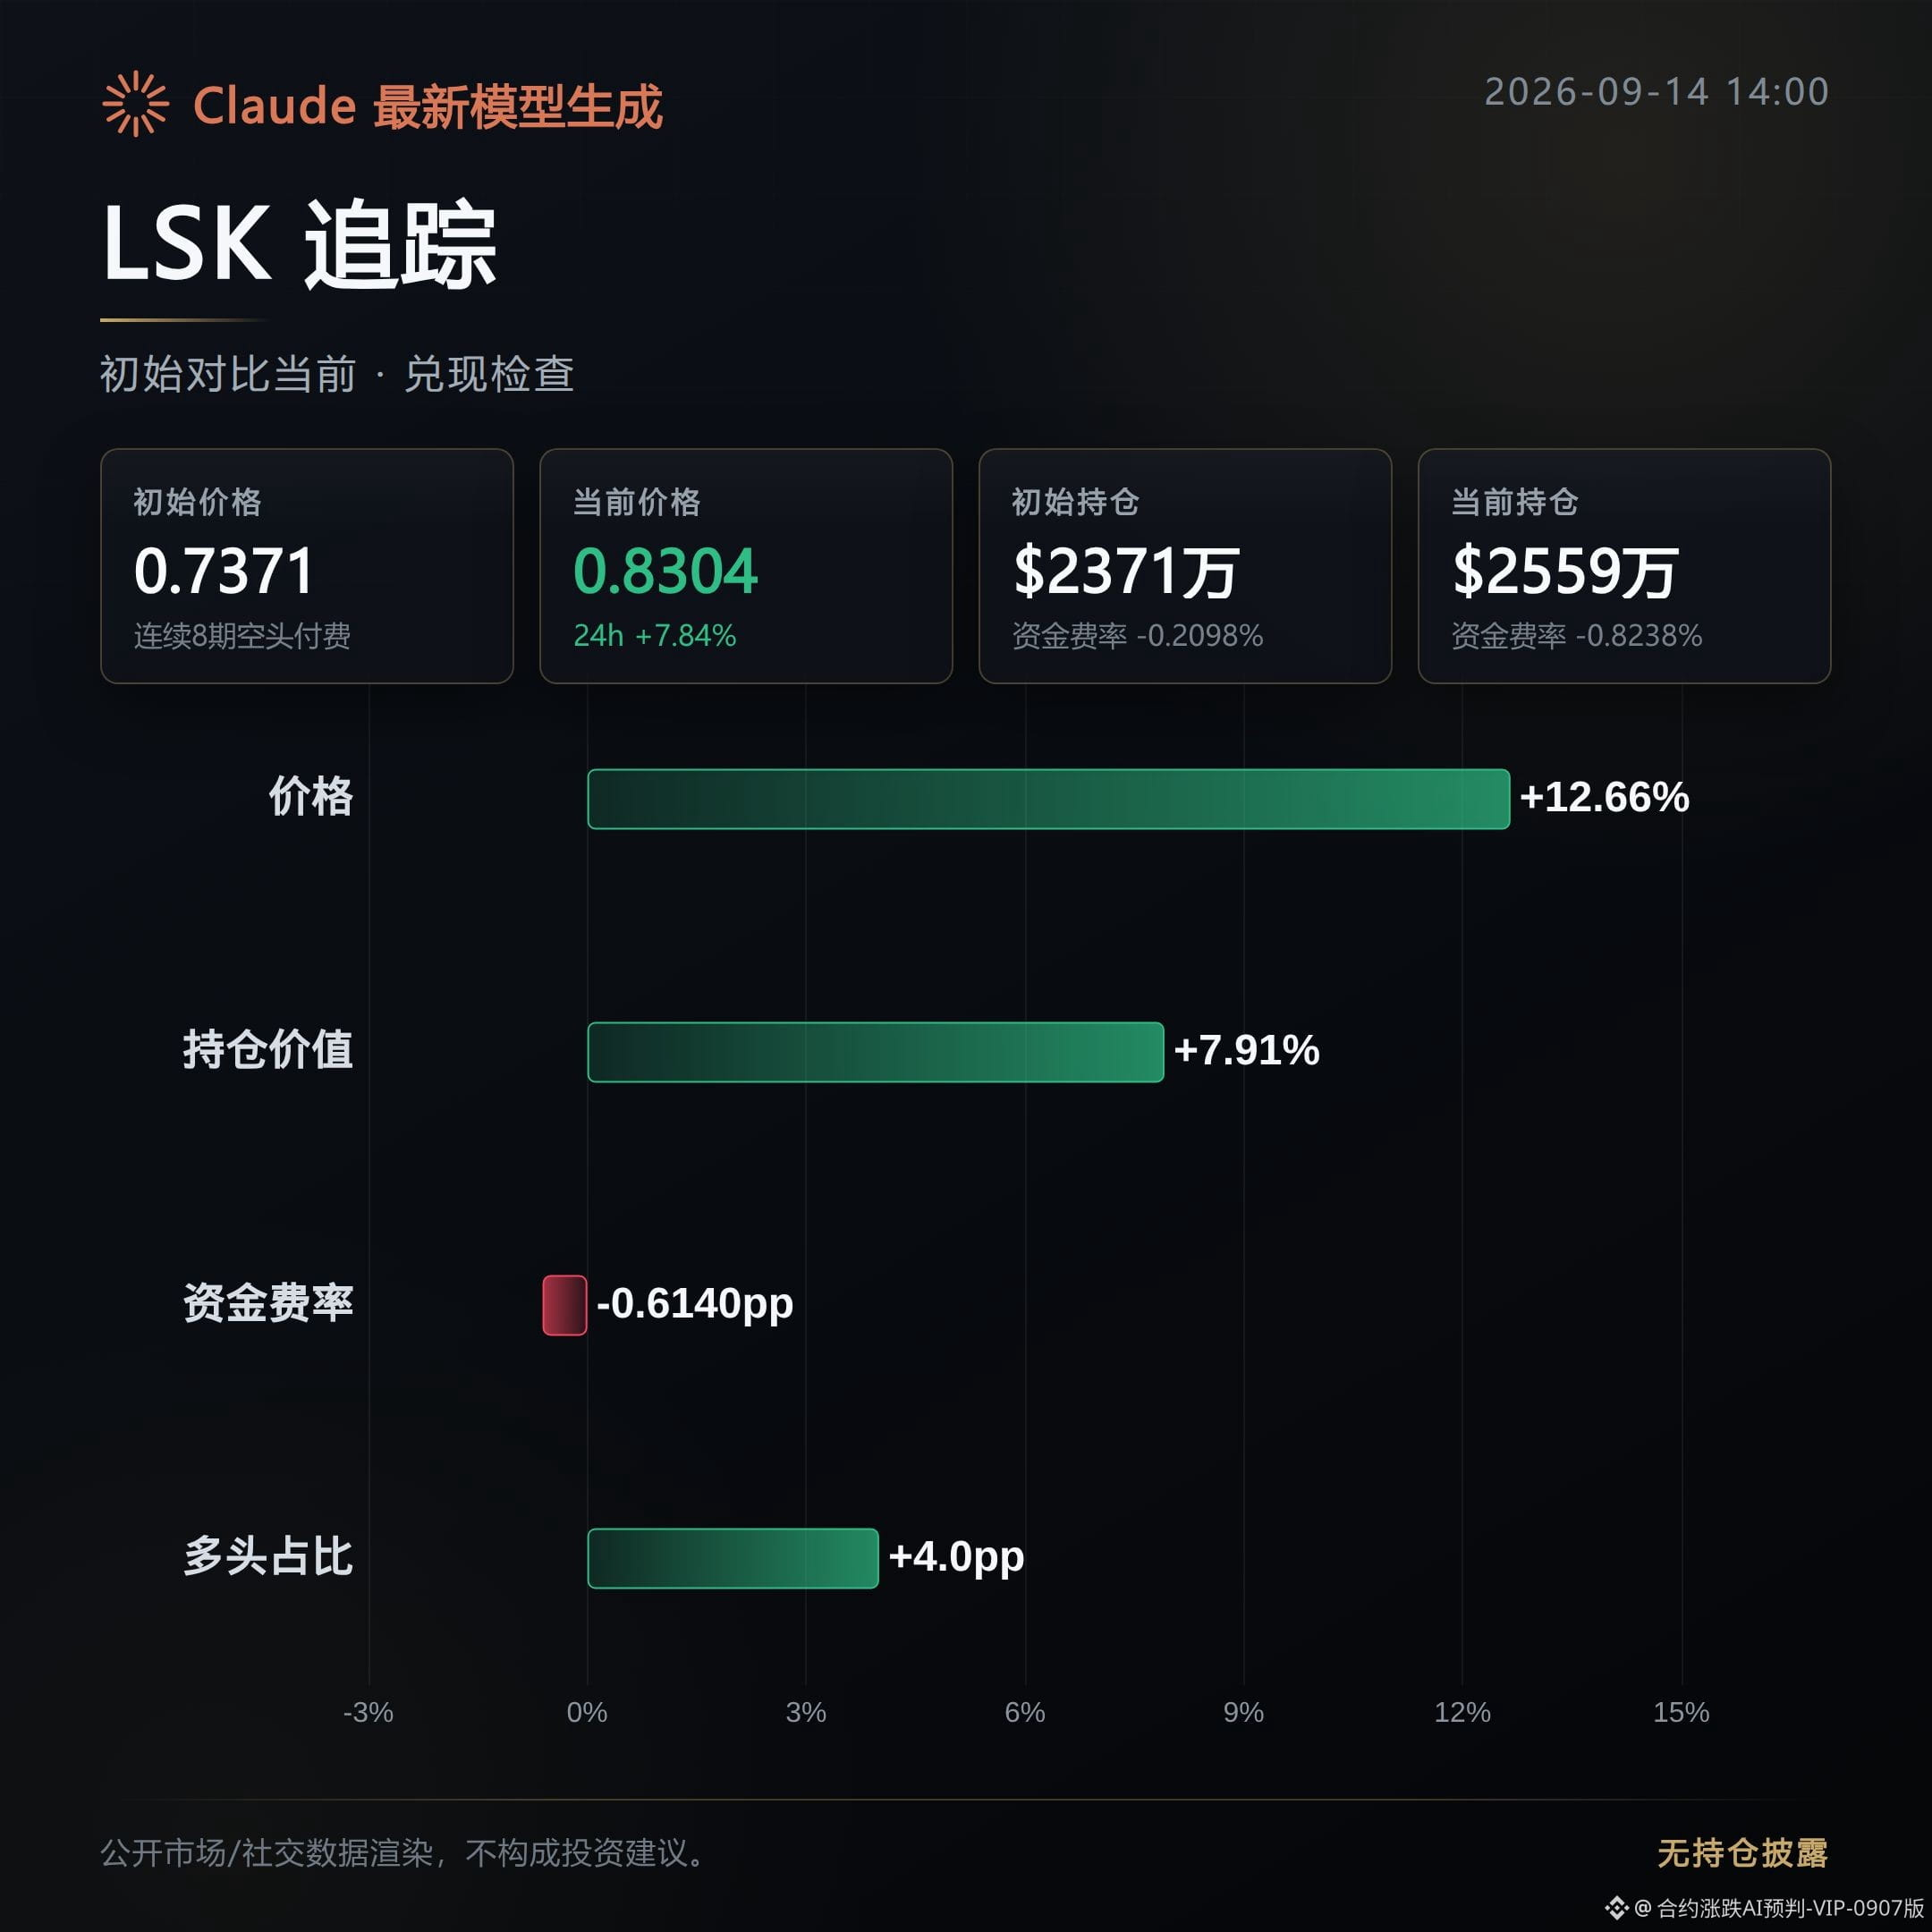
After the initial spike, the price kept rising by 12.66%, reaching 0.83044. The direction didn’t keep flipping back and forth.
Open interest increased in sync by 7.91% to $25.5879 million, indicating that this rally had fresh positioning following along—not just a temporary pump to distribute.
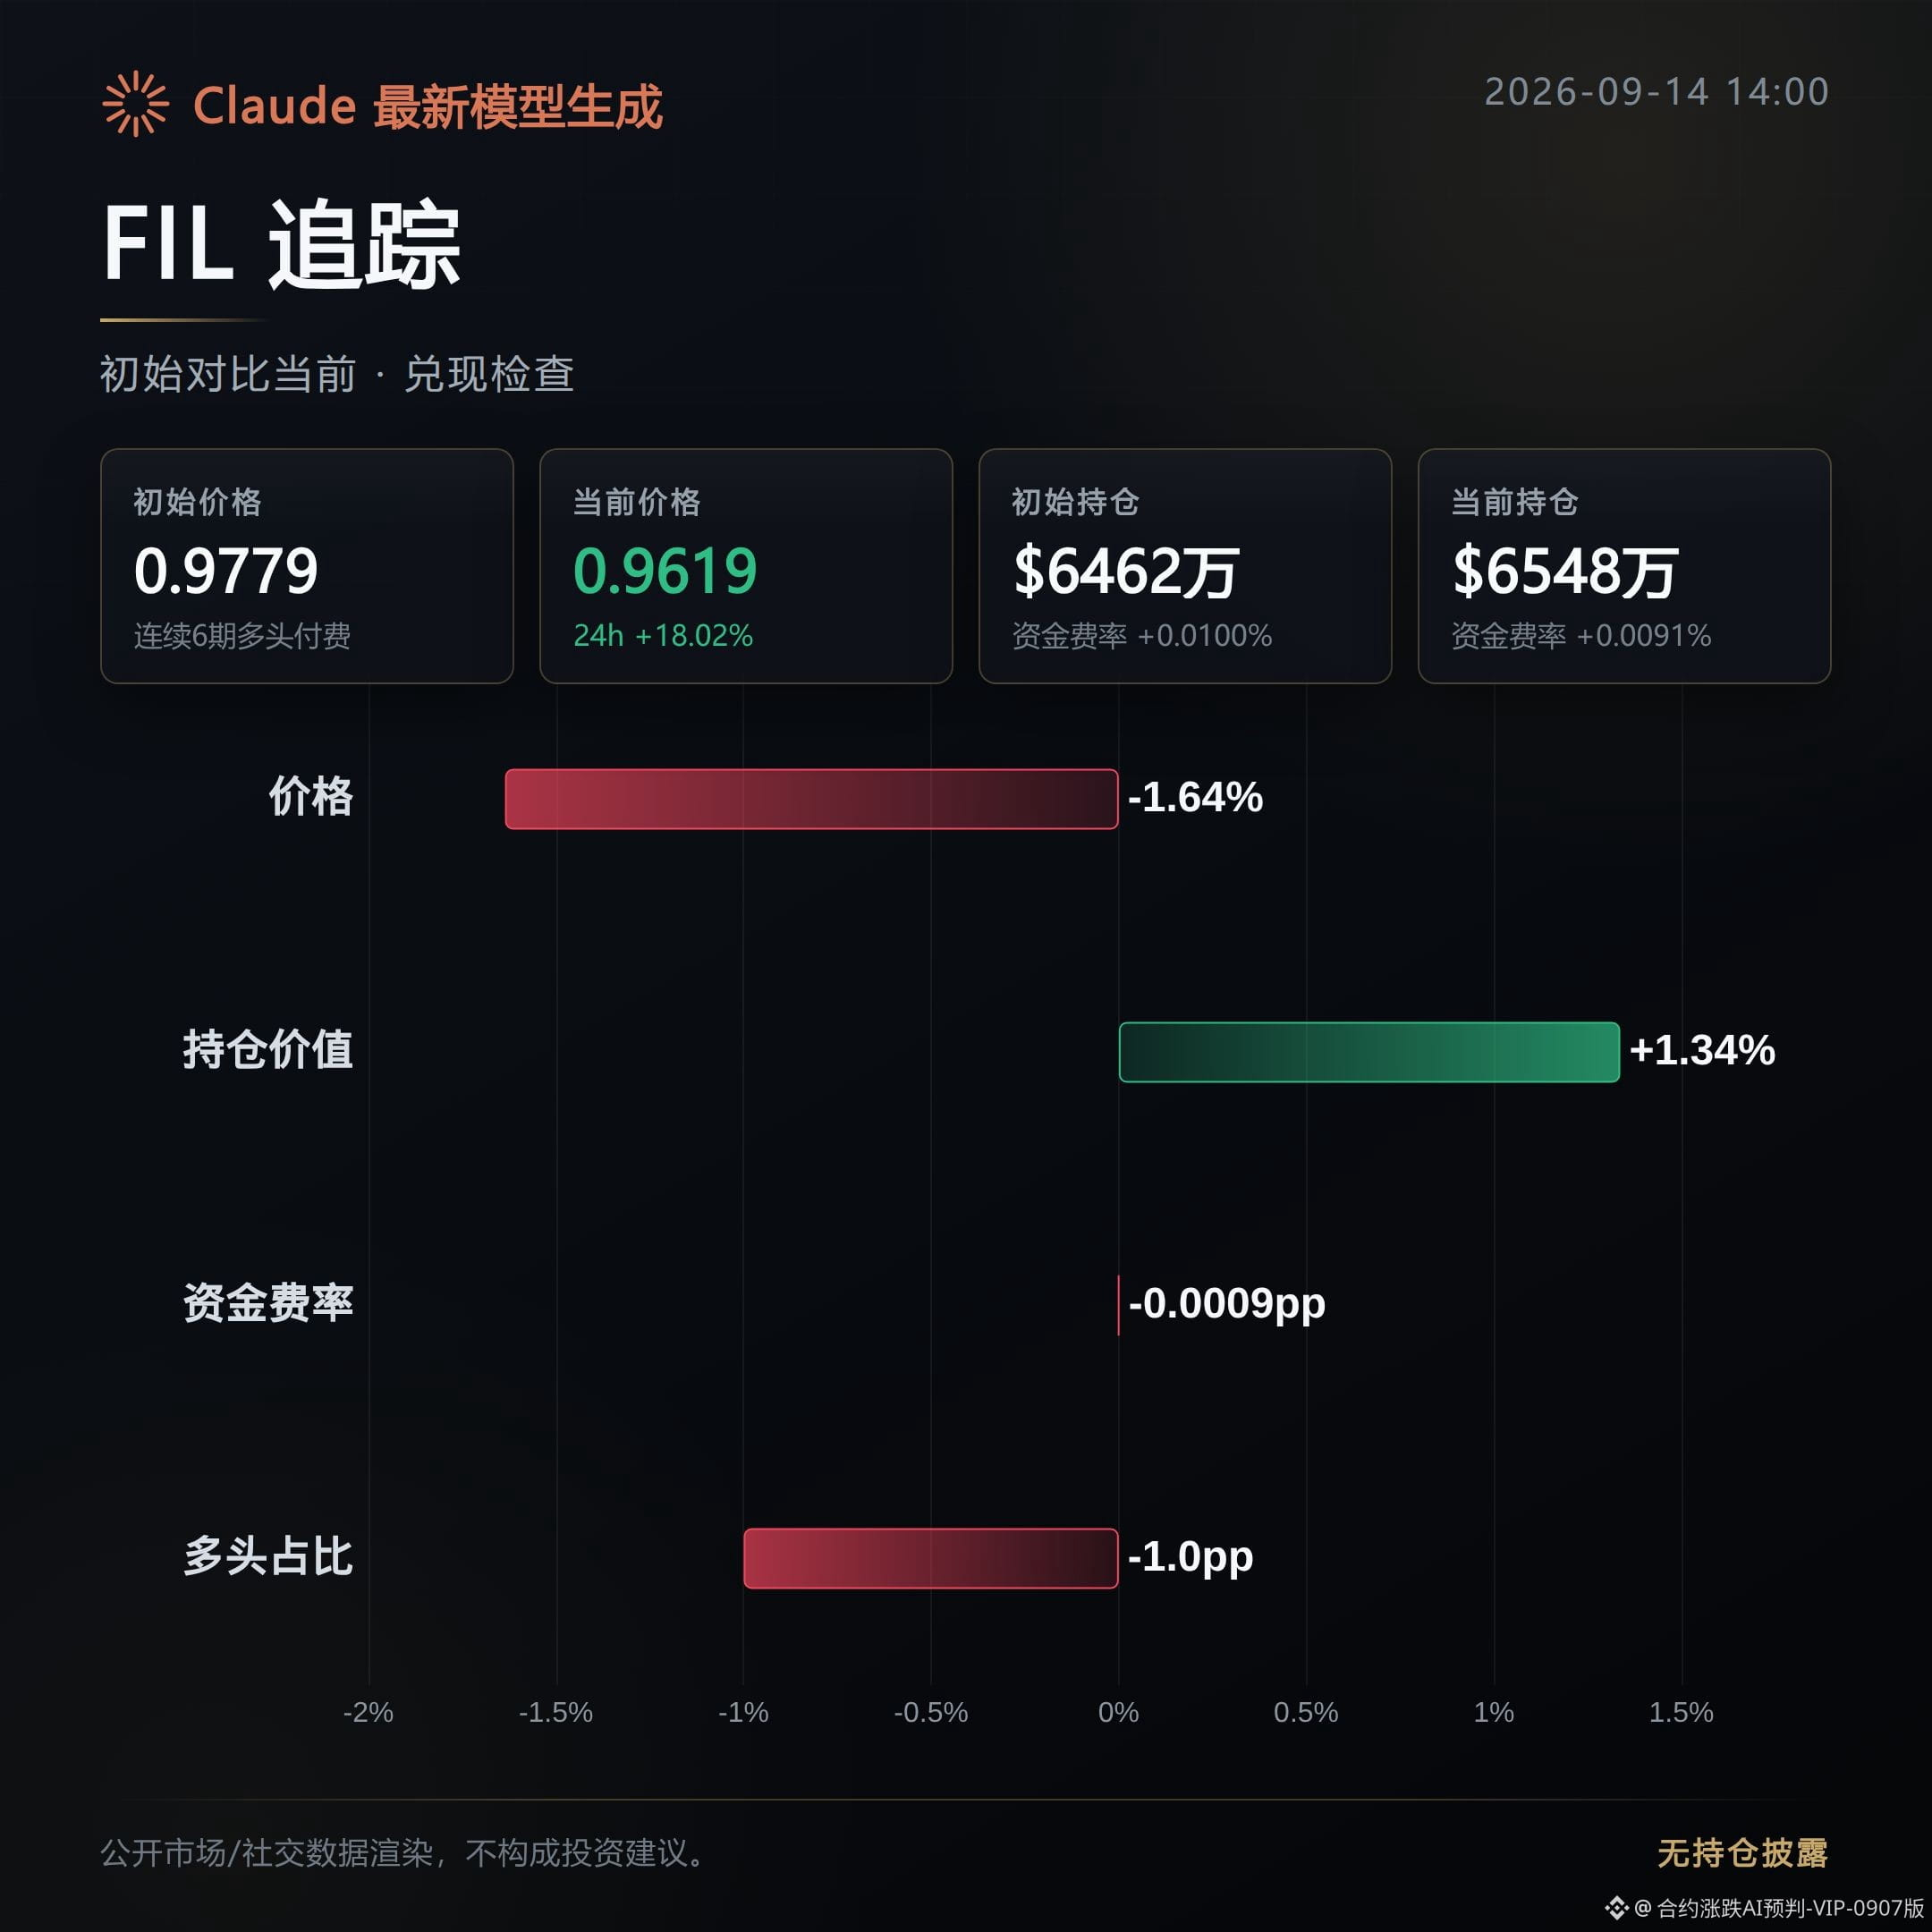
FIL: Wrestled. The morning bullish move still hasn’t come out.
After the initial release, the price dipped slightly by 1.64%, essentially circling around the same level and failing to follow through in the bullish direction.
More importantly, the ratio of buy-side orders consuming asks dropped from 1.18 to 0.99—buy pressure is weakening. Meanwhile, trading volume expanded by 26.53%, suggesting that bulls and bears are still repeatedly pulling and tugging at this level, with no direction clearly decided.
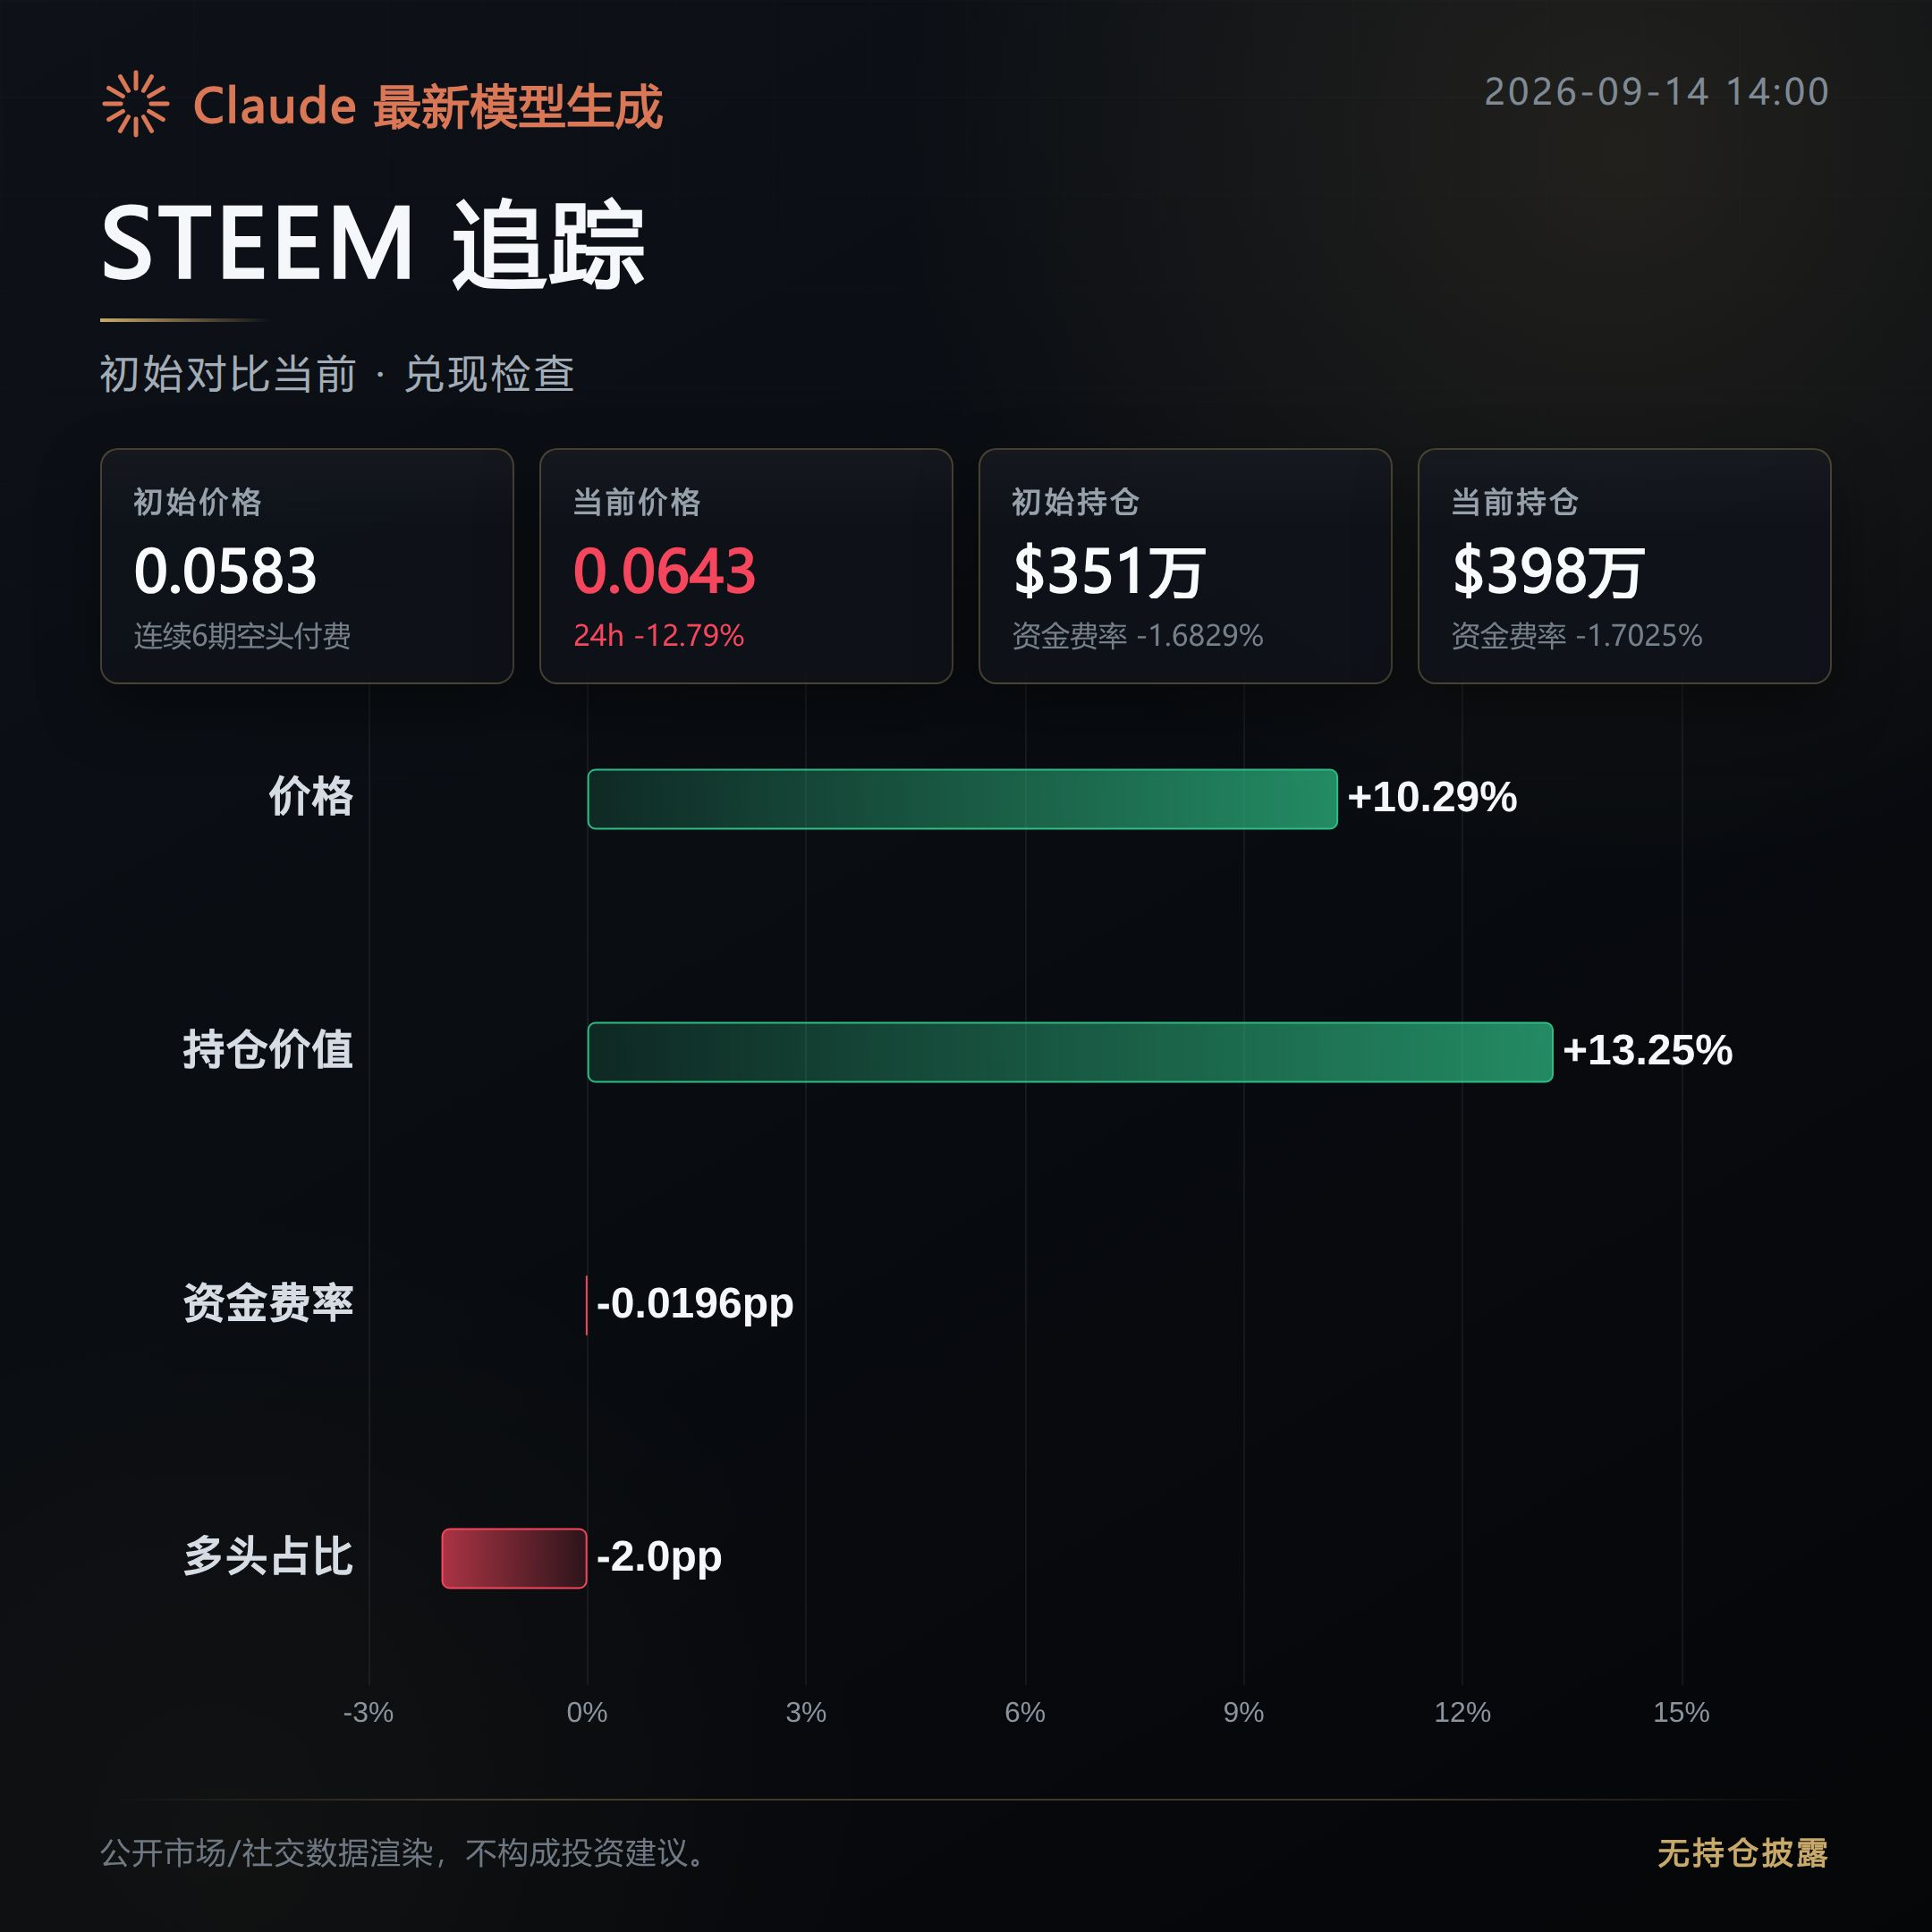
STEEM: Realized. This morning’s bullish line also moved out.
After the initial release, the price continued to climb by 10.29%, reaching 0.06429.
Open interest surged even more, up 13.25% to $3.9795 million—positions are clearly being added. However, the 24-hour increase fell sharply from +9.4% to -12.79%, meaning this move is not a continuation of yesterday’s rise; it’s the fresh momentum added over these few hours.
Next, watch whether the chips can keep following: for LSK and STEEM, check if open interest stays increasing, and whether the aggressive buy-side pressure will weaken.
For FIL, you need to see whether price can truly break away from its original range. After the expansion in volume, if the price still doesn’t rise, that would be a refutation of the morning bullish case and the line will need to be re-examined.
#LSK #FIL #STEEM # Contract recap
Positioning note: This account’s live holdings include $FOGO long positions. The disclosure is to ensure the content matches actual trading.
Prepared with assistance from Claude Fable 5 to help organize the contract data. For information only—please verify on your own.
This is the follow-up recap of that “Pump Observation · Bullish” set from this morning, posted about 5 hours ago. At the initial release, the observation was that the chips were in accumulation.
At the start, there were 3 bullish contracts in the morning; now 2 have moved out, and 1 is still being wrestled—LSK and STEEM have realized, while FIL didn’t catch on.
LSK: Realized. The morning bullish line moved out.
After the initial spike, the price kept rising by 12.66%, reaching 0.83044. The direction didn’t keep flipping back and forth.
Open interest increased in sync by 7.91% to $25.5879 million, indicating that this rally had fresh positioning following along—not just a temporary pump to distribute.
FIL: Wrestled. The morning bullish move still hasn’t come out.
After the initial release, the price dipped slightly by 1.64%, essentially circling around the same level and failing to follow through in the bullish direction.
More importantly, the ratio of buy-side orders consuming asks dropped from 1.18 to 0.99—buy pressure is weakening. Meanwhile, trading volume expanded by 26.53%, suggesting that bulls and bears are still repeatedly pulling and tugging at this level, with no direction clearly decided.
STEEM: Realized. This morning’s bullish line also moved out.
After the initial release, the price continued to climb by 10.29%, reaching 0.06429.
Open interest surged even more, up 13.25% to $3.9795 million—positions are clearly being added. However, the 24-hour increase fell sharply from +9.4% to -12.79%, meaning this move is not a continuation of yesterday’s rise; it’s the fresh momentum added over these few hours.
Next, watch whether the chips can keep following: for LSK and STEEM, check if open interest stays increasing, and whether the aggressive buy-side pressure will weaken.
For FIL, you need to see whether price can truly break away from its original range. After the expansion in volume, if the price still doesn’t rise, that would be a refutation of the morning bullish case and the line will need to be re-examined.
#LSK #FIL #STEEM # Contract recap
Positioning note: This account’s live holdings include $FOGO long positions. The disclosure is to ensure the content matches actual trading.
Prepared with assistance from Claude Fable 5 to help organize the contract data. For information only—please verify on your own.
At the start, there were 3 bullish contracts in the morning; now 2 have moved out, and 1 is still being wrestled—LSK and STEEM have realized, while FIL didn’t catch on.
LSK: Realized. The morning bullish line moved out.
After the initial spike, the price kept rising by 12.66%, reaching 0.83044. The direction didn’t keep flipping back and forth.
Open interest increased in sync by 7.91% to $25.5879 million, indicating that this rally had fresh positioning following along—not just a temporary pump to distribute.
FIL: Wrestled. The morning bullish move still hasn’t come out.
After the initial release, the price dipped slightly by 1.64%, essentially circling around the same level and failing to follow through in the bullish direction.
More importantly, the ratio of buy-side orders consuming asks dropped from 1.18 to 0.99—buy pressure is weakening. Meanwhile, trading volume expanded by 26.53%, suggesting that bulls and bears are still repeatedly pulling and tugging at this level, with no direction clearly decided.
STEEM: Realized. This morning’s bullish line also moved out.
After the initial release, the price continued to climb by 10.29%, reaching 0.06429.
Open interest surged even more, up 13.25% to $3.9795 million—positions are clearly being added. However, the 24-hour increase fell sharply from +9.4% to -12.79%, meaning this move is not a continuation of yesterday’s rise; it’s the fresh momentum added over these few hours.
Next, watch whether the chips can keep following: for LSK and STEEM, check if open interest stays increasing, and whether the aggressive buy-side pressure will weaken.
For FIL, you need to see whether price can truly break away from its original range. After the expansion in volume, if the price still doesn’t rise, that would be a refutation of the morning bullish case and the line will need to be re-examined.
#LSK #FIL #STEEM # Contract recap
Positioning note: This account’s live holdings include $FOGO long positions. The disclosure is to ensure the content matches actual trading.
Prepared with assistance from Claude Fable 5 to help organize the contract data. For information only—please verify on your own.
450
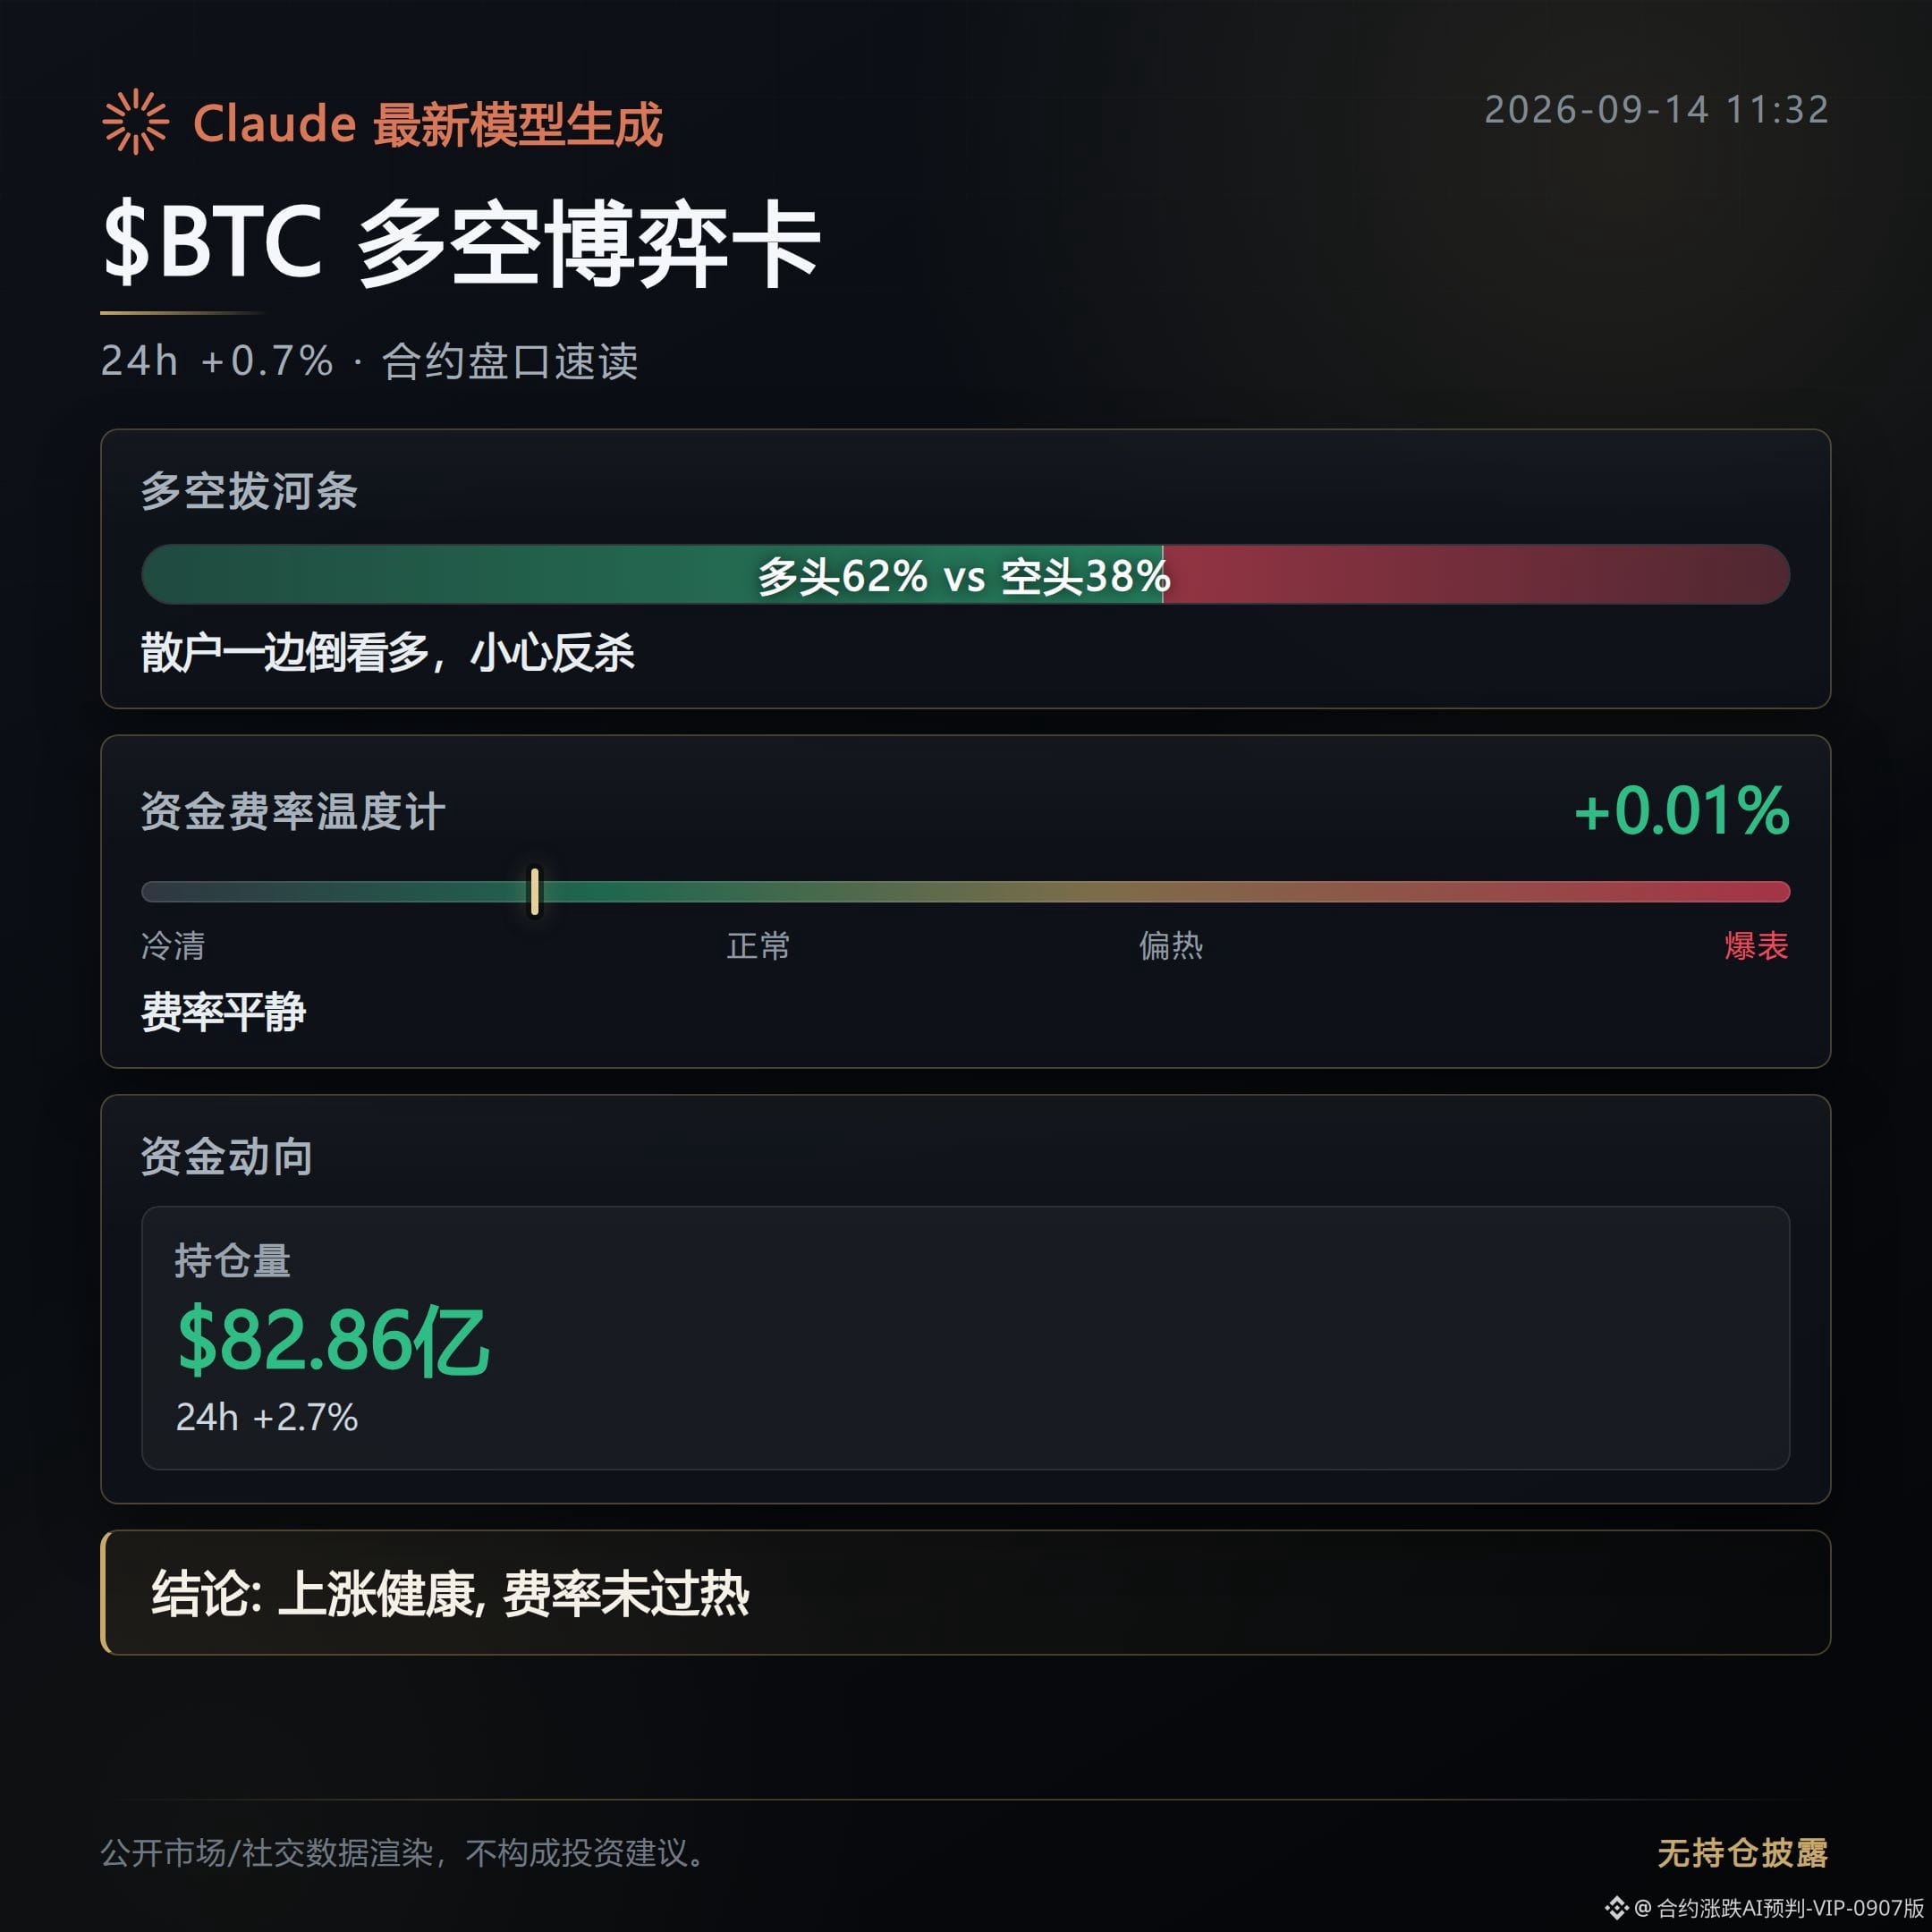
Contract Order Book Daily Report|9/14 Midday: Longs are bunched up, but funding rates stay cautious
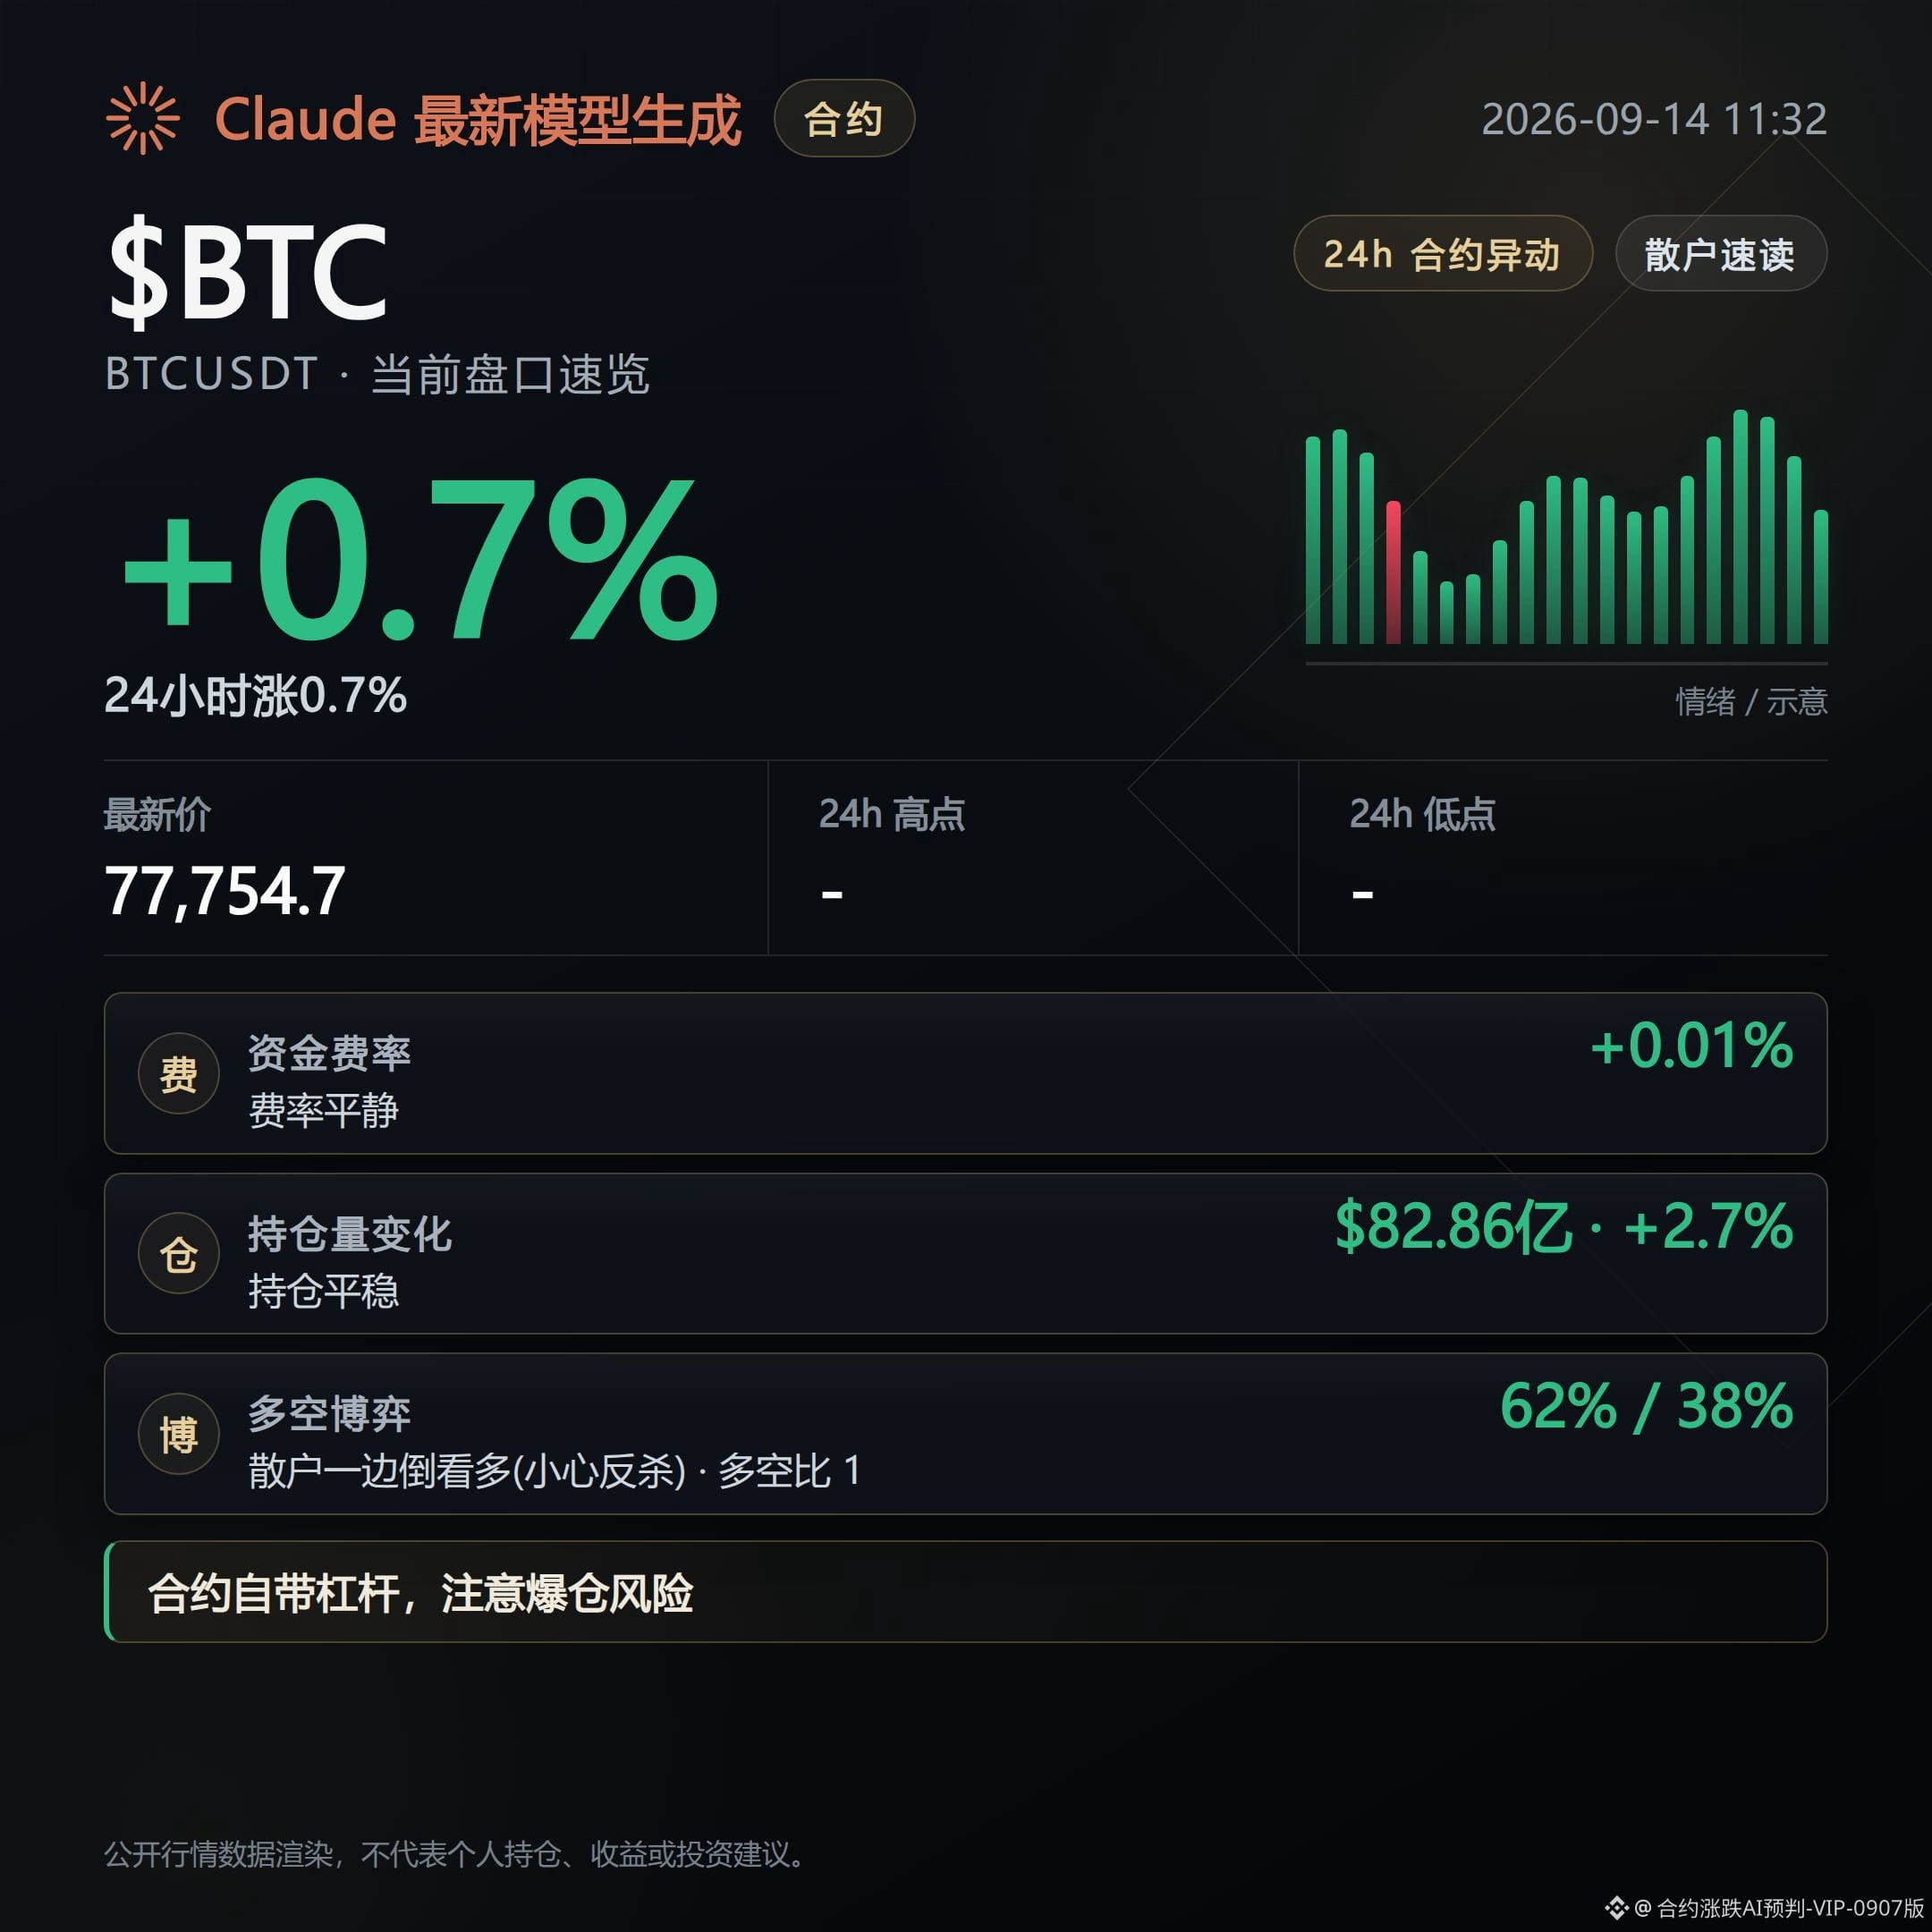
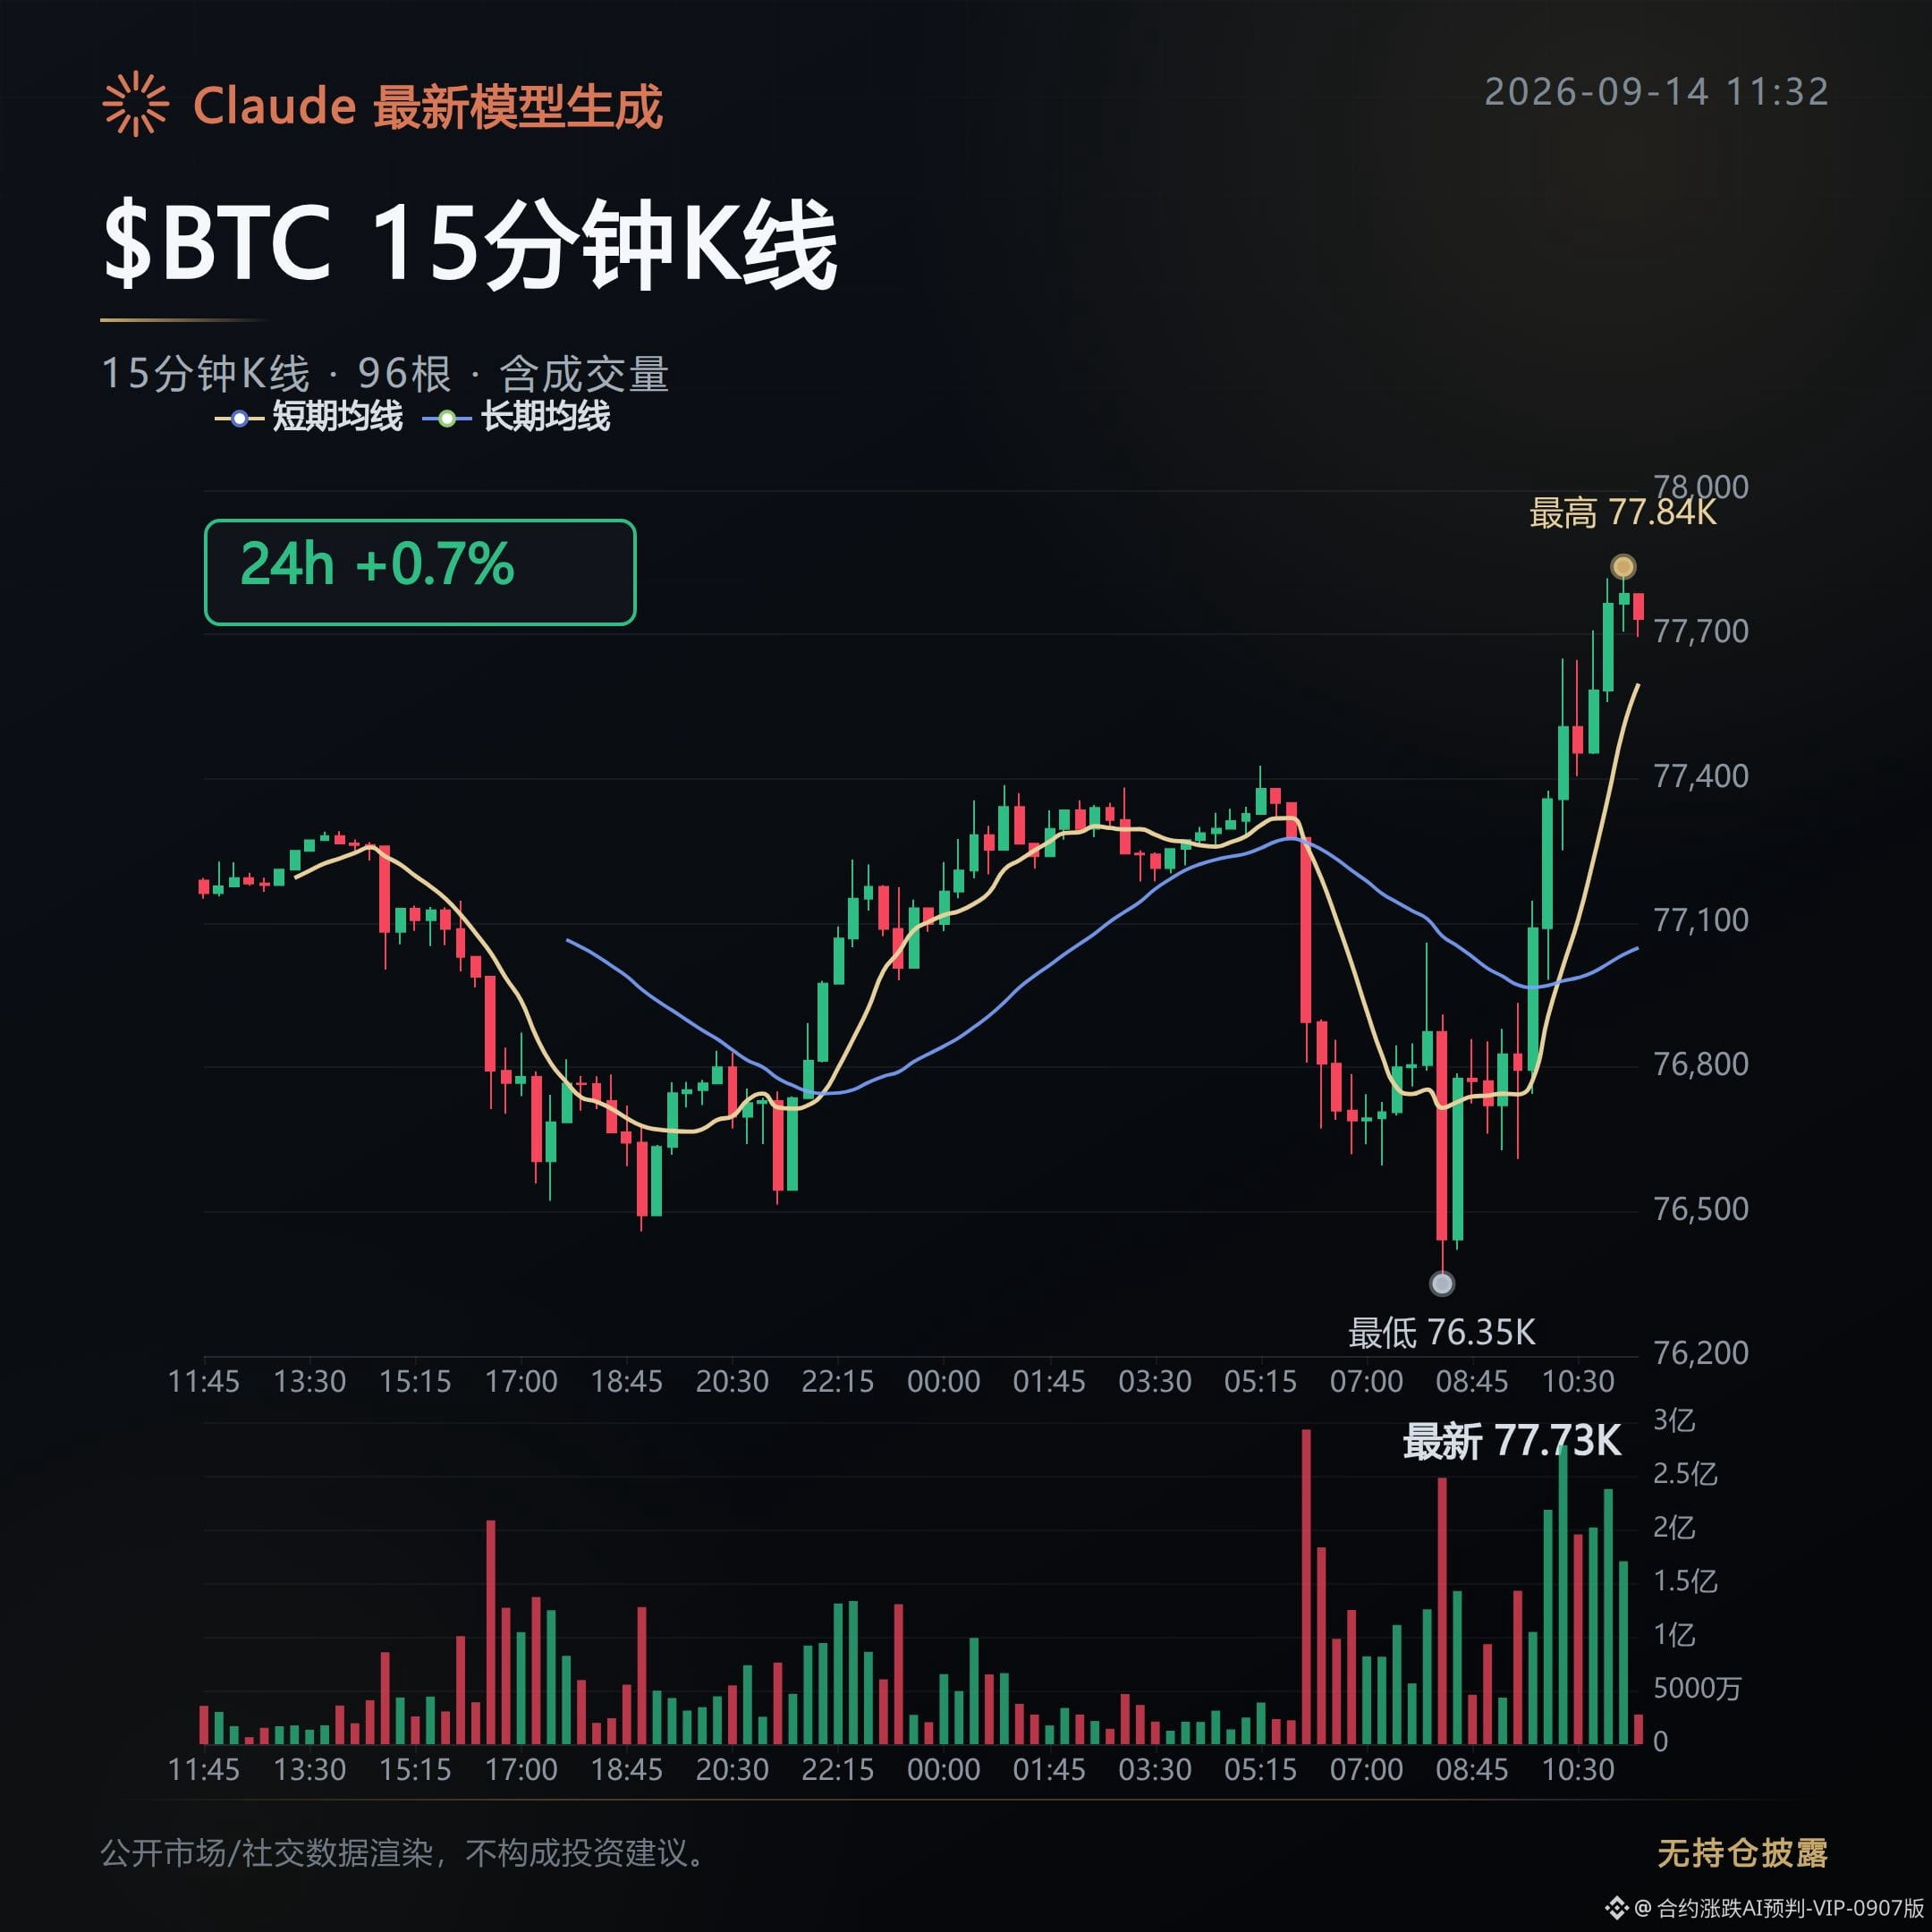
$BTC spot price is 77,754 USD, up 0.68%.
Open interest is 8.286 billion USD, up 2.7% month-over-month. Longs make up 62%. The passive-buy order ratio is 1.21, and buy orders are sweeping aggressively.
The funding rate is only 0.01%. The longs didn’t pay extra for this position, suggesting this rally was built slowly rather than “snapped up” in a frenzy.
Today, U.S. Treasury Secretary Bessent urged support for Waller as the next Fed Chair, expressing confidence in the path for inflation and growth.
Statements that stabilize expectations, combined with rising open interest, look like funds are adding positions through this window gradually—not炒作 driven by emotion.
ETH funding rate is 0.0047%, down 0.23%; BNB funding rate is 0.005%, down 0.55%. Both are falling, but the rates haven’t collapsed, indicating selling pressure isn’t severe.
SOL is the only one moving against the trend. Its funding rate has turned negative to -0.0018%, down 0.75%. Shorts are willing to pay to open shorts, showing sentiment is clearly lagging.
For short-squeeze candidates, keep a close eye on ARK, STEEM, and POWR. Their funding rates are hovering around -2%. Shorts are carrying high costs—any rebound could easily liquidate them.
For long-squeeze candidates, new faces have emerged. Funding rates on stock-token contracts like SKHYNIX, ZHIPU, and HK0625 have turned slightly positive, indicating longs are slowly accumulating.
Right on the heels of another piece of news: trading volume for stock-token contracts on the Base chain surged from zero to one hundred million USD in a single day over 26 days. This line is starting to gain momentum, and with positions piling up, they’re also afraid of a pullback.
Fear & Greed Index is 57—still in the “Greed” zone, but not that crazy.
With positions rising, funding rates not keeping up, and stock-token contracts quietly building long exposure, just watch those three lines closely.
Position note: This account holds $FOGO long positions in real funds; this disclosure is to keep the content consistent with actual trading.
Compiled with assistance from Claude Fable 5. For informational reference only—please verify independently.
Contract Order Book Daily Report|9/14 Midday: Longs are bunched up, but funding rates stay cautious
$BTC spot price is 77,754 USD, up 0.68%.
Open interest is 8.286 billion USD, up 2.7% month-over-month. Longs make up 62%. The passive-buy order ratio is 1.21, and buy orders are sweeping aggressively.
The funding rate is only 0.01%. The longs didn’t pay extra for this position, suggesting this rally was built slowly rather than “snapped up” in a frenzy.
Today, U.S. Treasury Secretary Bessent urged support for Waller as the next Fed Chair, expressing confidence in the path for inflation and growth.
Statements that stabilize expectations, combined with rising open interest, look like funds are adding positions through this window gradually—not炒作 driven by emotion.
ETH funding rate is 0.0047%, down 0.23%; BNB funding rate is 0.005%, down 0.55%. Both are falling, but the rates haven’t collapsed, indicating selling pressure isn’t severe.
SOL is the only one moving against the trend. Its funding rate has turned negative to -0.0018%, down 0.75%. Shorts are willing to pay to open shorts, showing sentiment is clearly lagging.
For short-squeeze candidates, keep a close eye on ARK, STEEM, and POWR. Their funding rates are hovering around -2%. Shorts are carrying high costs—any rebound could easily liquidate them.
For long-squeeze candidates, new faces have emerged. Funding rates on stock-token contracts like SKHYNIX, ZHIPU, and HK0625 have turned slightly positive, indicating longs are slowly accumulating.
Right on the heels of another piece of news: trading volume for stock-token contracts on the Base chain surged from zero to one hundred million USD in a single day over 26 days. This line is starting to gain momentum, and with positions piling up, they’re also afraid of a pullback.
Fear & Greed Index is 57—still in the “Greed” zone, but not that crazy.
With positions rising, funding rates not keeping up, and stock-token contracts quietly building long exposure, just watch those three lines closely.
Position note: This account holds $FOGO long positions in real funds; this disclosure is to keep the content consistent with actual trading.
Compiled with assistance from Claude Fable 5. For informational reference only—please verify independently.
$BTC spot price is 77,754 USD, up 0.68%.
Open interest is 8.286 billion USD, up 2.7% month-over-month. Longs make up 62%. The passive-buy order ratio is 1.21, and buy orders are sweeping aggressively.
The funding rate is only 0.01%. The longs didn’t pay extra for this position, suggesting this rally was built slowly rather than “snapped up” in a frenzy.
Today, U.S. Treasury Secretary Bessent urged support for Waller as the next Fed Chair, expressing confidence in the path for inflation and growth.
Statements that stabilize expectations, combined with rising open interest, look like funds are adding positions through this window gradually—not炒作 driven by emotion.
ETH funding rate is 0.0047%, down 0.23%; BNB funding rate is 0.005%, down 0.55%. Both are falling, but the rates haven’t collapsed, indicating selling pressure isn’t severe.
SOL is the only one moving against the trend. Its funding rate has turned negative to -0.0018%, down 0.75%. Shorts are willing to pay to open shorts, showing sentiment is clearly lagging.
For short-squeeze candidates, keep a close eye on ARK, STEEM, and POWR. Their funding rates are hovering around -2%. Shorts are carrying high costs—any rebound could easily liquidate them.
For long-squeeze candidates, new faces have emerged. Funding rates on stock-token contracts like SKHYNIX, ZHIPU, and HK0625 have turned slightly positive, indicating longs are slowly accumulating.
Right on the heels of another piece of news: trading volume for stock-token contracts on the Base chain surged from zero to one hundred million USD in a single day over 26 days. This line is starting to gain momentum, and with positions piling up, they’re also afraid of a pullback.
Fear & Greed Index is 57—still in the “Greed” zone, but not that crazy.
With positions rising, funding rates not keeping up, and stock-token contracts quietly building long exposure, just watch those three lines closely.
Position note: This account holds $FOGO long positions in real funds; this disclosure is to keep the content consistent with actual trading.
Compiled with assistance from Claude Fable 5. For informational reference only—please verify independently.
410
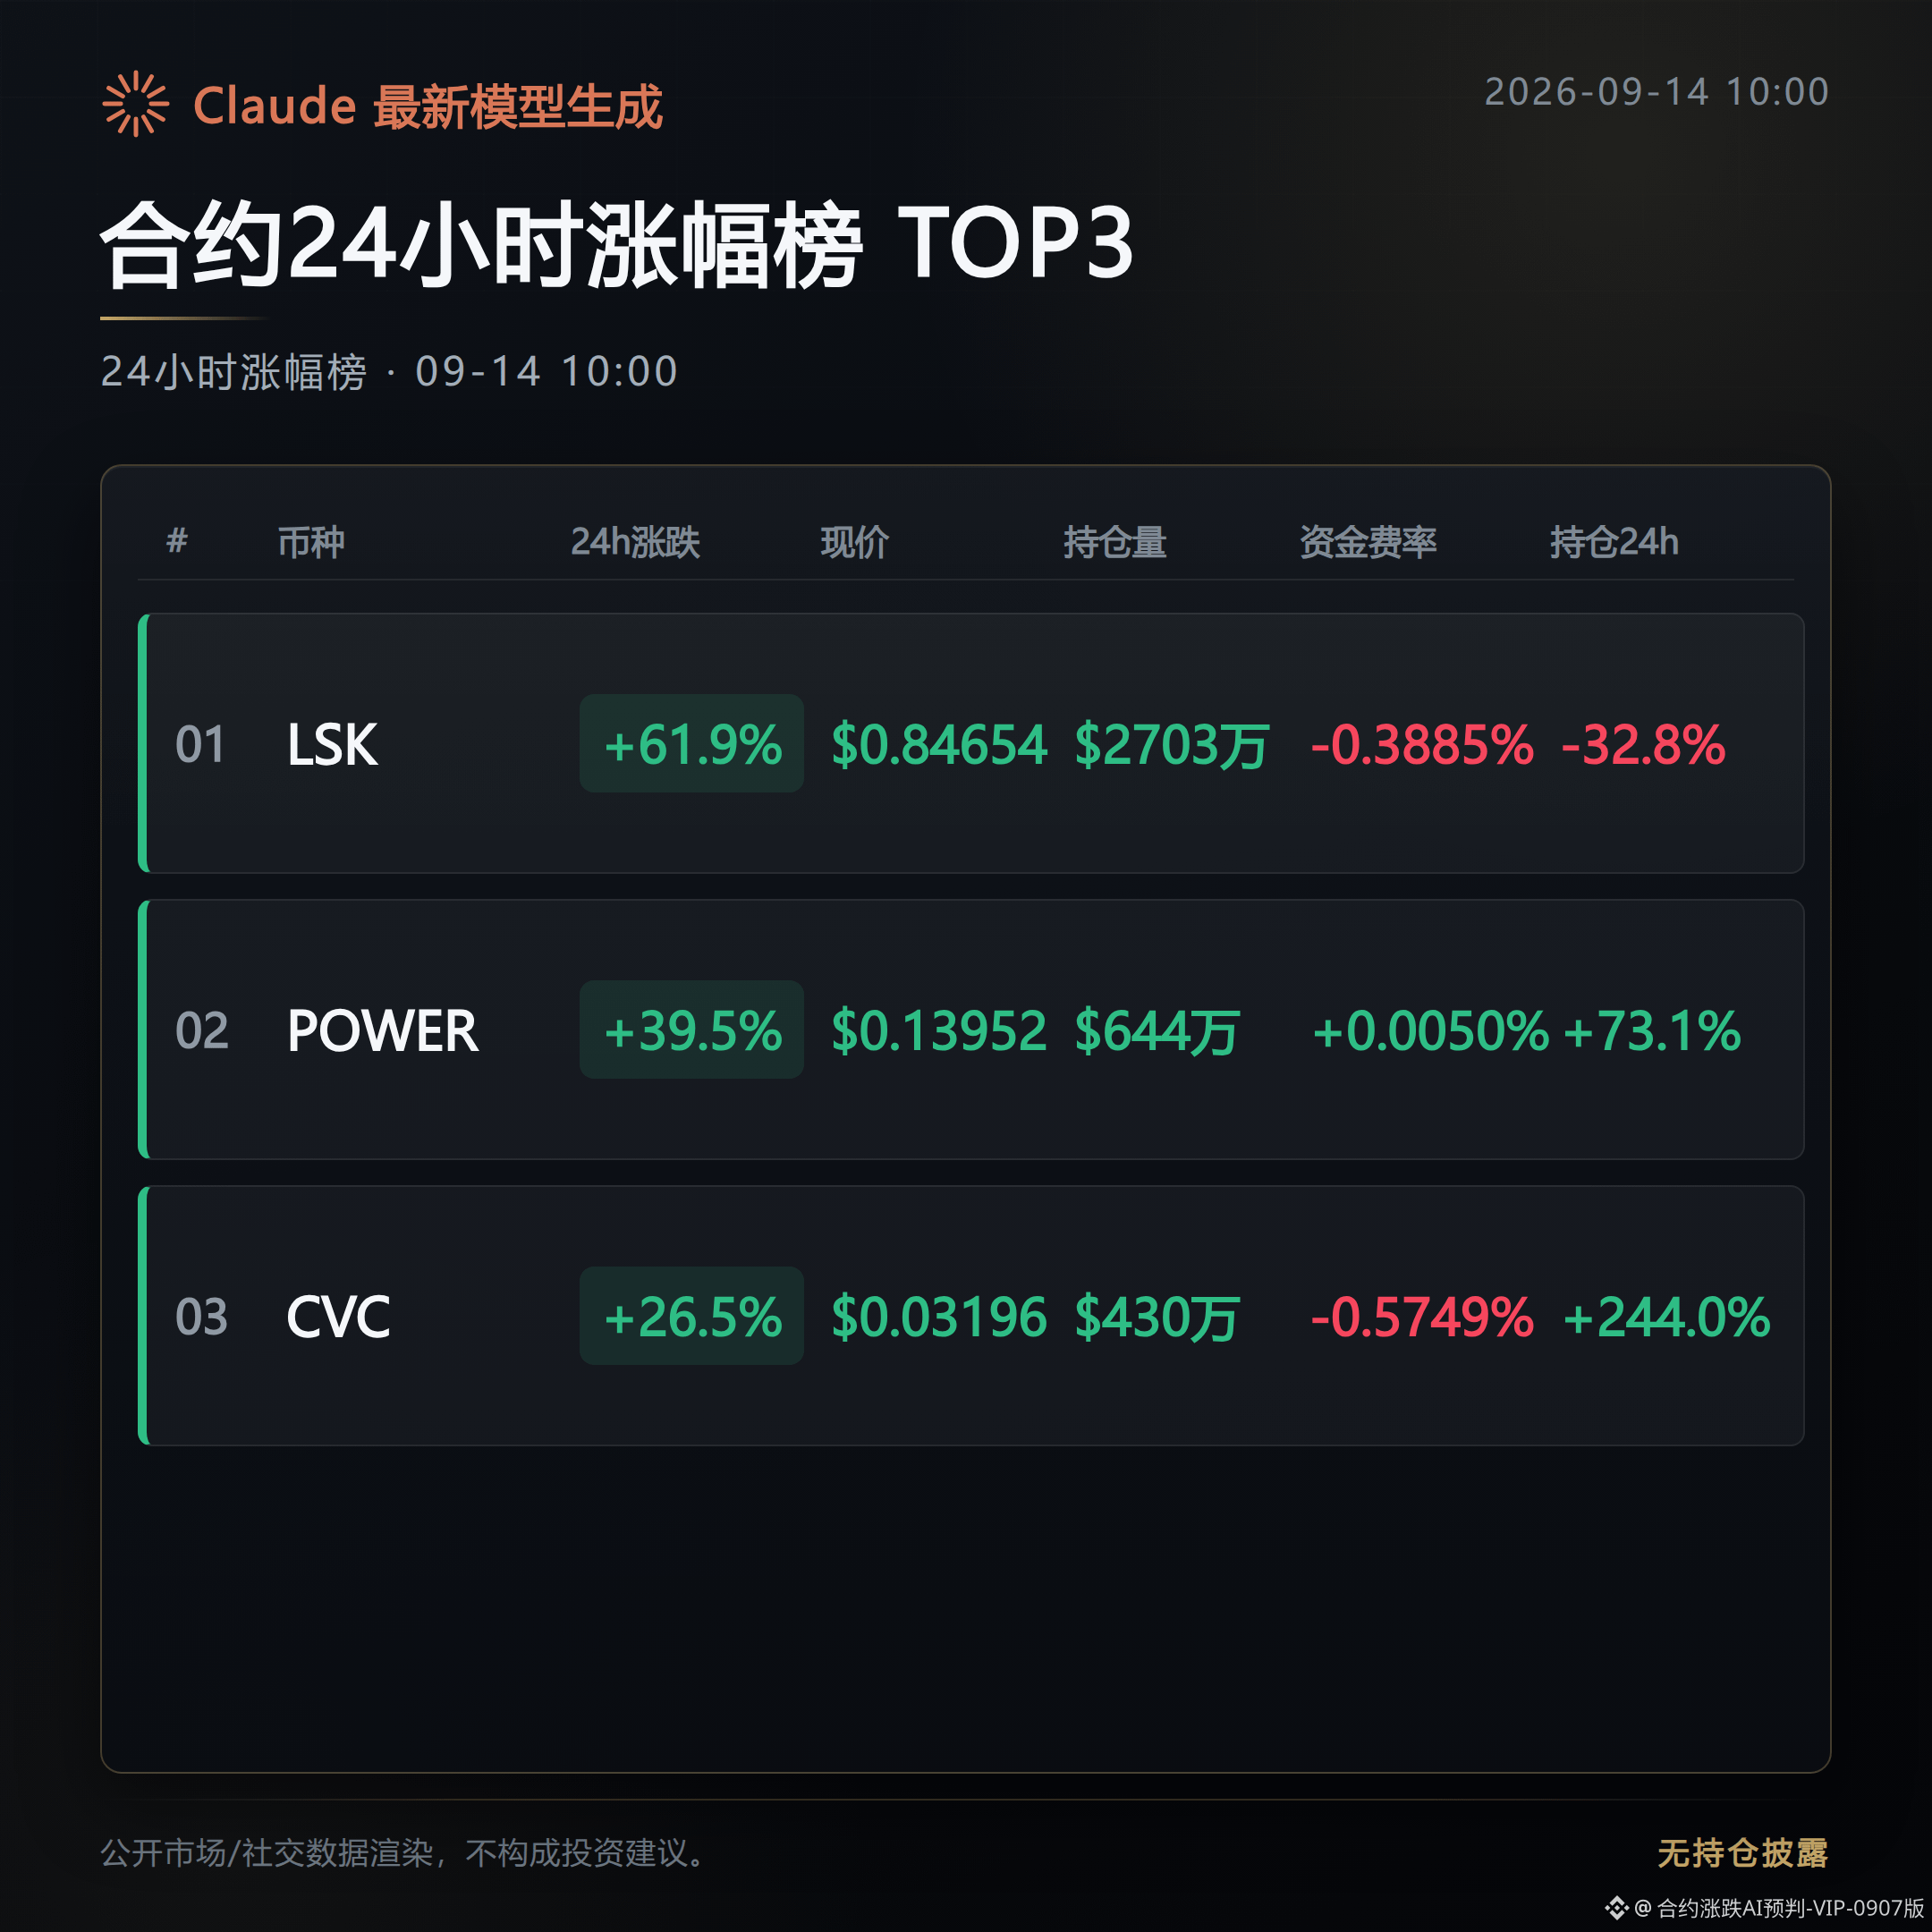
It is currently 10:00 Beijing time. Let’s quickly scan Binance’s 24-hour contract top movers in the morning order book: the top 3 are LSK, POWER, and CVC.
From a risk-control trader’s perspective, for each coin we pick only one verifiable signal, and also specify when that signal becomes invalid.
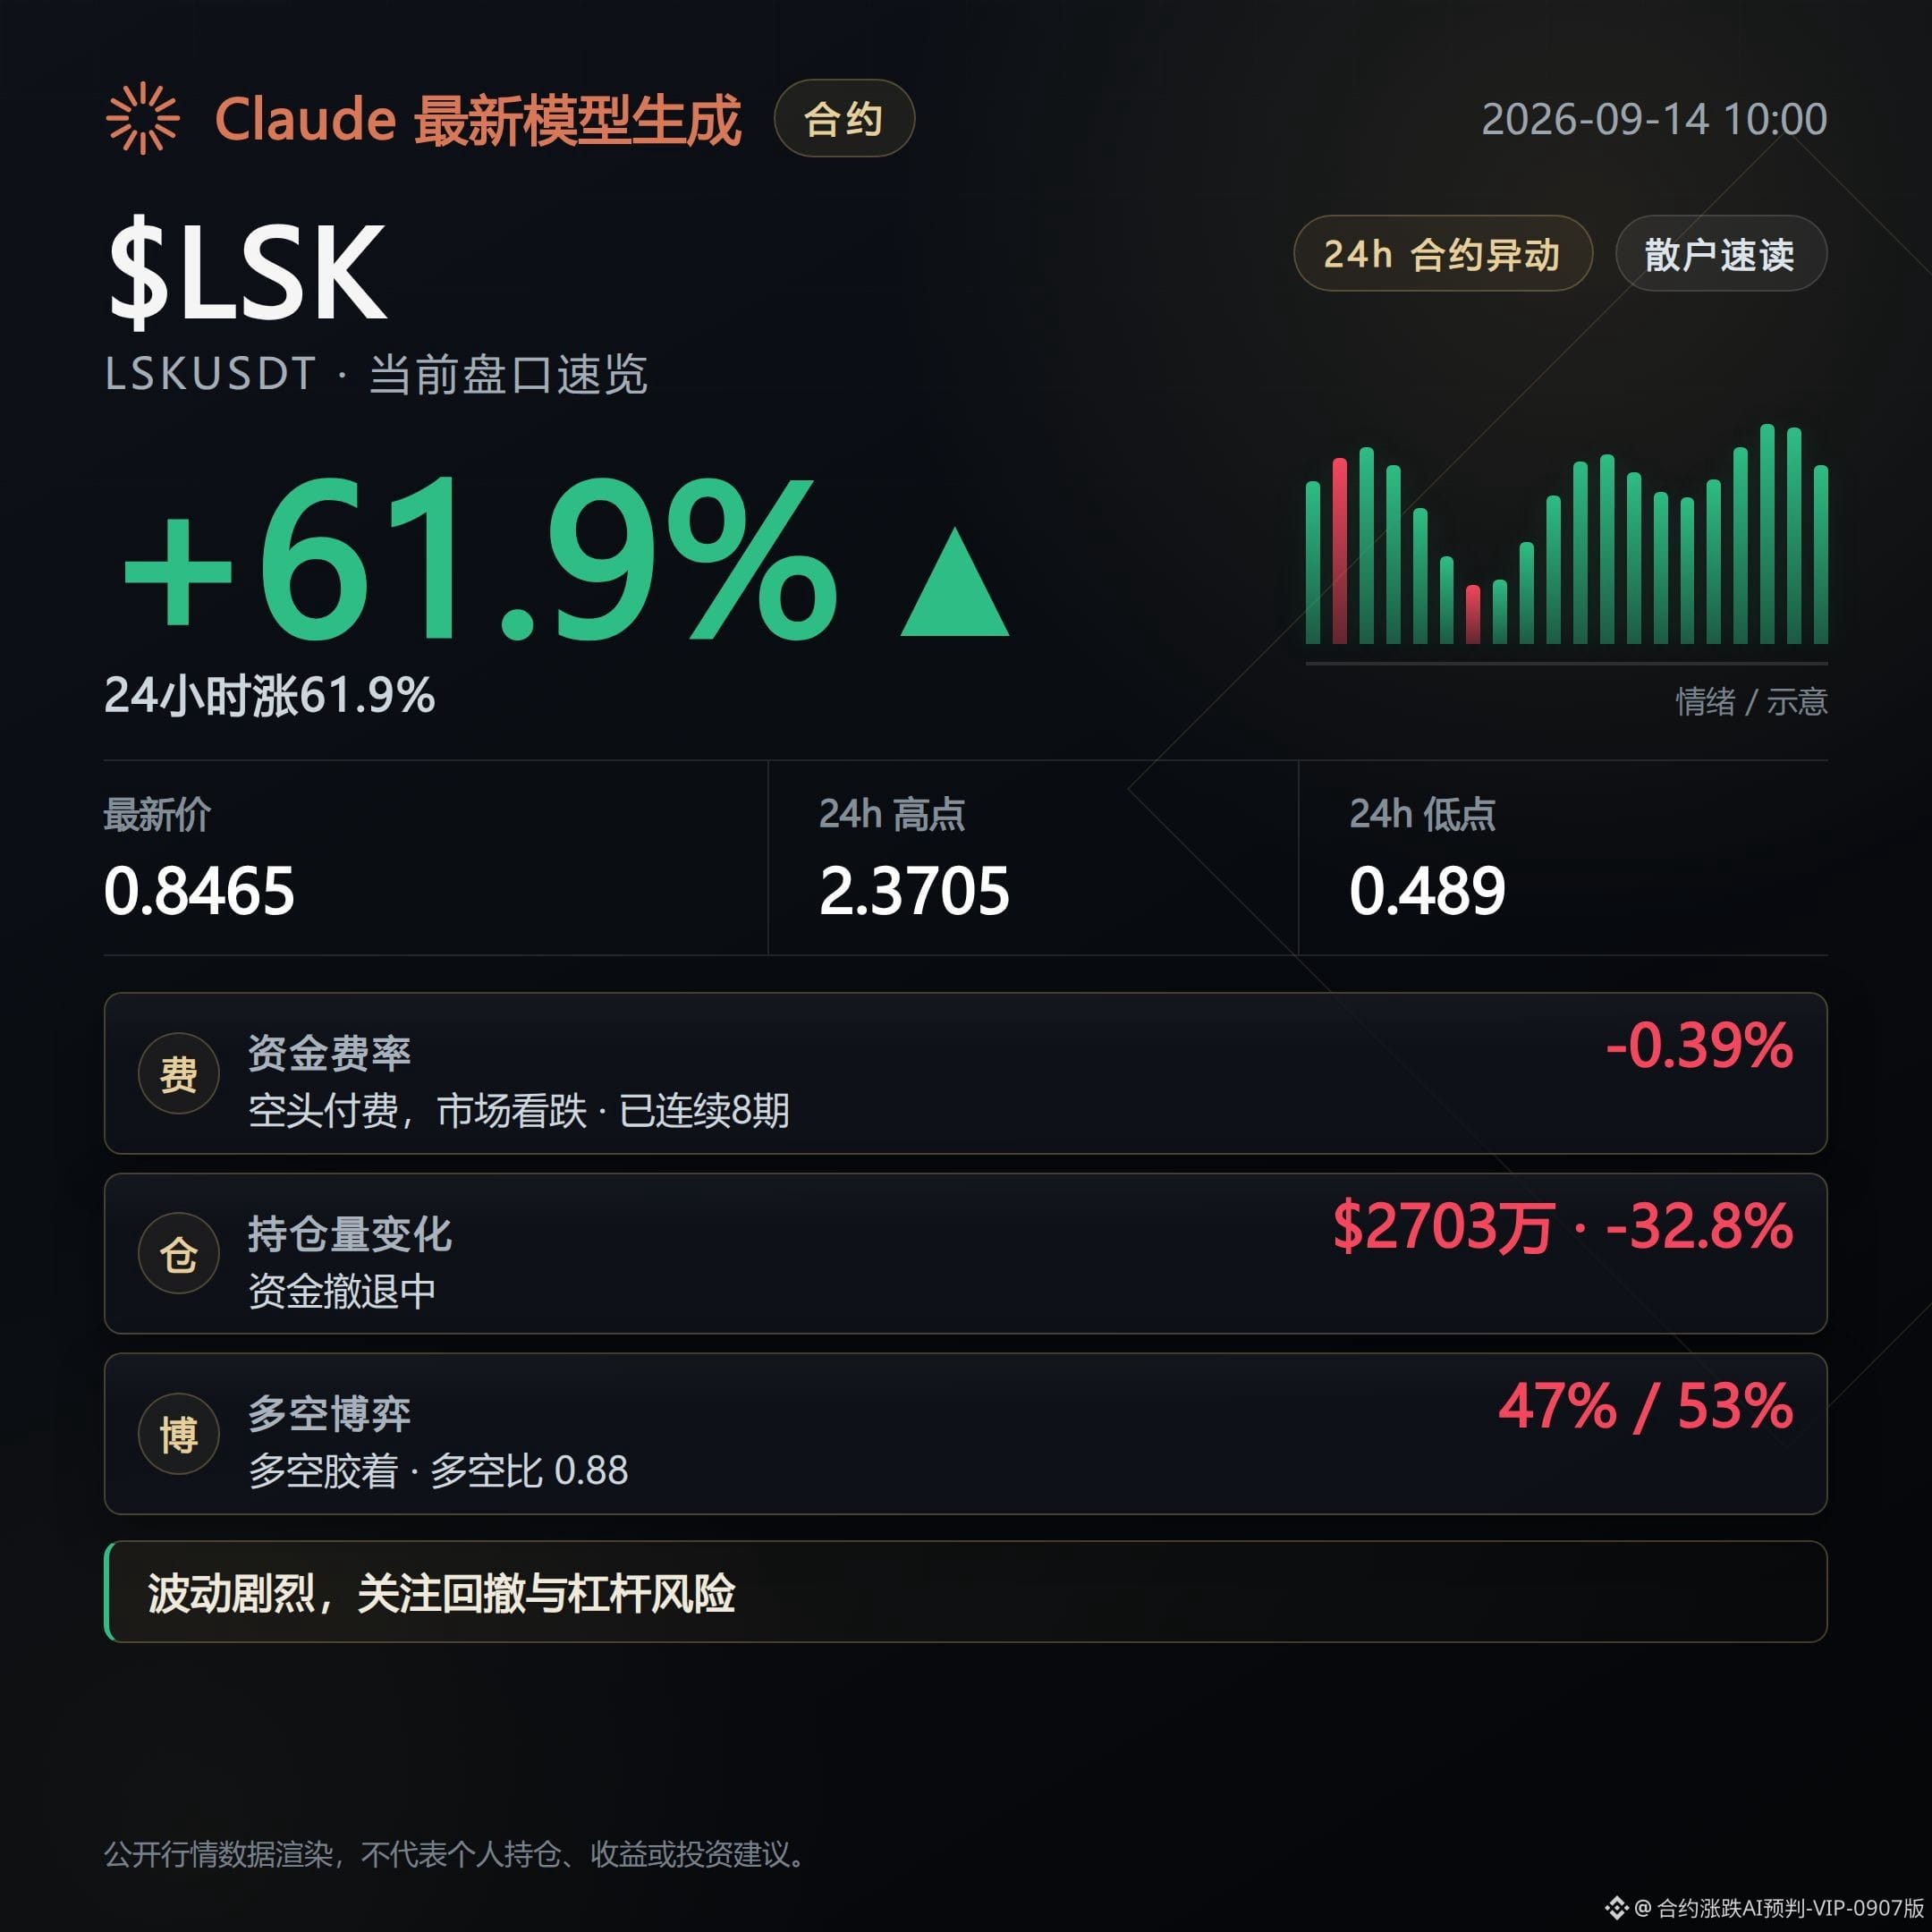
LSK is up 61.89% over 24 hours, but during the same period the open interest has decreased by 32.8%, and over the most recent 1 hour the open interest is still falling by 8.5%.
Price is rising while open interest is shrinking—this divergence looks more like short-side capital exiting pushing the price, rather than new incremental long buying entering.
The ratio of aggressive buy order share is 0.98: the short-term buy pressure is indeed strong, but the funding rate has already turned negative, with 8 consecutive periods being paid by shorts. The Super Trend indicator is still marking downward.
Signal: When the price rises while open interest is declining, this is a de-leveraging-style rally.
Invalidation condition: If open interest stops falling and turns upward again, it means new capital has re-entered; then this divergence signal no longer holds.
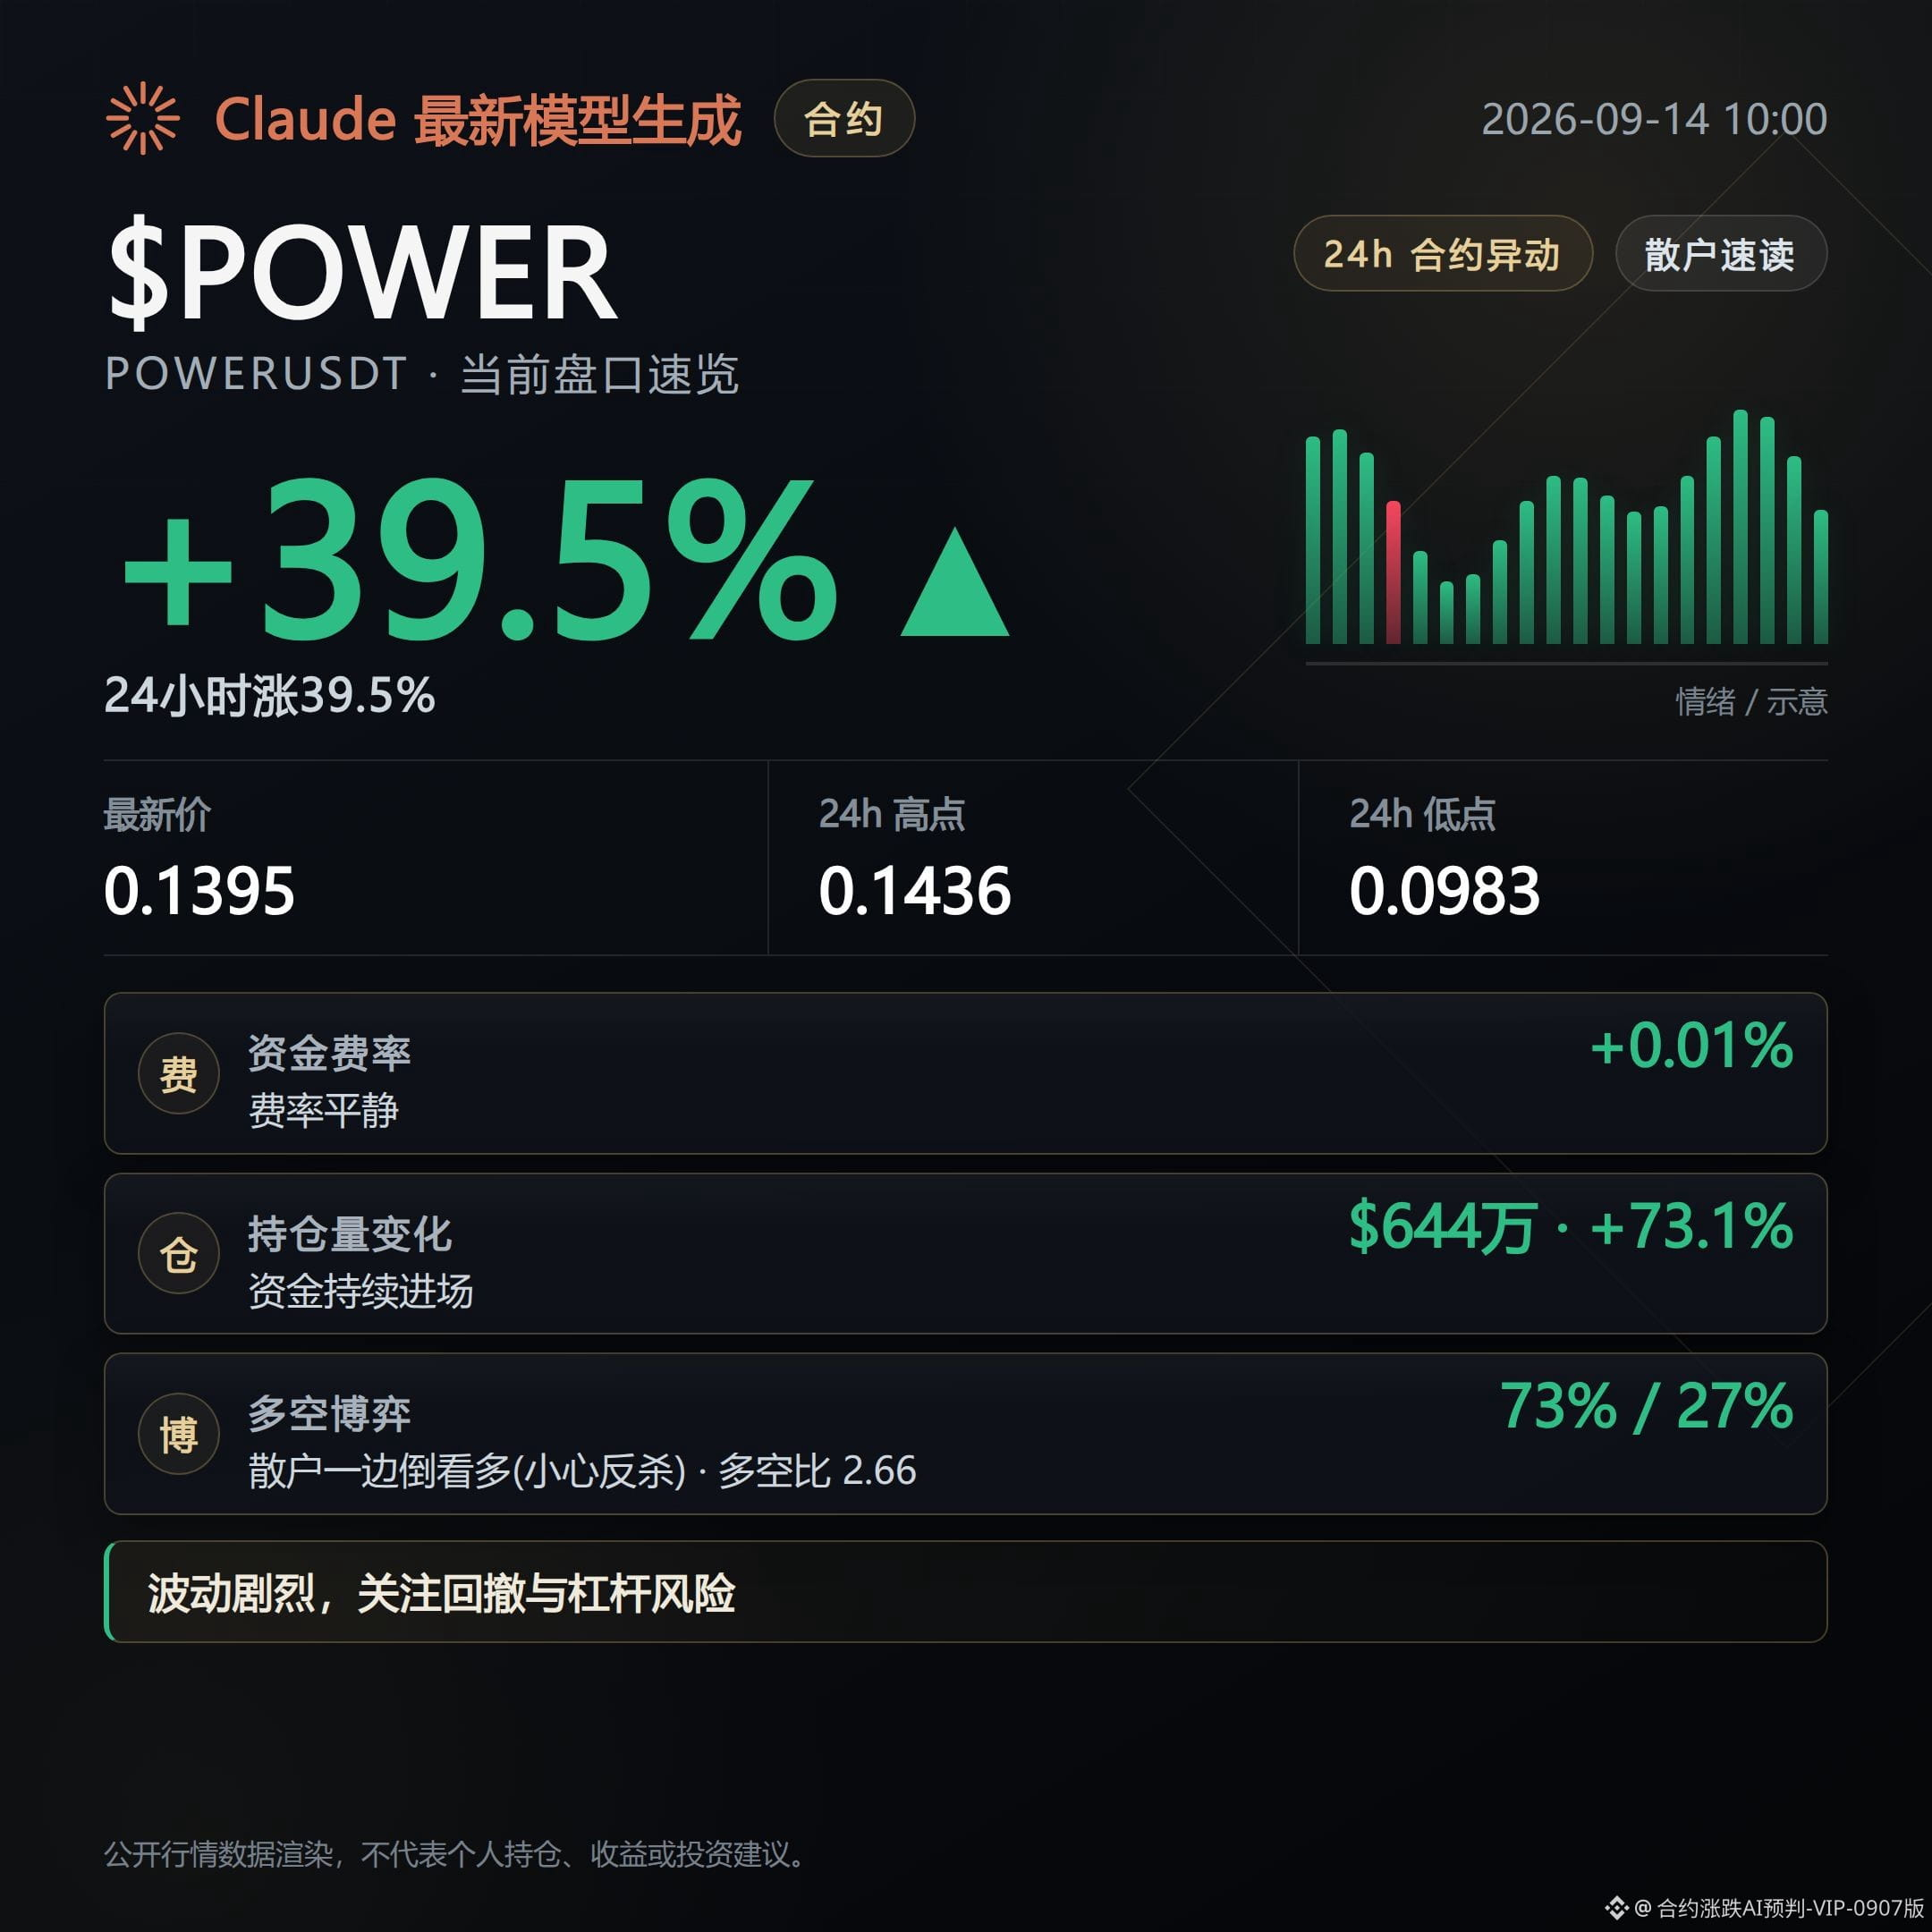
POWER is up 39.53% over 24 hours. Open interest over 24 hours has surged 73.1%, and even in the latest 1 hour the open interest change is still +21.9%. This is a classic price-up with buy-side (long) accumulation / increased open interest pattern.
The long/short account ratio reaches 2.66, with longs accounting for 73%. The relative strength indicator is already 71.6, which places it in the overbought zone, suggesting this rally is accompanied by a fairly concentrated long buildup.
Signal: Price, open interest, and long concentration all move higher at the same time.
Invalidation condition: If the relative strength indicator falls back from the overbought zone, or if the long/short account ratio begins to converge, it indicates the longs’ piled-up positions are ebbing.
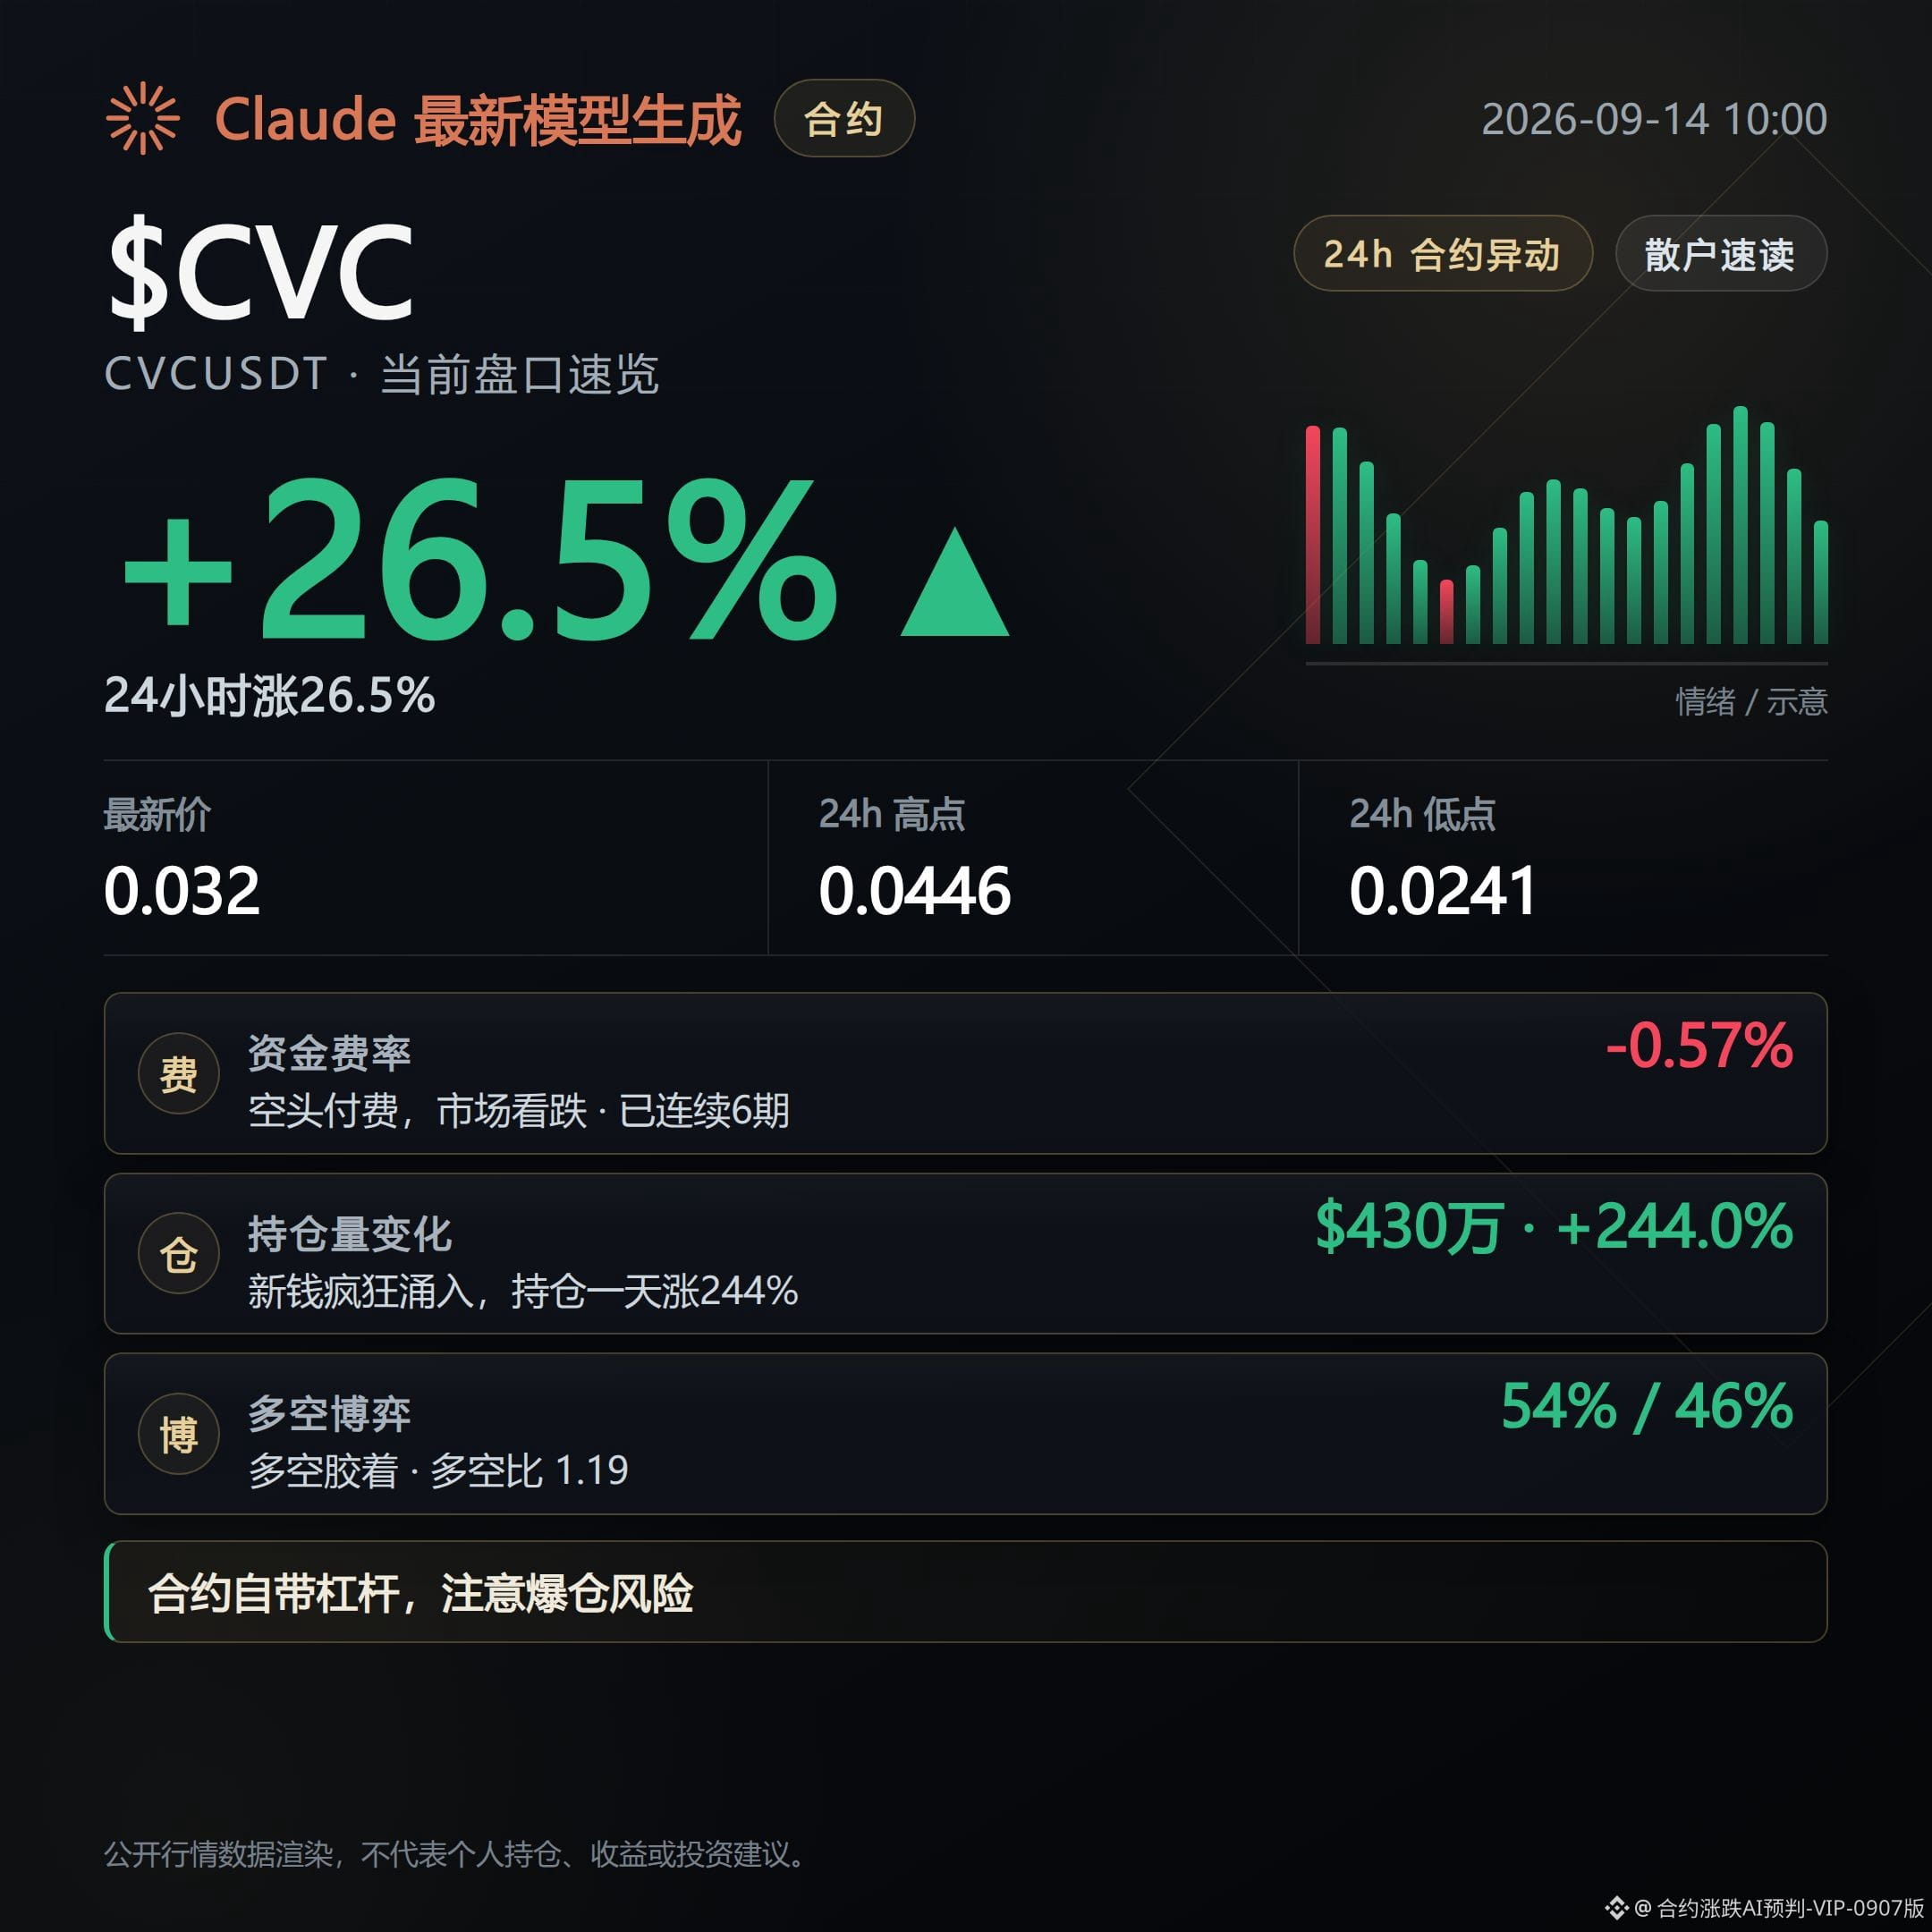
CVC is up 26.47% over 24 hours. Open interest over 24 hours has surged 244%, the most extreme open-interest change among the three.
The funding rate is negative at -0.5749%, and it has been paid by shorts for 6 consecutive periods. The aggressive buy order share is 0.99—meaning shorts in the market have kept paying, yet the price has not weakened.
Signal: Open interest is rapidly accumulating while shorts continue paying and the price still isn’t turning weak.
Invalidation condition: If the funding rate turns positive, or if the price pulls back while open interest does not decline in sync, it means the accumulated positions have not been digested—risk is still building rather than being released.
Common observation level: all three coins have explosive gains over 24 hours accompanied by dramatic open-interest changes—one is de-leveraging (reducing), one is adding (increasing), and one is surging (most extreme). Historically, coins near the top of the gainers list are prone to pullbacks caused by taking profit at high levels.
Don’t chase the price up. Treat each coin’s invalidation conditions as a watch list: reassess when the conditions appear. If they don’t appear, it does not mean the trend will continue indefinitely.
#LSK #POWER #CVC #Contract market data
Live disclosure: This account currently holds $FOGO long contracts. The views in this content are consistent with the actual positions.
This content is generated with assistance from Claude Fable 5. For informational reference only—please verify independently.
It is currently 10:00 Beijing time. Let’s quickly scan Binance’s 24-hour contract top movers in the morning order book: the top 3 are LSK, POWER, and CVC.
From a risk-control trader’s perspective, for each coin we pick only one verifiable signal, and also specify when that signal becomes invalid.
LSK is up 61.89% over 24 hours, but during the same period the open interest has decreased by 32.8%, and over the most recent 1 hour the open interest is still falling by 8.5%.
Price is rising while open interest is shrinking—this divergence looks more like short-side capital exiting pushing the price, rather than new incremental long buying entering.
The ratio of aggressive buy order share is 0.98: the short-term buy pressure is indeed strong, but the funding rate has already turned negative, with 8 consecutive periods being paid by shorts. The Super Trend indicator is still marking downward.
Signal: When the price rises while open interest is declining, this is a de-leveraging-style rally.
Invalidation condition: If open interest stops falling and turns upward again, it means new capital has re-entered; then this divergence signal no longer holds.
POWER is up 39.53% over 24 hours. Open interest over 24 hours has surged 73.1%, and even in the latest 1 hour the open interest change is still +21.9%. This is a classic price-up with buy-side (long) accumulation / increased open interest pattern.
The long/short account ratio reaches 2.66, with longs accounting for 73%. The relative strength indicator is already 71.6, which places it in the overbought zone, suggesting this rally is accompanied by a fairly concentrated long buildup.
Signal: Price, open interest, and long concentration all move higher at the same time.
Invalidation condition: If the relative strength indicator falls back from the overbought zone, or if the long/short account ratio begins to converge, it indicates the longs’ piled-up positions are ebbing.
CVC is up 26.47% over 24 hours. Open interest over 24 hours has surged 244%, the most extreme open-interest change among the three.
The funding rate is negative at -0.5749%, and it has been paid by shorts for 6 consecutive periods. The aggressive buy order share is 0.99—meaning shorts in the market have kept paying, yet the price has not weakened.
Signal: Open interest is rapidly accumulating while shorts continue paying and the price still isn’t turning weak.
Invalidation condition: If the funding rate turns positive, or if the price pulls back while open interest does not decline in sync, it means the accumulated positions have not been digested—risk is still building rather than being released.
Common observation level: all three coins have explosive gains over 24 hours accompanied by dramatic open-interest changes—one is de-leveraging (reducing), one is adding (increasing), and one is surging (most extreme). Historically, coins near the top of the gainers list are prone to pullbacks caused by taking profit at high levels.
Don’t chase the price up. Treat each coin’s invalidation conditions as a watch list: reassess when the conditions appear. If they don’t appear, it does not mean the trend will continue indefinitely.
#LSK #POWER #CVC #Contract market data
Live disclosure: This account currently holds $FOGO long contracts. The views in this content are consistent with the actual positions.
This content is generated with assistance from Claude Fable 5. For informational reference only—please verify independently.
From a risk-control trader’s perspective, for each coin we pick only one verifiable signal, and also specify when that signal becomes invalid.
LSK is up 61.89% over 24 hours, but during the same period the open interest has decreased by 32.8%, and over the most recent 1 hour the open interest is still falling by 8.5%.
Price is rising while open interest is shrinking—this divergence looks more like short-side capital exiting pushing the price, rather than new incremental long buying entering.
The ratio of aggressive buy order share is 0.98: the short-term buy pressure is indeed strong, but the funding rate has already turned negative, with 8 consecutive periods being paid by shorts. The Super Trend indicator is still marking downward.
Signal: When the price rises while open interest is declining, this is a de-leveraging-style rally.
Invalidation condition: If open interest stops falling and turns upward again, it means new capital has re-entered; then this divergence signal no longer holds.
POWER is up 39.53% over 24 hours. Open interest over 24 hours has surged 73.1%, and even in the latest 1 hour the open interest change is still +21.9%. This is a classic price-up with buy-side (long) accumulation / increased open interest pattern.
The long/short account ratio reaches 2.66, with longs accounting for 73%. The relative strength indicator is already 71.6, which places it in the overbought zone, suggesting this rally is accompanied by a fairly concentrated long buildup.
Signal: Price, open interest, and long concentration all move higher at the same time.
Invalidation condition: If the relative strength indicator falls back from the overbought zone, or if the long/short account ratio begins to converge, it indicates the longs’ piled-up positions are ebbing.
CVC is up 26.47% over 24 hours. Open interest over 24 hours has surged 244%, the most extreme open-interest change among the three.
The funding rate is negative at -0.5749%, and it has been paid by shorts for 6 consecutive periods. The aggressive buy order share is 0.99—meaning shorts in the market have kept paying, yet the price has not weakened.
Signal: Open interest is rapidly accumulating while shorts continue paying and the price still isn’t turning weak.
Invalidation condition: If the funding rate turns positive, or if the price pulls back while open interest does not decline in sync, it means the accumulated positions have not been digested—risk is still building rather than being released.
Common observation level: all three coins have explosive gains over 24 hours accompanied by dramatic open-interest changes—one is de-leveraging (reducing), one is adding (increasing), and one is surging (most extreme). Historically, coins near the top of the gainers list are prone to pullbacks caused by taking profit at high levels.
Don’t chase the price up. Treat each coin’s invalidation conditions as a watch list: reassess when the conditions appear. If they don’t appear, it does not mean the trend will continue indefinitely.
#LSK #POWER #CVC #Contract market data
Live disclosure: This account currently holds $FOGO long contracts. The views in this content are consistent with the actual positions.
This content is generated with assistance from Claude Fable 5. For informational reference only—please verify independently.
433
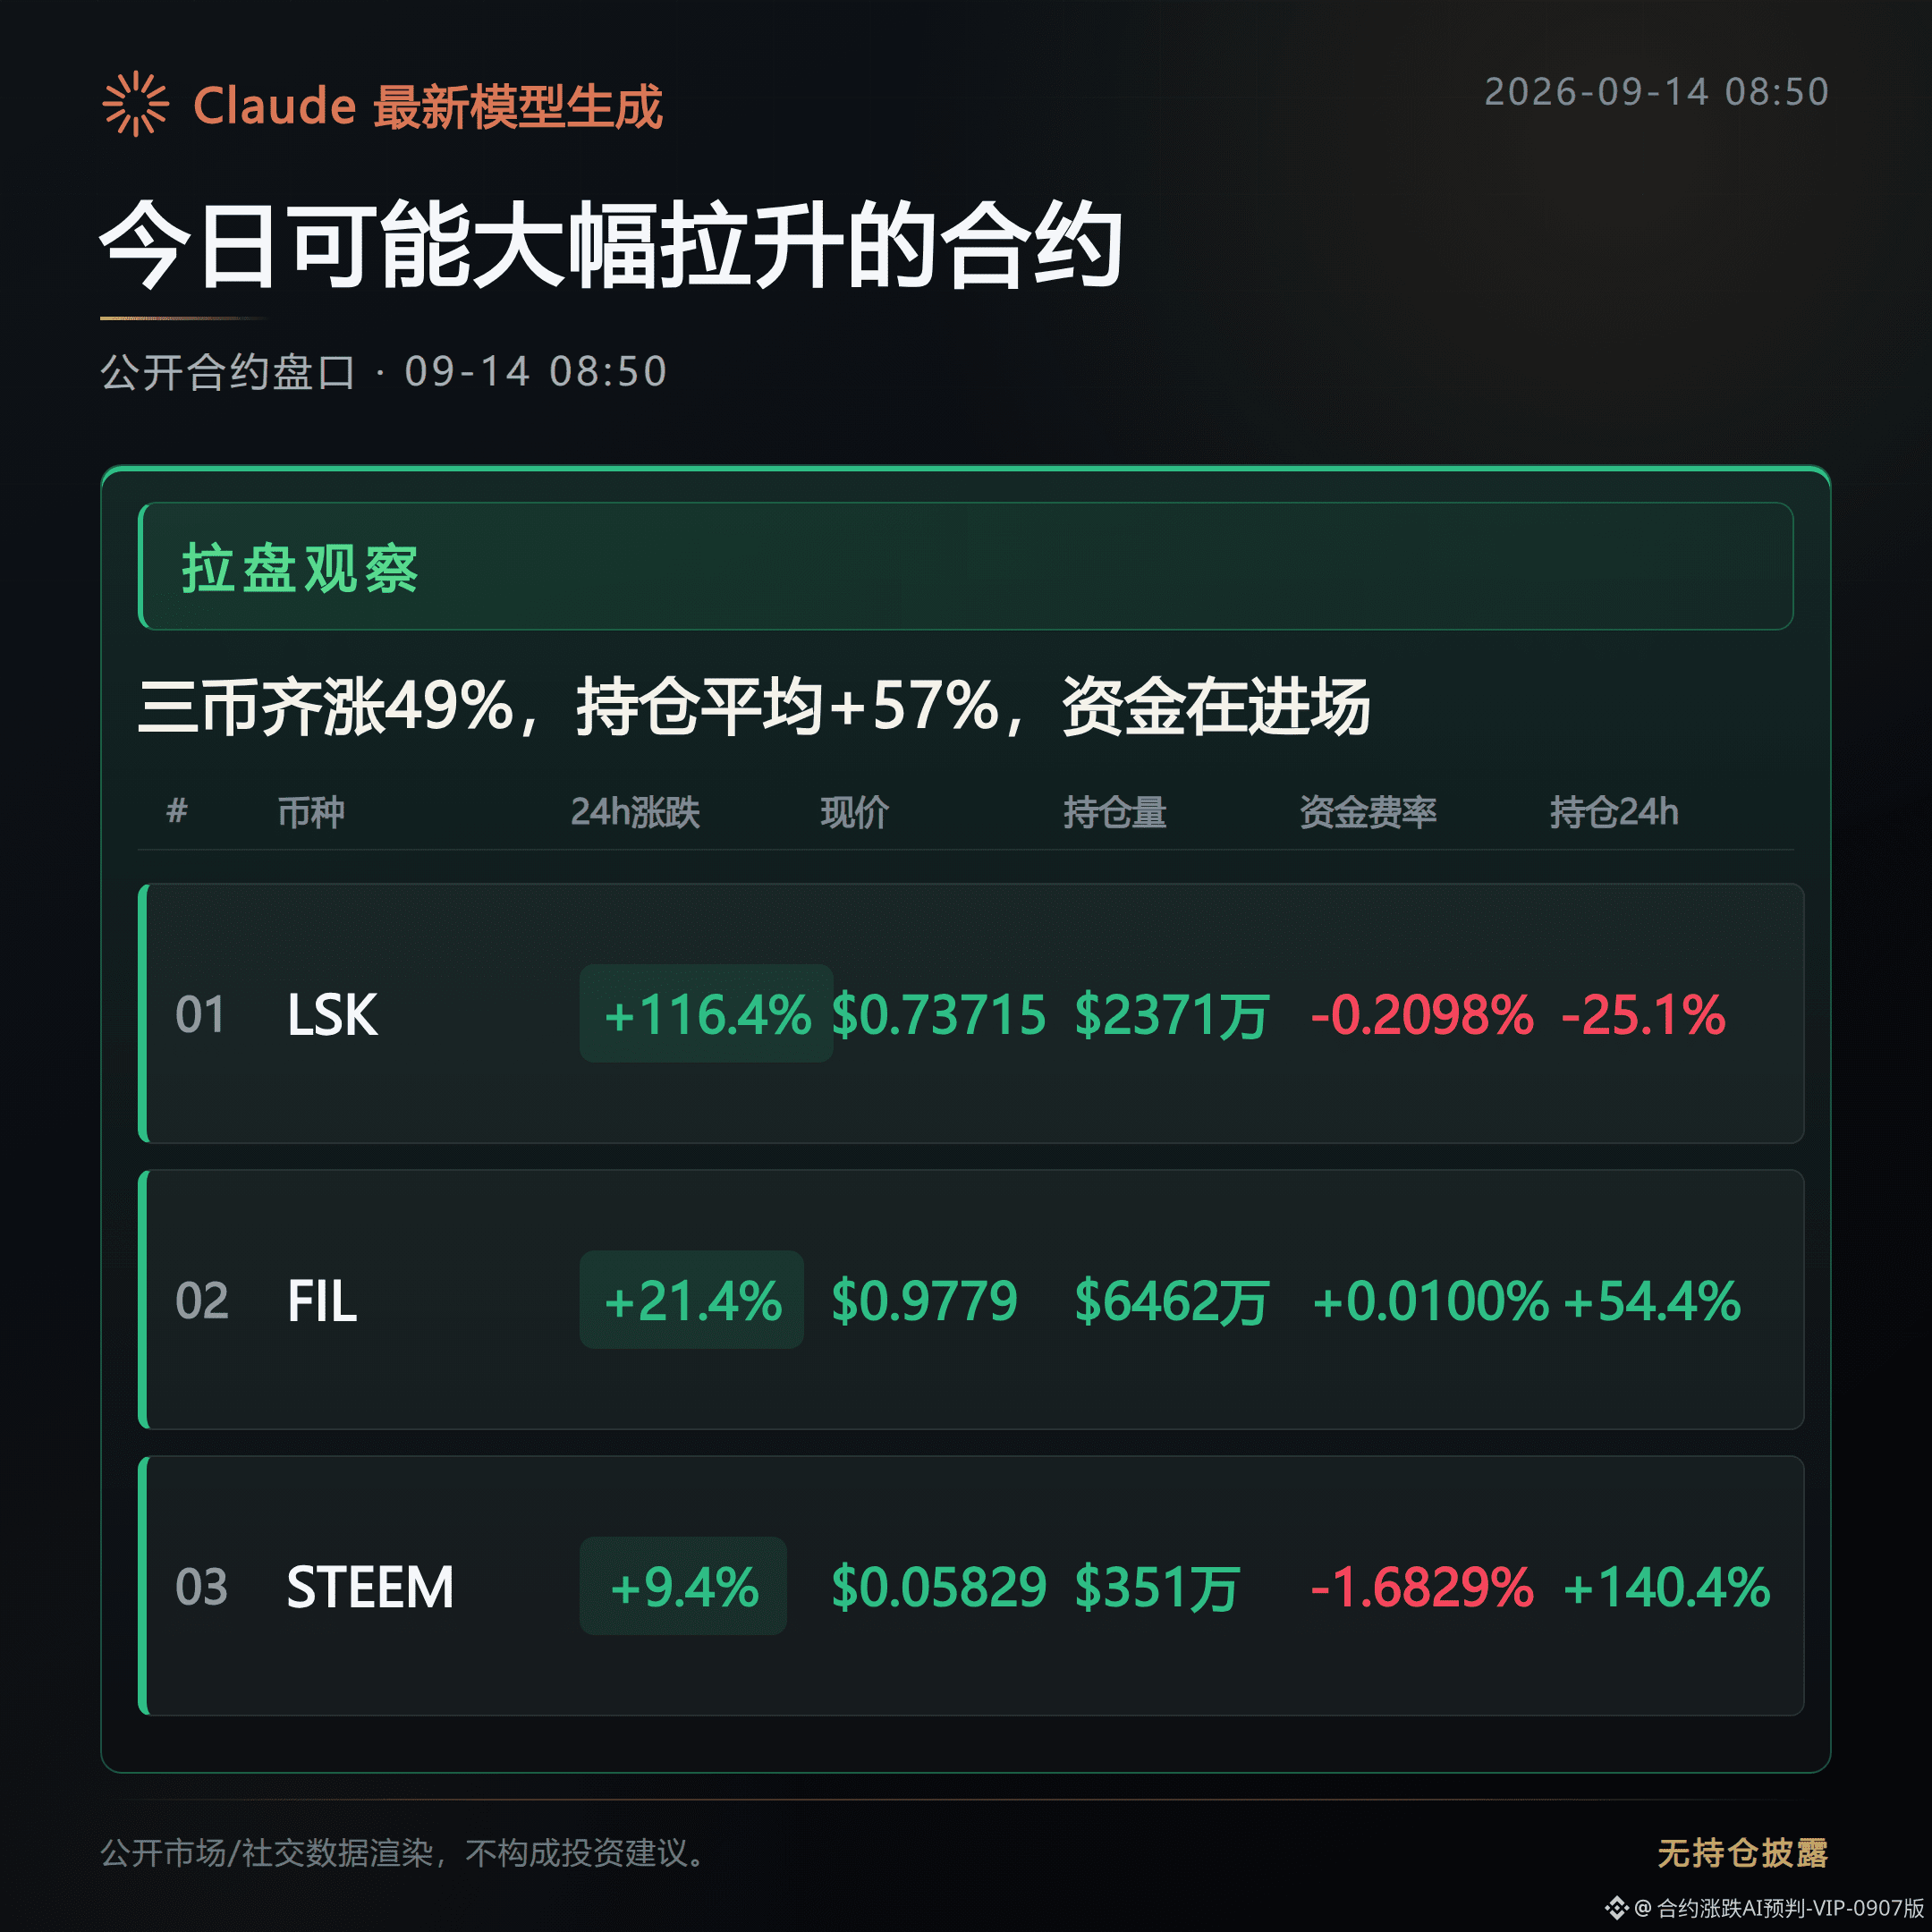
Contracts that may surge significantly today
Bias toward an upward push.
For this order book, I’m watching three contracts: LSK, FIL, and STEEM. Over these past few days, the chips have been getting consolidated on the public order book, and the price has been moving in line with the 24-hour percentage gain. Meanwhile, the open interest has also shown clear changes. Next, I’ll focus on whether these positions can continue to keep up, and whether the aggressive buy side can maintain its strength.
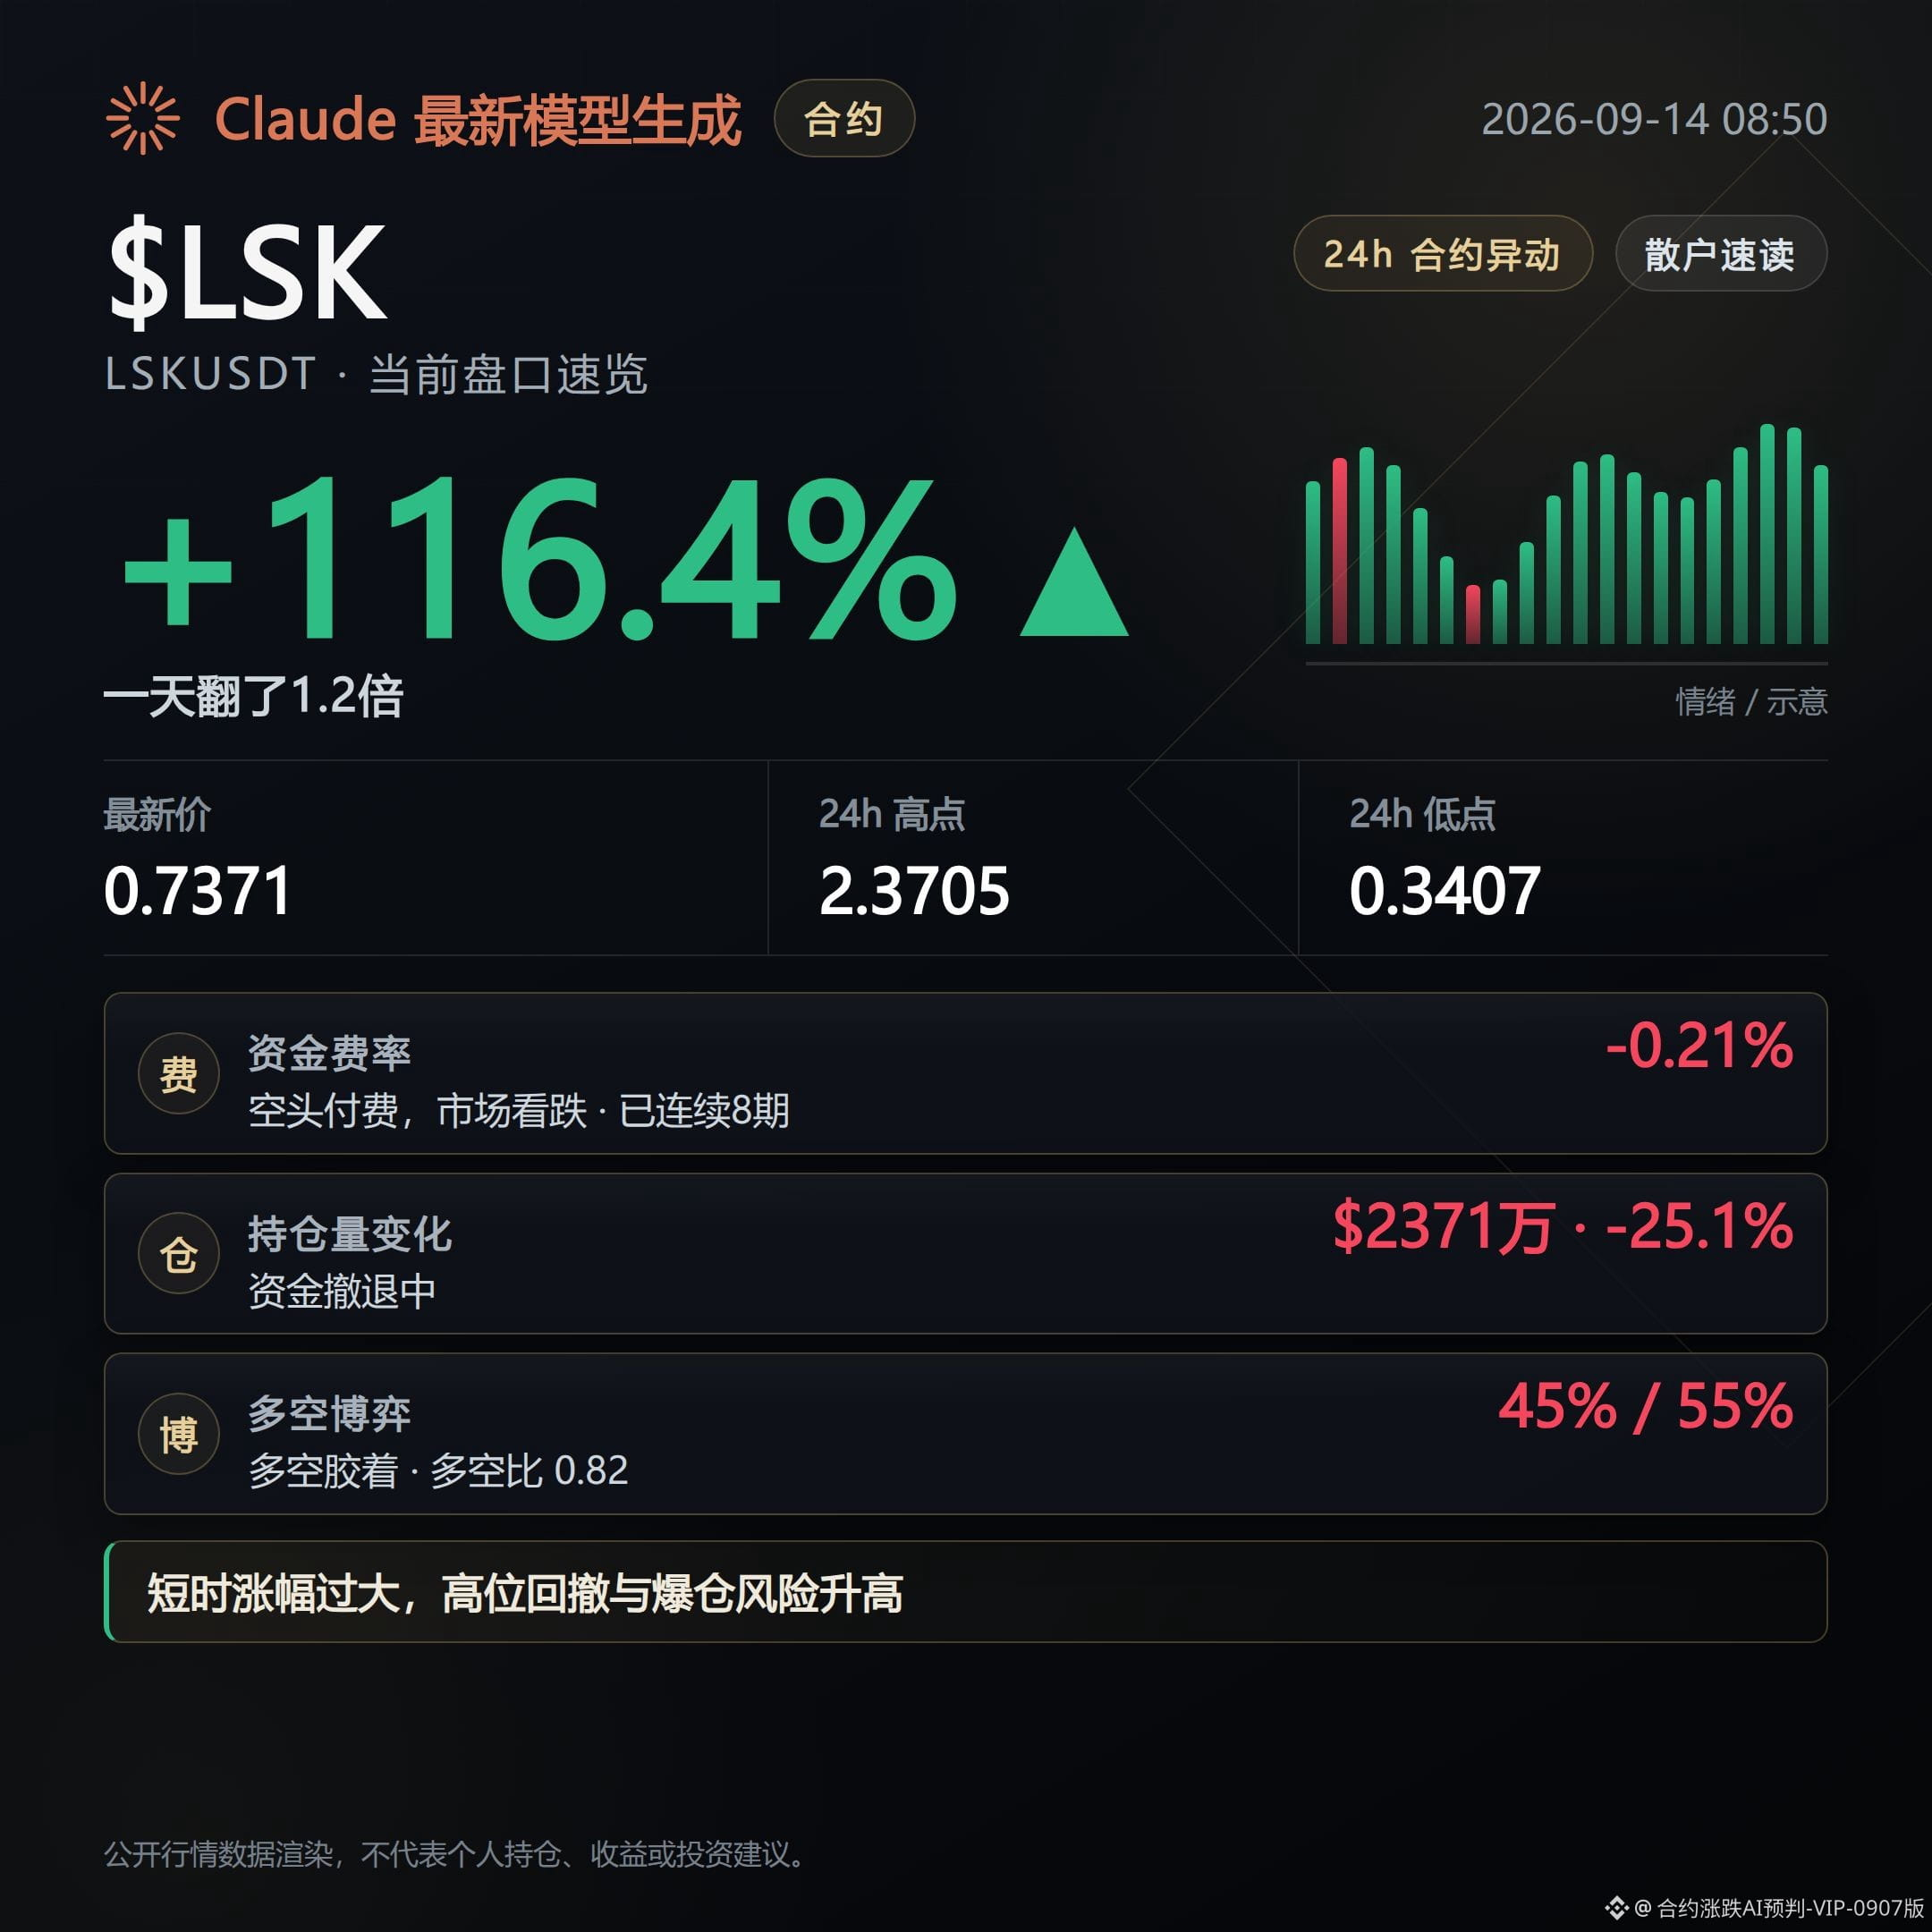
LSK has gained 116.36% over the past 24 hours. This increase itself is a hard signal. The funding rate is negative at -0.2098%, and it has been eight consecutive periods with shorts paying fees (i.e., shorts are subsidizing long positions), which indicates that shorts have been shouldering the positions during this time. However, the current open interest is $23.71 million; it’s down 25.1% over the past 24 hours, and in the most recent hour it’s down another 18.8%, meaning volume/positioning is being withdrawn. This is the counter-signal to watch: if price is rising while positions keep moving out, it means the following capital hasn’t truly entered yet.
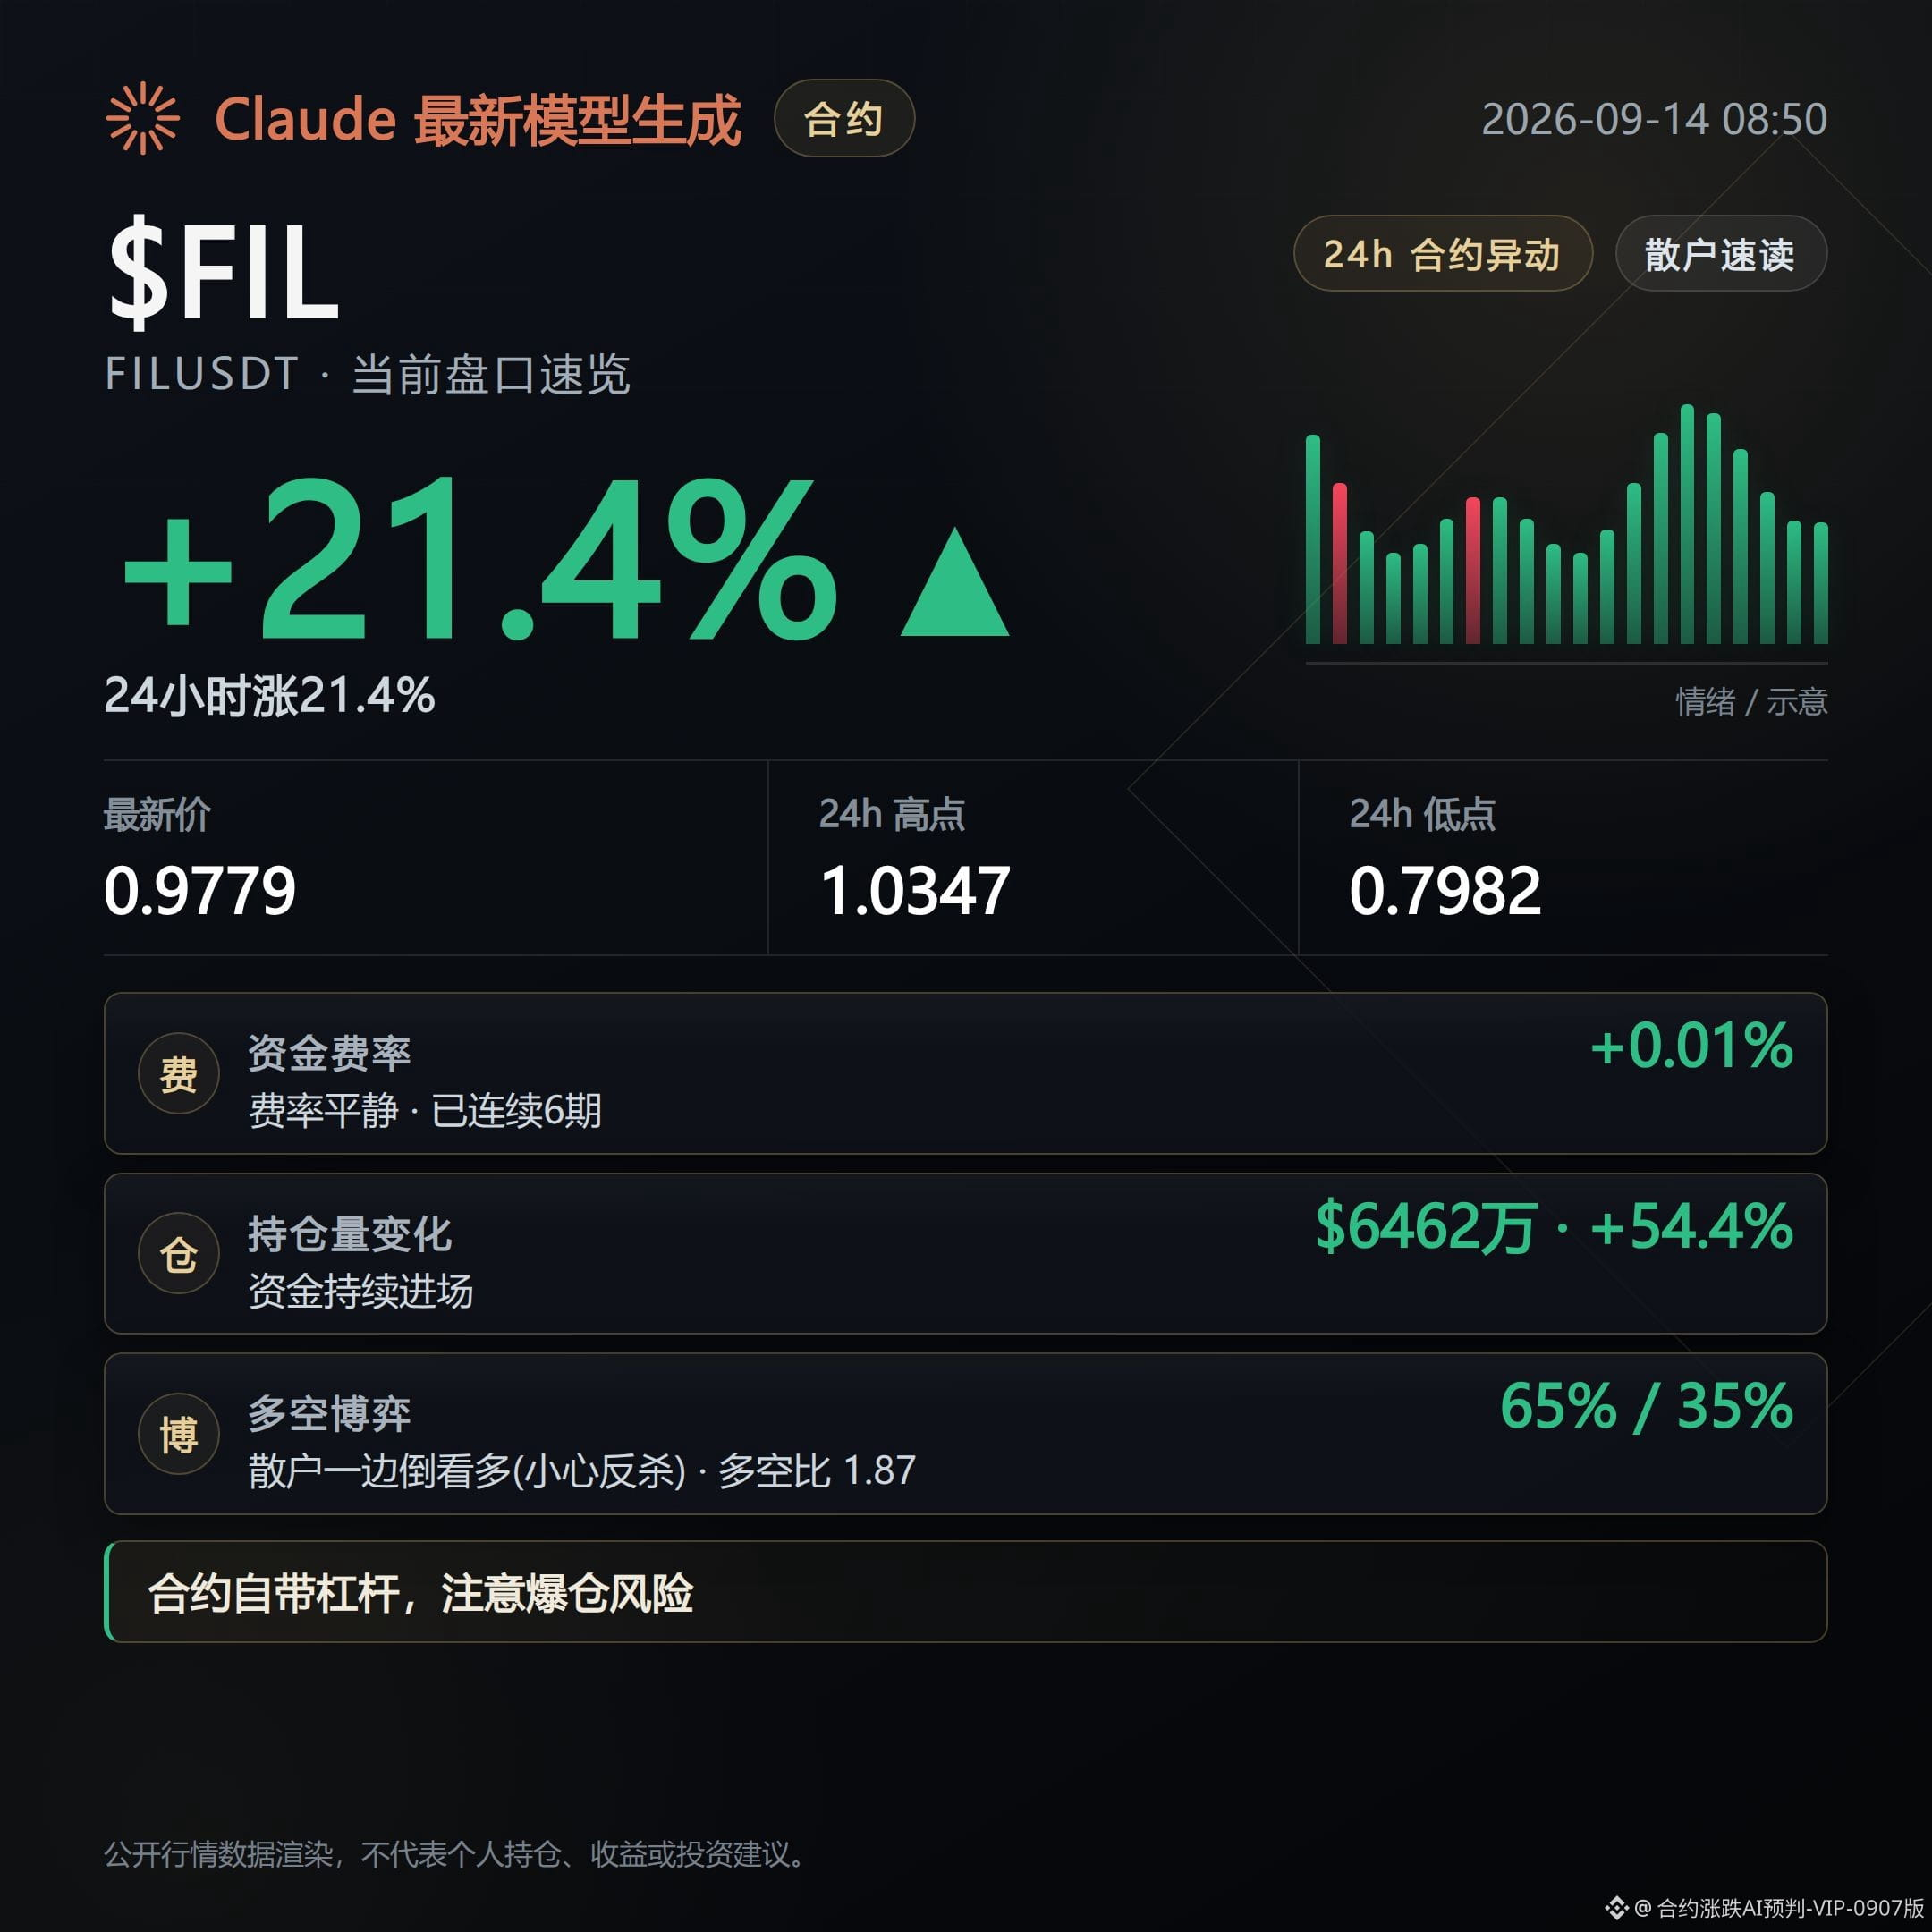
For FIL, it’s up 21.43% over the past 24 hours. Open interest is now $64.61 million, up sharply 54.4% in the last 24 hours. Aggressive buy orders are dominant; the buy/sell ratio is 1.18. The Super Trend line is also pointing upward. This combination looks like positions are tracking the rise. The counter-signal is that the relative strength indicator is already at 69.7, close to a relatively hot zone. If buy strength fades, this line will need to be reassessed.
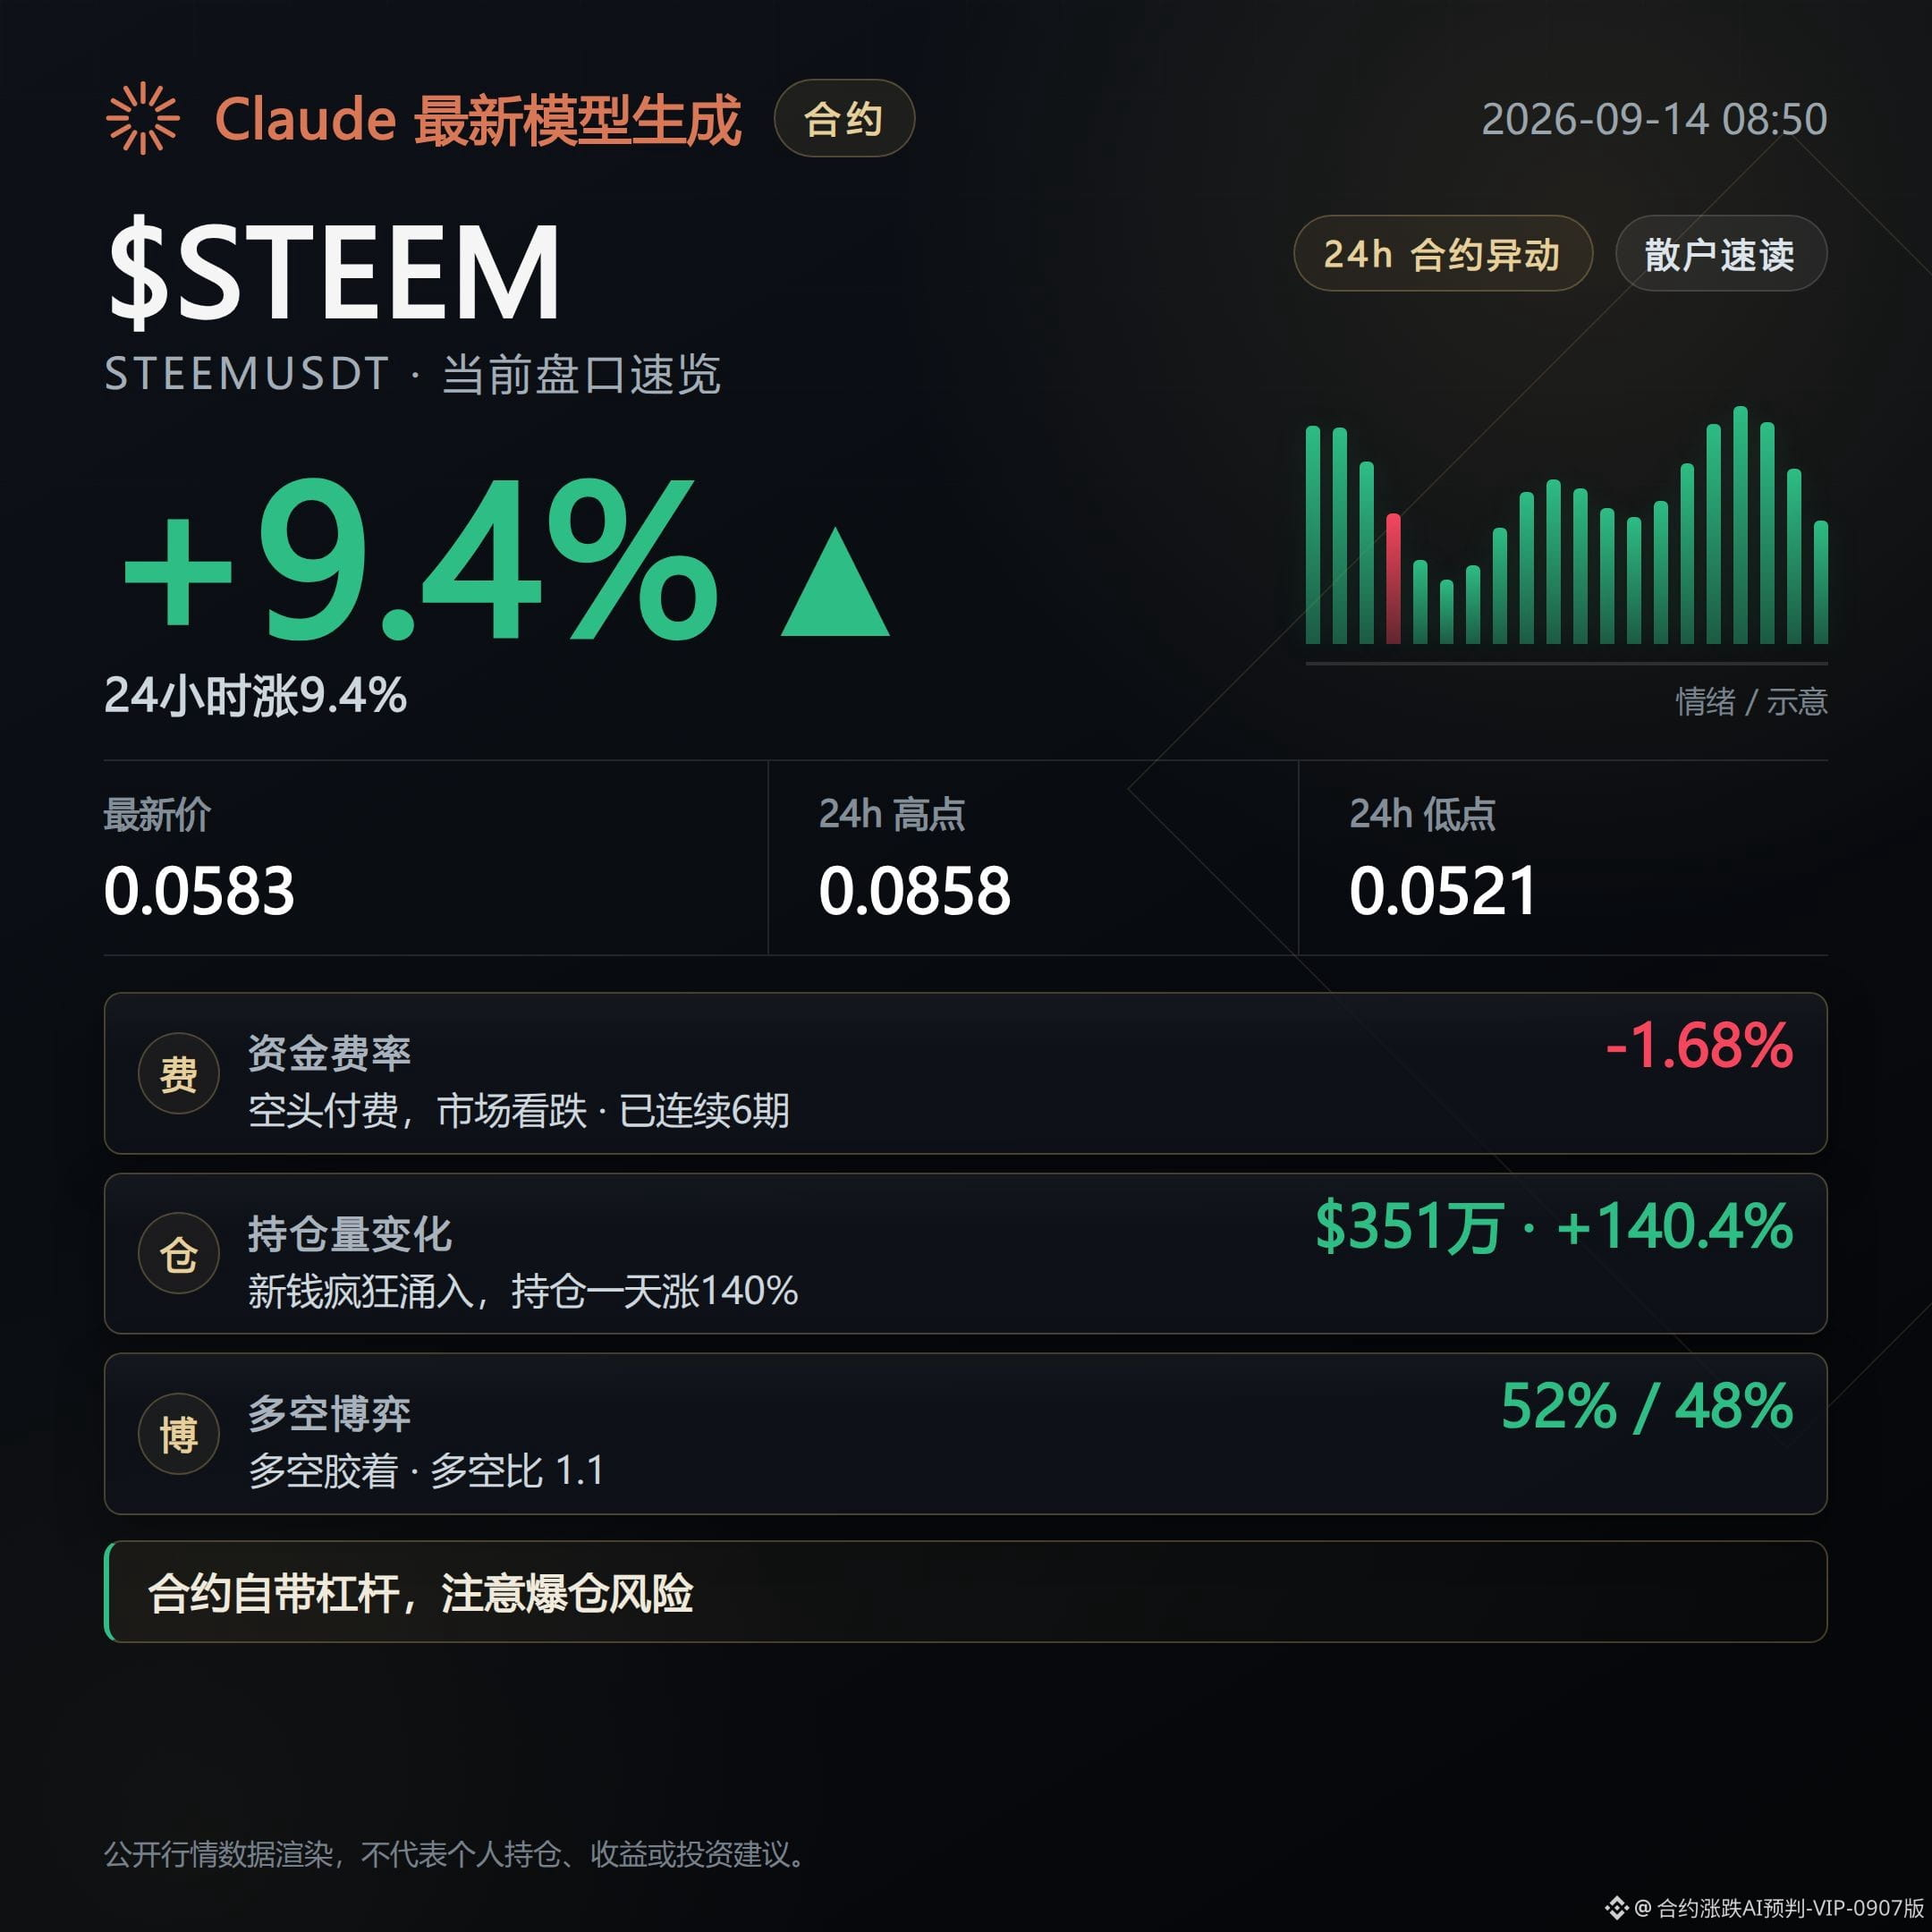
STEEM is up 9.4% over the past 24 hours. Open interest is currently $3.51 million, and it surged 140.4% over the past 24 hours. The funding rate is negative at -1.6829%, and shorts have been paying fees for six straight periods. When this type of funding-rate pressure and position inflow coincide, the order book suggests a potential short-squeeze situation. The counter-signal is that the Super Trend line is still pointing downward. Also, the contract remains trading at a 4.88% discount to the spot price, which suggests the long side hasn’t truly regained control.
If the open interest in these three order books can keep rising with the price and the buy side remains proactive, then this trend line can continue. If open interest turns downward and the Super Trend line flips, then this direction needs to be reconsidered.
#LSK #FIL #STEEM # contract market info
Open interest explanation: This account’s real-money position holds $FOGO long contracts; the disclosure is made to keep the content consistent with actual trading.
Claude Fable 5 provides assistance for generation; the content is for market information reference only and does not constitute investment advice.
Contracts that may surge significantly today
Bias toward an upward push.
For this order book, I’m watching three contracts: LSK, FIL, and STEEM. Over these past few days, the chips have been getting consolidated on the public order book, and the price has been moving in line with the 24-hour percentage gain. Meanwhile, the open interest has also shown clear changes. Next, I’ll focus on whether these positions can continue to keep up, and whether the aggressive buy side can maintain its strength.
LSK has gained 116.36% over the past 24 hours. This increase itself is a hard signal. The funding rate is negative at -0.2098%, and it has been eight consecutive periods with shorts paying fees (i.e., shorts are subsidizing long positions), which indicates that shorts have been shouldering the positions during this time. However, the current open interest is $23.71 million; it’s down 25.1% over the past 24 hours, and in the most recent hour it’s down another 18.8%, meaning volume/positioning is being withdrawn. This is the counter-signal to watch: if price is rising while positions keep moving out, it means the following capital hasn’t truly entered yet.
For FIL, it’s up 21.43% over the past 24 hours. Open interest is now $64.61 million, up sharply 54.4% in the last 24 hours. Aggressive buy orders are dominant; the buy/sell ratio is 1.18. The Super Trend line is also pointing upward. This combination looks like positions are tracking the rise. The counter-signal is that the relative strength indicator is already at 69.7, close to a relatively hot zone. If buy strength fades, this line will need to be reassessed.
STEEM is up 9.4% over the past 24 hours. Open interest is currently $3.51 million, and it surged 140.4% over the past 24 hours. The funding rate is negative at -1.6829%, and shorts have been paying fees for six straight periods. When this type of funding-rate pressure and position inflow coincide, the order book suggests a potential short-squeeze situation. The counter-signal is that the Super Trend line is still pointing downward. Also, the contract remains trading at a 4.88% discount to the spot price, which suggests the long side hasn’t truly regained control.
If the open interest in these three order books can keep rising with the price and the buy side remains proactive, then this trend line can continue. If open interest turns downward and the Super Trend line flips, then this direction needs to be reconsidered.
#LSK #FIL #STEEM # contract market info
Open interest explanation: This account’s real-money position holds $FOGO long contracts; the disclosure is made to keep the content consistent with actual trading.
Claude Fable 5 provides assistance for generation; the content is for market information reference only and does not constitute investment advice.
Bias toward an upward push.
For this order book, I’m watching three contracts: LSK, FIL, and STEEM. Over these past few days, the chips have been getting consolidated on the public order book, and the price has been moving in line with the 24-hour percentage gain. Meanwhile, the open interest has also shown clear changes. Next, I’ll focus on whether these positions can continue to keep up, and whether the aggressive buy side can maintain its strength.
LSK has gained 116.36% over the past 24 hours. This increase itself is a hard signal. The funding rate is negative at -0.2098%, and it has been eight consecutive periods with shorts paying fees (i.e., shorts are subsidizing long positions), which indicates that shorts have been shouldering the positions during this time. However, the current open interest is $23.71 million; it’s down 25.1% over the past 24 hours, and in the most recent hour it’s down another 18.8%, meaning volume/positioning is being withdrawn. This is the counter-signal to watch: if price is rising while positions keep moving out, it means the following capital hasn’t truly entered yet.
For FIL, it’s up 21.43% over the past 24 hours. Open interest is now $64.61 million, up sharply 54.4% in the last 24 hours. Aggressive buy orders are dominant; the buy/sell ratio is 1.18. The Super Trend line is also pointing upward. This combination looks like positions are tracking the rise. The counter-signal is that the relative strength indicator is already at 69.7, close to a relatively hot zone. If buy strength fades, this line will need to be reassessed.
STEEM is up 9.4% over the past 24 hours. Open interest is currently $3.51 million, and it surged 140.4% over the past 24 hours. The funding rate is negative at -1.6829%, and shorts have been paying fees for six straight periods. When this type of funding-rate pressure and position inflow coincide, the order book suggests a potential short-squeeze situation. The counter-signal is that the Super Trend line is still pointing downward. Also, the contract remains trading at a 4.88% discount to the spot price, which suggests the long side hasn’t truly regained control.
If the open interest in these three order books can keep rising with the price and the buy side remains proactive, then this trend line can continue. If open interest turns downward and the Super Trend line flips, then this direction needs to be reconsidered.
#LSK #FIL #STEEM # contract market info
Open interest explanation: This account’s real-money position holds $FOGO long contracts; the disclosure is made to keep the content consistent with actual trading.
Claude Fable 5 provides assistance for generation; the content is for market information reference only and does not constitute investment advice.
690
Bearish signals are building up, and the risk of a slow slide lower has come into focus.
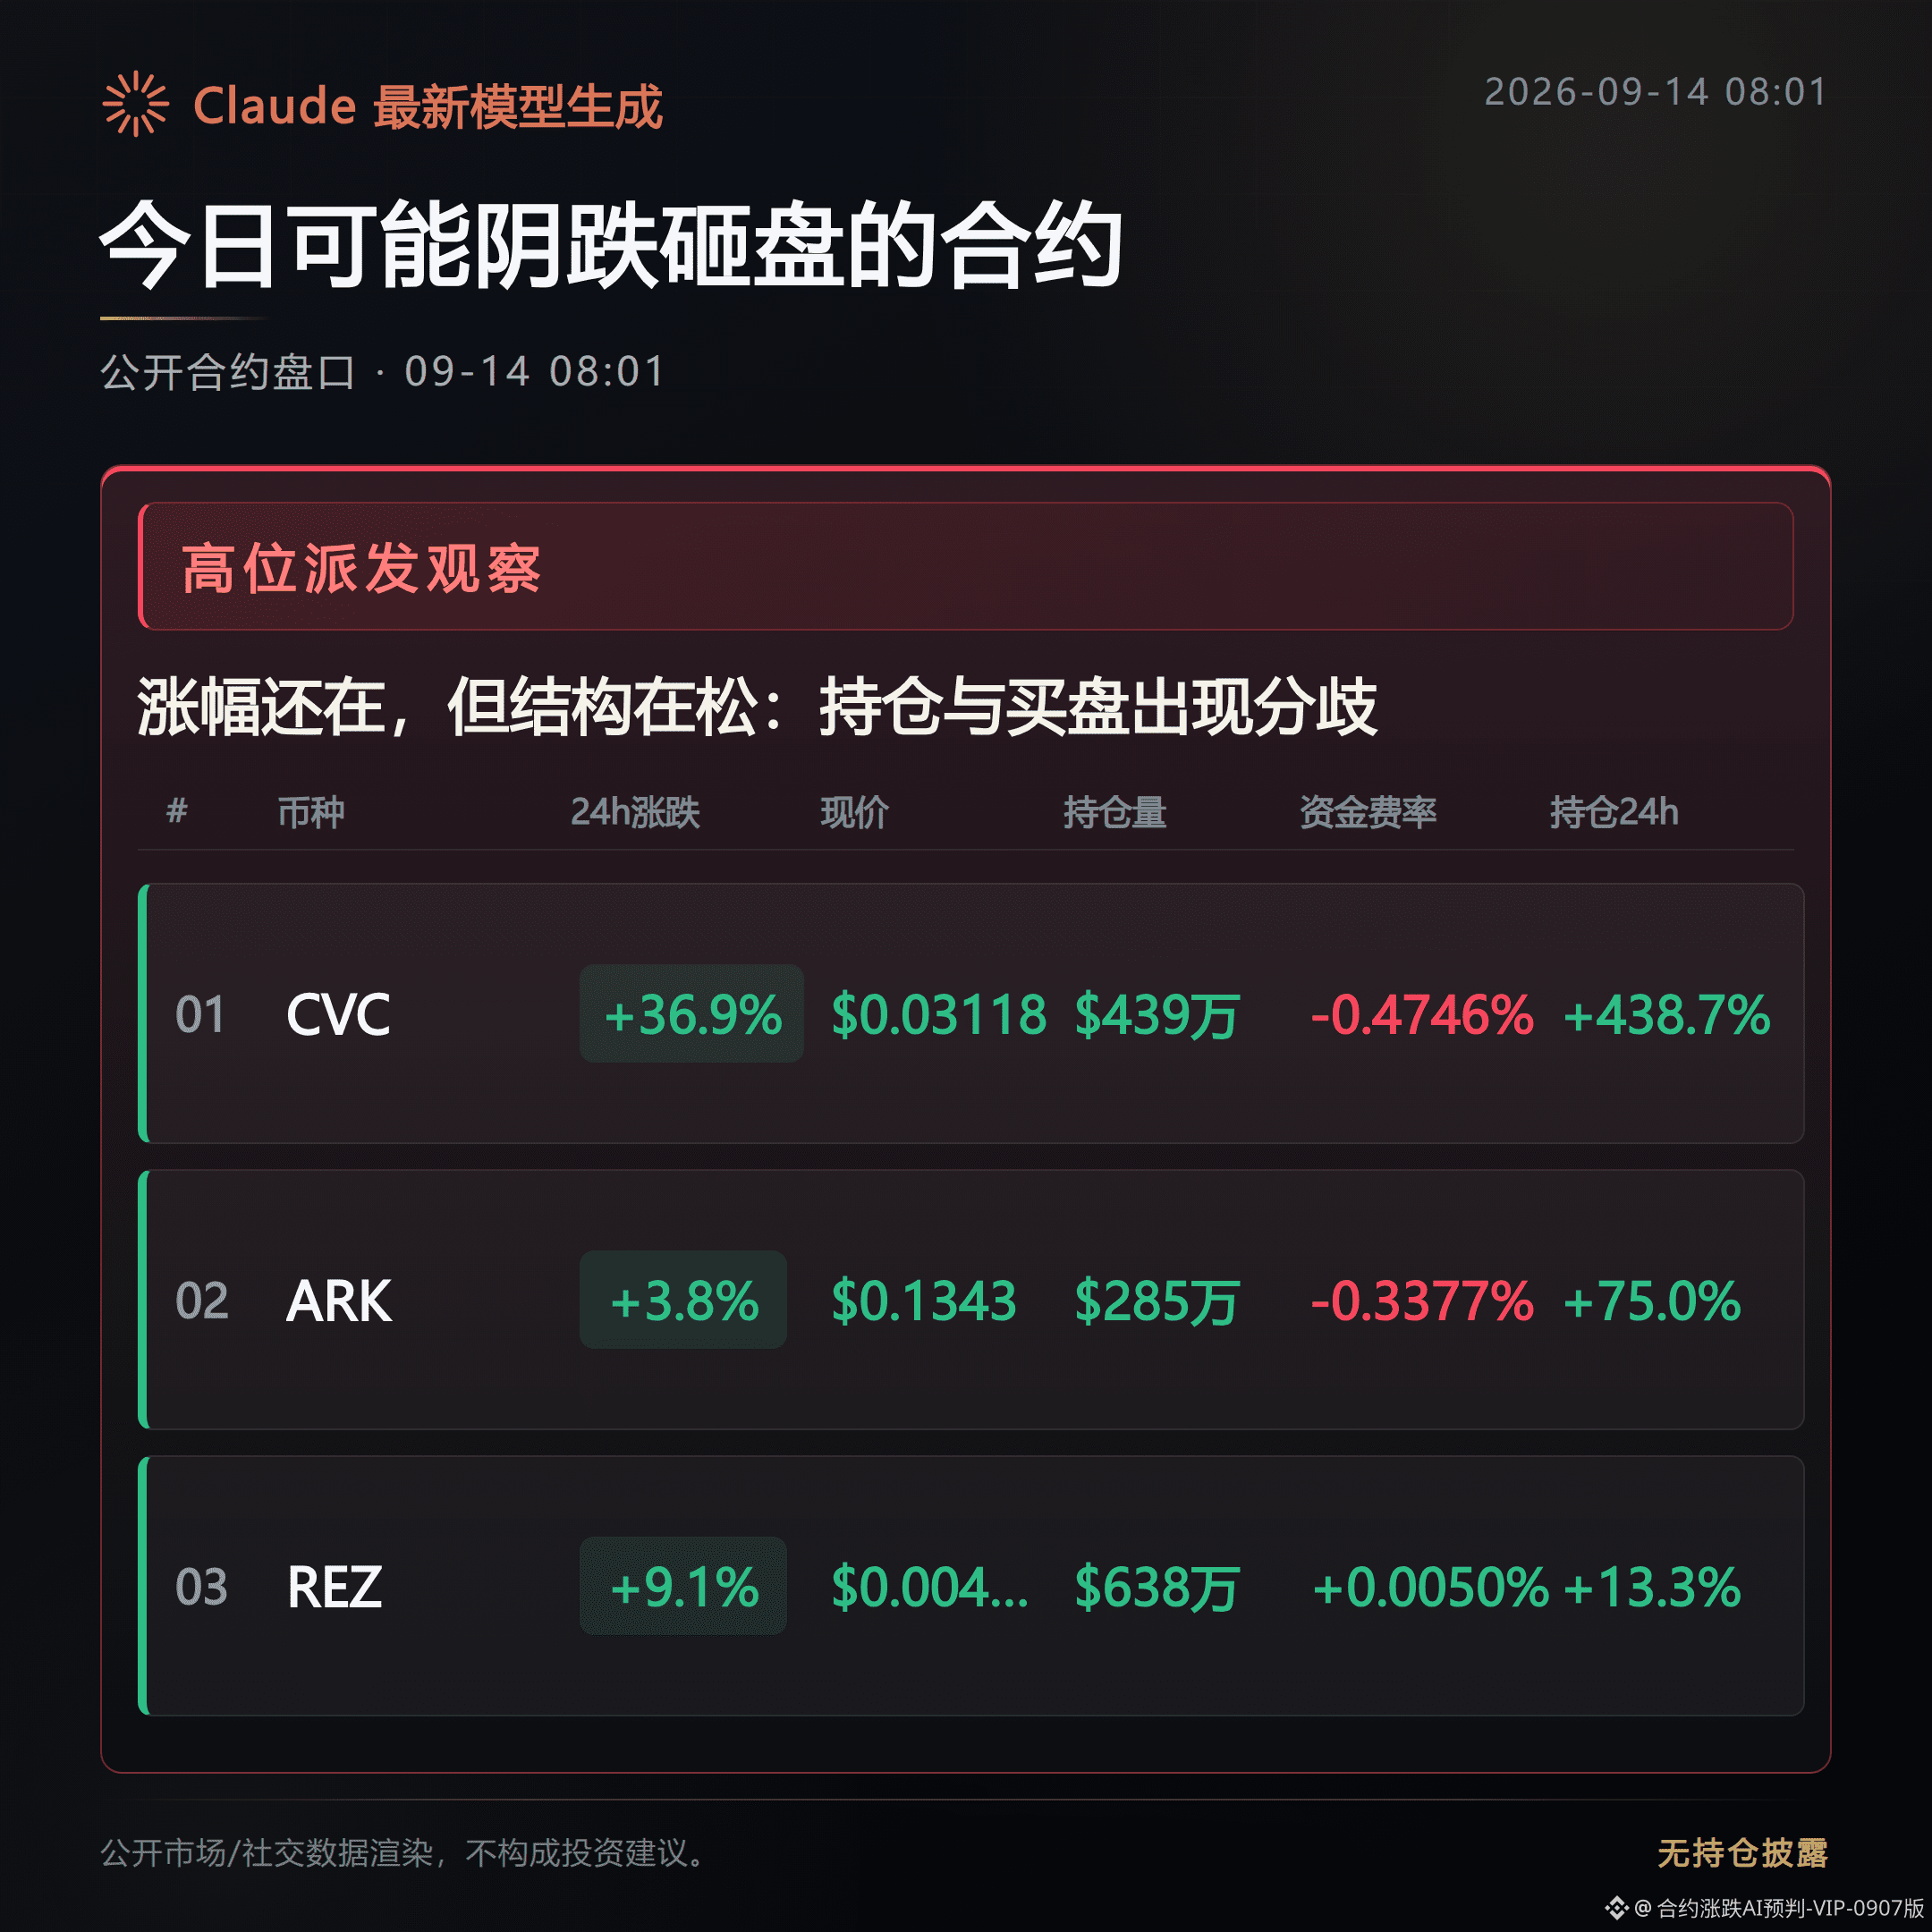
For these three contracts—CVCUSDT, ARKUSDT, and REZUSDT—the price still shows gains, but the structure has already loosened. Don’t just stare at that green “% up” number.
What you fear isn’t that it won’t rise—it's that while it’s rising, the follow-through starts to thin out. Next, you need to watch whether the pullback line truly breaks out.
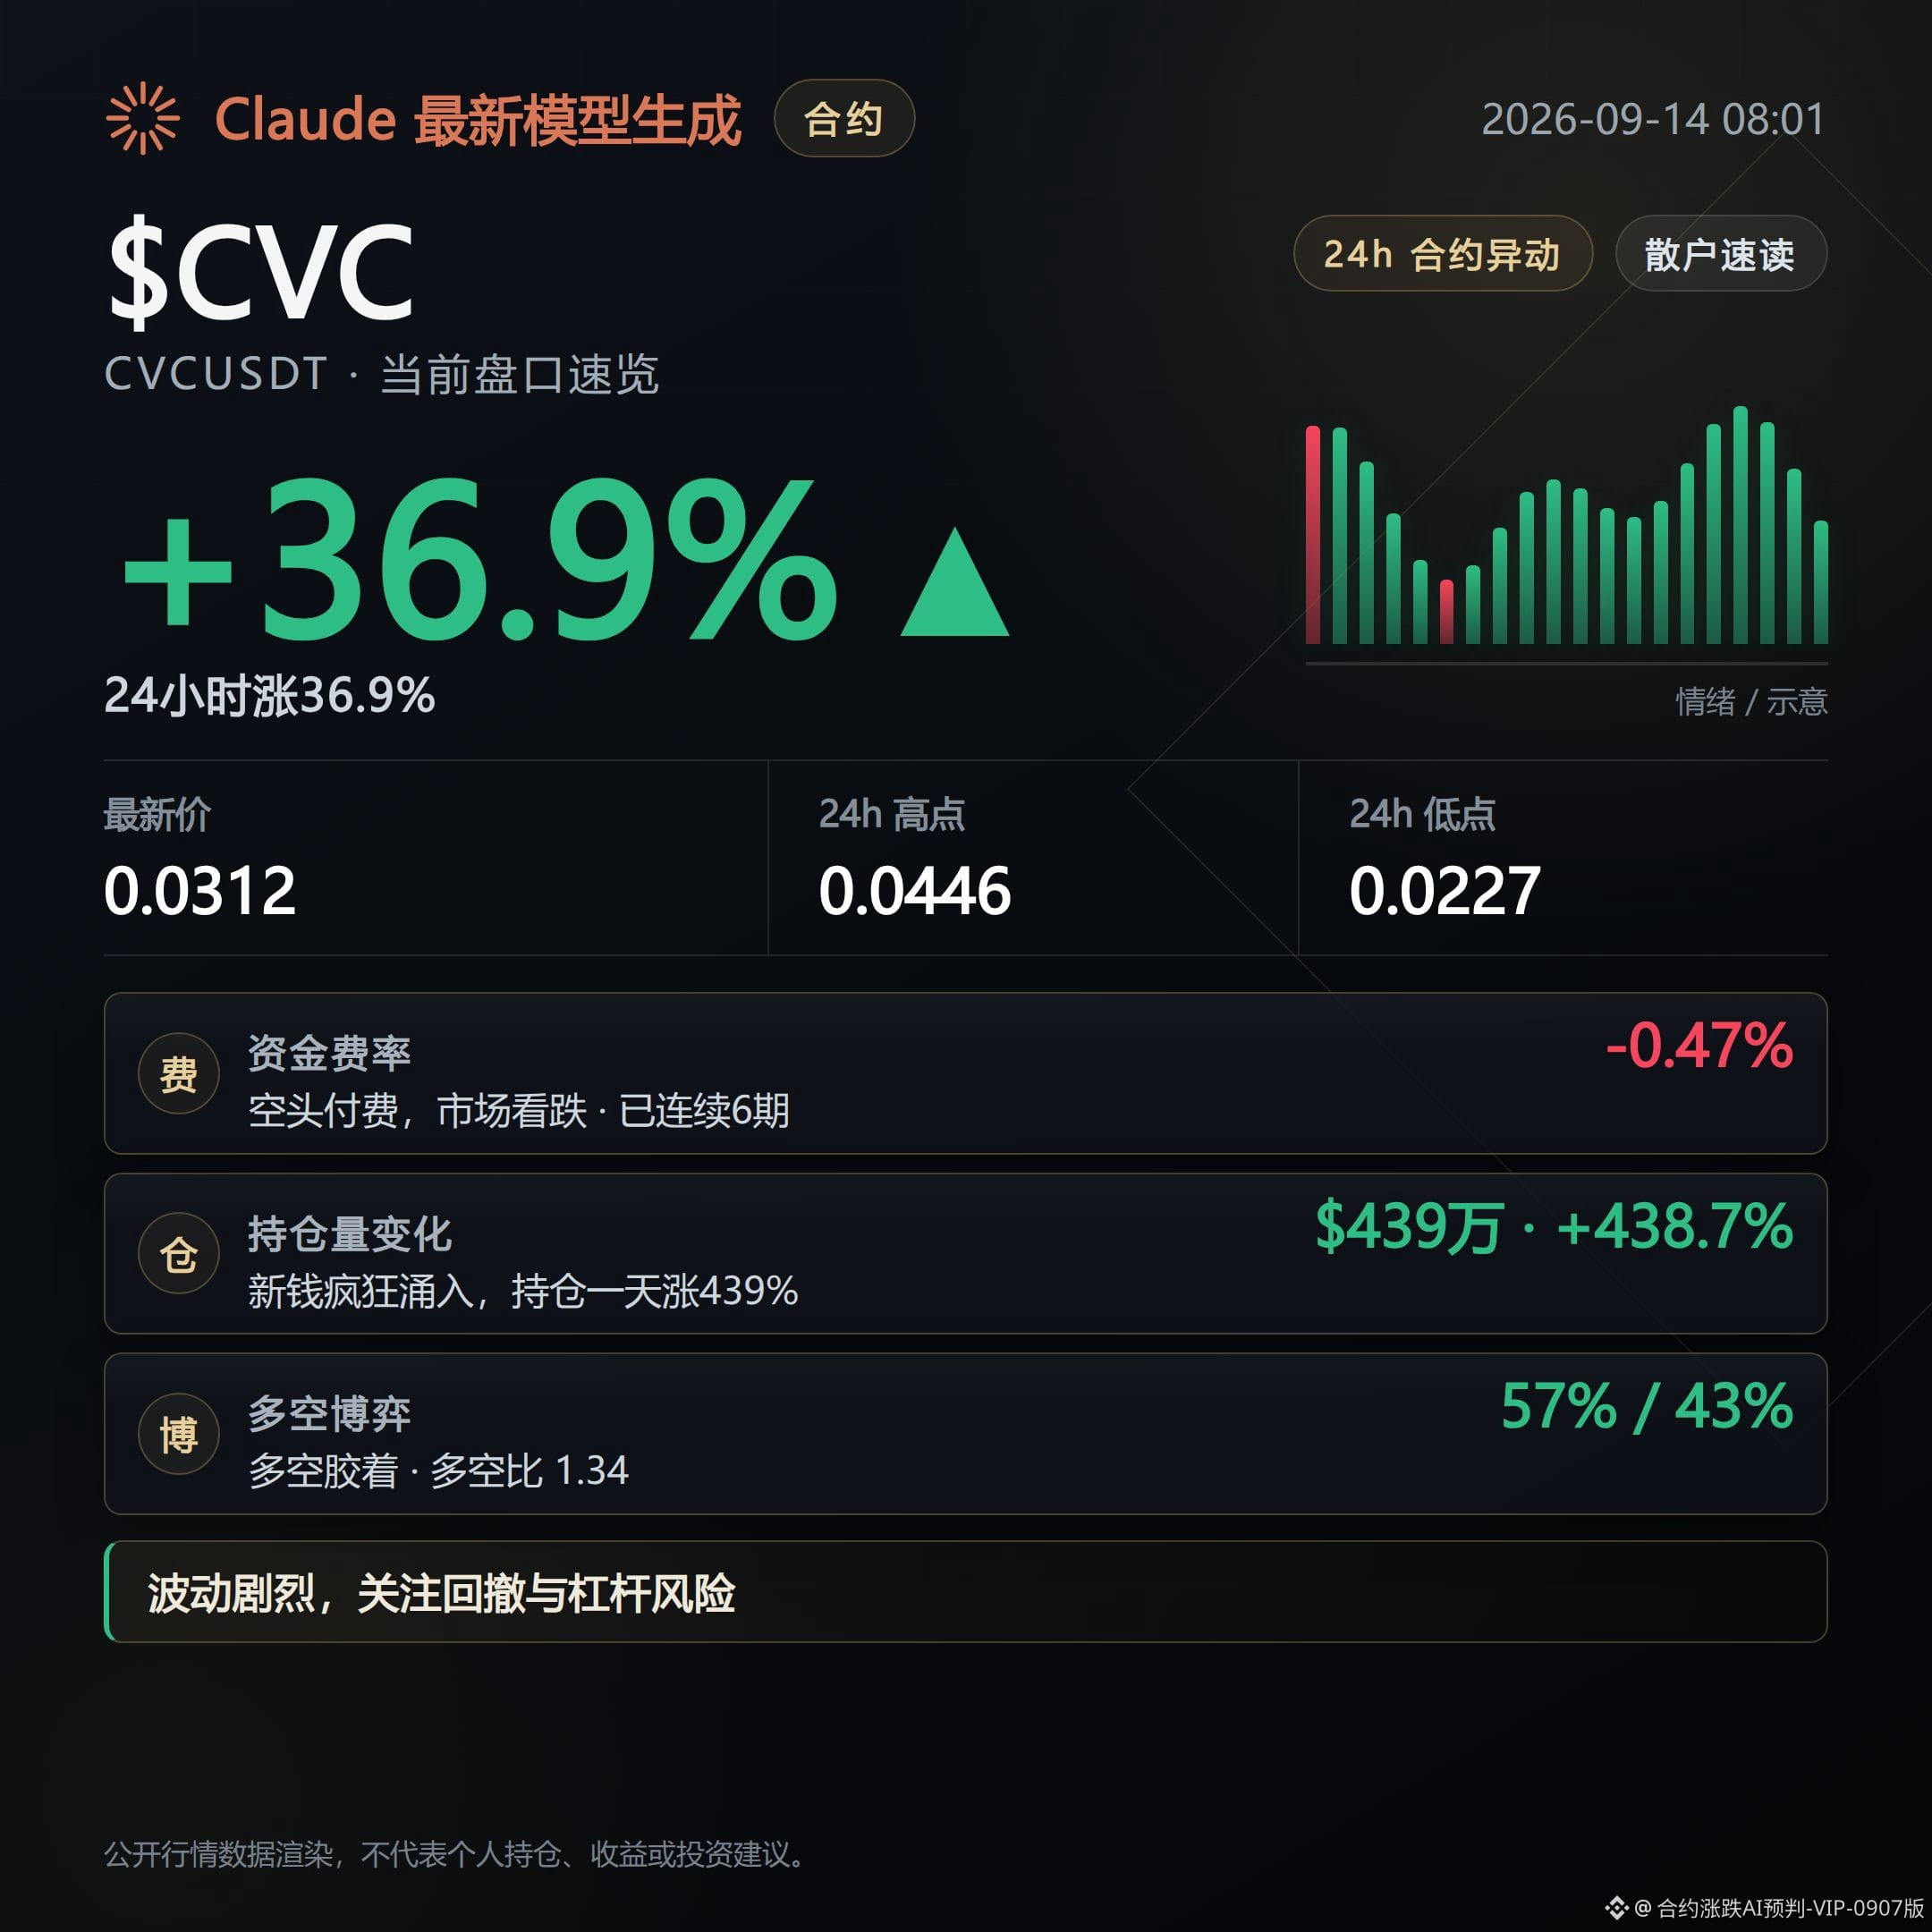
CVCUSDT is up 36.87%, with trading volume of $254 million and a funding rate of -0.4746%. It has paid shorts for 6 straight periods. Open interest surged 438.7% over 24 hours as positions flooded in, but open interest on the 1-hour timeframe has already fallen 7.7%.
Even though price is still up, the structure has loosened. Chasing late longs can get punished by both a snapback and a pullback at the same time, with liquidity drifting as chips scatter.
The counterpoint is that the Super Trend indicator still shows an up move, and the Strength Index at 50.6 is in a neutral zone—nothing is one-sided.
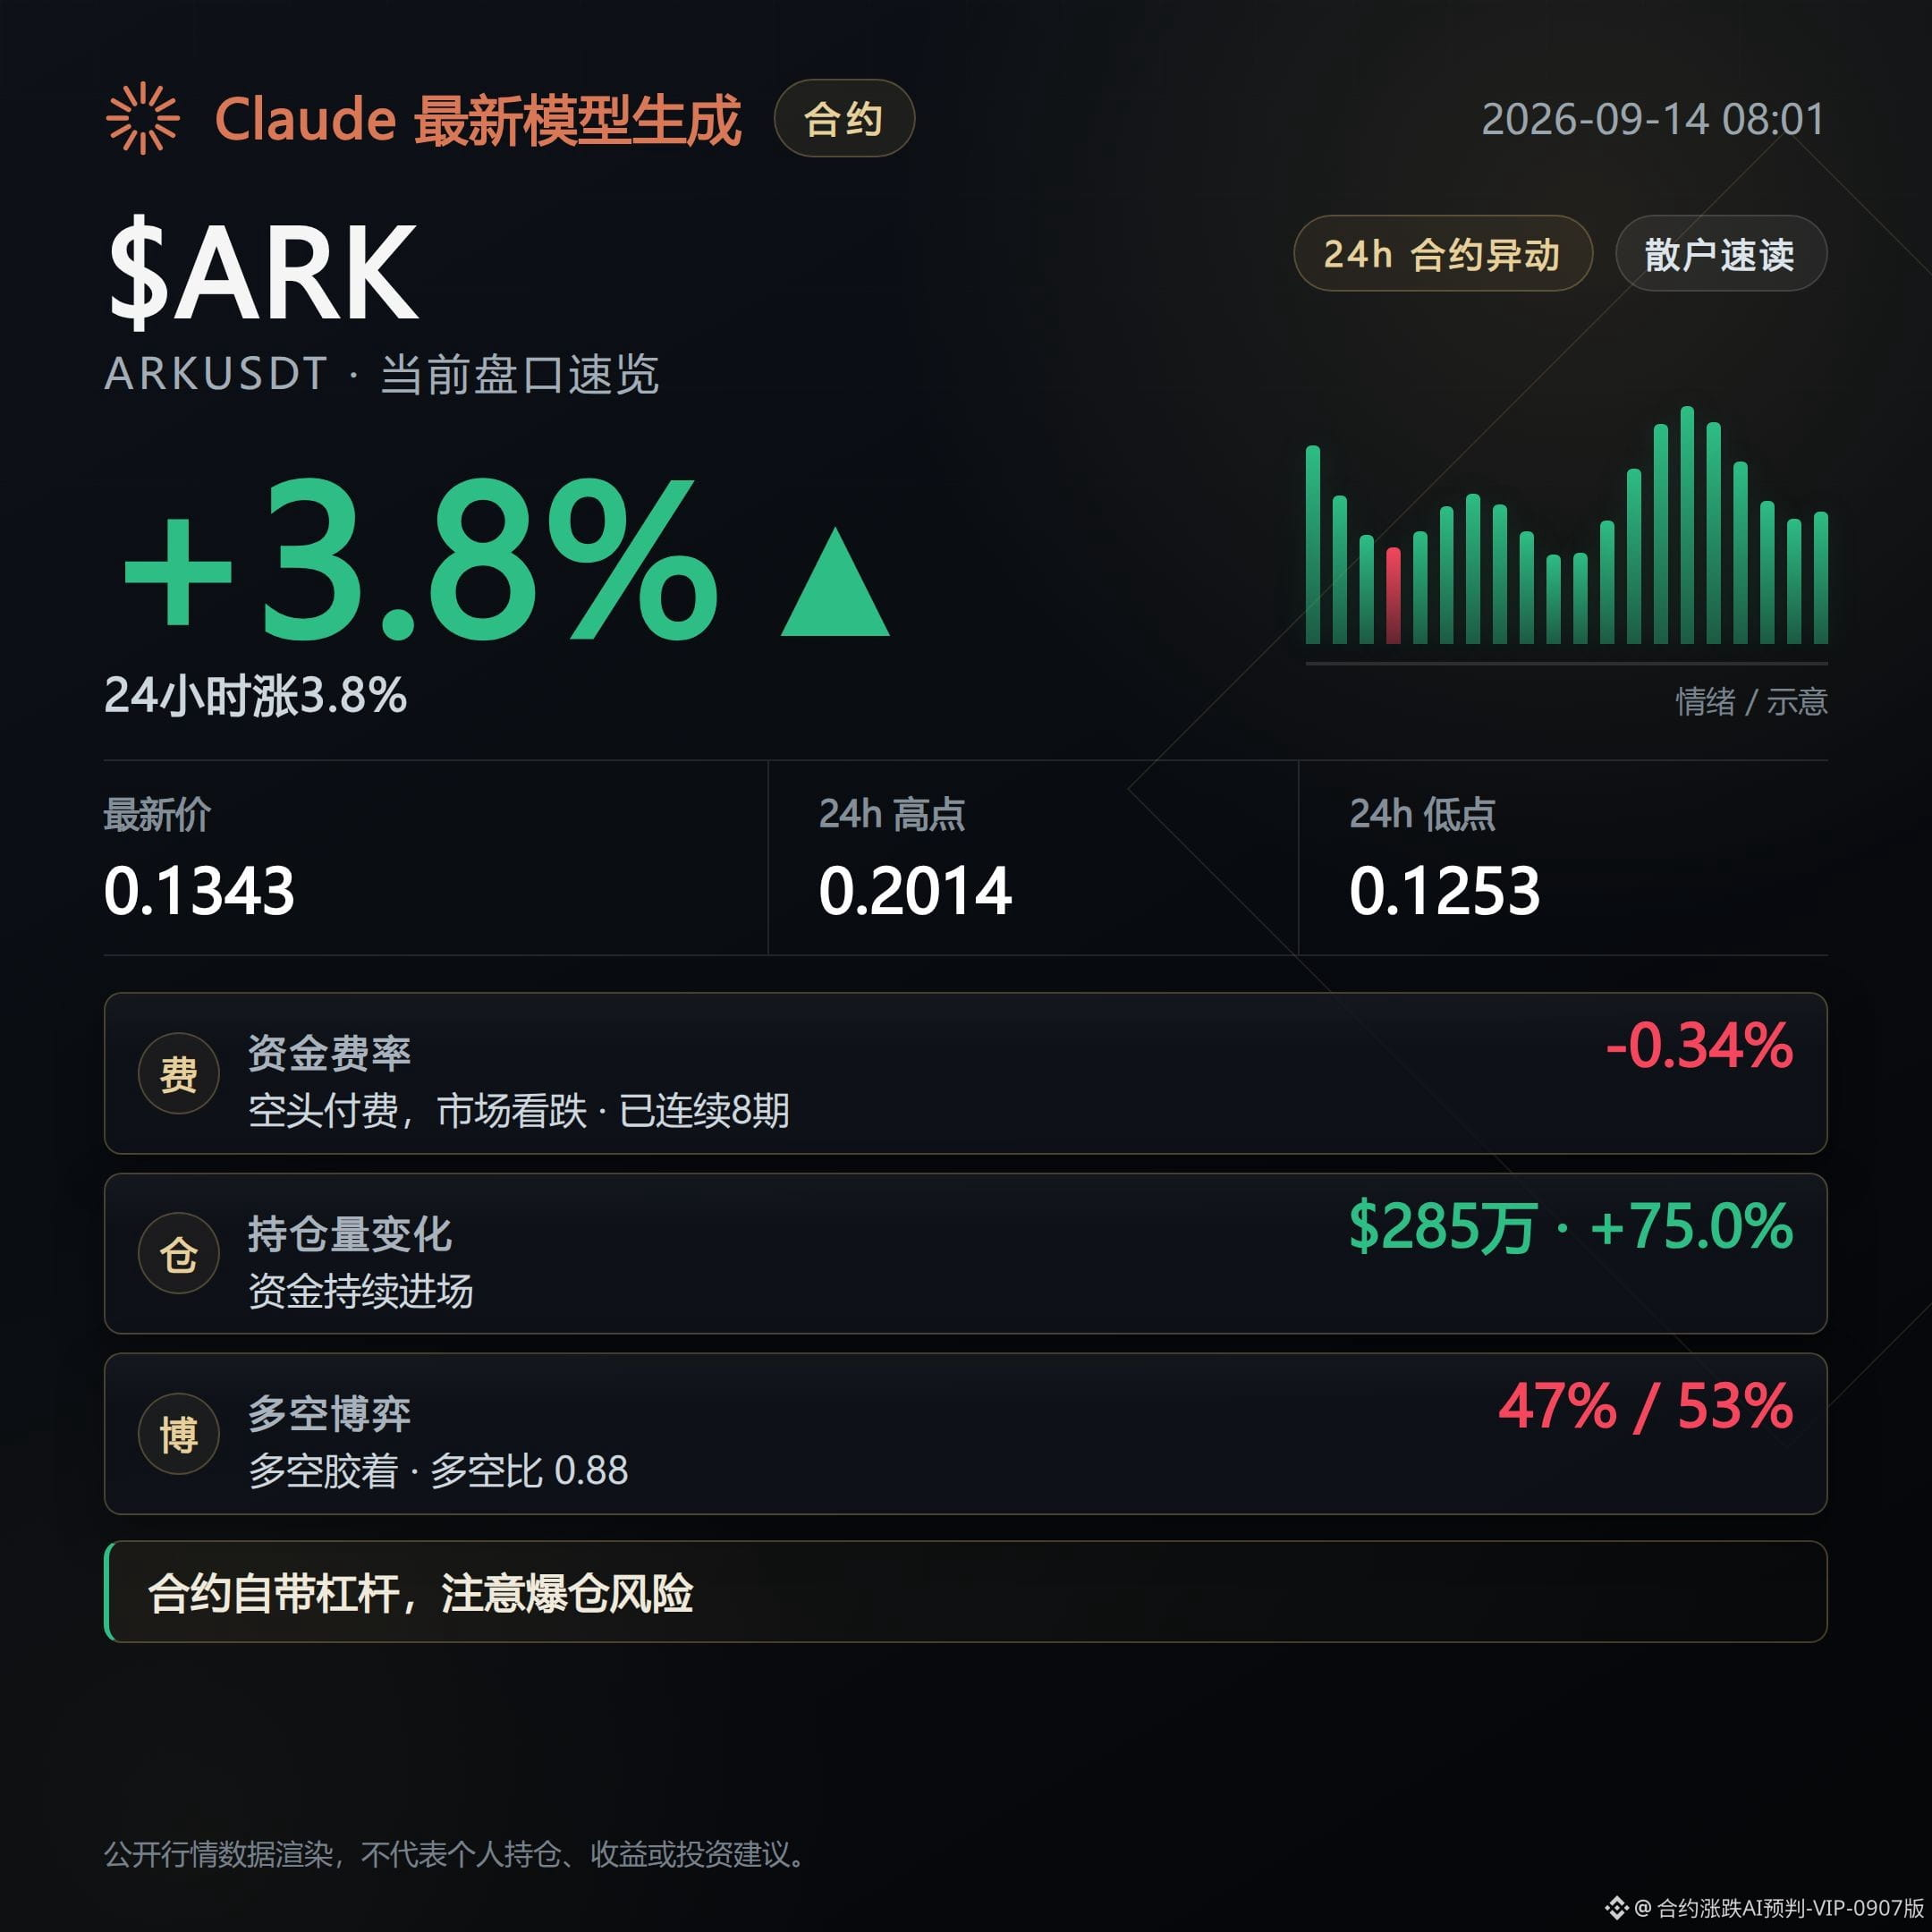
ARKUSDT is up only 3.79%, clearly weaker than the first one. Its funding rate is -0.3377%, shorts have been paid for 8 consecutive periods, and open interest increased 75% over 24 hours—but on the 1-hour timeframe it has already turned and dropped 5.6%. The ratio of aggressive sell orders is 0.66, clearly outweighing the buy side.
Even though price still shows gains, the structure has loosened. Chasing late longs can get tormented by both a snapback and a pullback, with chips scattering.
The counterpoint is the long/short account ratio is 0.88. Retail shorts are slightly in the lead, so this isn’t a clean, one-direction pile-up of longs.
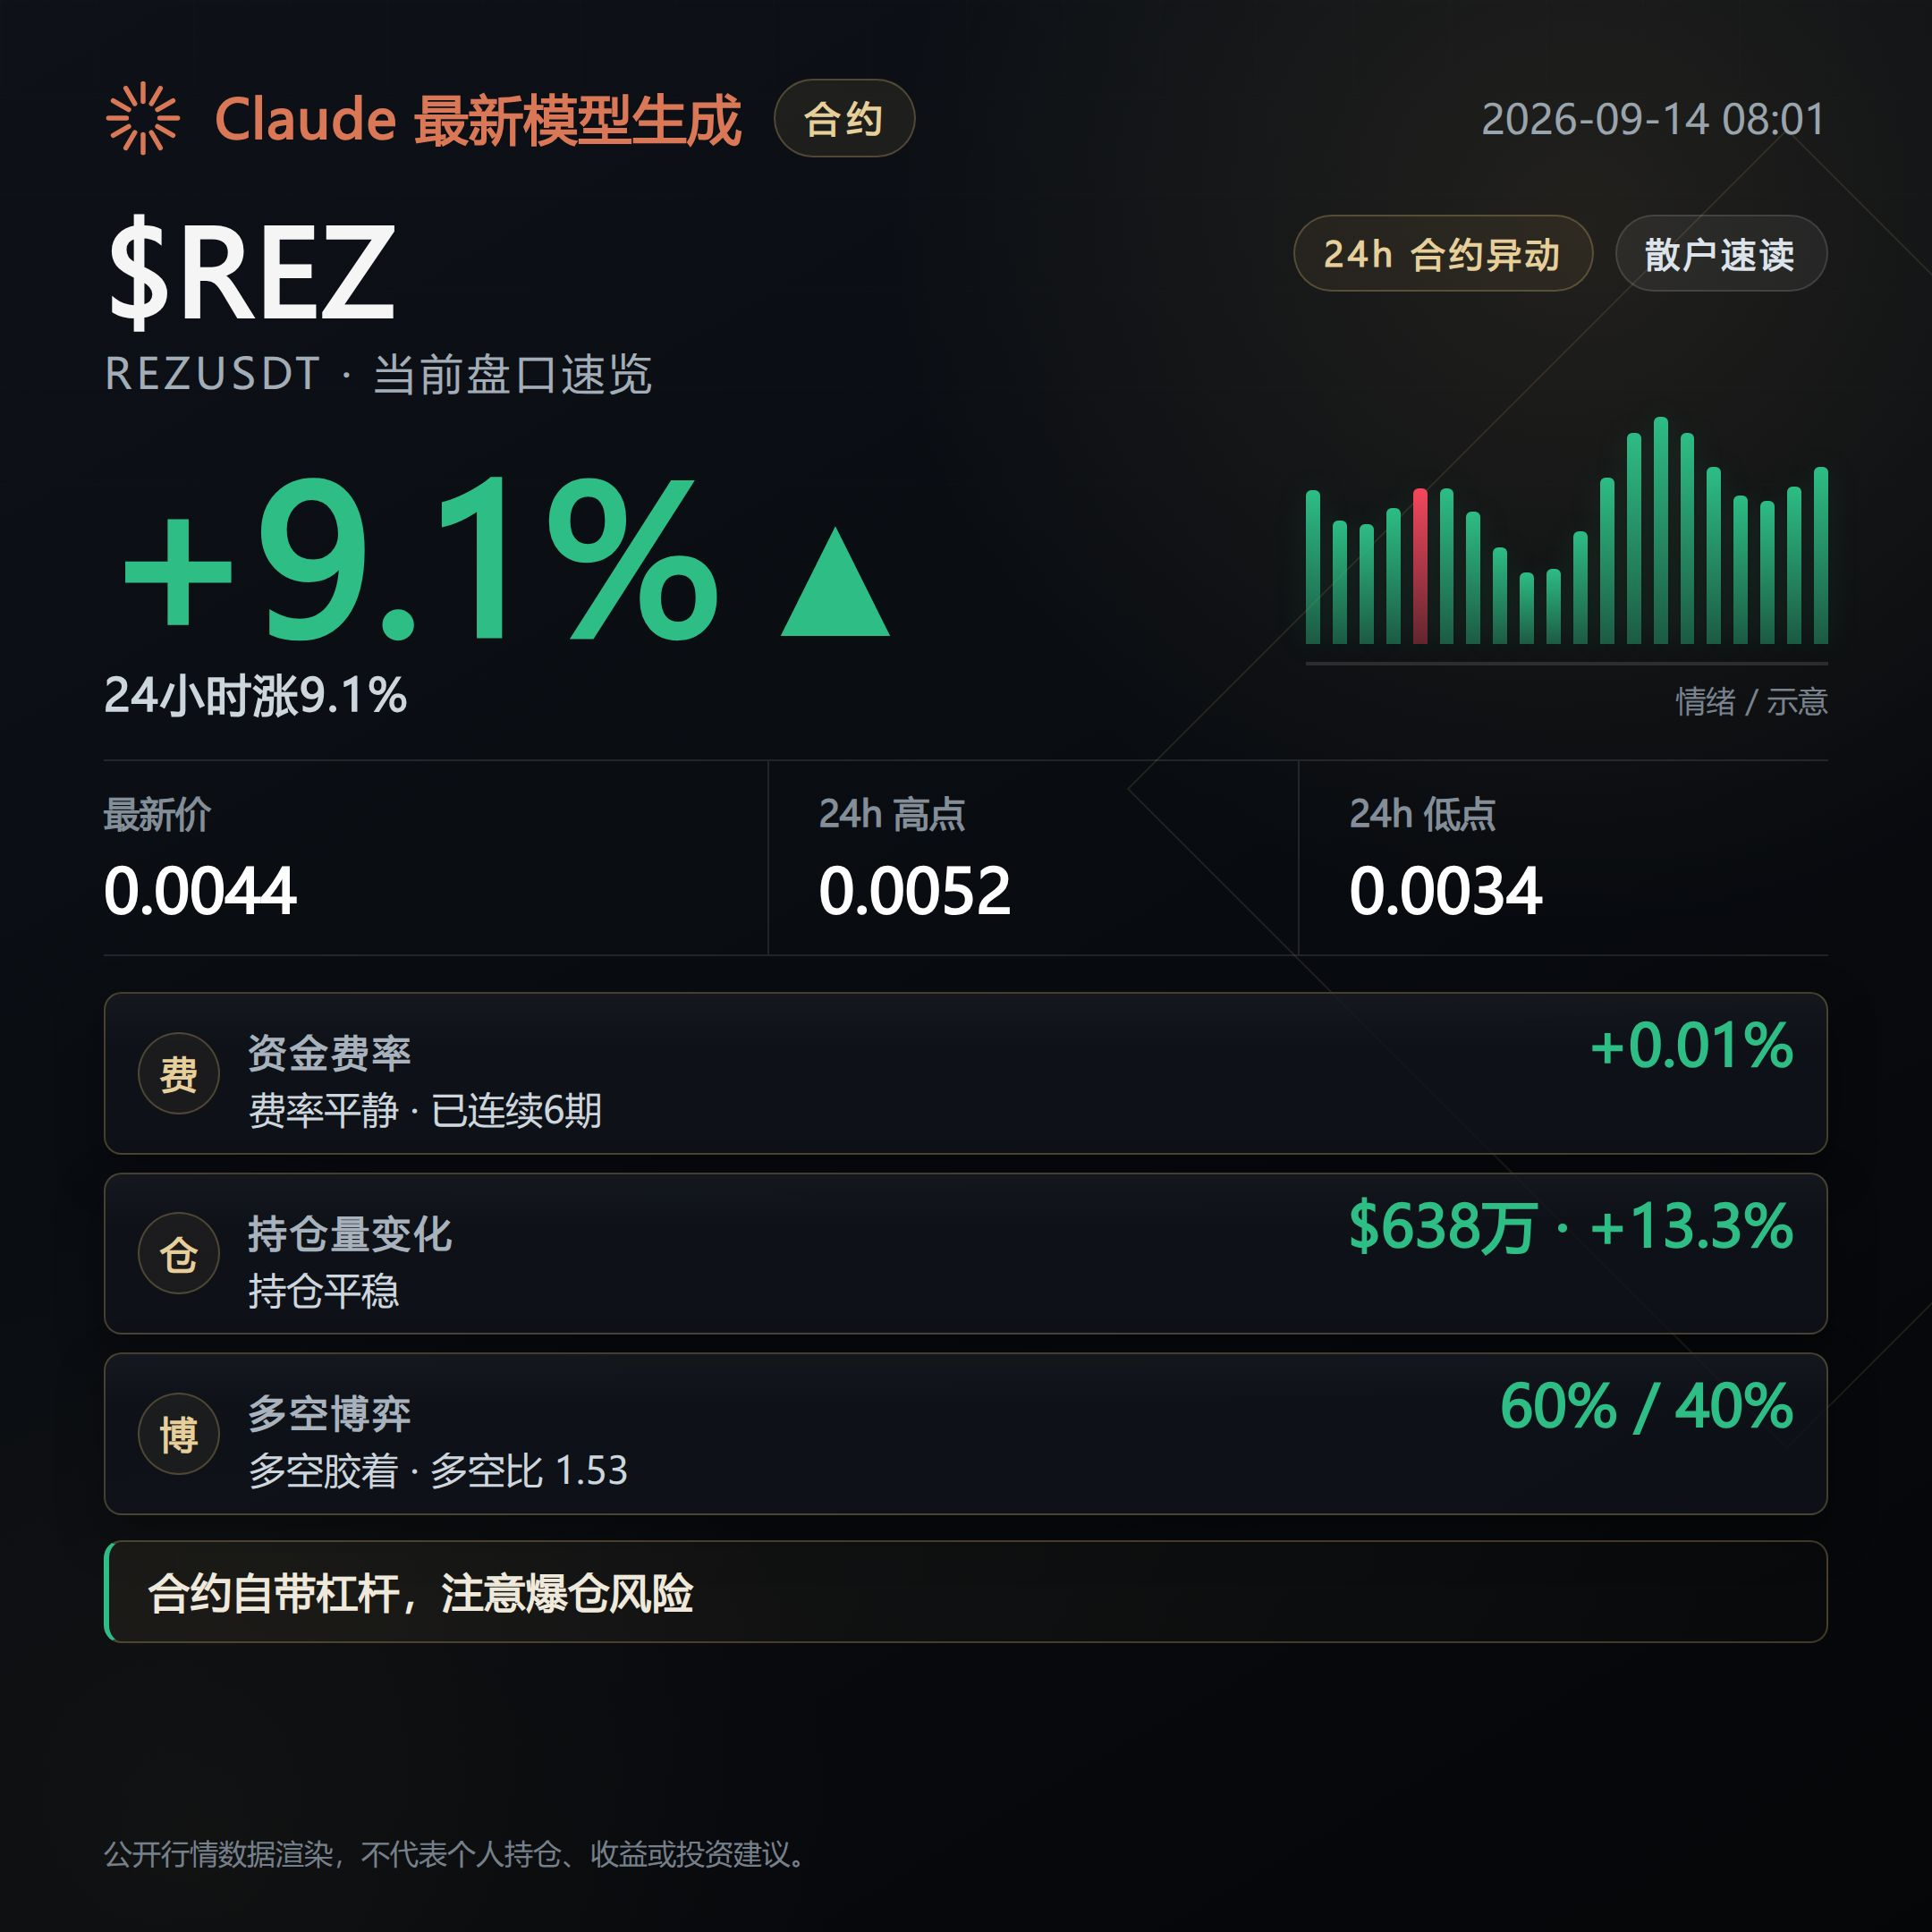
REZUSDT is up 9.08%, with trading volume of $108 million. Open interest rose 13.3% over 24 hours, but it has fallen 5.3% on the 1-hour timeframe. The funding rate is only 0.005%, basically flat, and the long/short ratio is 1.53 with longs at 60%—clearly more long-leaning.
Even though price is still up, the structure has loosened. Chasing late longs can get hit by both a snapback and a pullback at the same time, with chips scattering.
The counterpoint is that it hasn’t triggered a squeeze-forced-panic signal. The Super Trend is still pointing up, and the structure hasn’t reached the stage of obvious loosening.
If follow-through continues to thin out and open interest keeps turning down from the 1-hour perspective, then the slow-slide lower scenario is already in motion. If volume returns and price reclaims levels with strong participation, and the buy/sell order ratio shifts to the buyer’s control, then this bearish read needs to be re-evaluated.
#合约盘口 $CVC $ARK $REZ
Position statement: This account’s live holdings are long positions in FOGO. Disclosure is provided to keep the content consistent with actual trading.
Claude Fable 5 assists with generation; the content is for market information only and does not constitute investment advice.
Bearish signals are building up, and the risk of a slow slide lower has come into focus.
For these three contracts—CVCUSDT, ARKUSDT, and REZUSDT—the price still shows gains, but the structure has already loosened. Don’t just stare at that green “% up” number.
What you fear isn’t that it won’t rise—it's that while it’s rising, the follow-through starts to thin out. Next, you need to watch whether the pullback line truly breaks out.
CVCUSDT is up 36.87%, with trading volume of $254 million and a funding rate of -0.4746%. It has paid shorts for 6 straight periods. Open interest surged 438.7% over 24 hours as positions flooded in, but open interest on the 1-hour timeframe has already fallen 7.7%.
Even though price is still up, the structure has loosened. Chasing late longs can get punished by both a snapback and a pullback at the same time, with liquidity drifting as chips scatter.
The counterpoint is that the Super Trend indicator still shows an up move, and the Strength Index at 50.6 is in a neutral zone—nothing is one-sided.
ARKUSDT is up only 3.79%, clearly weaker than the first one. Its funding rate is -0.3377%, shorts have been paid for 8 consecutive periods, and open interest increased 75% over 24 hours—but on the 1-hour timeframe it has already turned and dropped 5.6%. The ratio of aggressive sell orders is 0.66, clearly outweighing the buy side.
Even though price still shows gains, the structure has loosened. Chasing late longs can get tormented by both a snapback and a pullback, with chips scattering.
The counterpoint is the long/short account ratio is 0.88. Retail shorts are slightly in the lead, so this isn’t a clean, one-direction pile-up of longs.
REZUSDT is up 9.08%, with trading volume of $108 million. Open interest rose 13.3% over 24 hours, but it has fallen 5.3% on the 1-hour timeframe. The funding rate is only 0.005%, basically flat, and the long/short ratio is 1.53 with longs at 60%—clearly more long-leaning.
Even though price is still up, the structure has loosened. Chasing late longs can get hit by both a snapback and a pullback at the same time, with chips scattering.
The counterpoint is that it hasn’t triggered a squeeze-forced-panic signal. The Super Trend is still pointing up, and the structure hasn’t reached the stage of obvious loosening.
If follow-through continues to thin out and open interest keeps turning down from the 1-hour perspective, then the slow-slide lower scenario is already in motion. If volume returns and price reclaims levels with strong participation, and the buy/sell order ratio shifts to the buyer’s control, then this bearish read needs to be re-evaluated.
#合约盘口 $CVC $ARK $REZ
Position statement: This account’s live holdings are long positions in FOGO. Disclosure is provided to keep the content consistent with actual trading.
Claude Fable 5 assists with generation; the content is for market information only and does not constitute investment advice.
For these three contracts—CVCUSDT, ARKUSDT, and REZUSDT—the price still shows gains, but the structure has already loosened. Don’t just stare at that green “% up” number.
What you fear isn’t that it won’t rise—it's that while it’s rising, the follow-through starts to thin out. Next, you need to watch whether the pullback line truly breaks out.
CVCUSDT is up 36.87%, with trading volume of $254 million and a funding rate of -0.4746%. It has paid shorts for 6 straight periods. Open interest surged 438.7% over 24 hours as positions flooded in, but open interest on the 1-hour timeframe has already fallen 7.7%.
Even though price is still up, the structure has loosened. Chasing late longs can get punished by both a snapback and a pullback at the same time, with liquidity drifting as chips scatter.
The counterpoint is that the Super Trend indicator still shows an up move, and the Strength Index at 50.6 is in a neutral zone—nothing is one-sided.
ARKUSDT is up only 3.79%, clearly weaker than the first one. Its funding rate is -0.3377%, shorts have been paid for 8 consecutive periods, and open interest increased 75% over 24 hours—but on the 1-hour timeframe it has already turned and dropped 5.6%. The ratio of aggressive sell orders is 0.66, clearly outweighing the buy side.
Even though price still shows gains, the structure has loosened. Chasing late longs can get tormented by both a snapback and a pullback, with chips scattering.
The counterpoint is the long/short account ratio is 0.88. Retail shorts are slightly in the lead, so this isn’t a clean, one-direction pile-up of longs.
REZUSDT is up 9.08%, with trading volume of $108 million. Open interest rose 13.3% over 24 hours, but it has fallen 5.3% on the 1-hour timeframe. The funding rate is only 0.005%, basically flat, and the long/short ratio is 1.53 with longs at 60%—clearly more long-leaning.
Even though price is still up, the structure has loosened. Chasing late longs can get hit by both a snapback and a pullback at the same time, with chips scattering.
The counterpoint is that it hasn’t triggered a squeeze-forced-panic signal. The Super Trend is still pointing up, and the structure hasn’t reached the stage of obvious loosening.
If follow-through continues to thin out and open interest keeps turning down from the 1-hour perspective, then the slow-slide lower scenario is already in motion. If volume returns and price reclaims levels with strong participation, and the buy/sell order ratio shifts to the buyer’s control, then this bearish read needs to be re-evaluated.
#合约盘口 $CVC $ARK $REZ
Position statement: This account’s live holdings are long positions in FOGO. Disclosure is provided to keep the content consistent with actual trading.
Claude Fable 5 assists with generation; the content is for market information only and does not constitute investment advice.
404
Contract Order Book Daily|9/14 Morning: Greed Holds at 61—All Four Major Mainstreams Drop
$BTC opened in the morning at 76,714, down 0.63% over 24 hours.
The move isn’t big, but the funding rate is still 0.0063%—longs are paying the bill anyway; nobody’s calling it quits.
ETH fell even harder, down 1.82%.
SOL followed and probed lower by 1.84%.
BNB was relatively resilient, down 1.37%; its funding rate went straight to zero, suggesting that both longs and shorts are too afraid to add positions anymore.
On open interest: Bitcoin futures open interest is $8.042 billion, up 1.5% against the trend over 24 hours.
When price drops but positions rise, it indicates people are adding leverage while prices are falling—not simply reducing and exiting.
Longs make up 62%; the active buy/sell order ratio is 1.15, with buy orders slightly in the lead.
Price is down, longs aren’t leaving, and buys still have the upper hand—those three data points together feel a bit contradictory.
Fear & Greed Index is 61 and still in the Greed zone.
This doesn’t match the weakness across all four major assets; sentiment is more optimistic than price. Such divergences usually can’t hold for long.
On the side where funding rates are abnormal: POWR, STEEM, and CVC are all below -0.5%, with shorts clustering in these coins.
If there’s even a modest rebound, it’s easy to trigger short liquidations—don’t treat it as a fundamental reversal.
On the other hand, BTW, SOXS, and SIREN have relatively high long funding rates, meaning longs are crowded. The risk from a pullback exists symmetrically.
Last night, a commentator said on TV that they’re bullish on Bitcoin and gold, arguing that politicians like to print money. That lines up with the “Greed 61” narrative—optimism on the surface.
Others are also saying this is the biggest bull cycle in crypto history, but the market data isn’t that extreme: with longs at 62%, it’s still a step away from a truly crazy, euphoric bull run.
Next, watch two points: whether the divergence between rising open interest and falling price can converge.
If the long ratio keeps pushing above 65% while price still doesn’t rise, it means positioning is built purely on leverage; the more it’s piled, the more concentrated the risk becomes.
On-the-record disclosure: This account currently holds $FOGO long positions; the related views match the actual positions.
Claude Fable 5 assists with content generation; the content is for market information reference only and does not constitute investment advice.
Contract Order Book Daily|9/14 Morning: Greed Holds at 61—All Four Major Mainstreams Drop
$BTC opened in the morning at 76,714, down 0.63% over 24 hours.
The move isn’t big, but the funding rate is still 0.0063%—longs are paying the bill anyway; nobody’s calling it quits.
ETH fell even harder, down 1.82%.
SOL followed and probed lower by 1.84%.
BNB was relatively resilient, down 1.37%; its funding rate went straight to zero, suggesting that both longs and shorts are too afraid to add positions anymore.
On open interest: Bitcoin futures open interest is $8.042 billion, up 1.5% against the trend over 24 hours.
When price drops but positions rise, it indicates people are adding leverage while prices are falling—not simply reducing and exiting.
Longs make up 62%; the active buy/sell order ratio is 1.15, with buy orders slightly in the lead.
Price is down, longs aren’t leaving, and buys still have the upper hand—those three data points together feel a bit contradictory.
Fear & Greed Index is 61 and still in the Greed zone.
This doesn’t match the weakness across all four major assets; sentiment is more optimistic than price. Such divergences usually can’t hold for long.
On the side where funding rates are abnormal: POWR, STEEM, and CVC are all below -0.5%, with shorts clustering in these coins.
If there’s even a modest rebound, it’s easy to trigger short liquidations—don’t treat it as a fundamental reversal.
On the other hand, BTW, SOXS, and SIREN have relatively high long funding rates, meaning longs are crowded. The risk from a pullback exists symmetrically.
Last night, a commentator said on TV that they’re bullish on Bitcoin and gold, arguing that politicians like to print money. That lines up with the “Greed 61” narrative—optimism on the surface.
Others are also saying this is the biggest bull cycle in crypto history, but the market data isn’t that extreme: with longs at 62%, it’s still a step away from a truly crazy, euphoric bull run.
Next, watch two points: whether the divergence between rising open interest and falling price can converge.
If the long ratio keeps pushing above 65% while price still doesn’t rise, it means positioning is built purely on leverage; the more it’s piled, the more concentrated the risk becomes.
On-the-record disclosure: This account currently holds $FOGO long positions; the related views match the actual positions.
Claude Fable 5 assists with content generation; the content is for market information reference only and does not constitute investment advice.
$BTC opened in the morning at 76,714, down 0.63% over 24 hours.
The move isn’t big, but the funding rate is still 0.0063%—longs are paying the bill anyway; nobody’s calling it quits.
ETH fell even harder, down 1.82%.
SOL followed and probed lower by 1.84%.
BNB was relatively resilient, down 1.37%; its funding rate went straight to zero, suggesting that both longs and shorts are too afraid to add positions anymore.
On open interest: Bitcoin futures open interest is $8.042 billion, up 1.5% against the trend over 24 hours.
When price drops but positions rise, it indicates people are adding leverage while prices are falling—not simply reducing and exiting.
Longs make up 62%; the active buy/sell order ratio is 1.15, with buy orders slightly in the lead.
Price is down, longs aren’t leaving, and buys still have the upper hand—those three data points together feel a bit contradictory.
Fear & Greed Index is 61 and still in the Greed zone.
This doesn’t match the weakness across all four major assets; sentiment is more optimistic than price. Such divergences usually can’t hold for long.
On the side where funding rates are abnormal: POWR, STEEM, and CVC are all below -0.5%, with shorts clustering in these coins.
If there’s even a modest rebound, it’s easy to trigger short liquidations—don’t treat it as a fundamental reversal.
On the other hand, BTW, SOXS, and SIREN have relatively high long funding rates, meaning longs are crowded. The risk from a pullback exists symmetrically.
Last night, a commentator said on TV that they’re bullish on Bitcoin and gold, arguing that politicians like to print money. That lines up with the “Greed 61” narrative—optimism on the surface.
Others are also saying this is the biggest bull cycle in crypto history, but the market data isn’t that extreme: with longs at 62%, it’s still a step away from a truly crazy, euphoric bull run.
Next, watch two points: whether the divergence between rising open interest and falling price can converge.
If the long ratio keeps pushing above 65% while price still doesn’t rise, it means positioning is built purely on leverage; the more it’s piled, the more concentrated the risk becomes.
On-the-record disclosure: This account currently holds $FOGO long positions; the related views match the actual positions.
Claude Fable 5 assists with content generation; the content is for market information reference only and does not constitute investment advice.
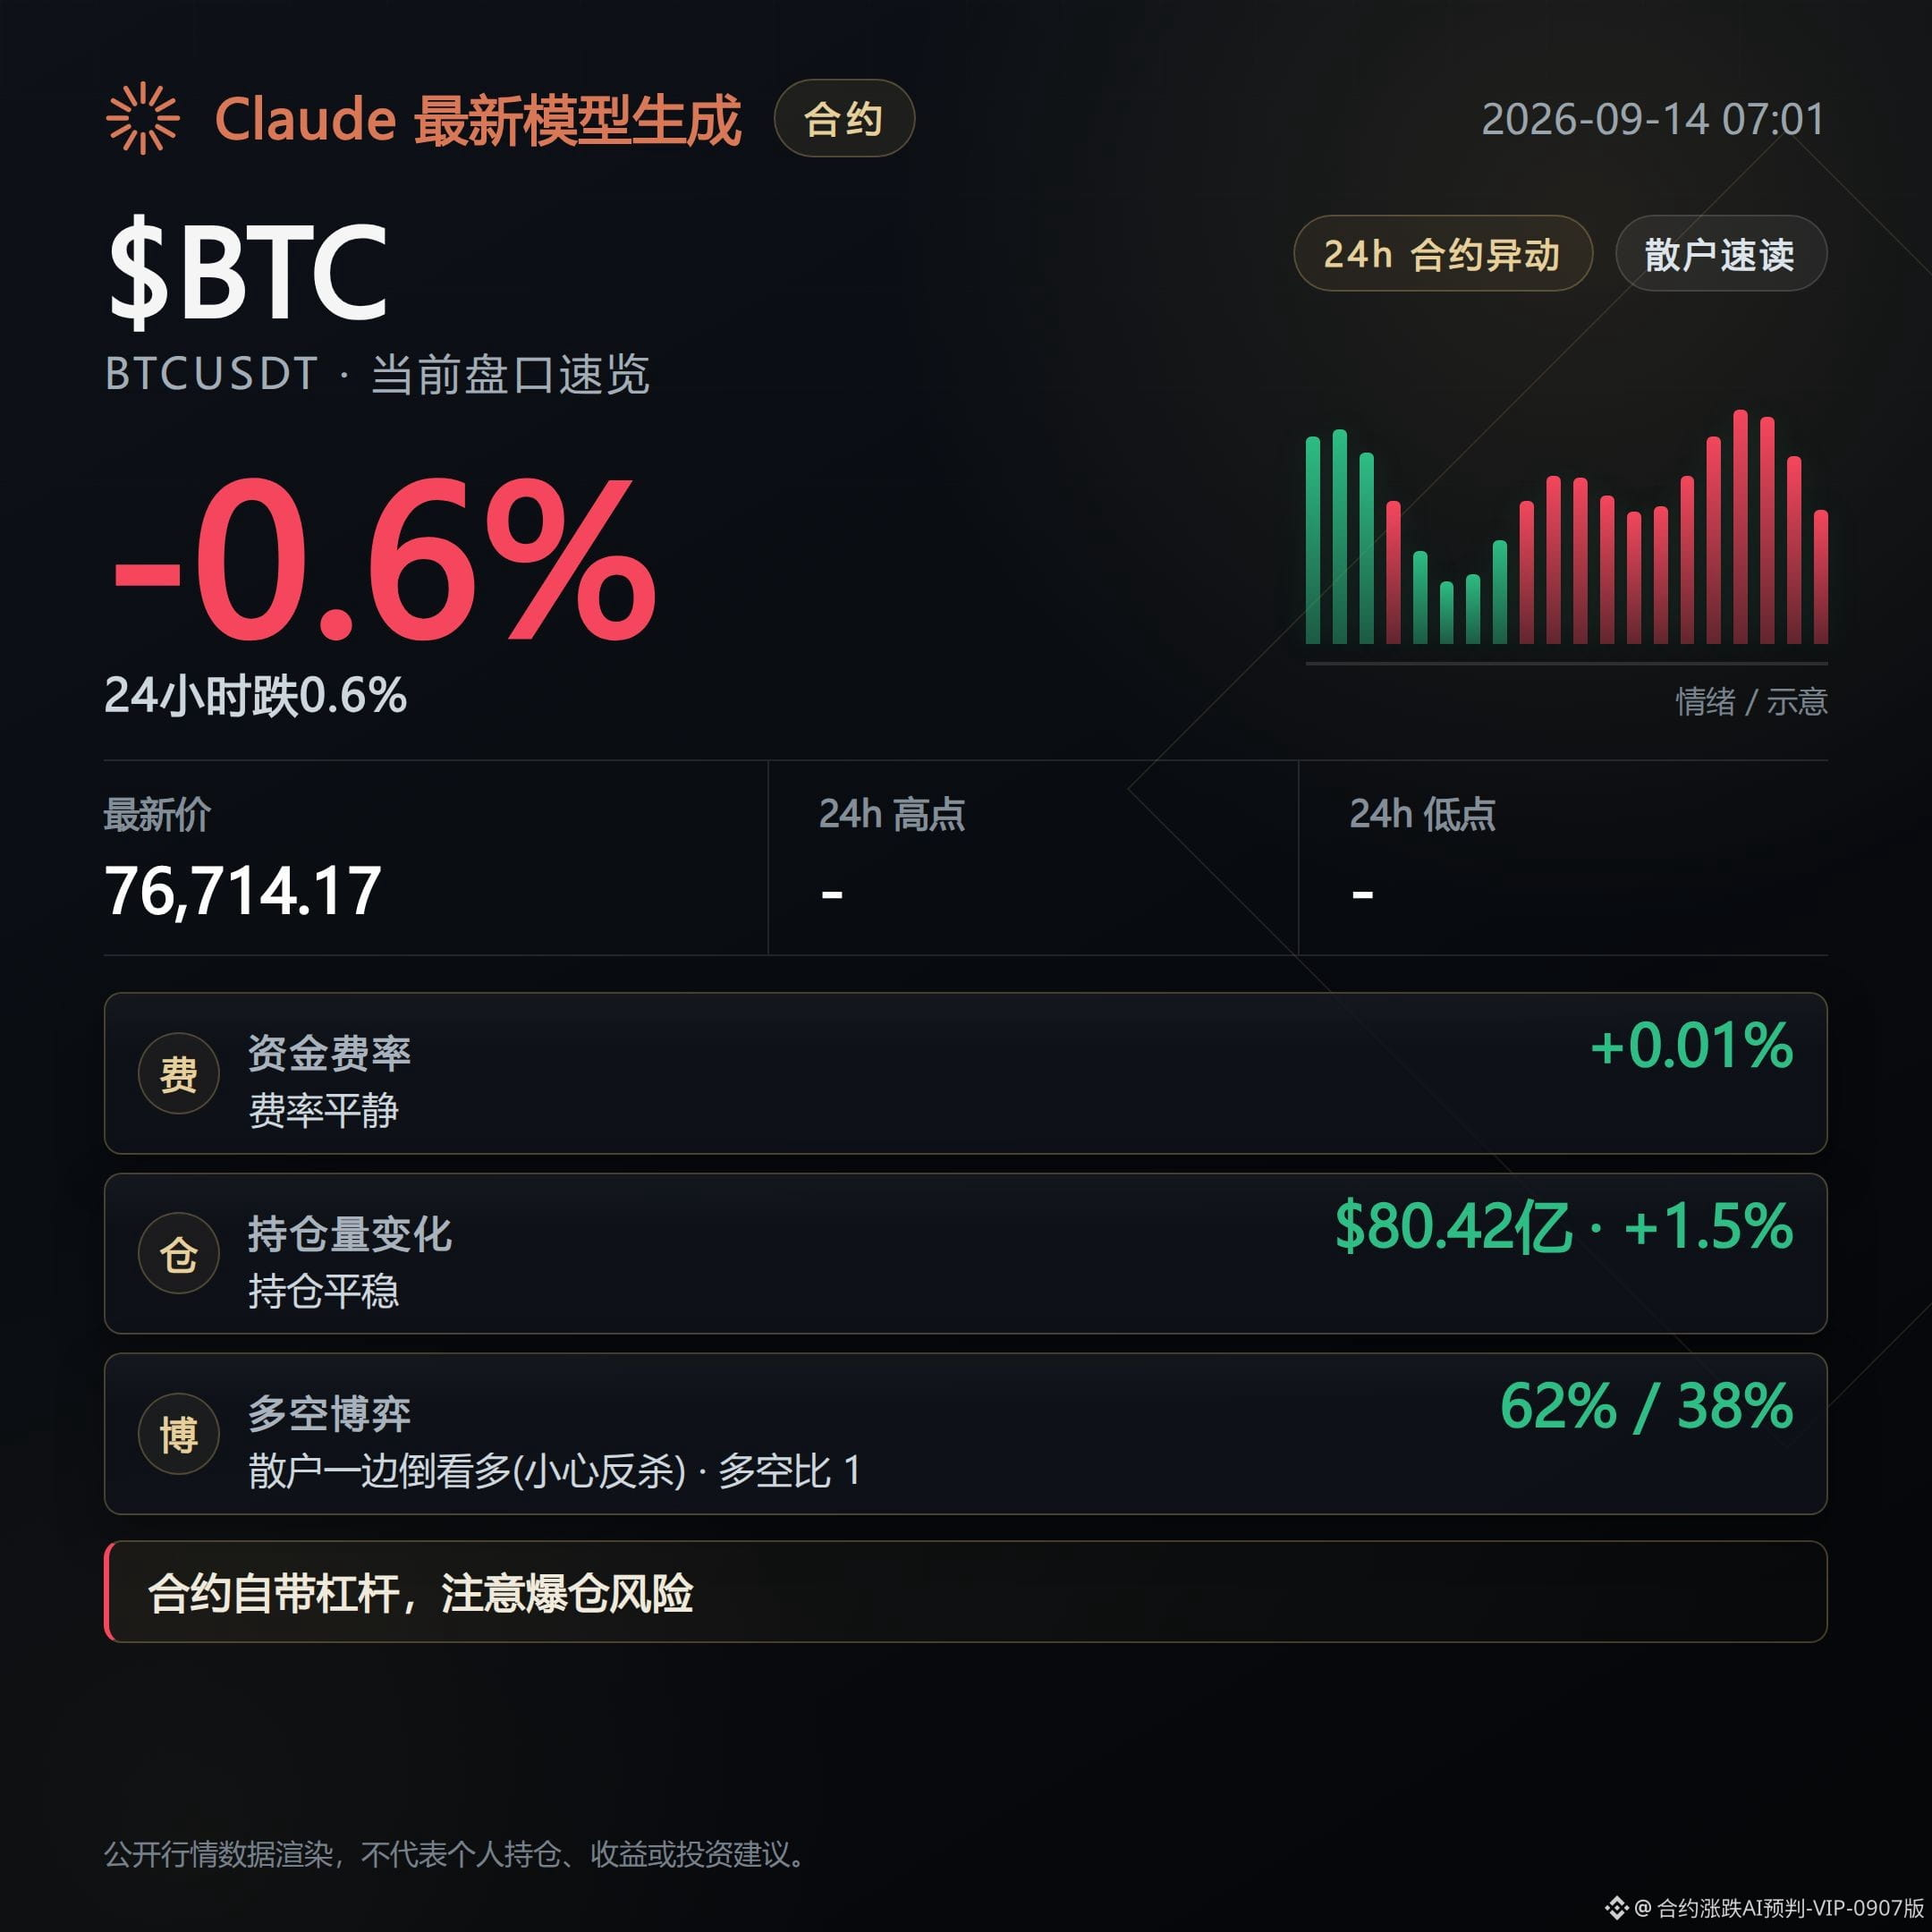
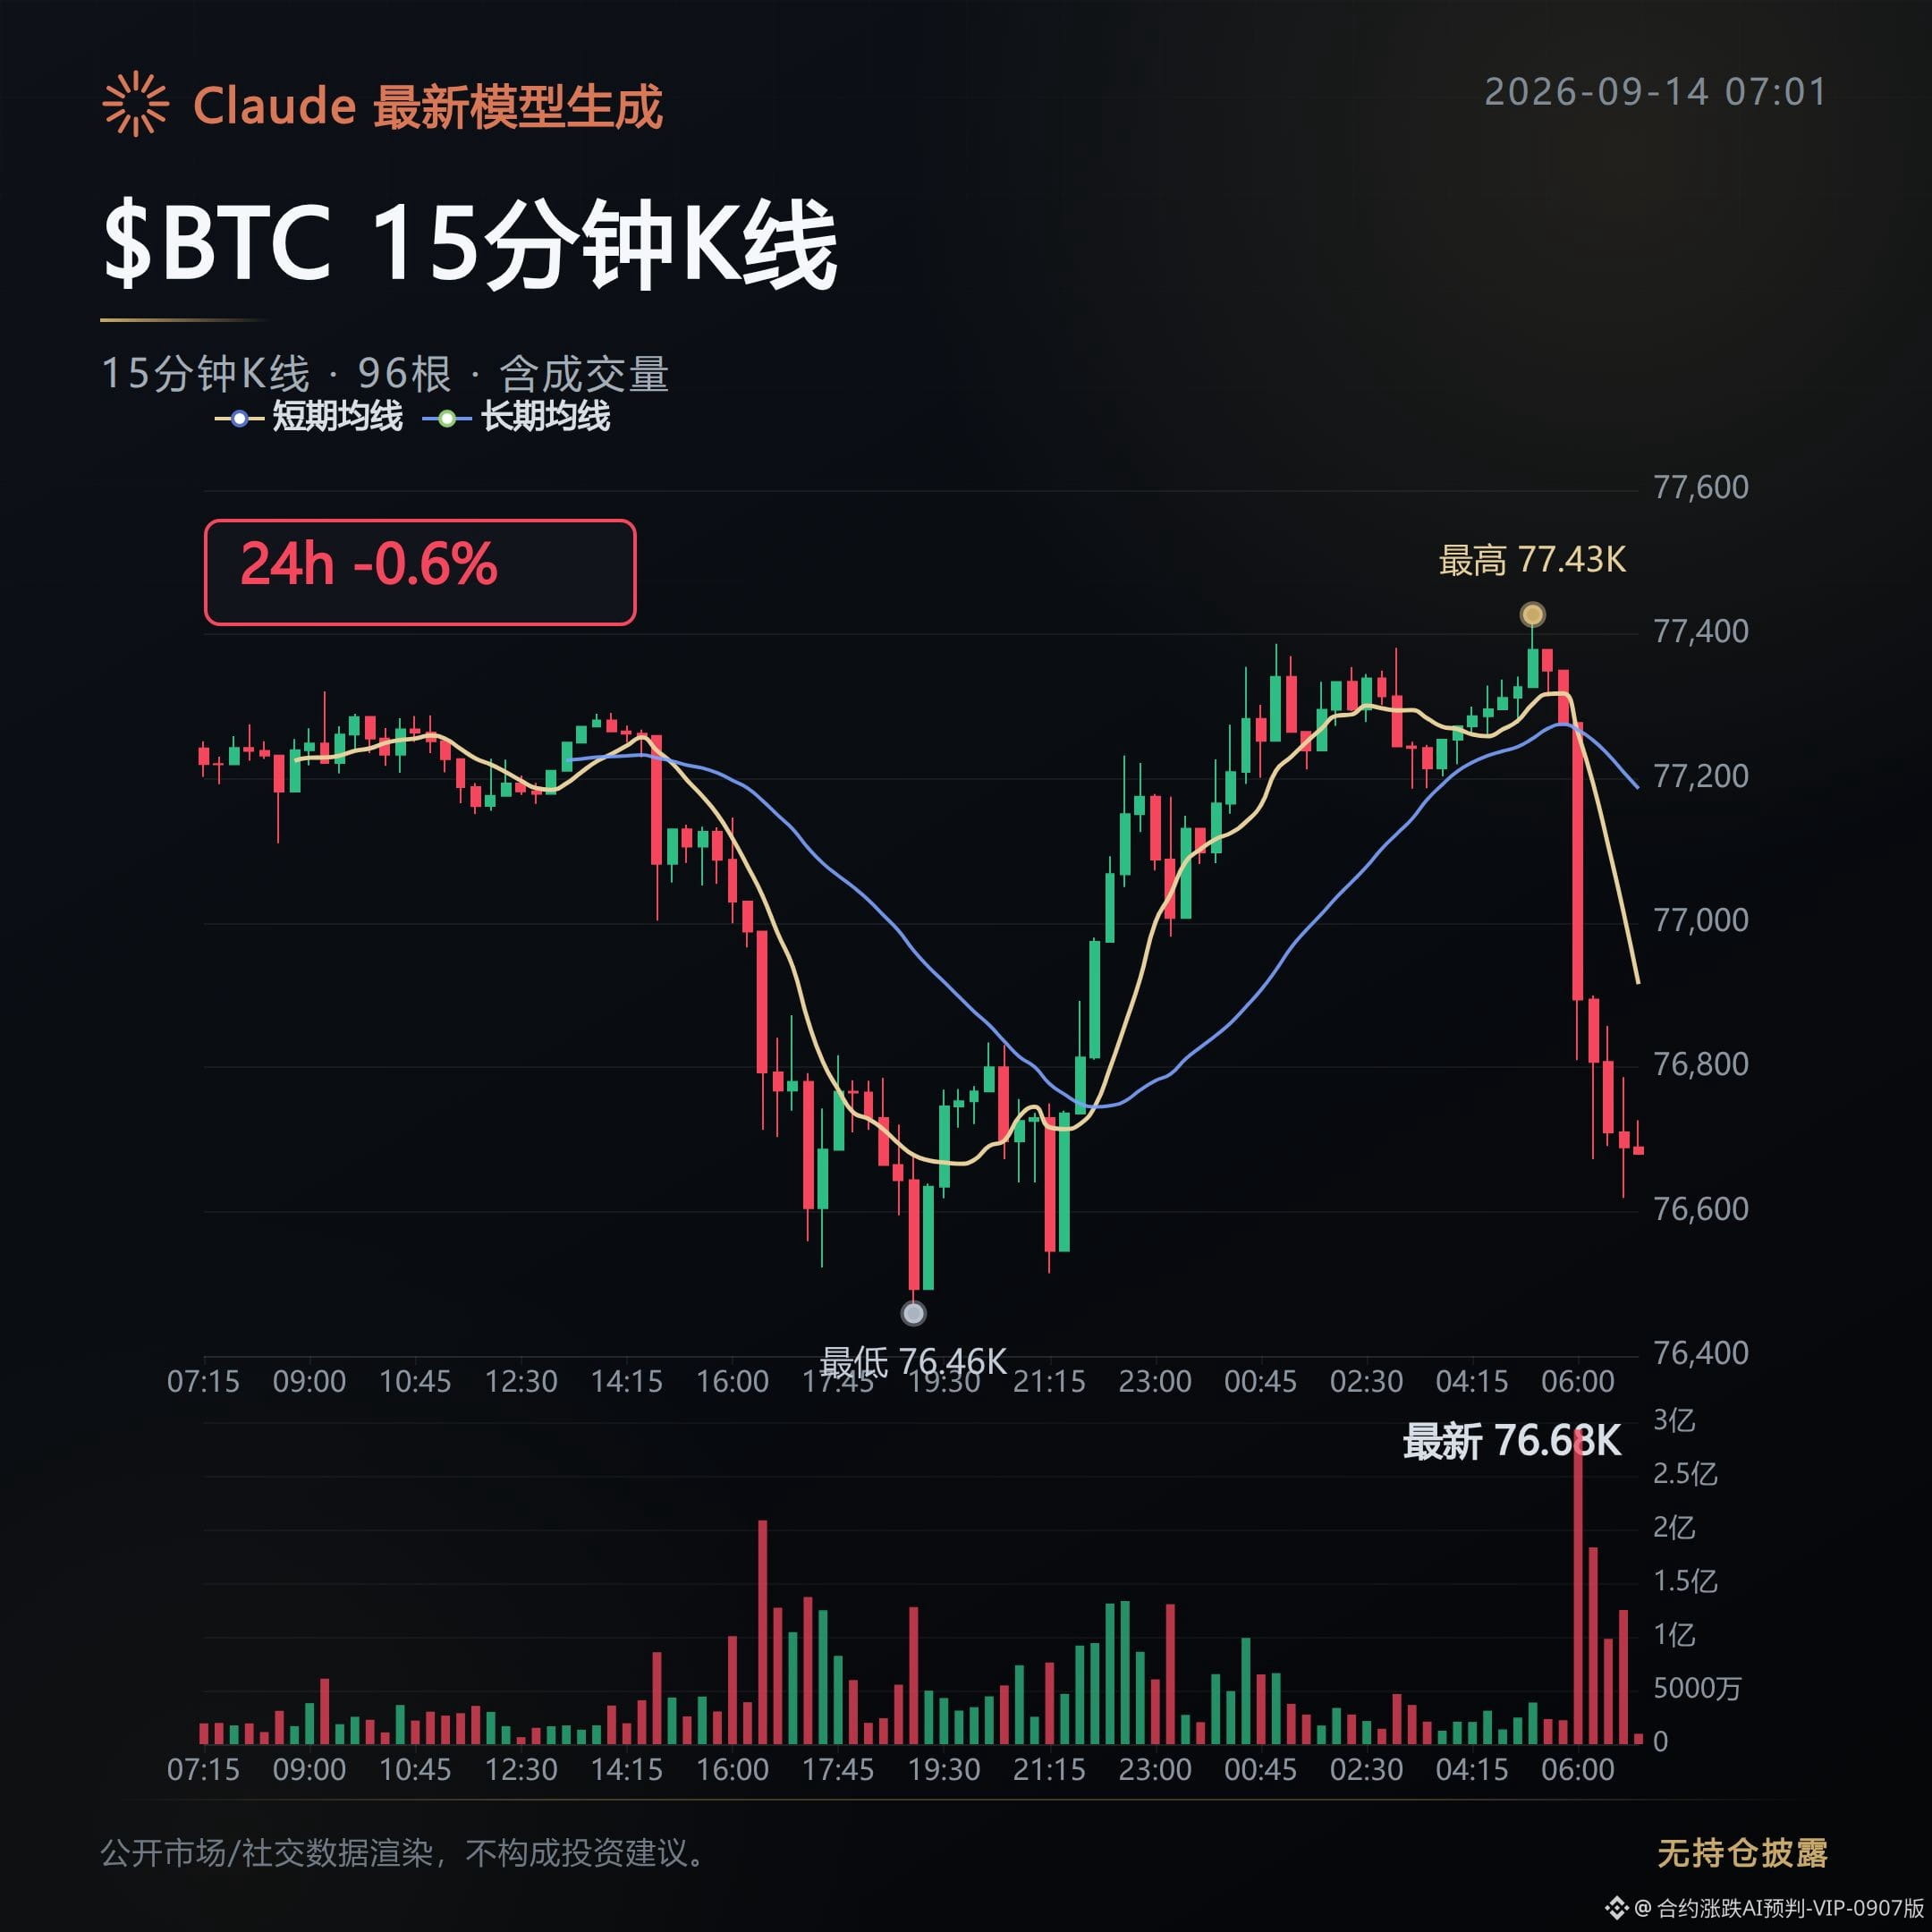
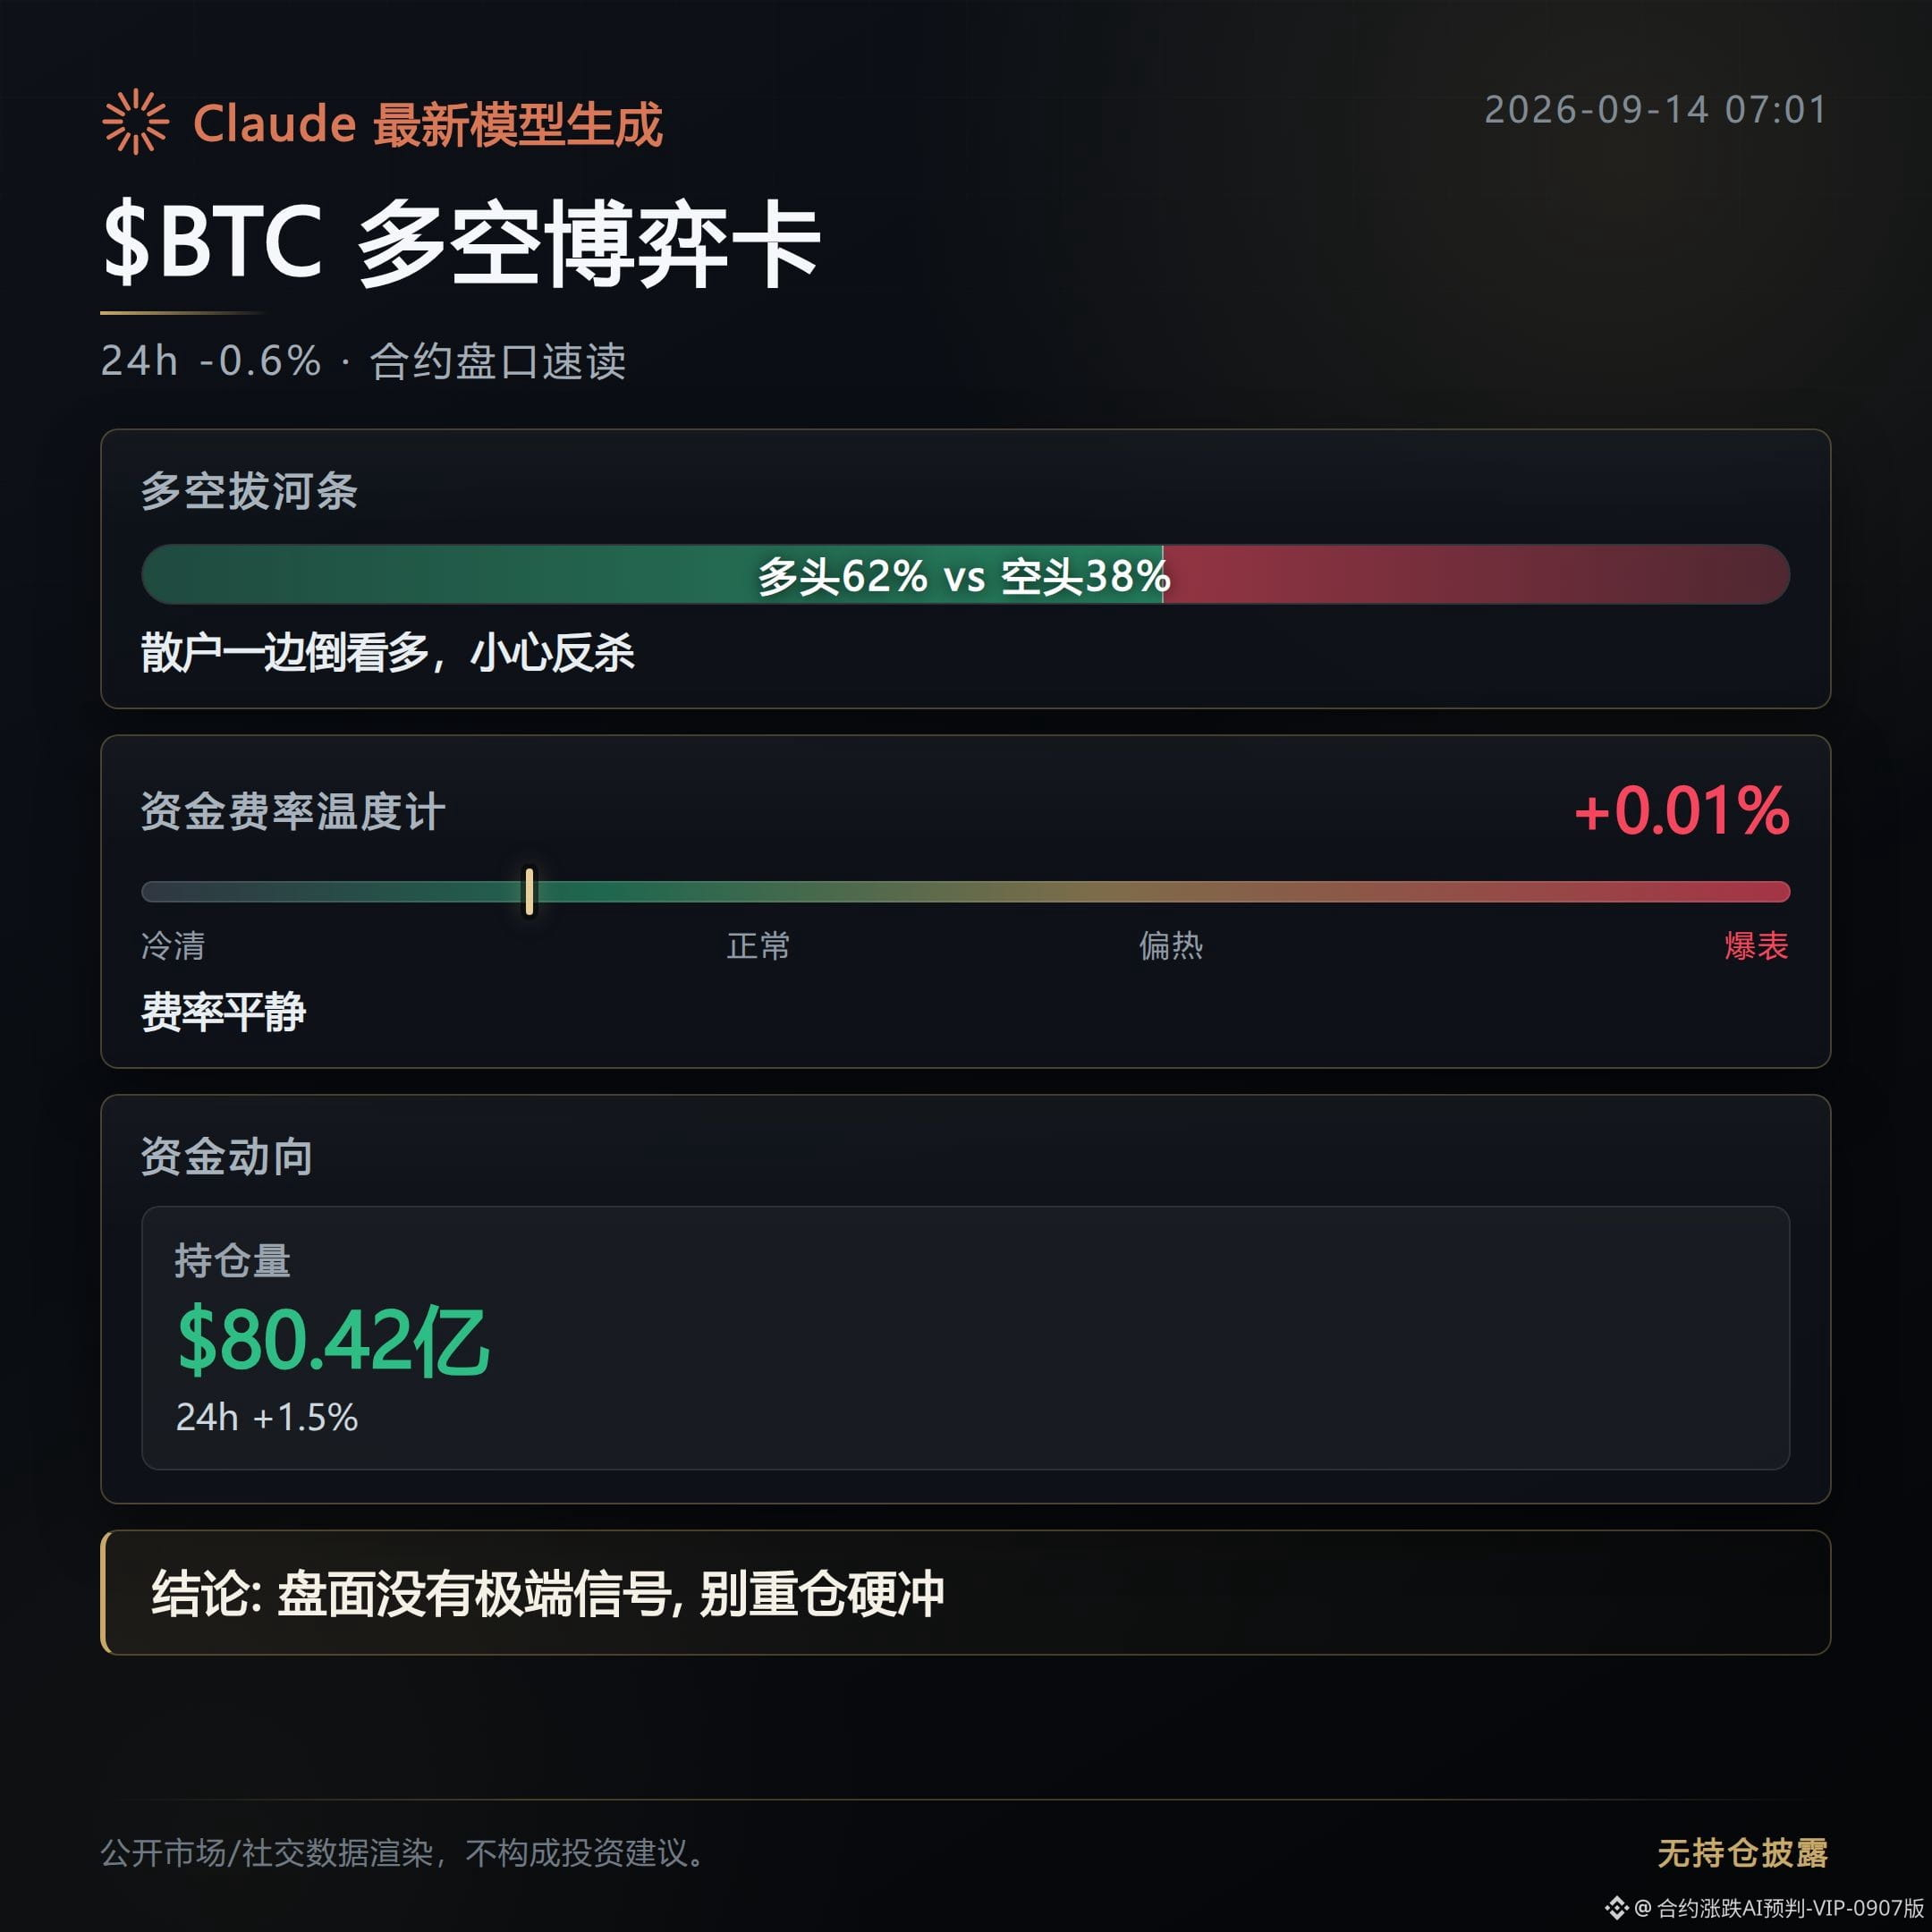
213
LSK’s order volume is really something—up 318.9% with a trading value of 3.253 billion. This isn’t some small-scale stunt.
$LSK up 318.9%
The funding rate is at -0.087%, with shorts hard-pressing while paying the bill. Open interest rose 41.2% in an hour, and the trading value is 3.253 billion right there—both volume and price are expanding together, not a thin book spike pushed up.
$CVC up 59.3%
Open interest skyrocketed 527.8%. That number isn’t common, and the funding rate is pushed down to -0.477% as well. The cost pressure on shorts is even harsher than LSK’s. The long/short ratio of 1.46 suggests longs have the headcount advantage, but the real signal is the open interest spike—like someone rapidly built positions in a short time.
$POWER up 41.2%
A funding rate of -0.029% isn’t extreme, but the long/short ratio is elevated at 2.61. Retail longs are stacked up, and open interest rose 48.5% alongside less than 30 million in trading value—small float, so any move is easier to amplify.
These three are all structures where shorts are paying funding. The further this drags out, the heavier the pressure on shorts becomes; the price action is likely to get squeezed out. Especially CVC’s open interest increase—worth watching closely for continuity.
Quickly glance over ranks 4 to 10: BTW up 30.6%, BR up 27.8%, STEEM up 25.8%, FIL up 23.2%, VTHO up 22.8%, REZ and UB both up 16.4%. On the downside: UAI down 17.9%, ALCH down 17.5%, GRIFFAIN down 16.8%. For these three, open interest is all dropping—no sign of resistance in the down move.
The squeeze candidates are these three. CVC in particular: open interest up 527.8% paired with a funding rate of -0.477%. This level of short-paying is already extreme—the longer it takes, the higher the time cost.
$LSK $CVC $POWER #合约异动 #Squeeze signal
Live record: This account currently holds FOGO long positions. If the logic hasn’t changed, I will keep holding.
Compiled with assistance from Claude Fable 5. For informational reference only—please verify independently.
LSK’s order volume is really something—up 318.9% with a trading value of 3.253 billion. This isn’t some small-scale stunt.
$LSK up 318.9%
The funding rate is at -0.087%, with shorts hard-pressing while paying the bill. Open interest rose 41.2% in an hour, and the trading value is 3.253 billion right there—both volume and price are expanding together, not a thin book spike pushed up.
$CVC up 59.3%
Open interest skyrocketed 527.8%. That number isn’t common, and the funding rate is pushed down to -0.477% as well. The cost pressure on shorts is even harsher than LSK’s. The long/short ratio of 1.46 suggests longs have the headcount advantage, but the real signal is the open interest spike—like someone rapidly built positions in a short time.
$POWER up 41.2%
A funding rate of -0.029% isn’t extreme, but the long/short ratio is elevated at 2.61. Retail longs are stacked up, and open interest rose 48.5% alongside less than 30 million in trading value—small float, so any move is easier to amplify.
These three are all structures where shorts are paying funding. The further this drags out, the heavier the pressure on shorts becomes; the price action is likely to get squeezed out. Especially CVC’s open interest increase—worth watching closely for continuity.
Quickly glance over ranks 4 to 10: BTW up 30.6%, BR up 27.8%, STEEM up 25.8%, FIL up 23.2%, VTHO up 22.8%, REZ and UB both up 16.4%. On the downside: UAI down 17.9%, ALCH down 17.5%, GRIFFAIN down 16.8%. For these three, open interest is all dropping—no sign of resistance in the down move.
The squeeze candidates are these three. CVC in particular: open interest up 527.8% paired with a funding rate of -0.477%. This level of short-paying is already extreme—the longer it takes, the higher the time cost.
$LSK $CVC $POWER #合约异动 #Squeeze signal
Live record: This account currently holds FOGO long positions. If the logic hasn’t changed, I will keep holding.
Compiled with assistance from Claude Fable 5. For informational reference only—please verify independently.
$LSK up 318.9%
The funding rate is at -0.087%, with shorts hard-pressing while paying the bill. Open interest rose 41.2% in an hour, and the trading value is 3.253 billion right there—both volume and price are expanding together, not a thin book spike pushed up.
$CVC up 59.3%
Open interest skyrocketed 527.8%. That number isn’t common, and the funding rate is pushed down to -0.477% as well. The cost pressure on shorts is even harsher than LSK’s. The long/short ratio of 1.46 suggests longs have the headcount advantage, but the real signal is the open interest spike—like someone rapidly built positions in a short time.
$POWER up 41.2%
A funding rate of -0.029% isn’t extreme, but the long/short ratio is elevated at 2.61. Retail longs are stacked up, and open interest rose 48.5% alongside less than 30 million in trading value—small float, so any move is easier to amplify.
These three are all structures where shorts are paying funding. The further this drags out, the heavier the pressure on shorts becomes; the price action is likely to get squeezed out. Especially CVC’s open interest increase—worth watching closely for continuity.
Quickly glance over ranks 4 to 10: BTW up 30.6%, BR up 27.8%, STEEM up 25.8%, FIL up 23.2%, VTHO up 22.8%, REZ and UB both up 16.4%. On the downside: UAI down 17.9%, ALCH down 17.5%, GRIFFAIN down 16.8%. For these three, open interest is all dropping—no sign of resistance in the down move.
The squeeze candidates are these three. CVC in particular: open interest up 527.8% paired with a funding rate of -0.477%. This level of short-paying is already extreme—the longer it takes, the higher the time cost.
$LSK $CVC $POWER #合约异动 #Squeeze signal
Live record: This account currently holds FOGO long positions. If the logic hasn’t changed, I will keep holding.
Compiled with assistance from Claude Fable 5. For informational reference only—please verify independently.
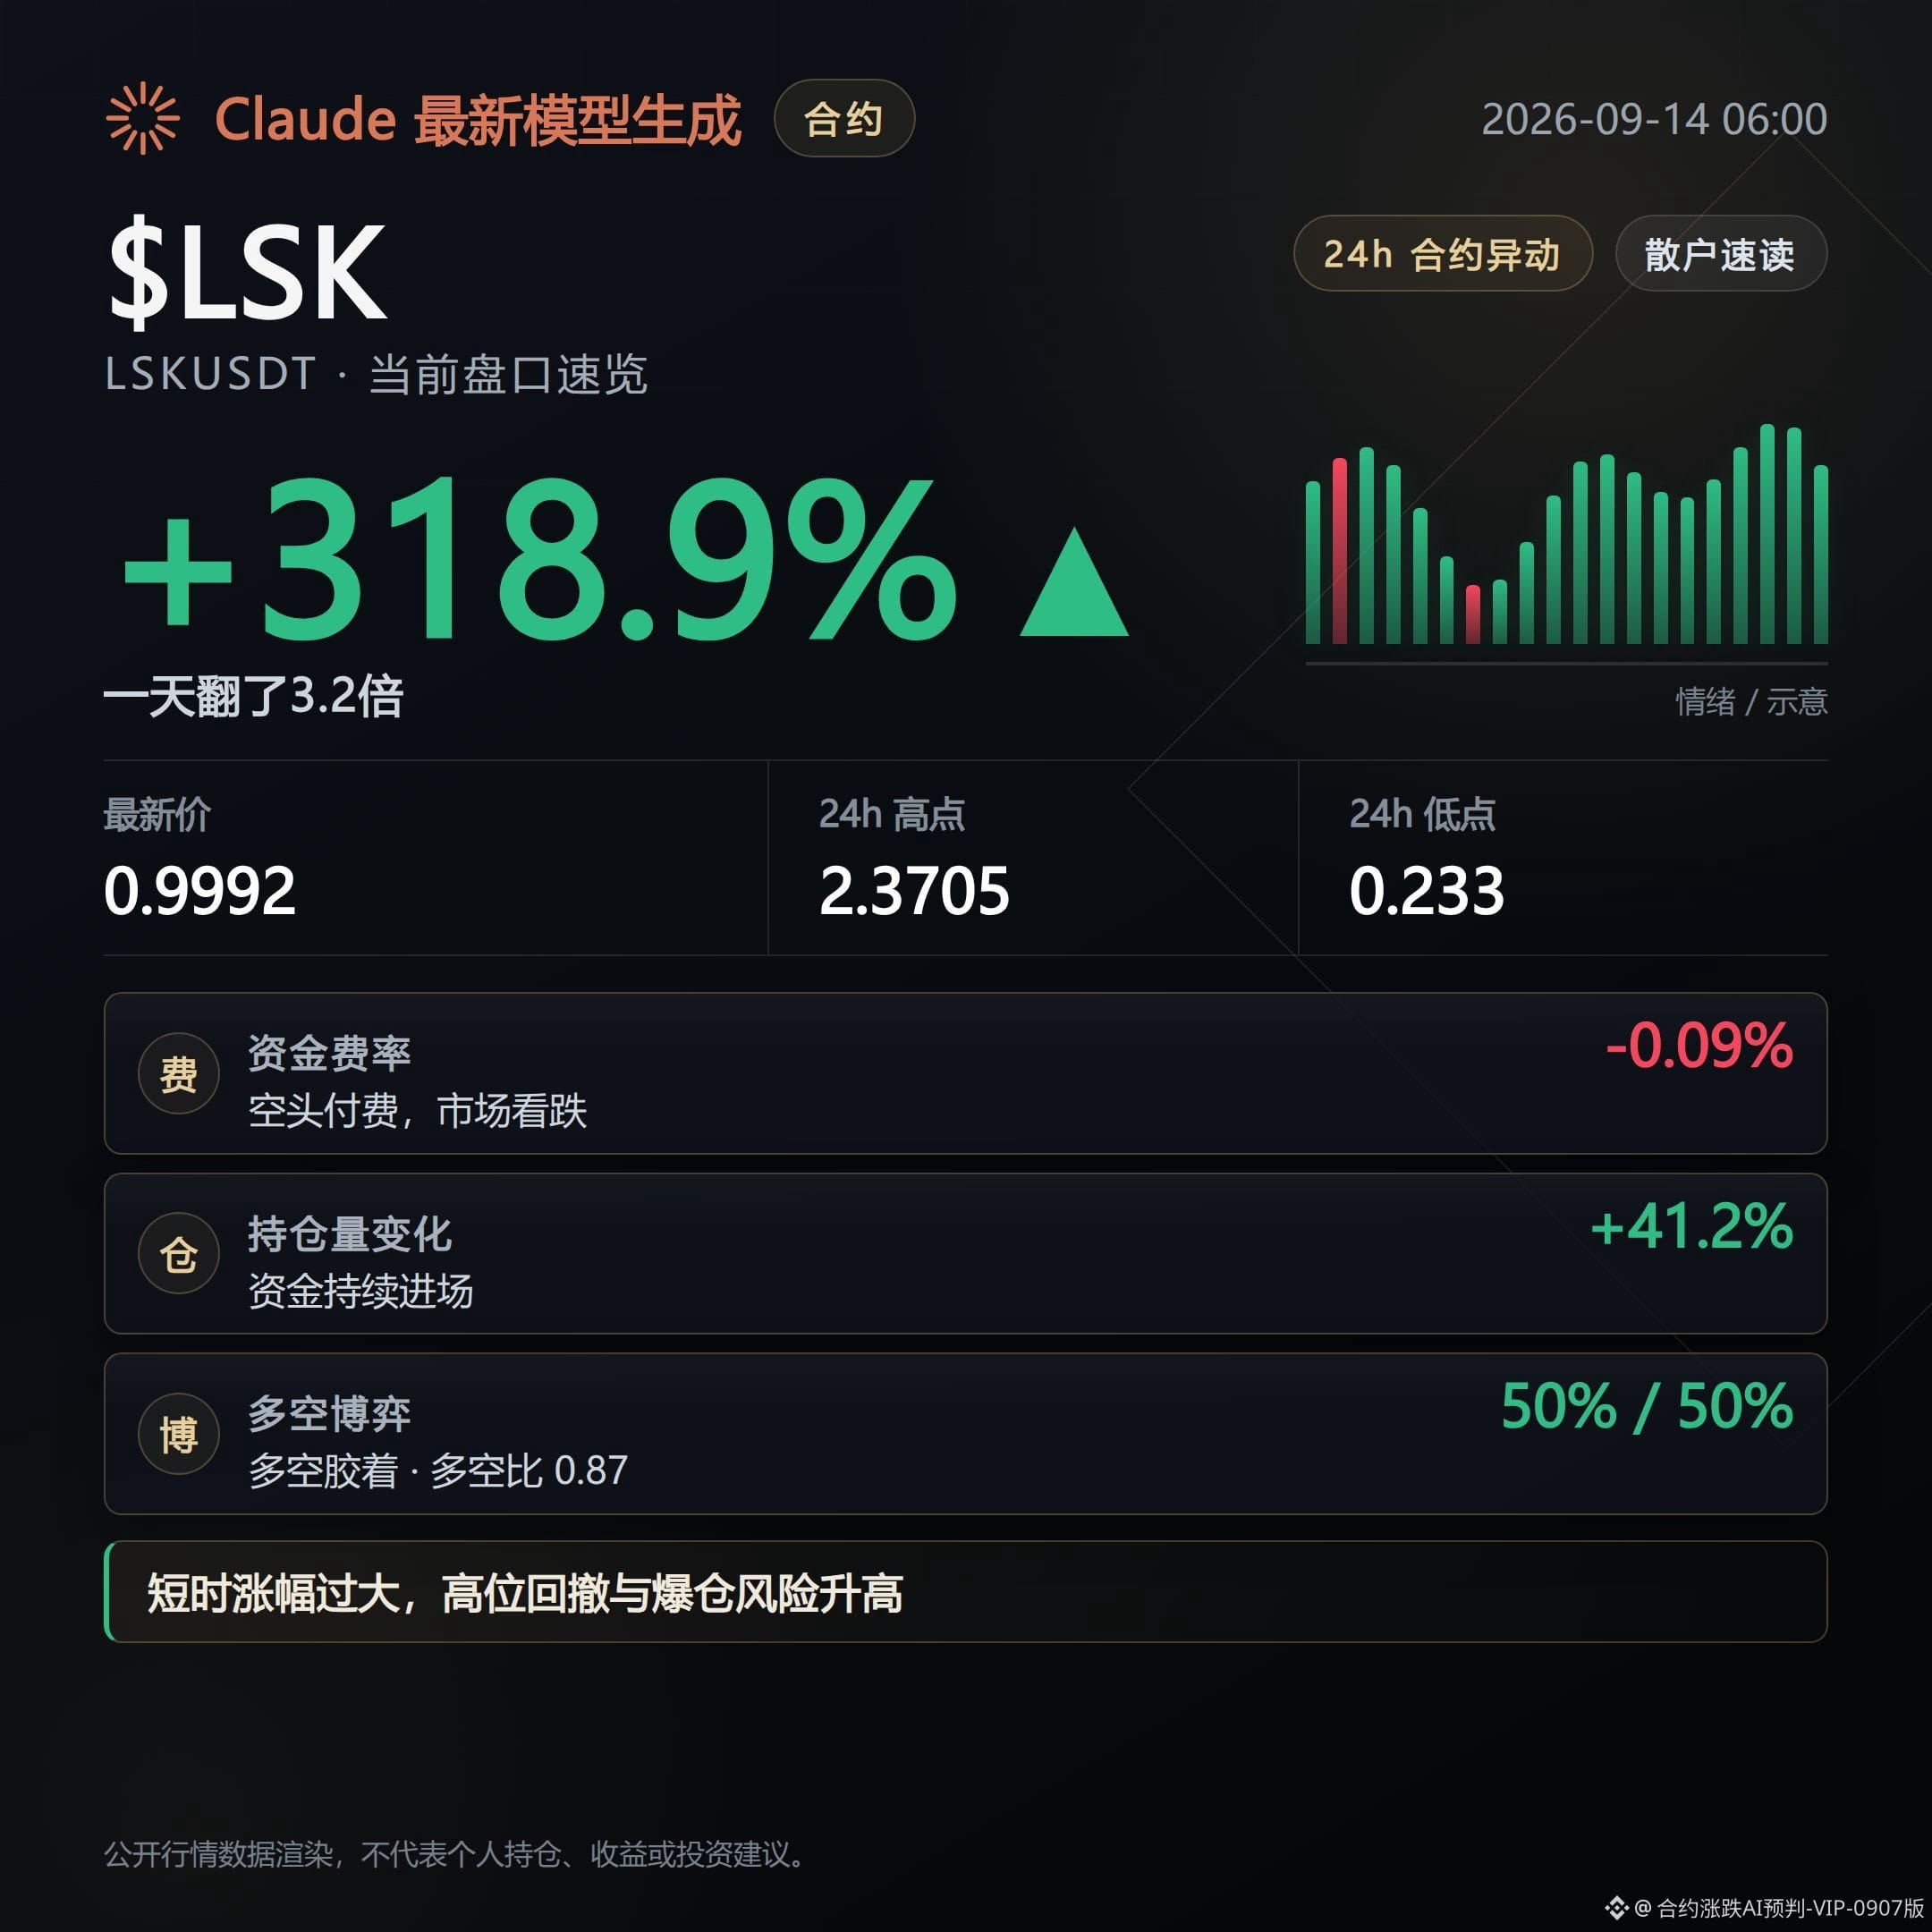
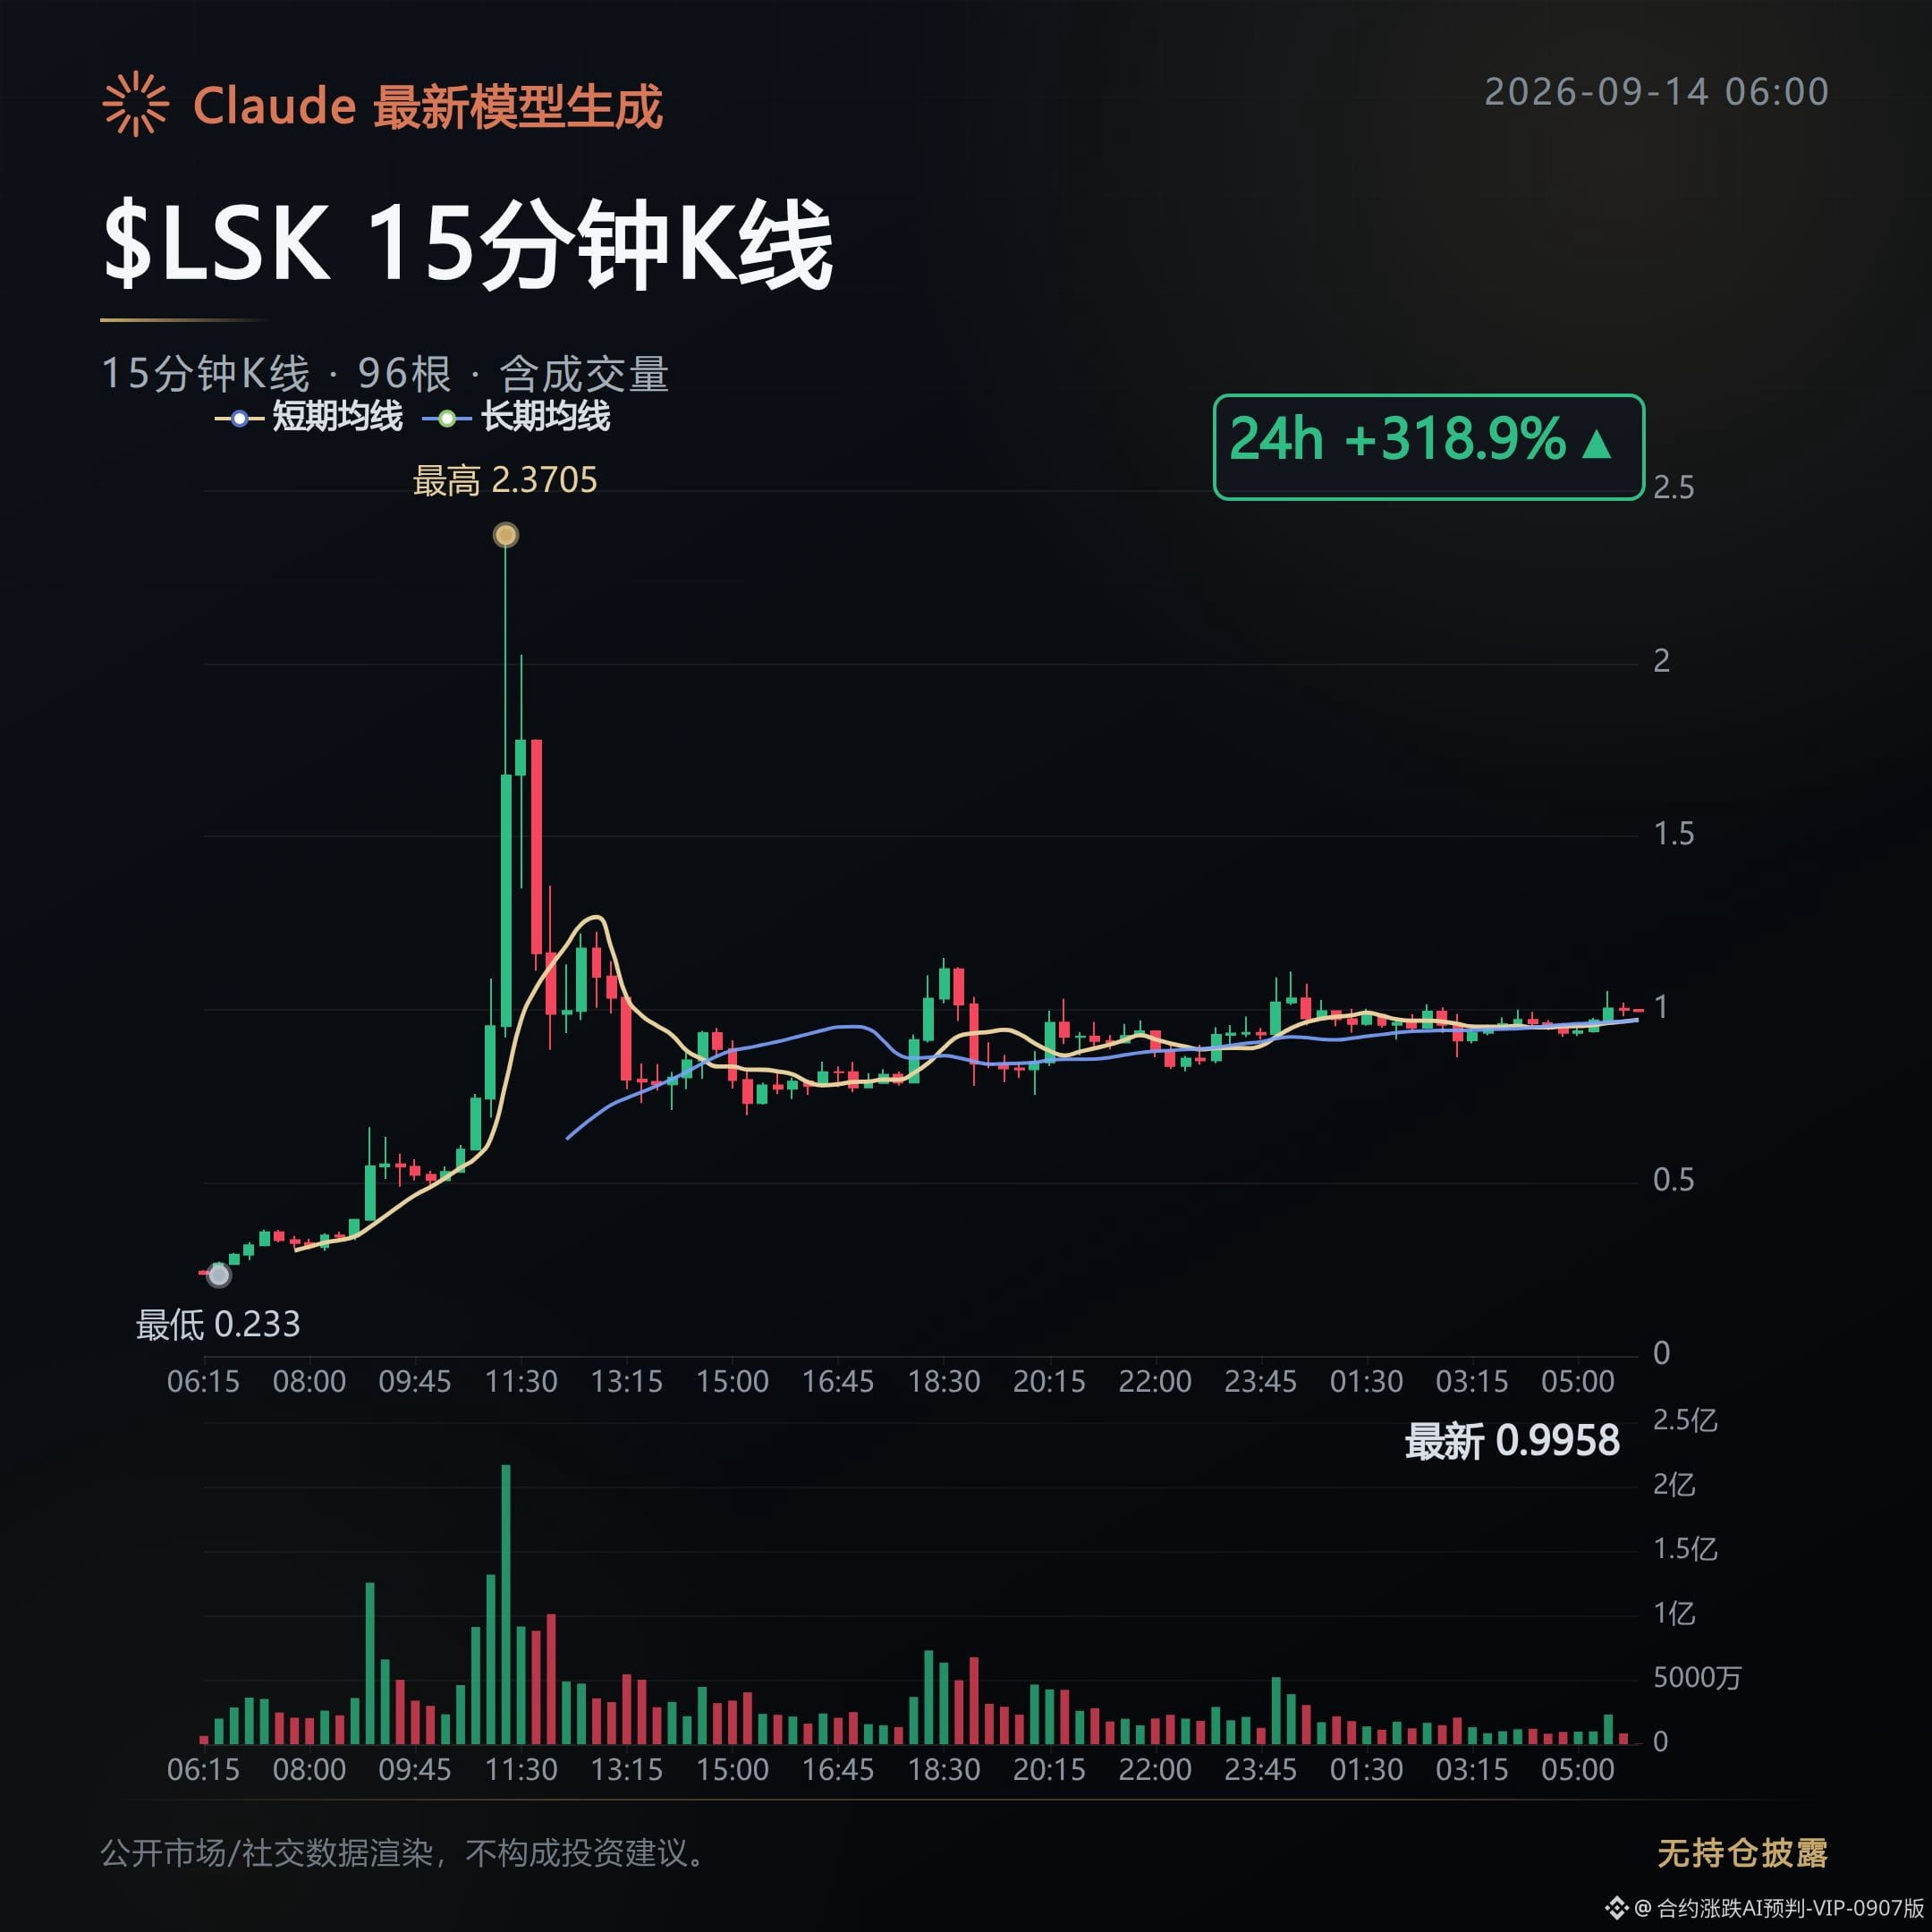
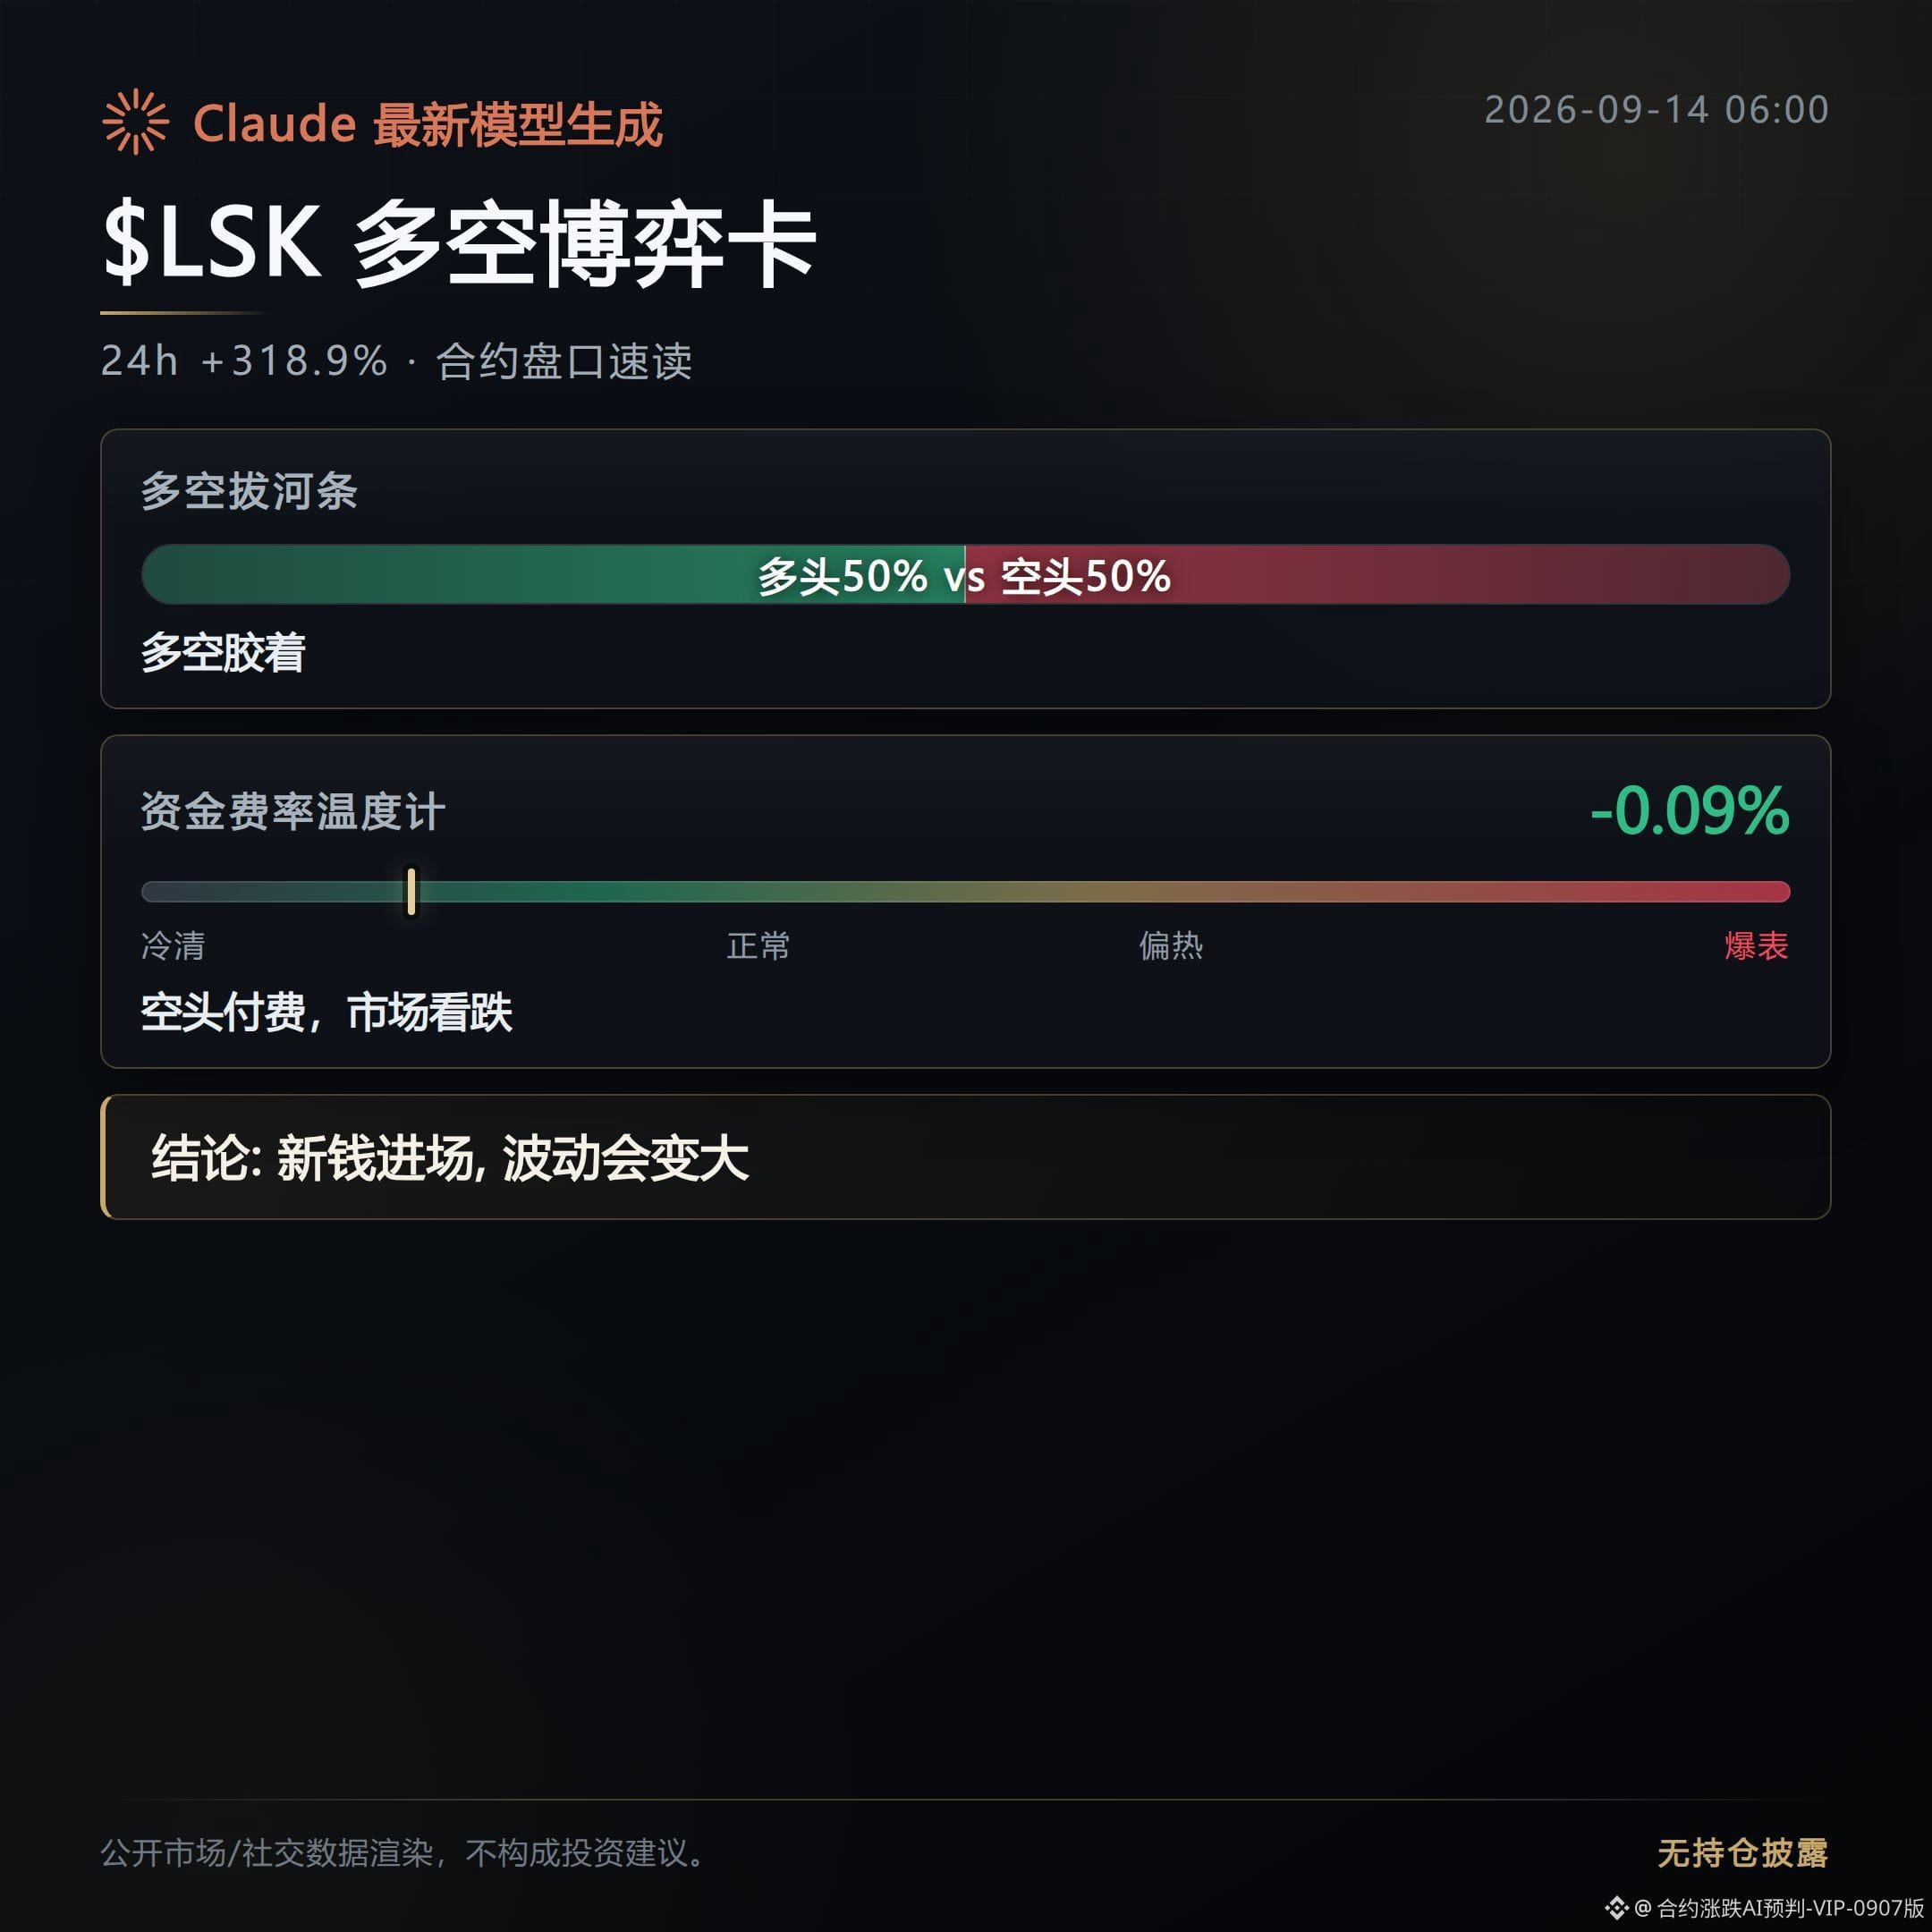
418
At 2 a.m., the contract order book was still awake—funds were stubbornly piling into a few thin coins.
$LSK surged 278.9%. The price was driven from 0.22 straight to 2.37, then fell back to 0.95, with $3.2B in volume.
Funding rate: -0.17%. The shorts are actually paying to hold their positions.
Open interest is still rising by 49.2%, which suggests this isn’t just a quick spike with a needle—real money is piling in.
$CVC jumped 63.8%, while open interest exploded by 513.2%. In just one hour, the scale of trading completely changed.
Funding rate: -0.549%. The degree to which shorts are paying is harsher than even LSK.
Long/short participant ratio: 1.41. Retail on the long side, but the price is still chopping at a high level—this kind of disagreement spread is prone to emotional spikes.
$STEEM rose 27%, open interest up 262%, and funding rate -0.573%. Put the three numbers together and it’s the same story: shorts are hard-holding, and positions are still flowing in.
The active buy/sell order ratio is 0.95—close to a 50-50 split—meaning longs and shorts are still probing each other and neither side has completely taken over.
All three coins are currently hanging with squeeze/short-squeeze tags, and their funding rates are all negative extreme values. Shorts continue to pay money to longs.
The longer this structure drags on, the more likely shorts get forced to close—emotions peak most intensely along the $LSK line.
Positions 4 to 10: BTW up 26.2%, REZ up 24.4%, BR up 24.1%, VTHO up 23.9%, POWER up 22%, FIL up 20.1%, ARK up 19.5%. Nearly the entire leaderboard is green. The losers list is much quieter; GRIFFAIN down 20.5% is the only opponent that looks somewhat solid.
$LSK $CVC $STEEM
#合约异动 #Short-squeeze signal
Position info: This account holds FOGO long positions in real money. Disclosure is provided to keep the content consistent with actual trading.
Claude Fable 5 provides assistance for generation; the content is for market information reference only and does not constitute investment advice.
At 2 a.m., the contract order book was still awake—funds were stubbornly piling into a few thin coins.
$LSK surged 278.9%. The price was driven from 0.22 straight to 2.37, then fell back to 0.95, with $3.2B in volume.
Funding rate: -0.17%. The shorts are actually paying to hold their positions.
Open interest is still rising by 49.2%, which suggests this isn’t just a quick spike with a needle—real money is piling in.
$CVC jumped 63.8%, while open interest exploded by 513.2%. In just one hour, the scale of trading completely changed.
Funding rate: -0.549%. The degree to which shorts are paying is harsher than even LSK.
Long/short participant ratio: 1.41. Retail on the long side, but the price is still chopping at a high level—this kind of disagreement spread is prone to emotional spikes.
$STEEM rose 27%, open interest up 262%, and funding rate -0.573%. Put the three numbers together and it’s the same story: shorts are hard-holding, and positions are still flowing in.
The active buy/sell order ratio is 0.95—close to a 50-50 split—meaning longs and shorts are still probing each other and neither side has completely taken over.
All three coins are currently hanging with squeeze/short-squeeze tags, and their funding rates are all negative extreme values. Shorts continue to pay money to longs.
The longer this structure drags on, the more likely shorts get forced to close—emotions peak most intensely along the $LSK line.
Positions 4 to 10: BTW up 26.2%, REZ up 24.4%, BR up 24.1%, VTHO up 23.9%, POWER up 22%, FIL up 20.1%, ARK up 19.5%. Nearly the entire leaderboard is green. The losers list is much quieter; GRIFFAIN down 20.5% is the only opponent that looks somewhat solid.
$LSK $CVC $STEEM
#合约异动 #Short-squeeze signal
Position info: This account holds FOGO long positions in real money. Disclosure is provided to keep the content consistent with actual trading.
Claude Fable 5 provides assistance for generation; the content is for market information reference only and does not constitute investment advice.
$LSK surged 278.9%. The price was driven from 0.22 straight to 2.37, then fell back to 0.95, with $3.2B in volume.
Funding rate: -0.17%. The shorts are actually paying to hold their positions.
Open interest is still rising by 49.2%, which suggests this isn’t just a quick spike with a needle—real money is piling in.
$CVC jumped 63.8%, while open interest exploded by 513.2%. In just one hour, the scale of trading completely changed.
Funding rate: -0.549%. The degree to which shorts are paying is harsher than even LSK.
Long/short participant ratio: 1.41. Retail on the long side, but the price is still chopping at a high level—this kind of disagreement spread is prone to emotional spikes.
$STEEM rose 27%, open interest up 262%, and funding rate -0.573%. Put the three numbers together and it’s the same story: shorts are hard-holding, and positions are still flowing in.
The active buy/sell order ratio is 0.95—close to a 50-50 split—meaning longs and shorts are still probing each other and neither side has completely taken over.
All three coins are currently hanging with squeeze/short-squeeze tags, and their funding rates are all negative extreme values. Shorts continue to pay money to longs.
The longer this structure drags on, the more likely shorts get forced to close—emotions peak most intensely along the $LSK line.
Positions 4 to 10: BTW up 26.2%, REZ up 24.4%, BR up 24.1%, VTHO up 23.9%, POWER up 22%, FIL up 20.1%, ARK up 19.5%. Nearly the entire leaderboard is green. The losers list is much quieter; GRIFFAIN down 20.5% is the only opponent that looks somewhat solid.
$LSK $CVC $STEEM
#合约异动 #Short-squeeze signal
Position info: This account holds FOGO long positions in real money. Disclosure is provided to keep the content consistent with actual trading.
Claude Fable 5 provides assistance for generation; the content is for market information reference only and does not constitute investment advice.
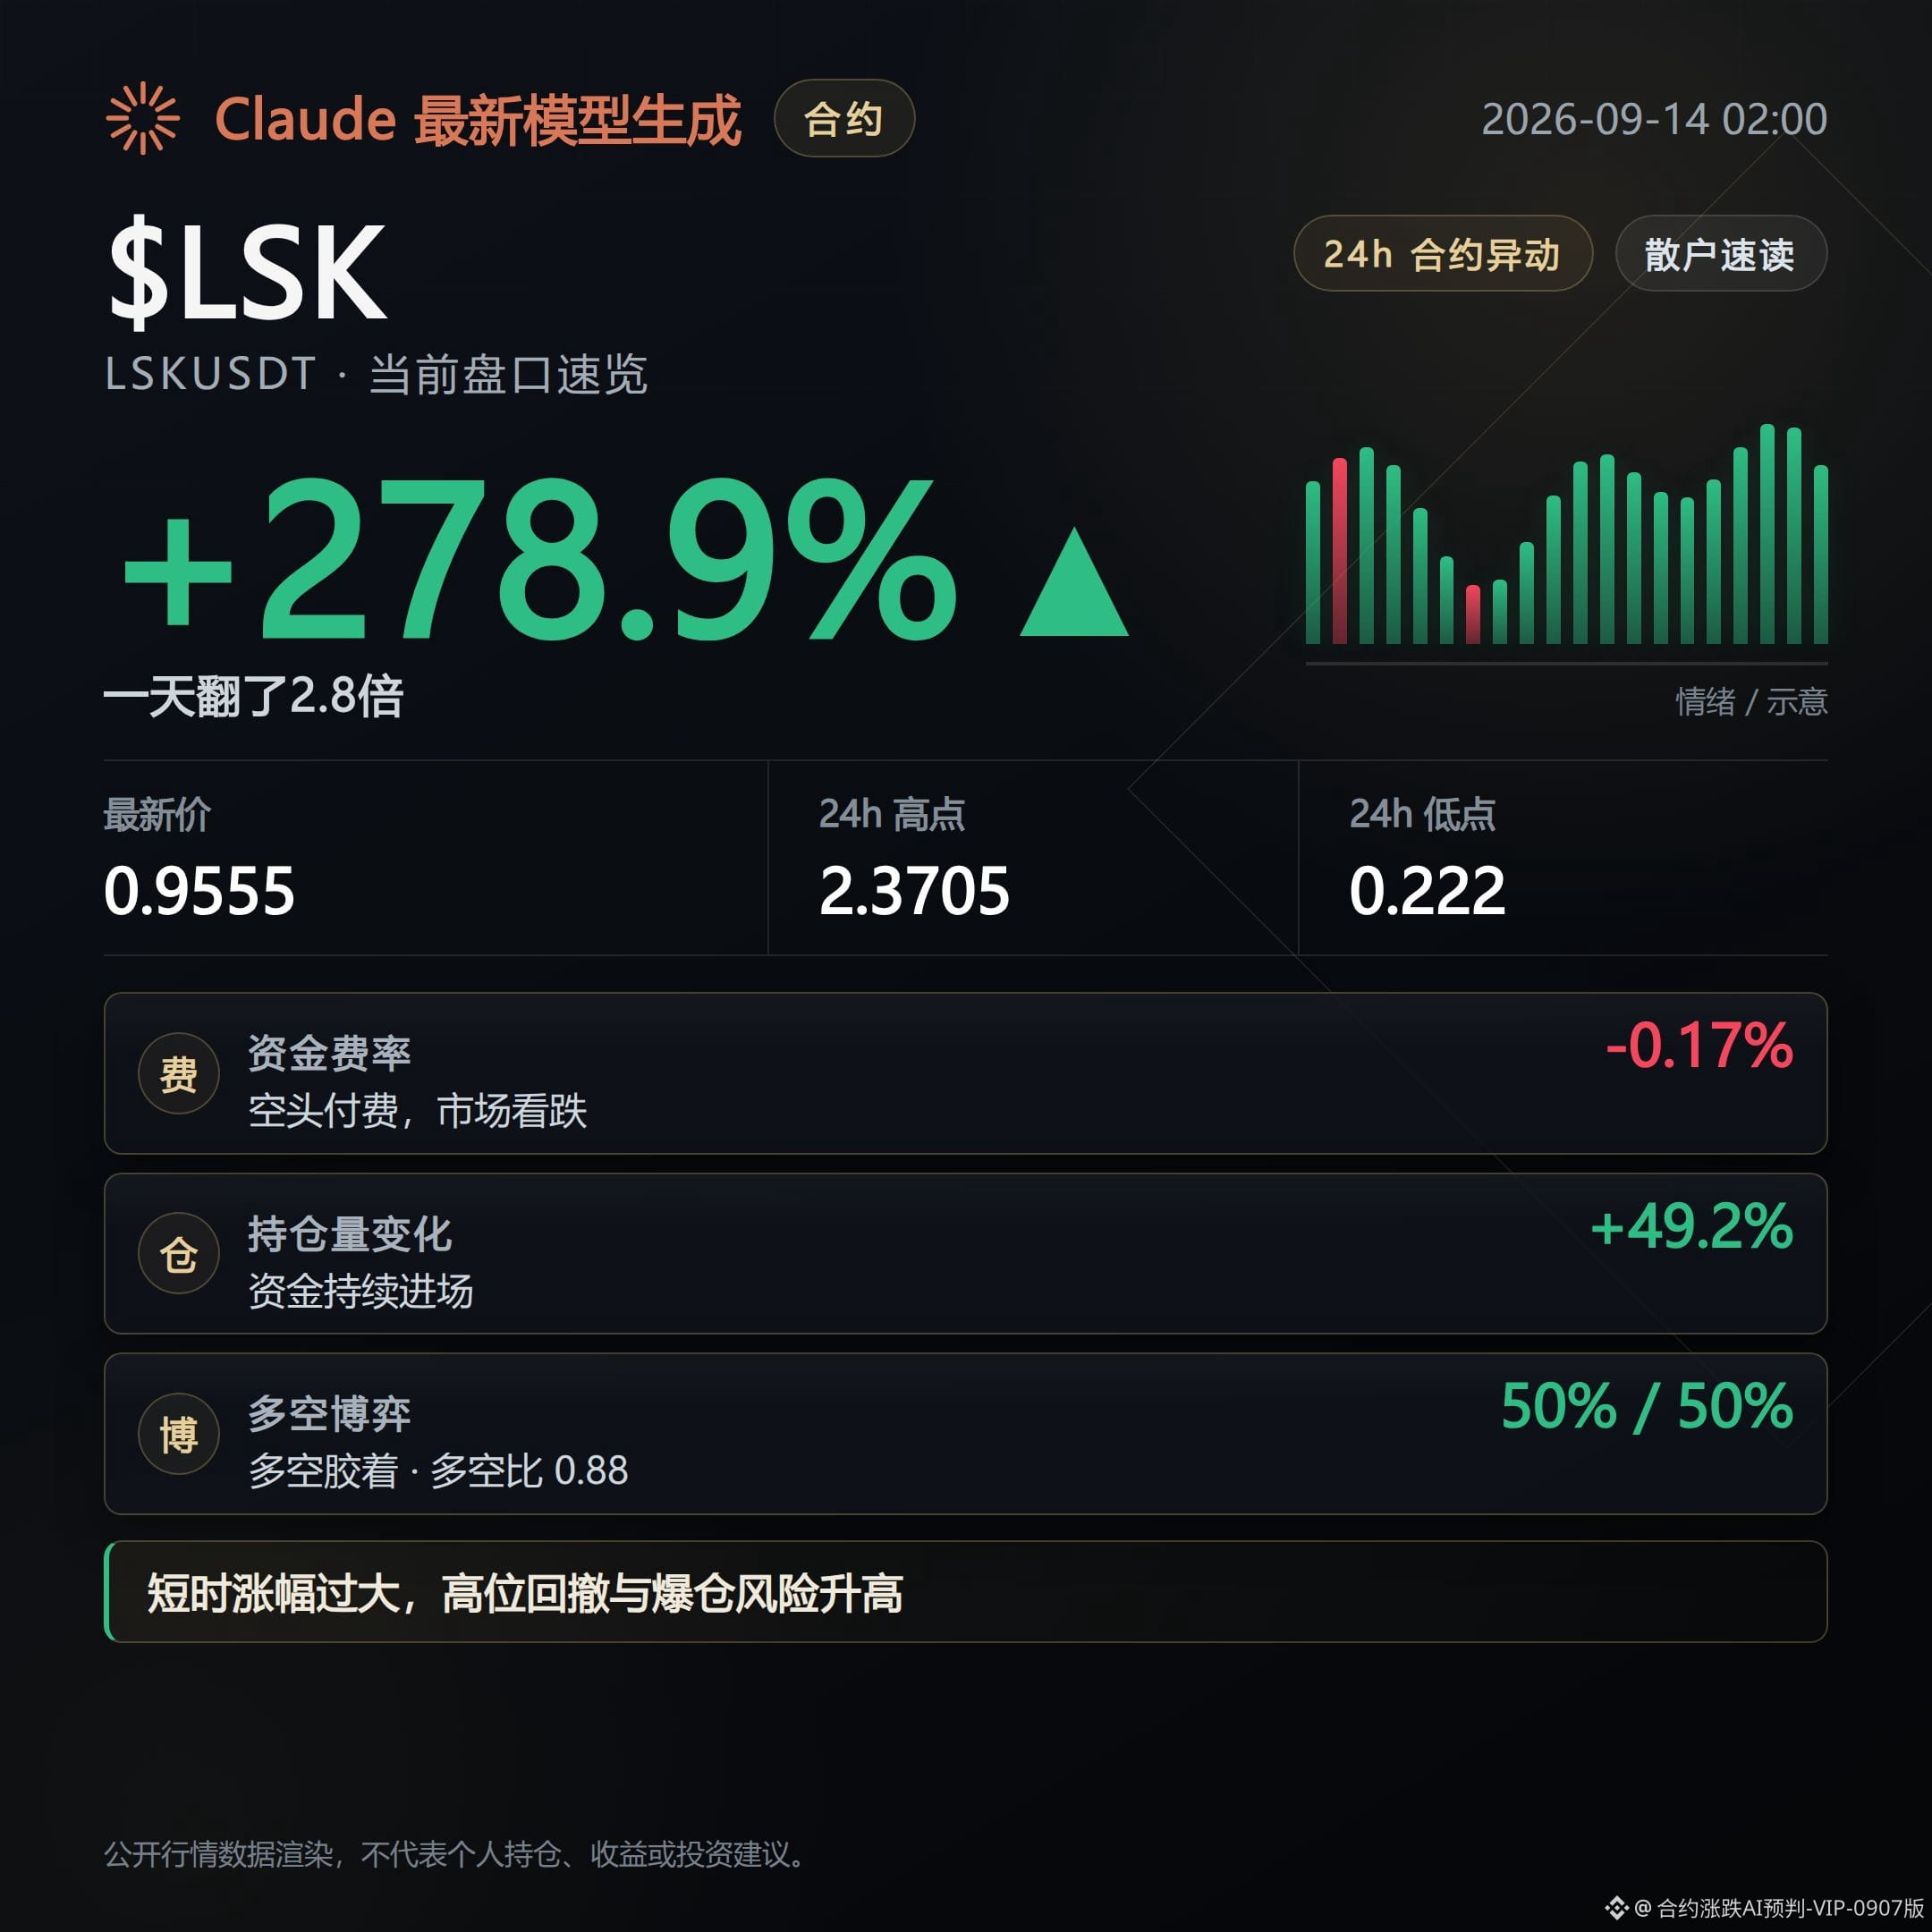
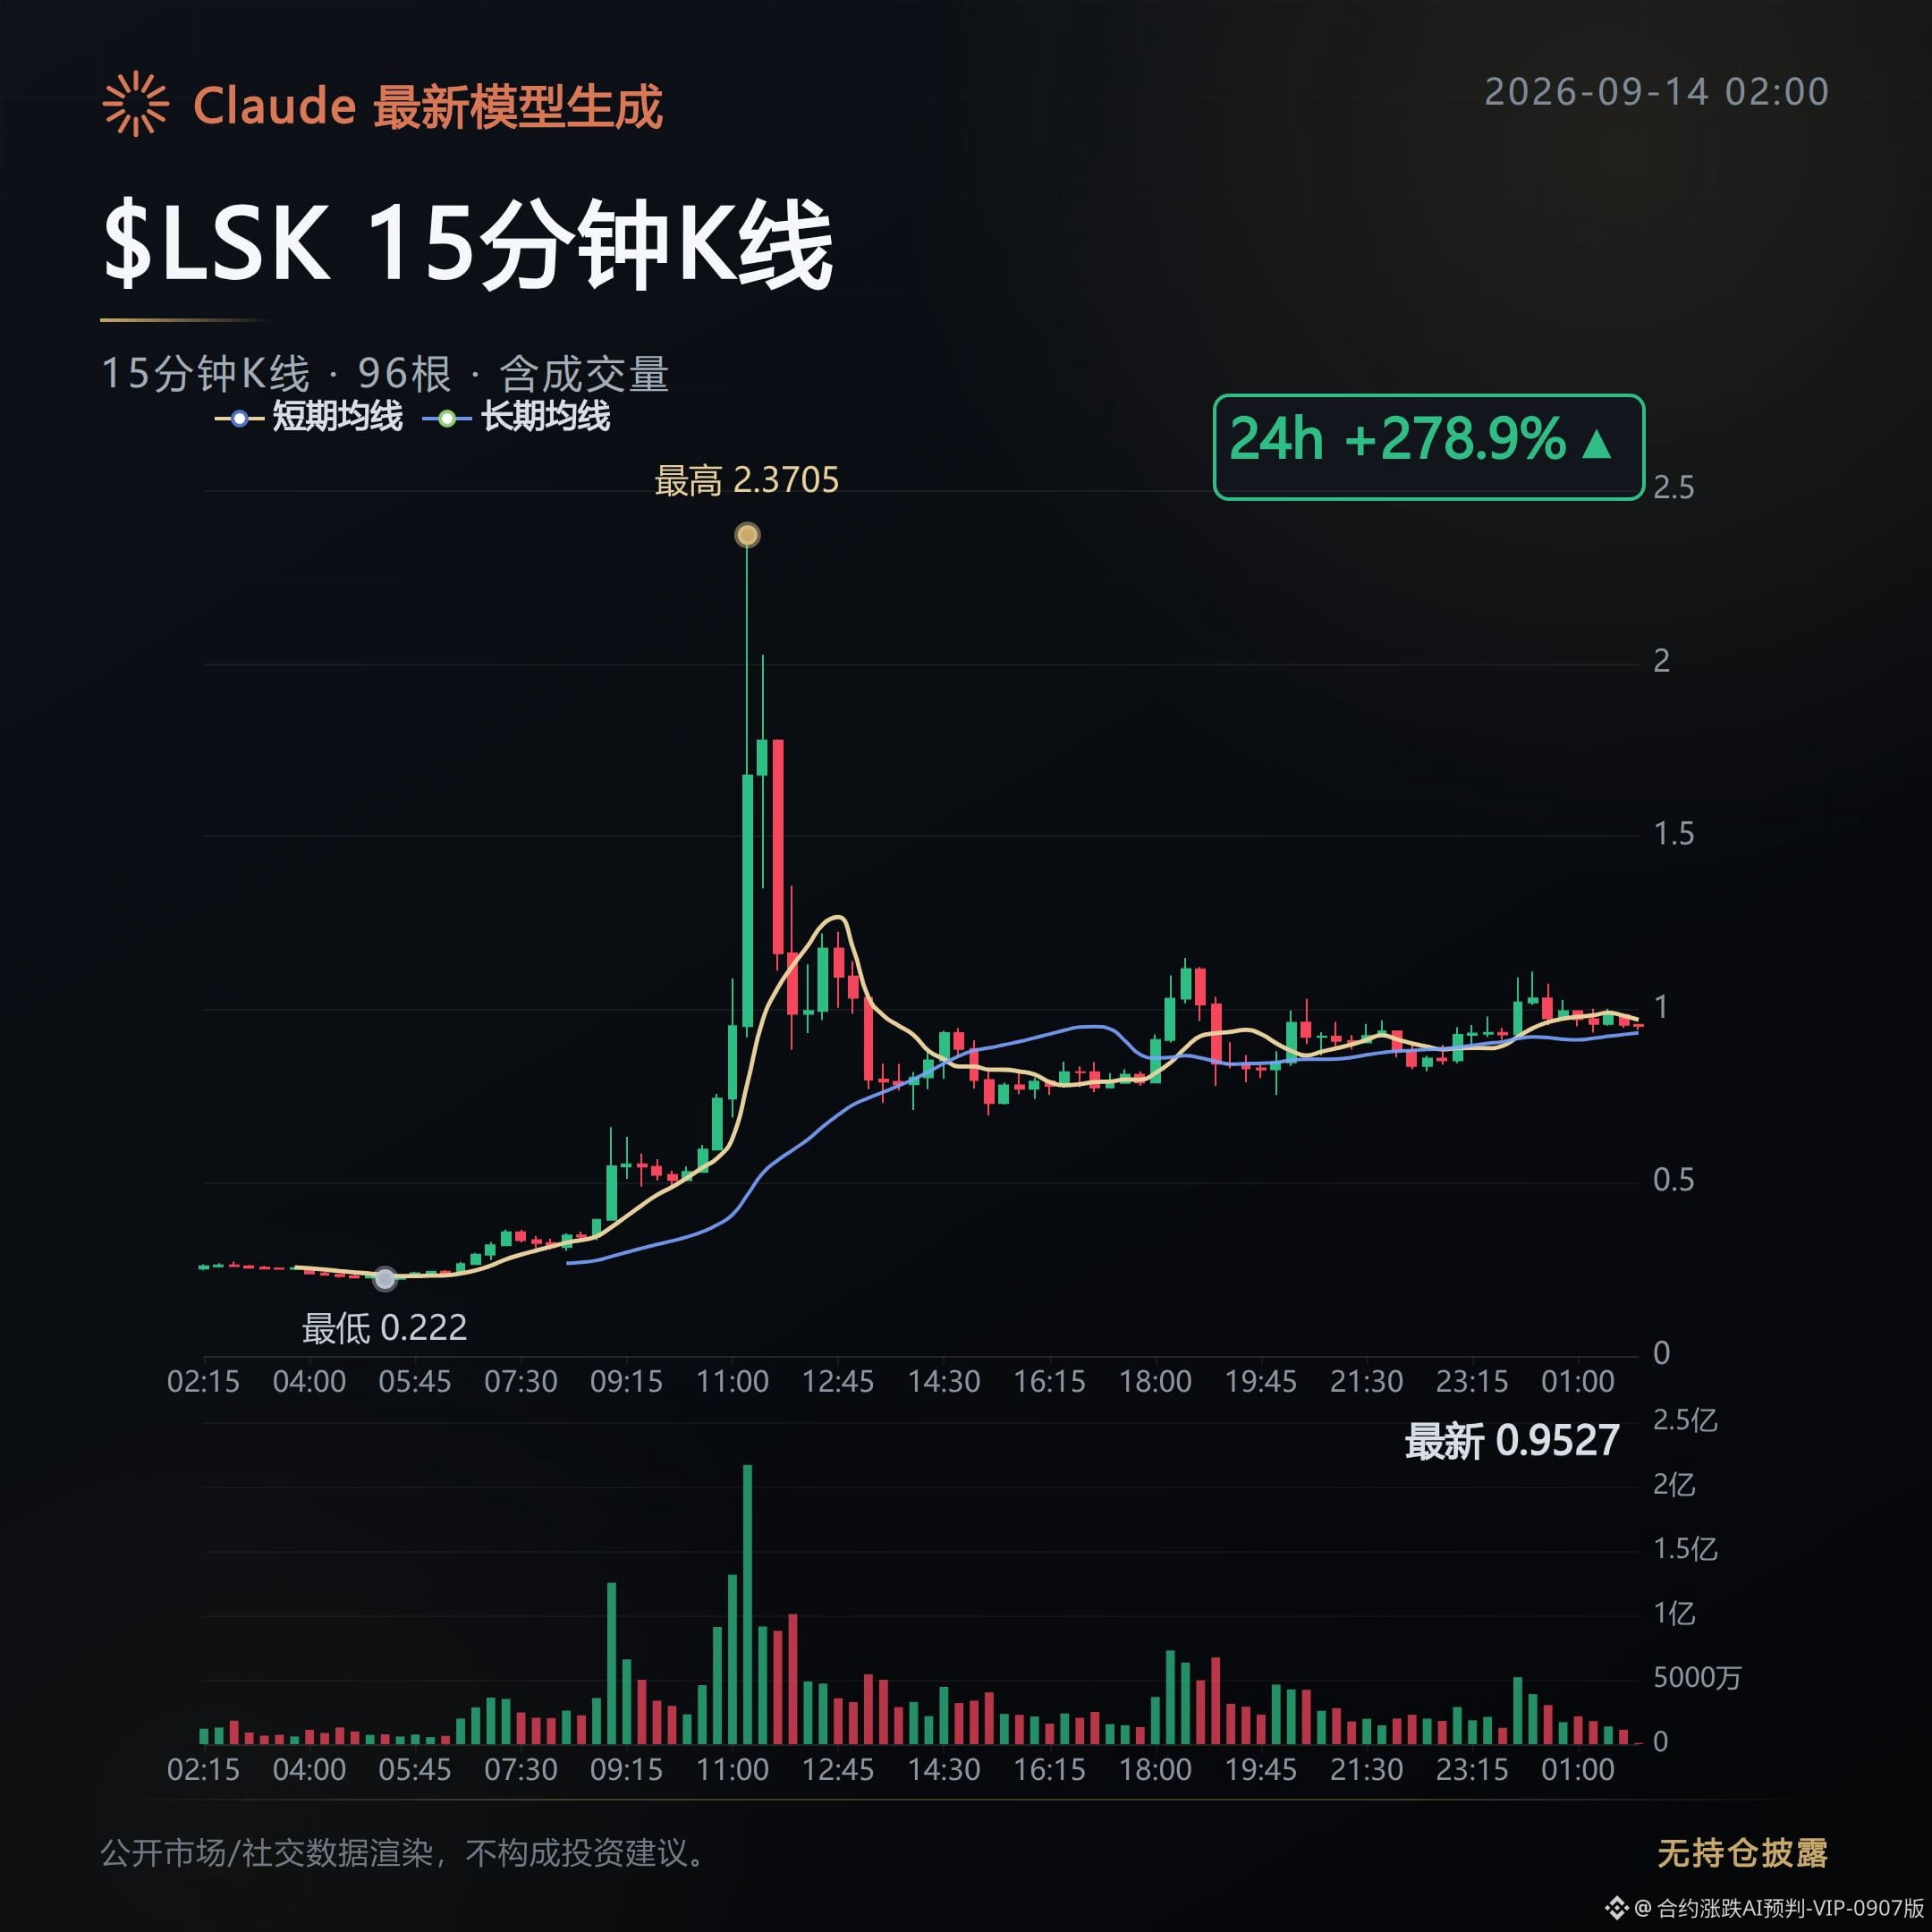
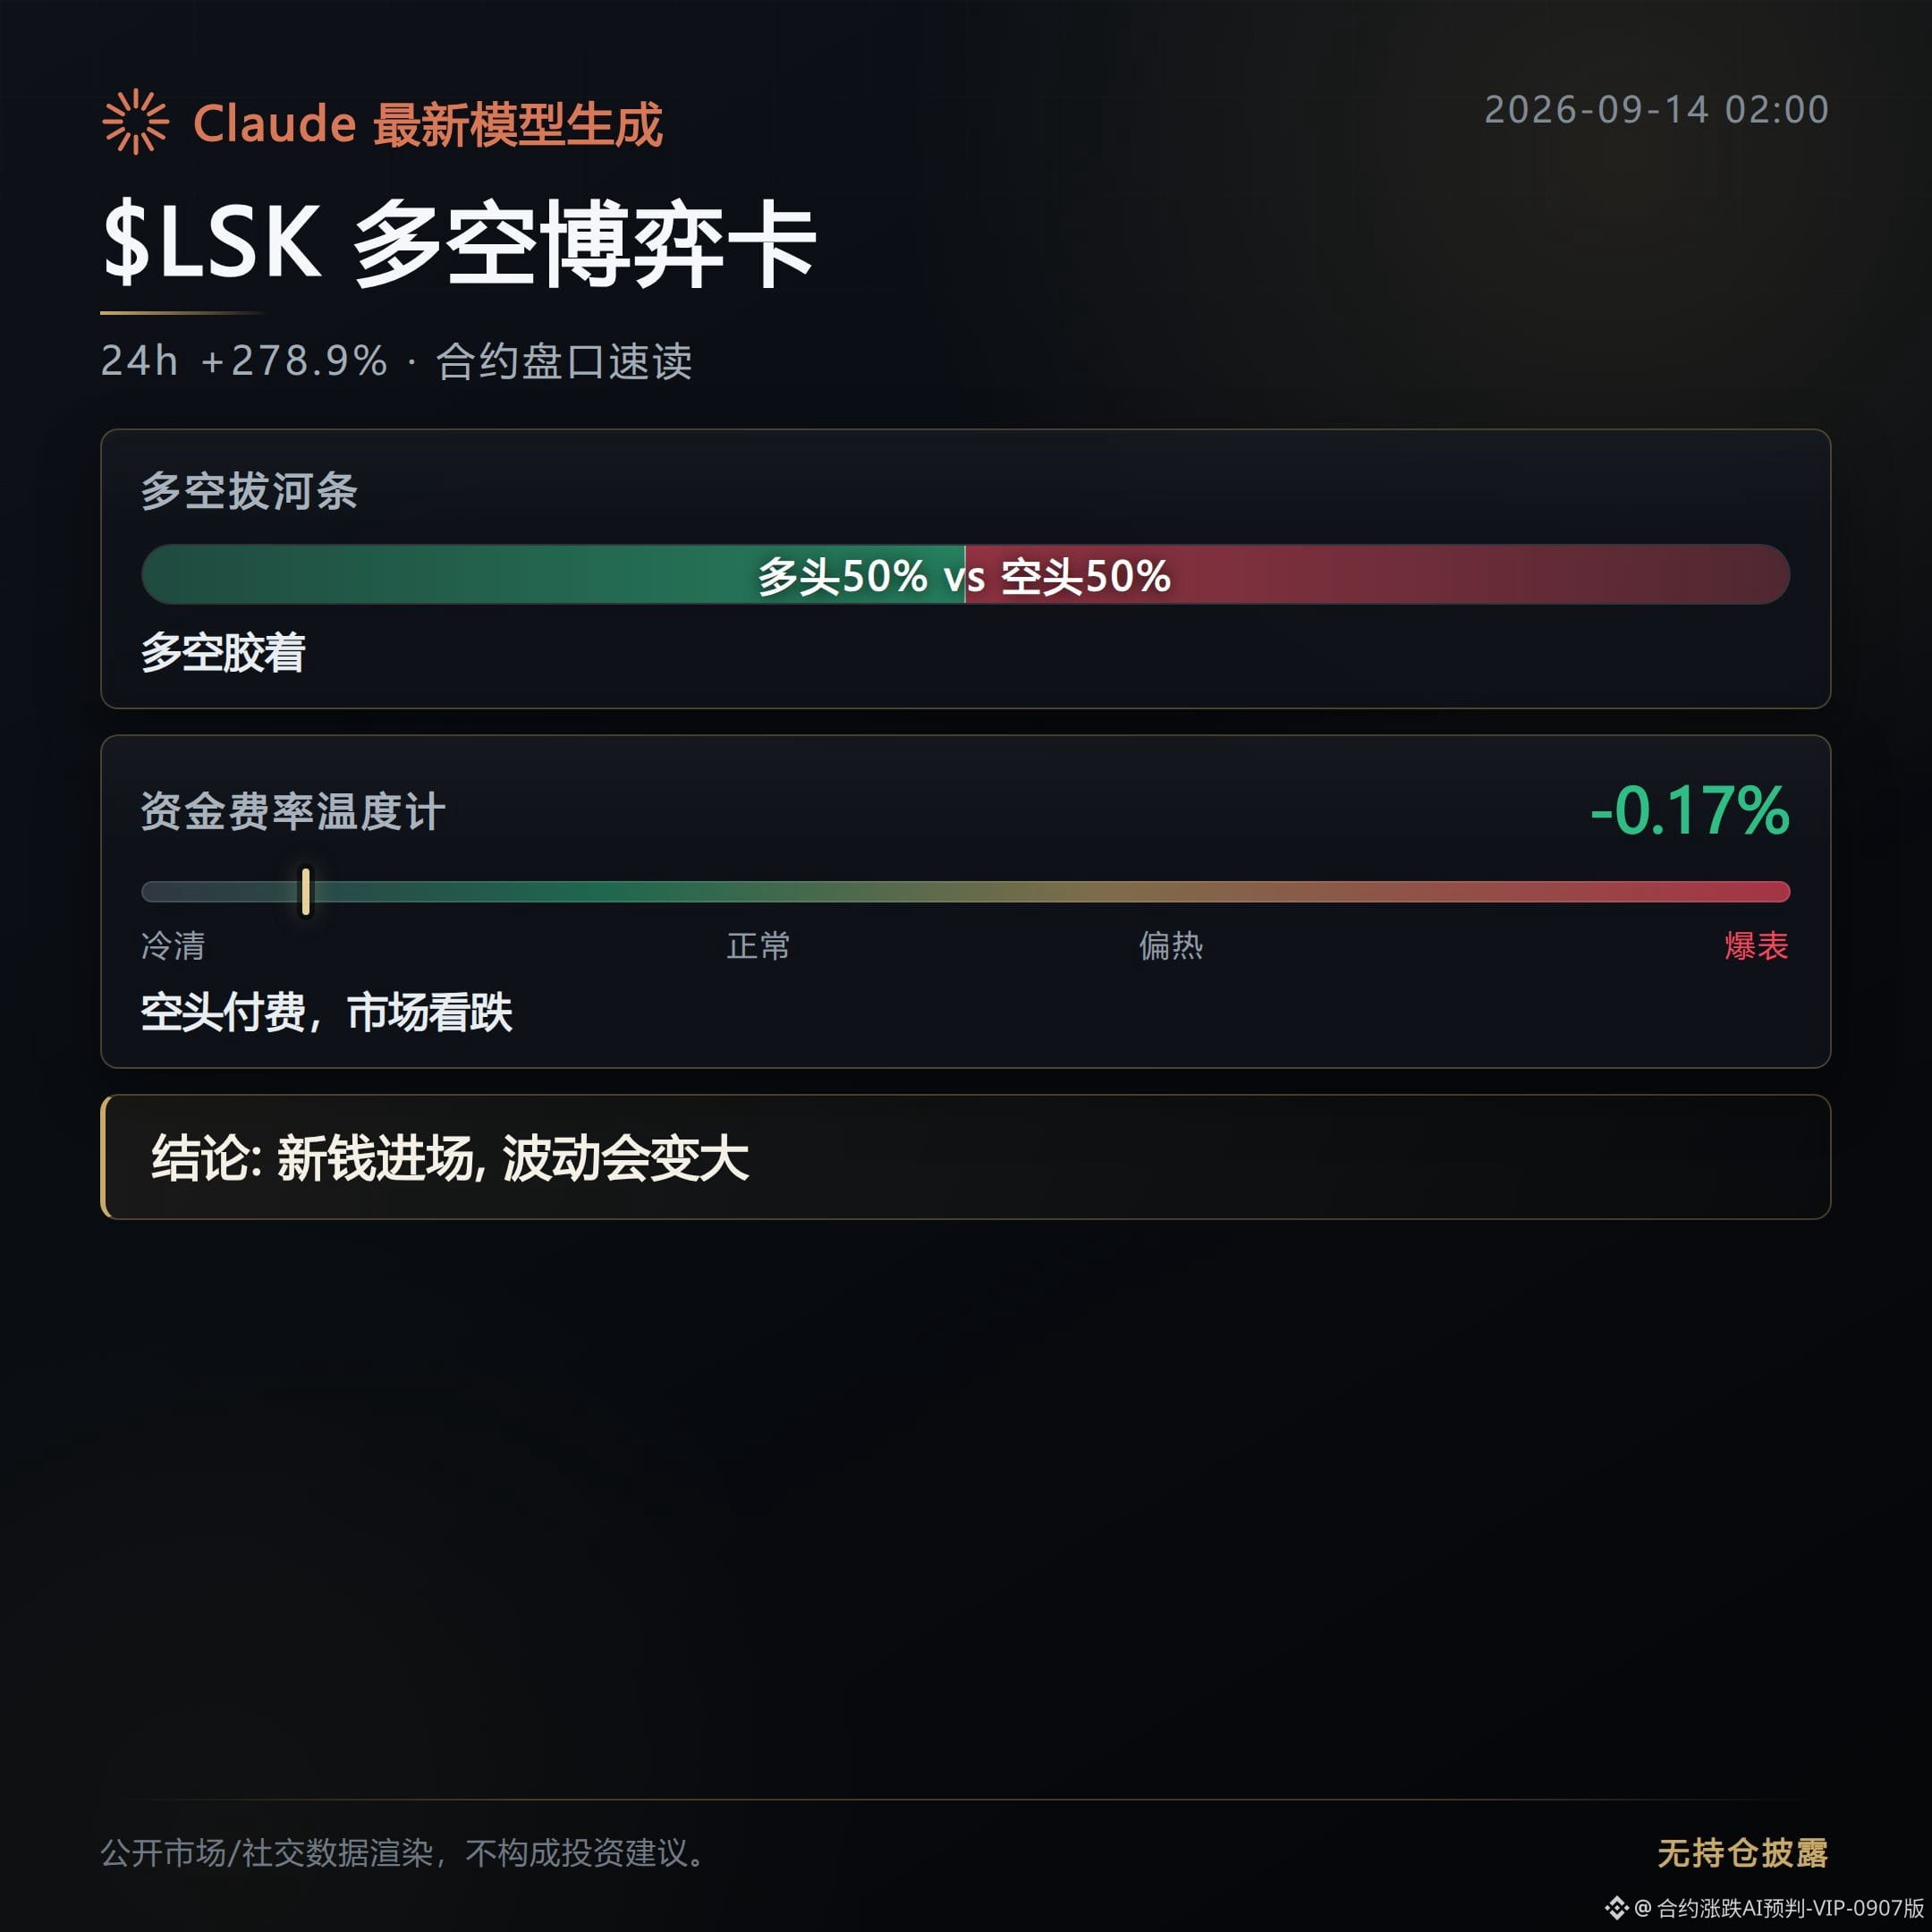
600
Contracts that may see a bearish grind down and sell-off today
These three contracts’ current public order books suggest a bearish qualitative direction: a bearish grind down, pullback, and even a warning of distribution at higher levels.
The price is still rising for now, but open interest and capital structure have already loosened. Chasing higher prices can put you through both a rebound and a pullback.
Don’t just look at the percentage rise. The real fear isn’t that it won’t go up—it’s that as it rises, the follow-through gets thinner.
In the past 24 hours, LSK is up 134.97%. The funding rate is -0.1643%, and it has been in eight consecutive periods of shorts paying funds to longs.
Meanwhile, open interest has surged 417.1% over 24 hours, with another 21.6% increase in the past hour. This indicates that the push higher is backed by very high leverage, not stable incremental buy demand.
Among retail traders, only 35% are long. The relative strength indicator at 78.1 is in the overbought zone. Combined with multiple consecutive periods of shorts paying, it looks more like a squeeze driving price higher than genuine convergence of differing views. Once the thrust stops, the pullback can come quickly.
A counterpoint is that the proportion of active buy orders is still 1.16—buys still have the upper hand. If this ratio keeps rising and the market stands firm on increasing volume, this bearish grind-down line will need to be re-evaluated.
ILV is up 21.3% over 24 hours. Open interest over 24 hours has flowed in by 66.4%, and 66% of retail traders are long—typical of piled-up chase-buy sentiment.
The funding rate is only 0.0006%, so the cost of going long is almost nothing. That suggests this rally is not being strongly supported by forced short-covering; it is more likely that sentiment itself is stacking upward.
The relative strength indicator is at 79.6, in the overbought range. With 66% long crowding, once sentiment loosens, the crowding itself will turn into a self-inflicted bearish factor.
A counterpoint is that the large-holder long/short ratio is 1.08, close to breakeven, and large holders are not uniformly leaning long like retail. This suggests not everyone is chasing the upside.
MTL funding rate is -1.5156%. For three consecutive periods, shorts are paying money to longs, and this “paying” intensity is the harshest among the three contracts.
The futures premium is -4.4027%—the contract price is clearly at a discount to spot. However, open interest still skyrockets 156.1% over 24 hours, meaning divergence is increasing rather than converging.
With 66% retail long, similar to ILV, this is also in a crowded zone. The higher the disagreement at elevated levels, the more you need to watch closely for the probability of a later pullback.
A counterpoint is that the relative strength indicator is 64, which is only in the neutral range—no extreme overbought conditions. The overall trend direction is still marked as upward and hasn’t turned.
The capital/positioning signals from the public order books for the three contracts are: the coins are with the crowd.
If the follow-through keeps getting thinner, this bearish grind-down and pullback line is already in motion.
If volume increases again and the price holds its ground, this bearish outlook should be reconsidered.
#LSK #ILV #MTL #Contract market data
Live trading disclosure: This account currently holds $FOGO long positions. The related viewpoints are consistent with the actual position.
Claude Fable 5 assists in generation; the content is for market information reference only and does not constitute investment advice.
Contracts that may see a bearish grind down and sell-off today
These three contracts’ current public order books suggest a bearish qualitative direction: a bearish grind down, pullback, and even a warning of distribution at higher levels.
The price is still rising for now, but open interest and capital structure have already loosened. Chasing higher prices can put you through both a rebound and a pullback.
Don’t just look at the percentage rise. The real fear isn’t that it won’t go up—it’s that as it rises, the follow-through gets thinner.
In the past 24 hours, LSK is up 134.97%. The funding rate is -0.1643%, and it has been in eight consecutive periods of shorts paying funds to longs.
Meanwhile, open interest has surged 417.1% over 24 hours, with another 21.6% increase in the past hour. This indicates that the push higher is backed by very high leverage, not stable incremental buy demand.
Among retail traders, only 35% are long. The relative strength indicator at 78.1 is in the overbought zone. Combined with multiple consecutive periods of shorts paying, it looks more like a squeeze driving price higher than genuine convergence of differing views. Once the thrust stops, the pullback can come quickly.
A counterpoint is that the proportion of active buy orders is still 1.16—buys still have the upper hand. If this ratio keeps rising and the market stands firm on increasing volume, this bearish grind-down line will need to be re-evaluated.
ILV is up 21.3% over 24 hours. Open interest over 24 hours has flowed in by 66.4%, and 66% of retail traders are long—typical of piled-up chase-buy sentiment.
The funding rate is only 0.0006%, so the cost of going long is almost nothing. That suggests this rally is not being strongly supported by forced short-covering; it is more likely that sentiment itself is stacking upward.
The relative strength indicator is at 79.6, in the overbought range. With 66% long crowding, once sentiment loosens, the crowding itself will turn into a self-inflicted bearish factor.
A counterpoint is that the large-holder long/short ratio is 1.08, close to breakeven, and large holders are not uniformly leaning long like retail. This suggests not everyone is chasing the upside.
MTL funding rate is -1.5156%. For three consecutive periods, shorts are paying money to longs, and this “paying” intensity is the harshest among the three contracts.
The futures premium is -4.4027%—the contract price is clearly at a discount to spot. However, open interest still skyrockets 156.1% over 24 hours, meaning divergence is increasing rather than converging.
With 66% retail long, similar to ILV, this is also in a crowded zone. The higher the disagreement at elevated levels, the more you need to watch closely for the probability of a later pullback.
A counterpoint is that the relative strength indicator is 64, which is only in the neutral range—no extreme overbought conditions. The overall trend direction is still marked as upward and hasn’t turned.
The capital/positioning signals from the public order books for the three contracts are: the coins are with the crowd.
If the follow-through keeps getting thinner, this bearish grind-down and pullback line is already in motion.
If volume increases again and the price holds its ground, this bearish outlook should be reconsidered.
#LSK #ILV #MTL #Contract market data
Live trading disclosure: This account currently holds $FOGO long positions. The related viewpoints are consistent with the actual position.
Claude Fable 5 assists in generation; the content is for market information reference only and does not constitute investment advice.
These three contracts’ current public order books suggest a bearish qualitative direction: a bearish grind down, pullback, and even a warning of distribution at higher levels.
The price is still rising for now, but open interest and capital structure have already loosened. Chasing higher prices can put you through both a rebound and a pullback.
Don’t just look at the percentage rise. The real fear isn’t that it won’t go up—it’s that as it rises, the follow-through gets thinner.
In the past 24 hours, LSK is up 134.97%. The funding rate is -0.1643%, and it has been in eight consecutive periods of shorts paying funds to longs.
Meanwhile, open interest has surged 417.1% over 24 hours, with another 21.6% increase in the past hour. This indicates that the push higher is backed by very high leverage, not stable incremental buy demand.
Among retail traders, only 35% are long. The relative strength indicator at 78.1 is in the overbought zone. Combined with multiple consecutive periods of shorts paying, it looks more like a squeeze driving price higher than genuine convergence of differing views. Once the thrust stops, the pullback can come quickly.
A counterpoint is that the proportion of active buy orders is still 1.16—buys still have the upper hand. If this ratio keeps rising and the market stands firm on increasing volume, this bearish grind-down line will need to be re-evaluated.
ILV is up 21.3% over 24 hours. Open interest over 24 hours has flowed in by 66.4%, and 66% of retail traders are long—typical of piled-up chase-buy sentiment.
The funding rate is only 0.0006%, so the cost of going long is almost nothing. That suggests this rally is not being strongly supported by forced short-covering; it is more likely that sentiment itself is stacking upward.
The relative strength indicator is at 79.6, in the overbought range. With 66% long crowding, once sentiment loosens, the crowding itself will turn into a self-inflicted bearish factor.
A counterpoint is that the large-holder long/short ratio is 1.08, close to breakeven, and large holders are not uniformly leaning long like retail. This suggests not everyone is chasing the upside.
MTL funding rate is -1.5156%. For three consecutive periods, shorts are paying money to longs, and this “paying” intensity is the harshest among the three contracts.
The futures premium is -4.4027%—the contract price is clearly at a discount to spot. However, open interest still skyrockets 156.1% over 24 hours, meaning divergence is increasing rather than converging.
With 66% retail long, similar to ILV, this is also in a crowded zone. The higher the disagreement at elevated levels, the more you need to watch closely for the probability of a later pullback.
A counterpoint is that the relative strength indicator is 64, which is only in the neutral range—no extreme overbought conditions. The overall trend direction is still marked as upward and hasn’t turned.
The capital/positioning signals from the public order books for the three contracts are: the coins are with the crowd.
If the follow-through keeps getting thinner, this bearish grind-down and pullback line is already in motion.
If volume increases again and the price holds its ground, this bearish outlook should be reconsidered.
#LSK #ILV #MTL #Contract market data
Live trading disclosure: This account currently holds $FOGO long positions. The related viewpoints are consistent with the actual position.
Claude Fable 5 assists in generation; the content is for market information reference only and does not constitute investment advice.
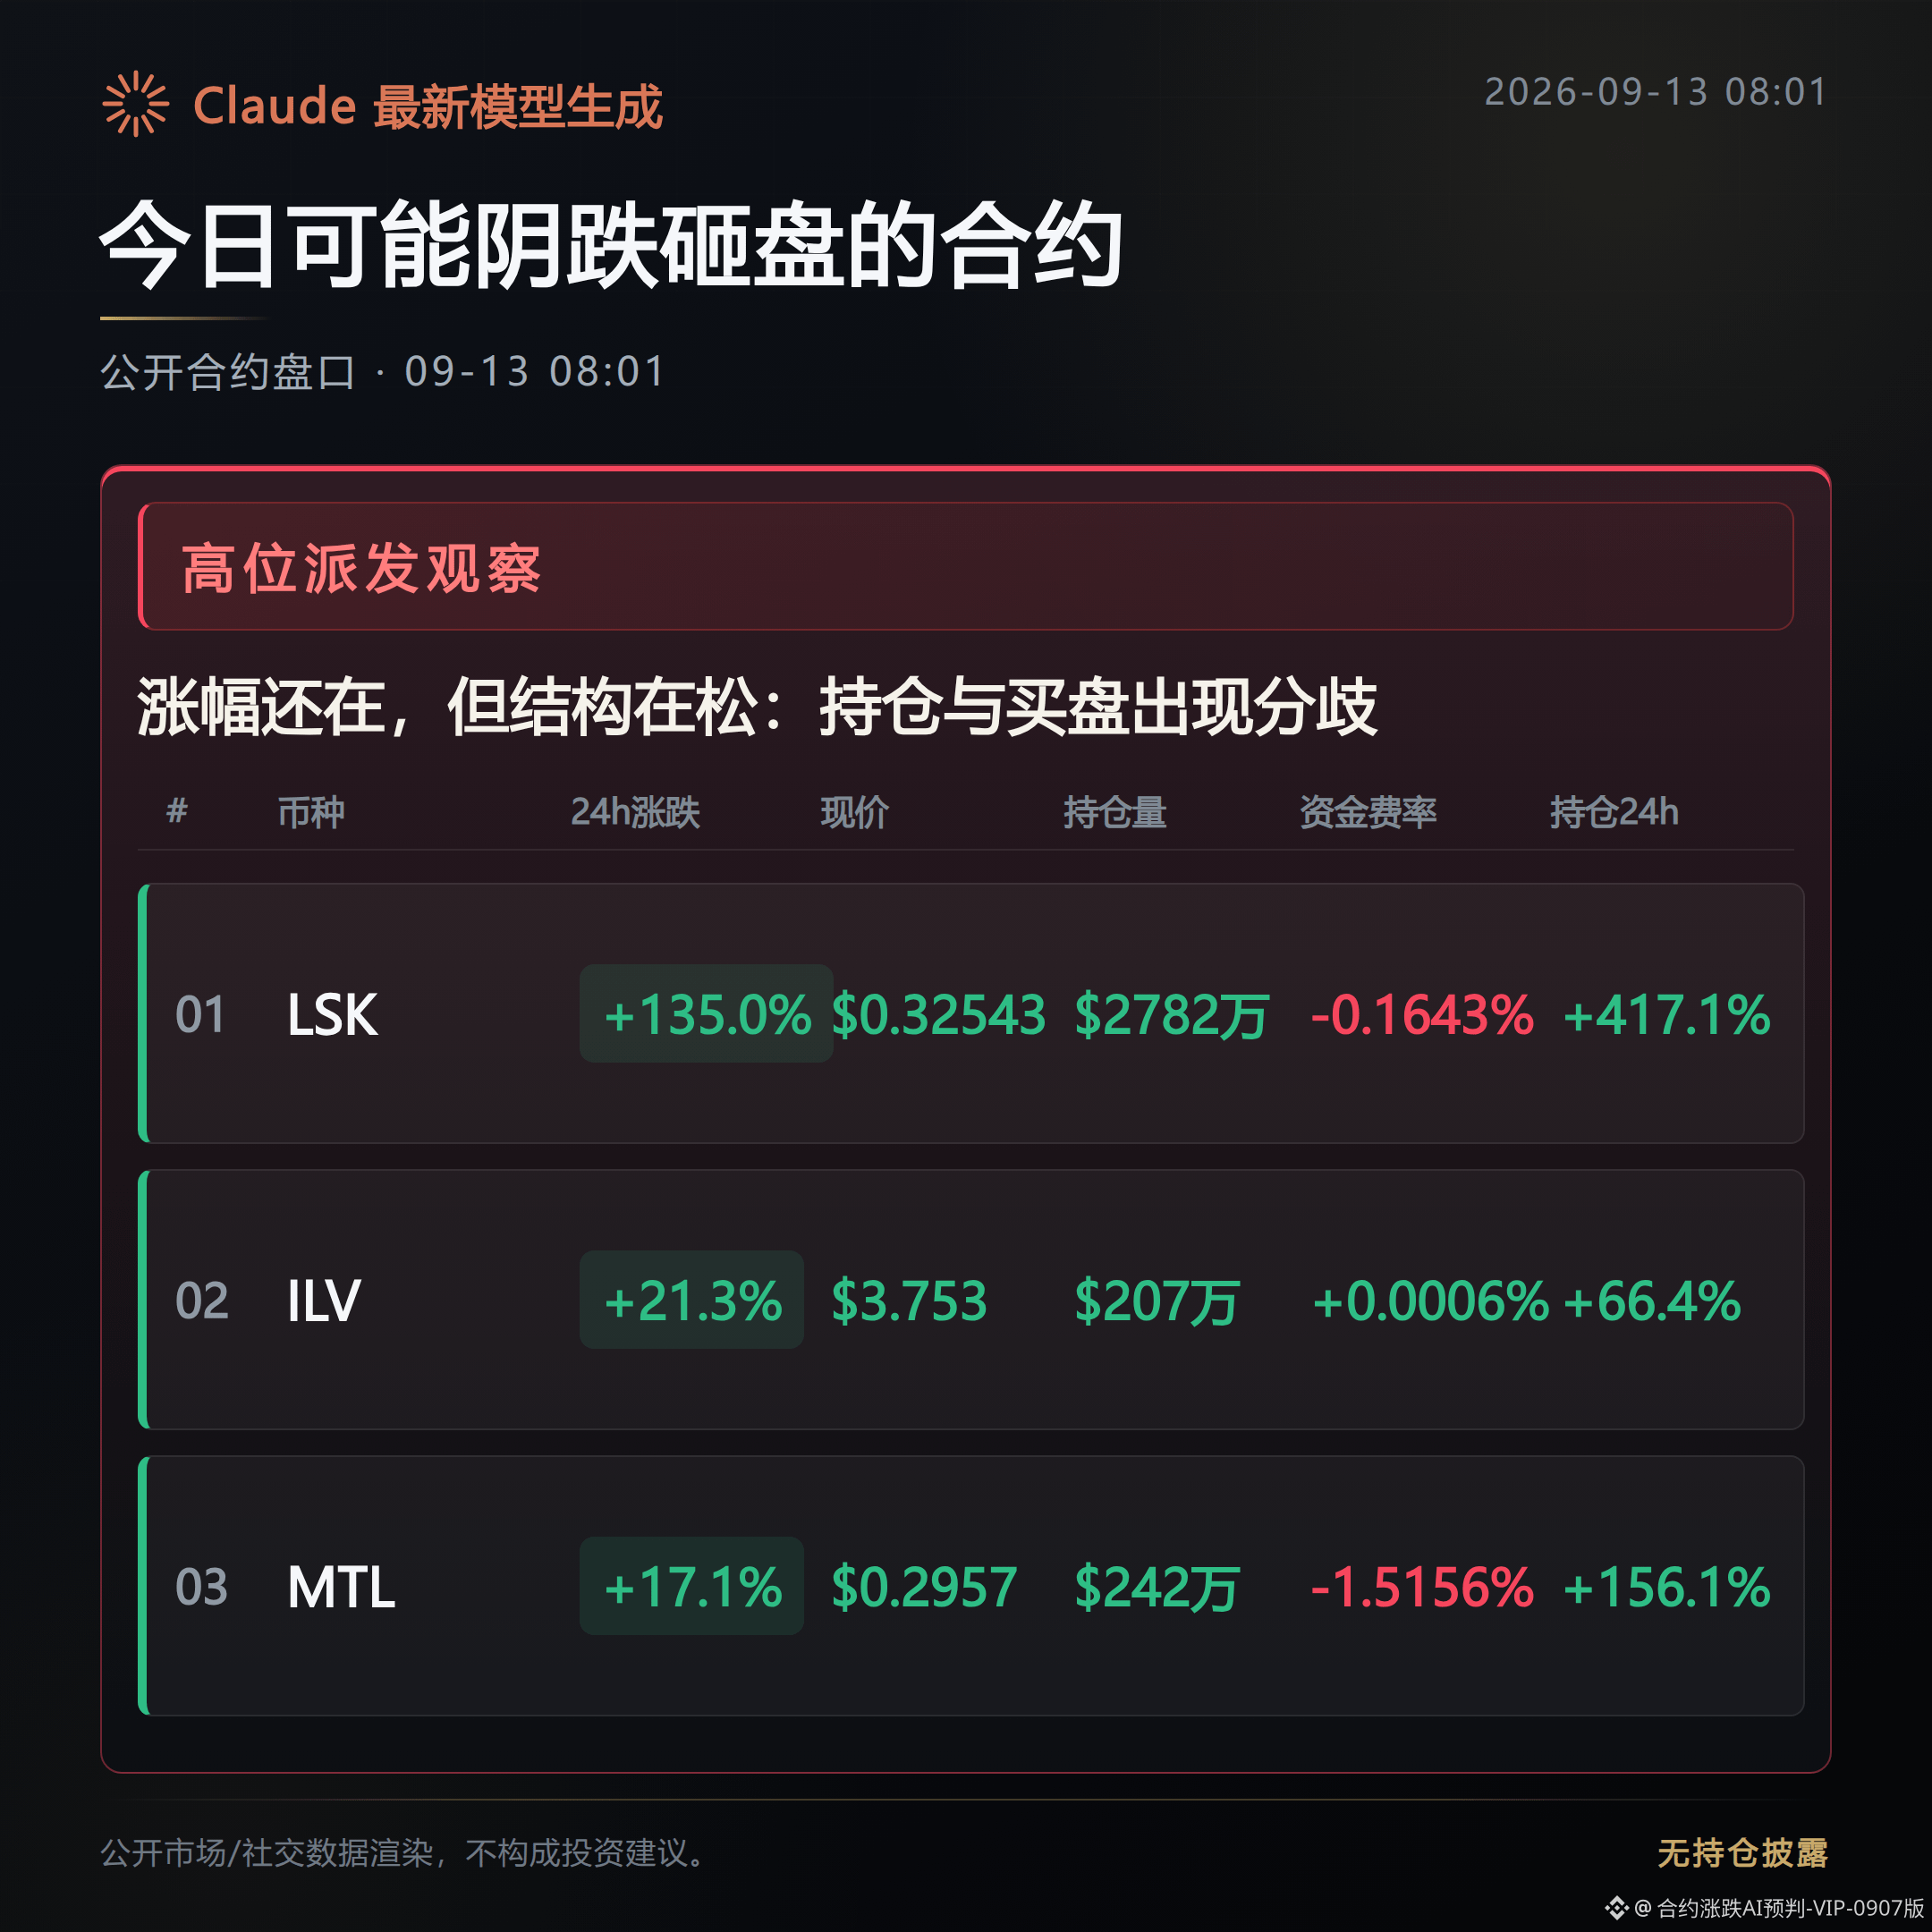
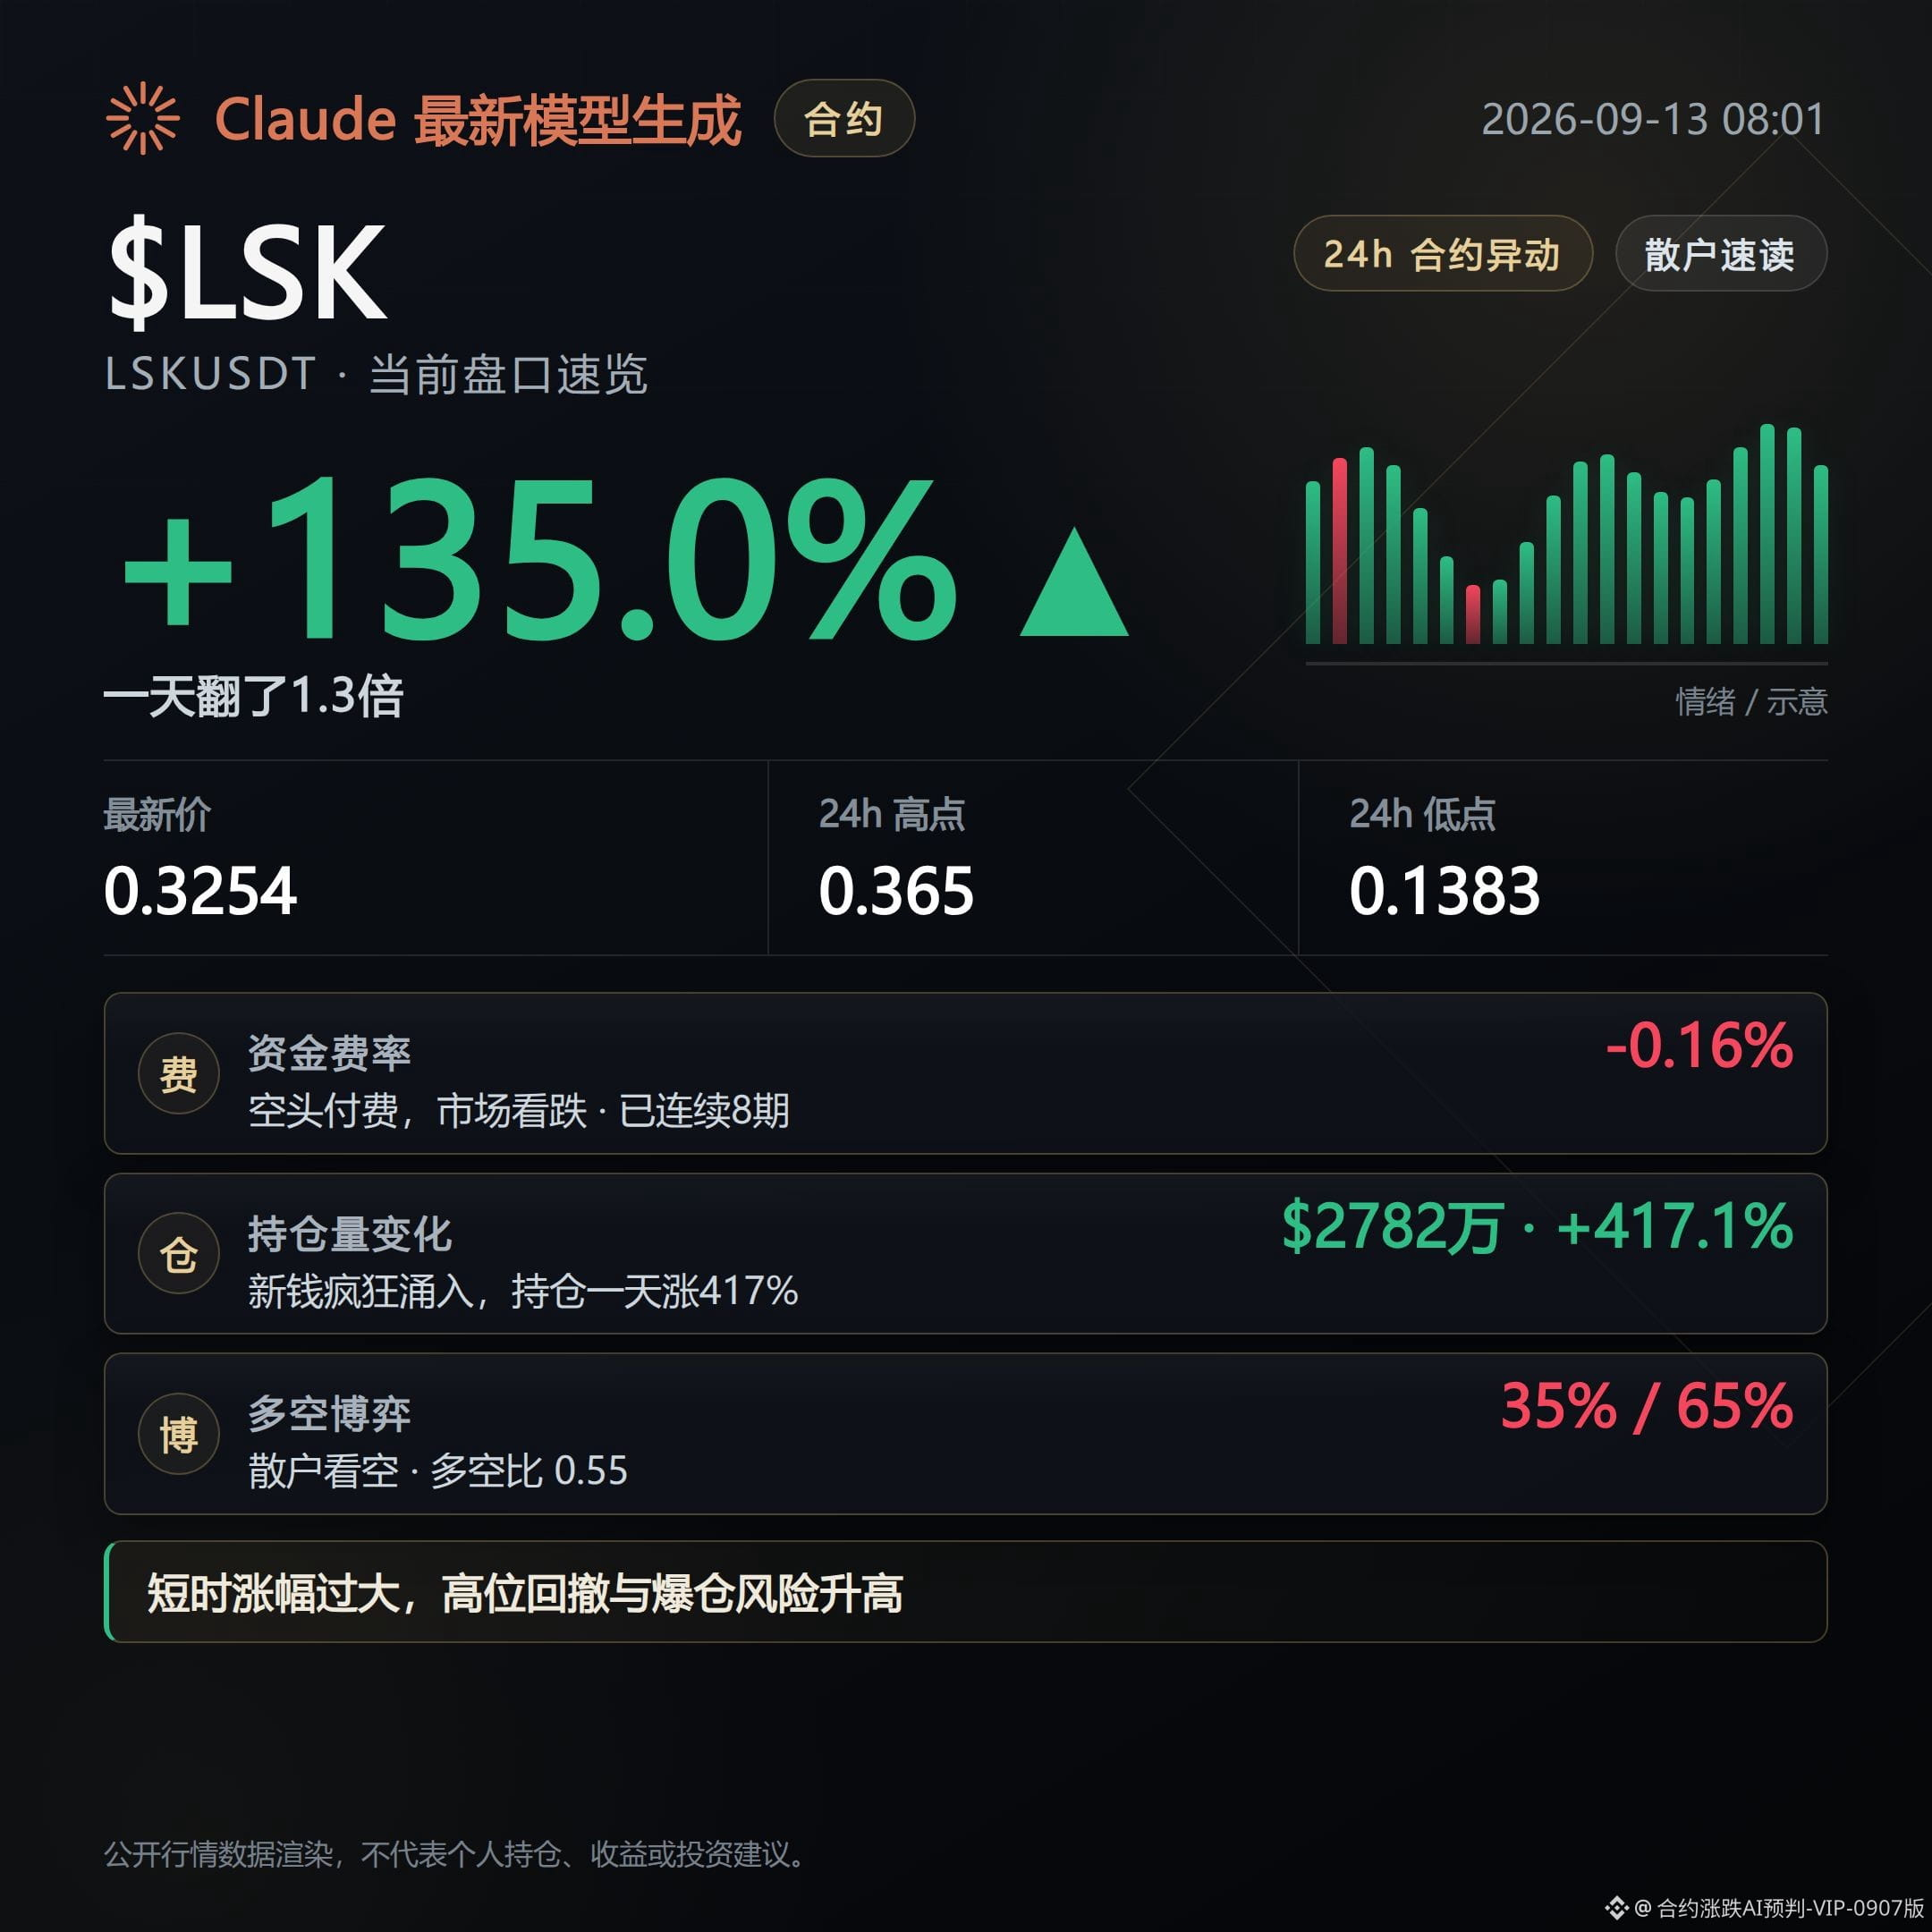
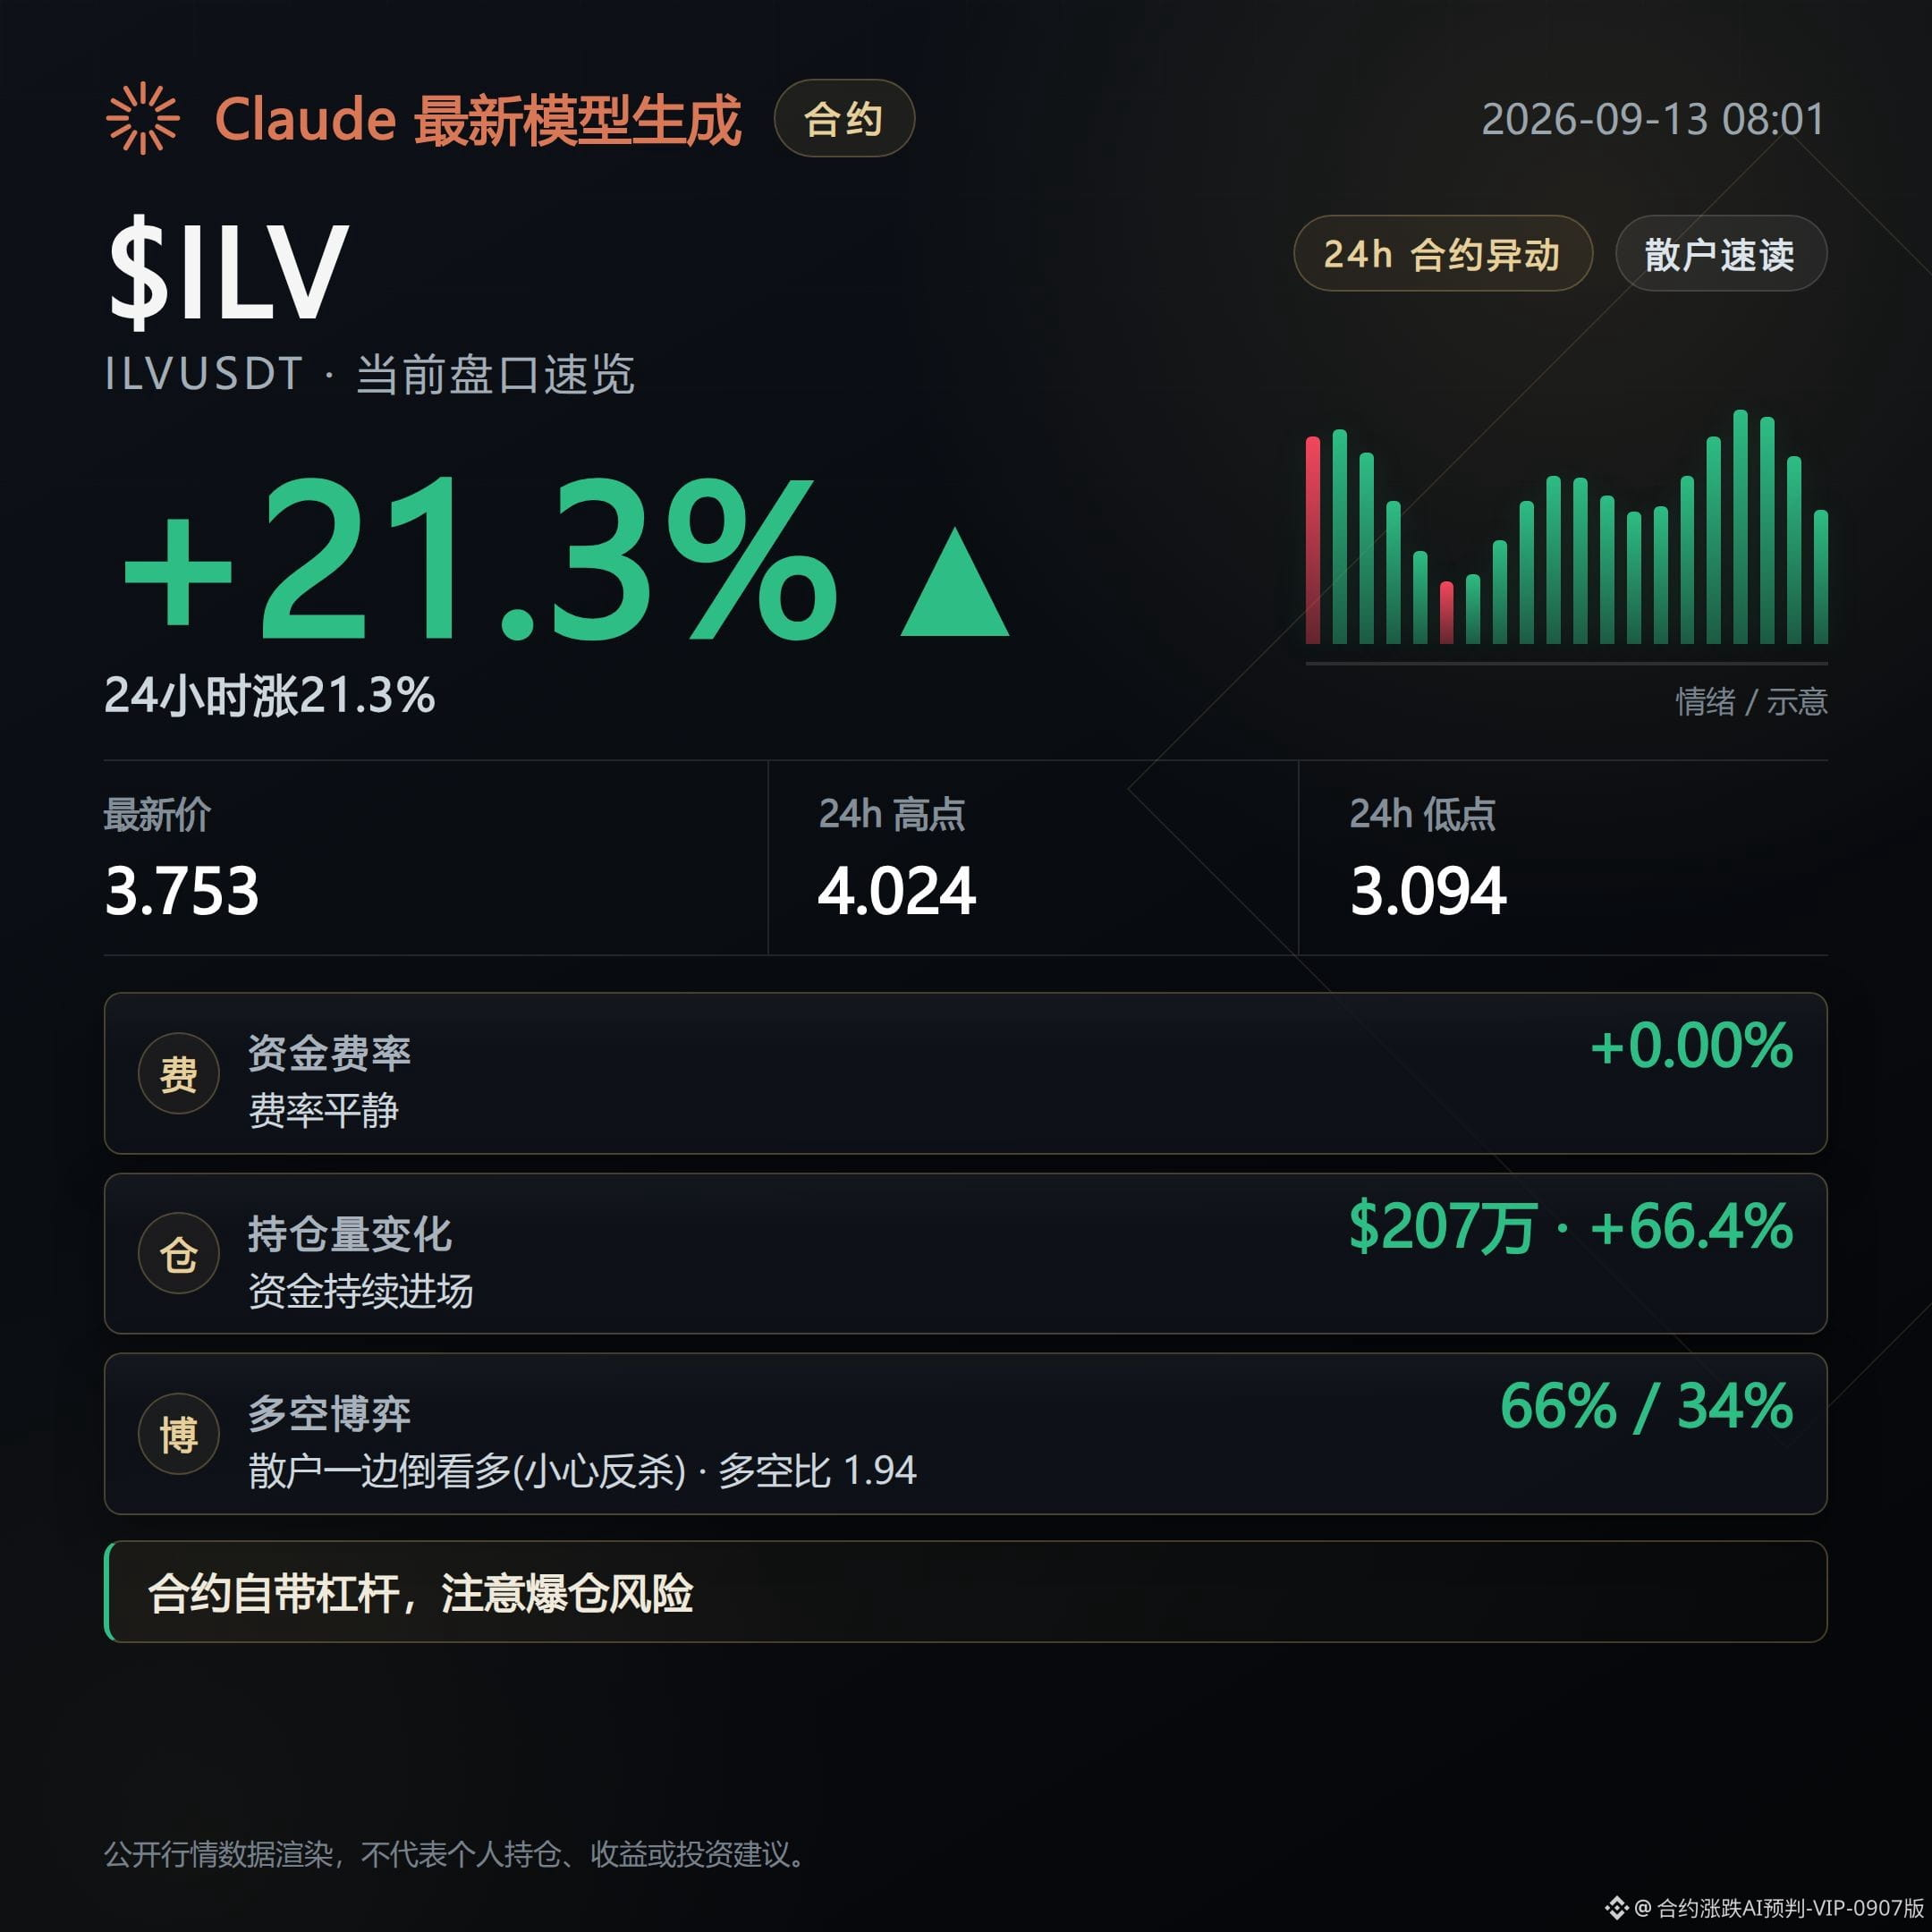
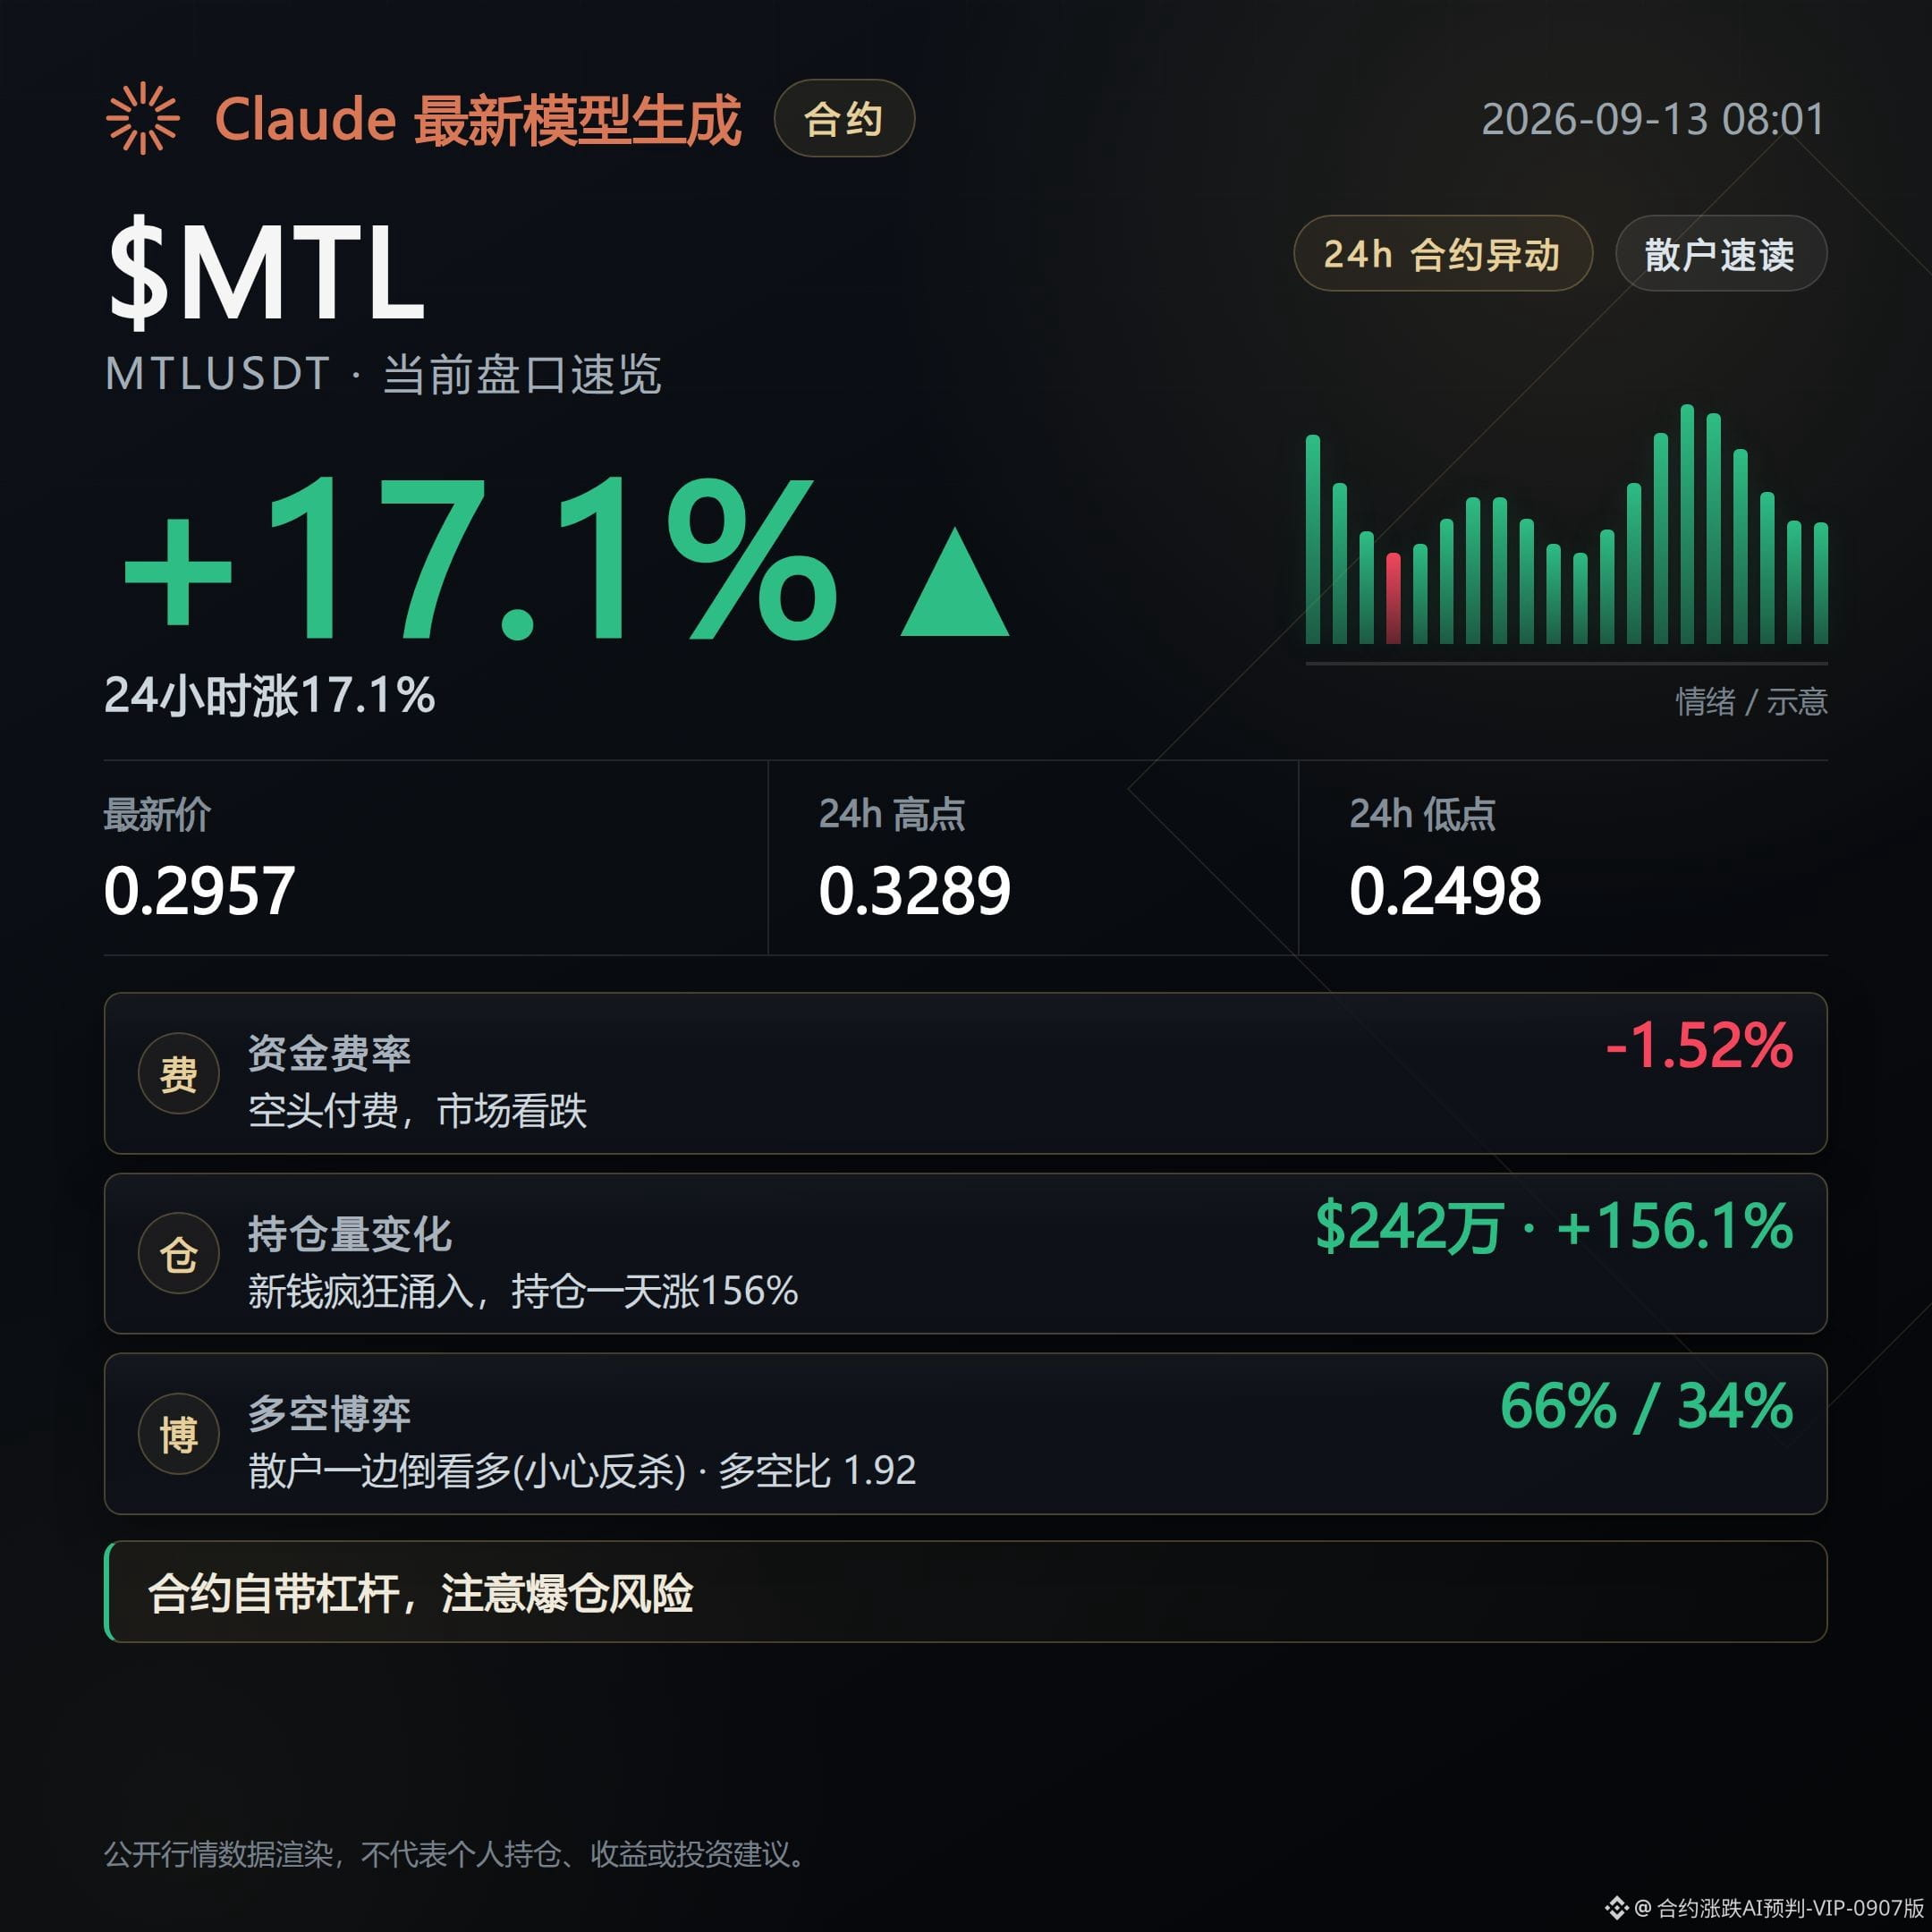
615
Bullish today—watch this line closely for the pullback.
Right now, all three contracts—REZ, THE, and PUMP—are moving upward with the price trend, with open interest rising in sync. On the order book, you can see aggressive buy orders pushing the price up. What I’m reading from this tape is that funds haven’t pulled out; positions are still stacking higher. Next, I’m watching whether the strength of this buying pressure can continue, and whether the open-interest growth rate will slow down.
For REZ, the 24-hour gain is 24.8%. The hardest supporting sign is that open interest in the past 24 hours has surged by 55.2%, indicating that this rally is backed by fresh capital and new entries—not just a hollow pump. Funding rates have been paid by shorts for 3 straight periods. Combined with the long/short account ratio of 1.76 and 64% of accounts leaning long, market sentiment is clearly biased toward the long side. The counterpoint is that the RSI/relative strength indicator has already climbed to 78.1, entering the overbought zone; the “overheated” short-term signal is right there as well. The risk of chasing highs needs to be seen clearly.
For THE, the price rise is comparatively steadier at 6.63%, but open interest has also followed up, rising by 6% over 24 hours. On the 1-hour view, it’s still increasing by another 2.2%, suggesting positions are not stopping their buildup. The long/short account ratio is 2.08, with 68% of accounts long. Funding rates have been paid by longs for 8 consecutive periods—this is a typical structure where the long side is willing to keep paying to maintain positions. The counterpoint is that retail accounts being 68% long is already somewhat crowded; once price goes sideways, this crowded positioning can easily get swept and cause a downside stampede in the opposite direction.
PUMP has the largest market size: 24-hour trading volume is $136 million, and open interest is at the $800 million level (accurate figure: $80.09 million). The 24-hour increase is 8.5%, and funding has been paid by longs for 8 consecutive periods, suggesting that in a big-cap pool, longs are also continuously adding. The counterpoint is that the active buy/sell order ratio is 0.86, leaning toward the sell side. Yet the large-holder long/short ratio is 1.98, meaning the large holders and retail traders aren’t moving in the same direction. This one should be watched closely to see whether the divergence converges.
Next, watch whether the open-interest growth rate and funding-rate structure for these three contracts can keep the same momentum.
If price continues with the trend, open interest stays rising in sync, and the long-side funding rate doesn’t flip negative, then the logic behind this rally can continue. If the open-interest growth rate turns around, active buy pressure weakens, and the funding-rate structure reverses, then this direction needs to be re-evaluated.
# Contract market snapshot
$REZ $THE $PUMP
Live disclosure: This account currently holds FOGO long positions; the related viewpoints match the actual positions.
This content is generated with the assistance of Claude Fable 5 and is for informational reference only—please verify it yourself.
Bullish today—watch this line closely for the pullback.
Right now, all three contracts—REZ, THE, and PUMP—are moving upward with the price trend, with open interest rising in sync. On the order book, you can see aggressive buy orders pushing the price up. What I’m reading from this tape is that funds haven’t pulled out; positions are still stacking higher. Next, I’m watching whether the strength of this buying pressure can continue, and whether the open-interest growth rate will slow down.
For REZ, the 24-hour gain is 24.8%. The hardest supporting sign is that open interest in the past 24 hours has surged by 55.2%, indicating that this rally is backed by fresh capital and new entries—not just a hollow pump. Funding rates have been paid by shorts for 3 straight periods. Combined with the long/short account ratio of 1.76 and 64% of accounts leaning long, market sentiment is clearly biased toward the long side. The counterpoint is that the RSI/relative strength indicator has already climbed to 78.1, entering the overbought zone; the “overheated” short-term signal is right there as well. The risk of chasing highs needs to be seen clearly.
For THE, the price rise is comparatively steadier at 6.63%, but open interest has also followed up, rising by 6% over 24 hours. On the 1-hour view, it’s still increasing by another 2.2%, suggesting positions are not stopping their buildup. The long/short account ratio is 2.08, with 68% of accounts long. Funding rates have been paid by longs for 8 consecutive periods—this is a typical structure where the long side is willing to keep paying to maintain positions. The counterpoint is that retail accounts being 68% long is already somewhat crowded; once price goes sideways, this crowded positioning can easily get swept and cause a downside stampede in the opposite direction.
PUMP has the largest market size: 24-hour trading volume is $136 million, and open interest is at the $800 million level (accurate figure: $80.09 million). The 24-hour increase is 8.5%, and funding has been paid by longs for 8 consecutive periods, suggesting that in a big-cap pool, longs are also continuously adding. The counterpoint is that the active buy/sell order ratio is 0.86, leaning toward the sell side. Yet the large-holder long/short ratio is 1.98, meaning the large holders and retail traders aren’t moving in the same direction. This one should be watched closely to see whether the divergence converges.
Next, watch whether the open-interest growth rate and funding-rate structure for these three contracts can keep the same momentum.
If price continues with the trend, open interest stays rising in sync, and the long-side funding rate doesn’t flip negative, then the logic behind this rally can continue. If the open-interest growth rate turns around, active buy pressure weakens, and the funding-rate structure reverses, then this direction needs to be re-evaluated.
# Contract market snapshot
$REZ $THE $PUMP
Live disclosure: This account currently holds FOGO long positions; the related viewpoints match the actual positions.
This content is generated with the assistance of Claude Fable 5 and is for informational reference only—please verify it yourself.
Right now, all three contracts—REZ, THE, and PUMP—are moving upward with the price trend, with open interest rising in sync. On the order book, you can see aggressive buy orders pushing the price up. What I’m reading from this tape is that funds haven’t pulled out; positions are still stacking higher. Next, I’m watching whether the strength of this buying pressure can continue, and whether the open-interest growth rate will slow down.
For REZ, the 24-hour gain is 24.8%. The hardest supporting sign is that open interest in the past 24 hours has surged by 55.2%, indicating that this rally is backed by fresh capital and new entries—not just a hollow pump. Funding rates have been paid by shorts for 3 straight periods. Combined with the long/short account ratio of 1.76 and 64% of accounts leaning long, market sentiment is clearly biased toward the long side. The counterpoint is that the RSI/relative strength indicator has already climbed to 78.1, entering the overbought zone; the “overheated” short-term signal is right there as well. The risk of chasing highs needs to be seen clearly.
For THE, the price rise is comparatively steadier at 6.63%, but open interest has also followed up, rising by 6% over 24 hours. On the 1-hour view, it’s still increasing by another 2.2%, suggesting positions are not stopping their buildup. The long/short account ratio is 2.08, with 68% of accounts long. Funding rates have been paid by longs for 8 consecutive periods—this is a typical structure where the long side is willing to keep paying to maintain positions. The counterpoint is that retail accounts being 68% long is already somewhat crowded; once price goes sideways, this crowded positioning can easily get swept and cause a downside stampede in the opposite direction.
PUMP has the largest market size: 24-hour trading volume is $136 million, and open interest is at the $800 million level (accurate figure: $80.09 million). The 24-hour increase is 8.5%, and funding has been paid by longs for 8 consecutive periods, suggesting that in a big-cap pool, longs are also continuously adding. The counterpoint is that the active buy/sell order ratio is 0.86, leaning toward the sell side. Yet the large-holder long/short ratio is 1.98, meaning the large holders and retail traders aren’t moving in the same direction. This one should be watched closely to see whether the divergence converges.
Next, watch whether the open-interest growth rate and funding-rate structure for these three contracts can keep the same momentum.
If price continues with the trend, open interest stays rising in sync, and the long-side funding rate doesn’t flip negative, then the logic behind this rally can continue. If the open-interest growth rate turns around, active buy pressure weakens, and the funding-rate structure reverses, then this direction needs to be re-evaluated.
# Contract market snapshot
$REZ $THE $PUMP
Live disclosure: This account currently holds FOGO long positions; the related viewpoints match the actual positions.
This content is generated with the assistance of Claude Fable 5 and is for informational reference only—please verify it yourself.
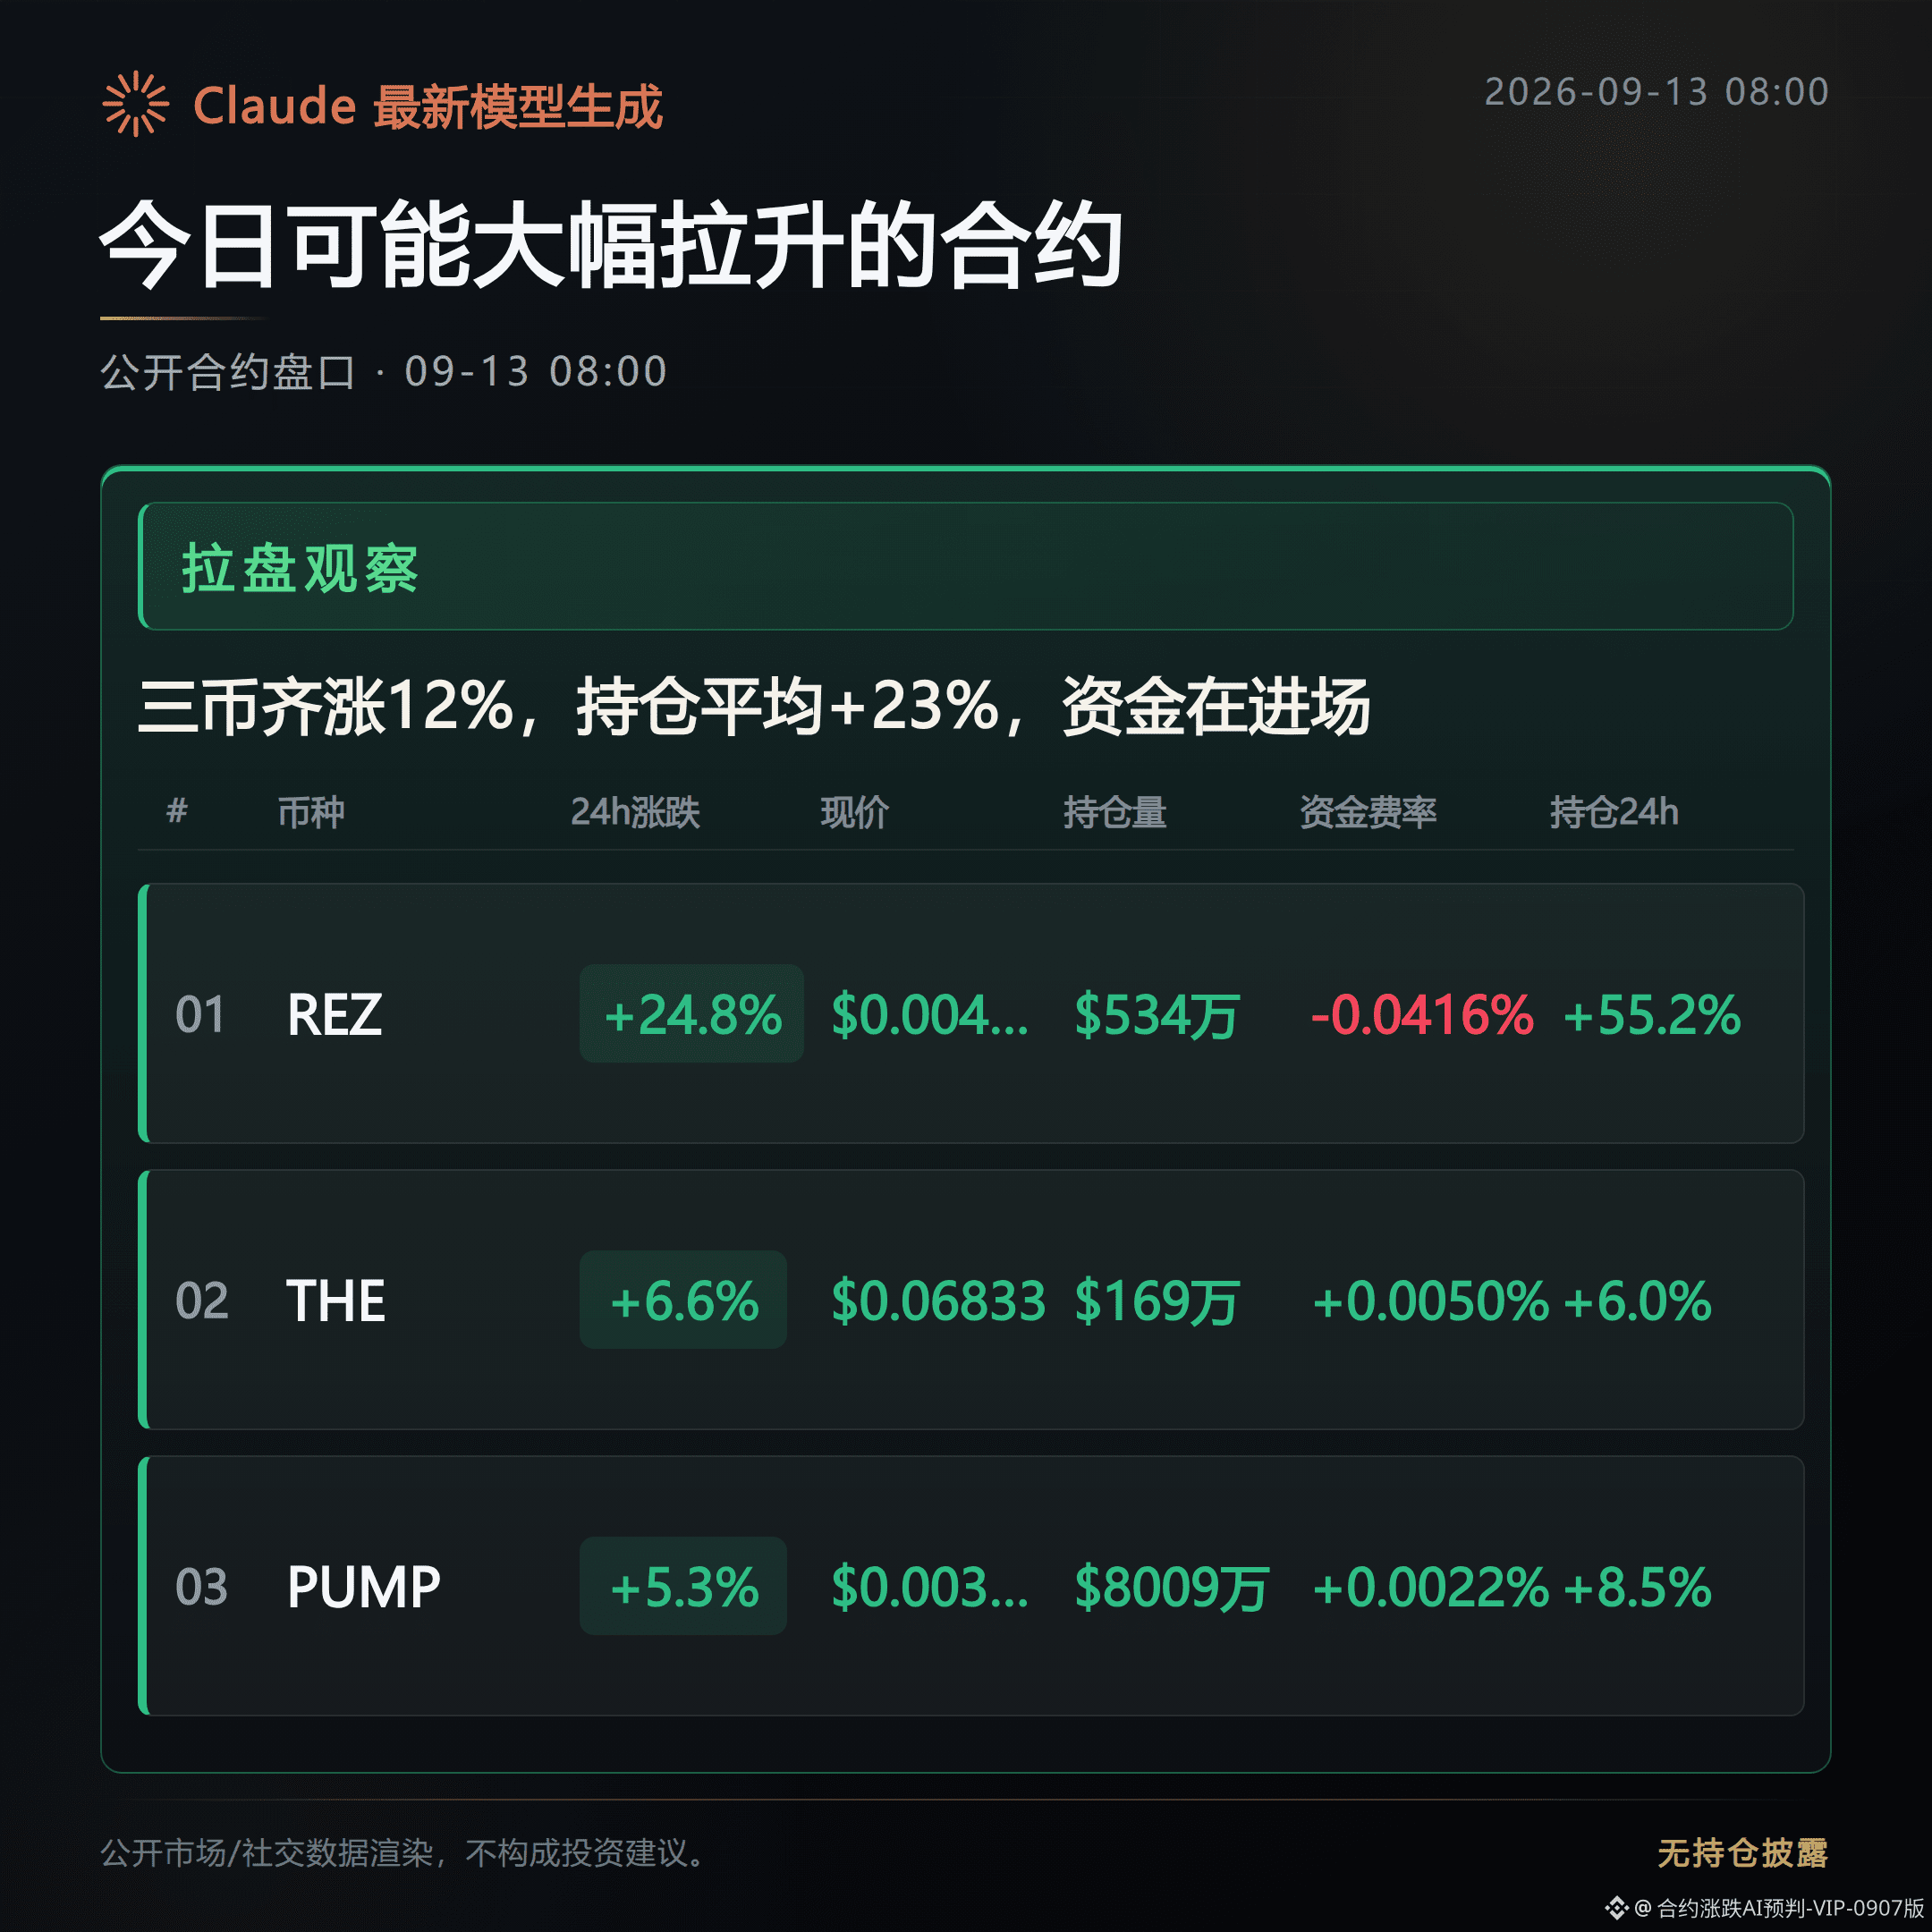
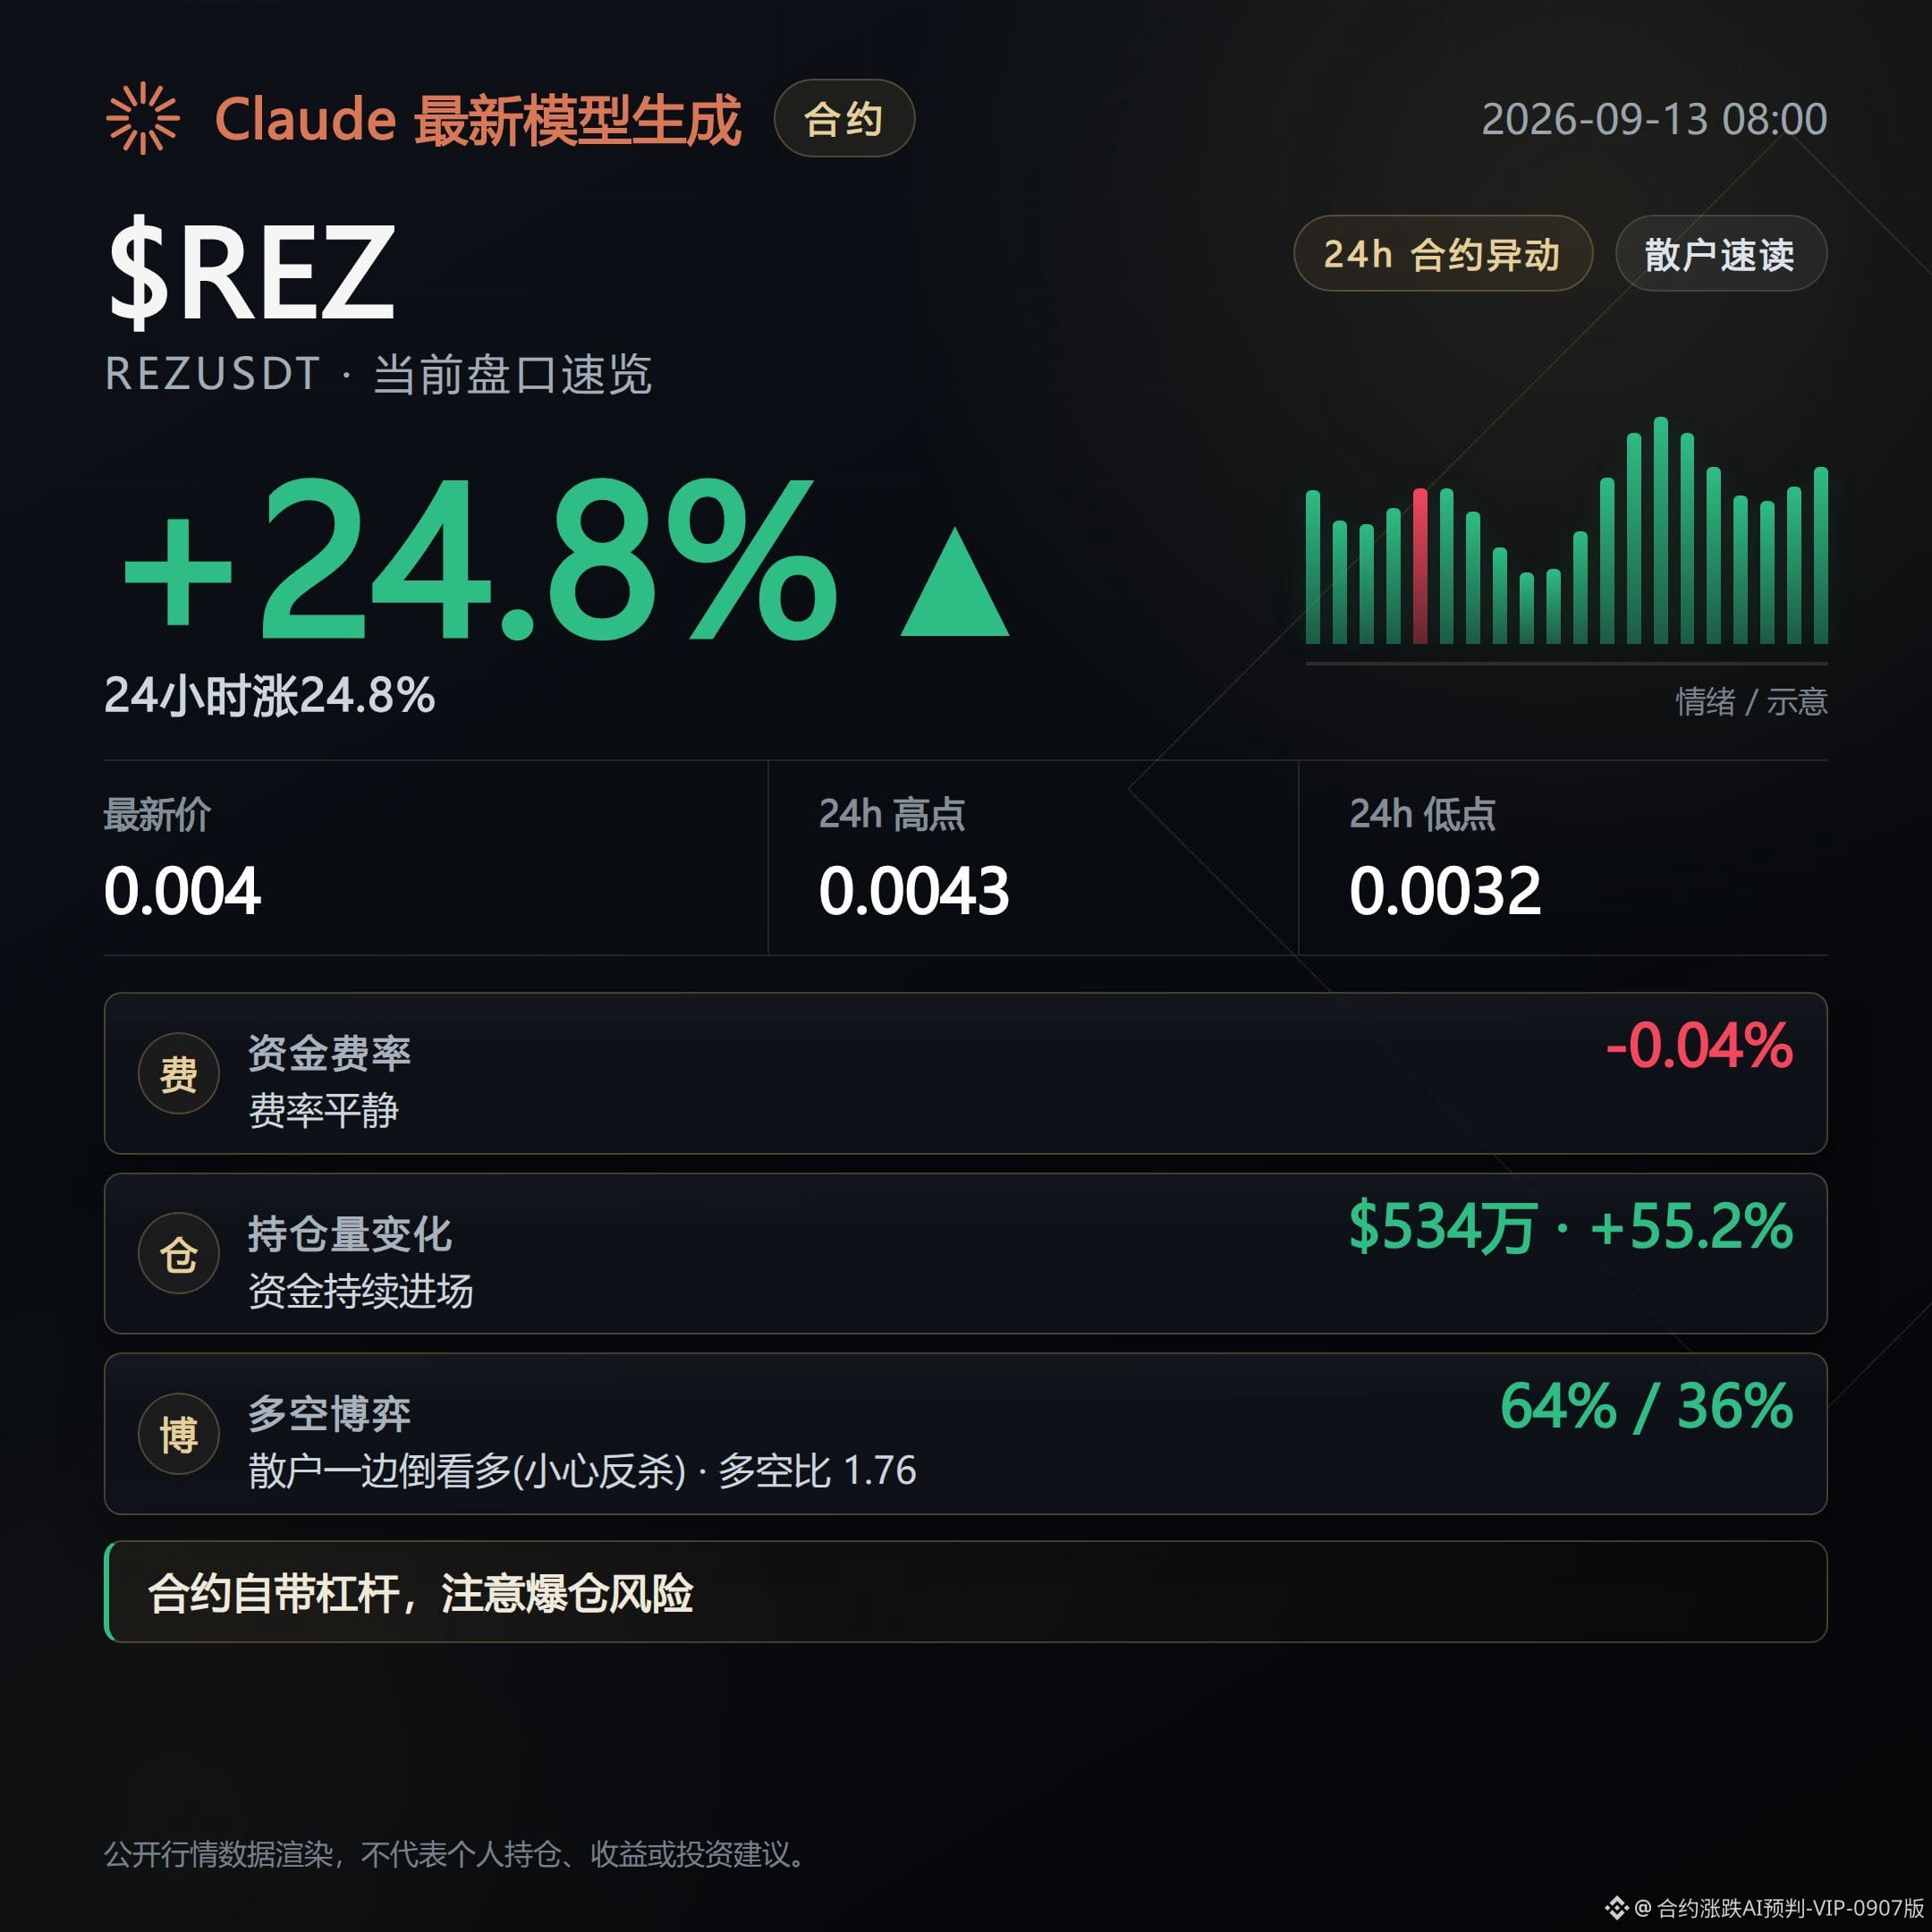
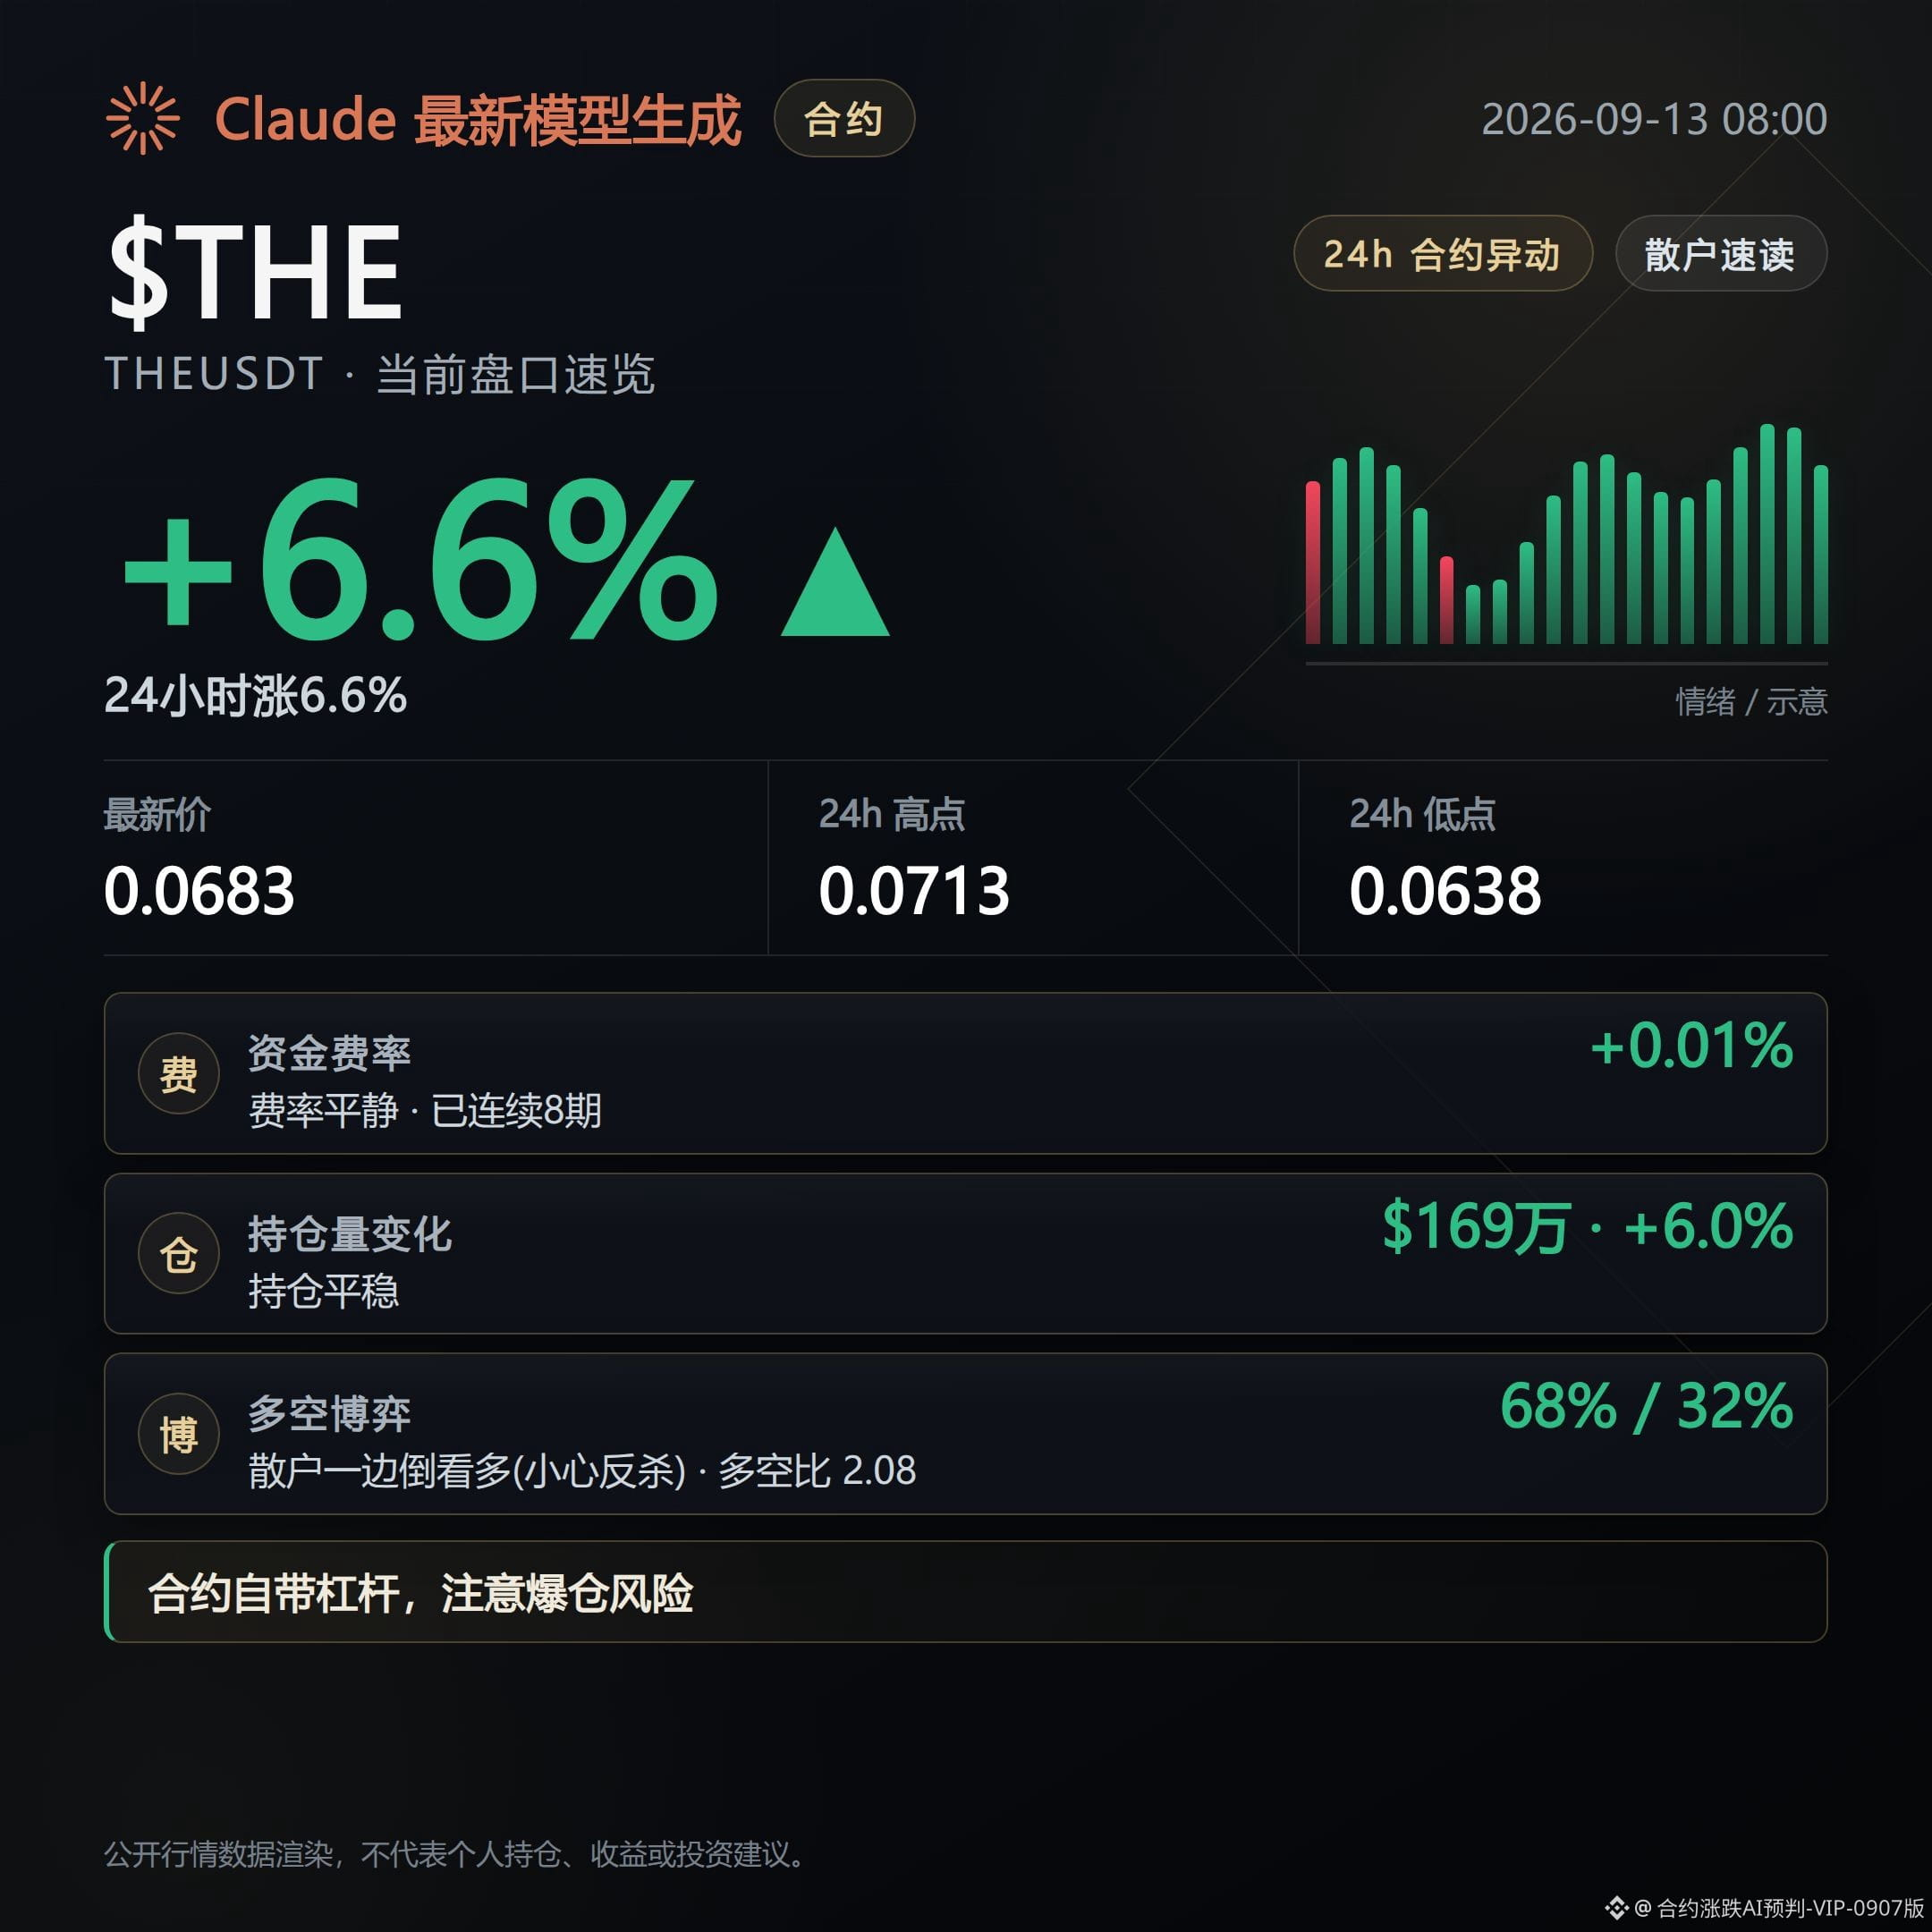
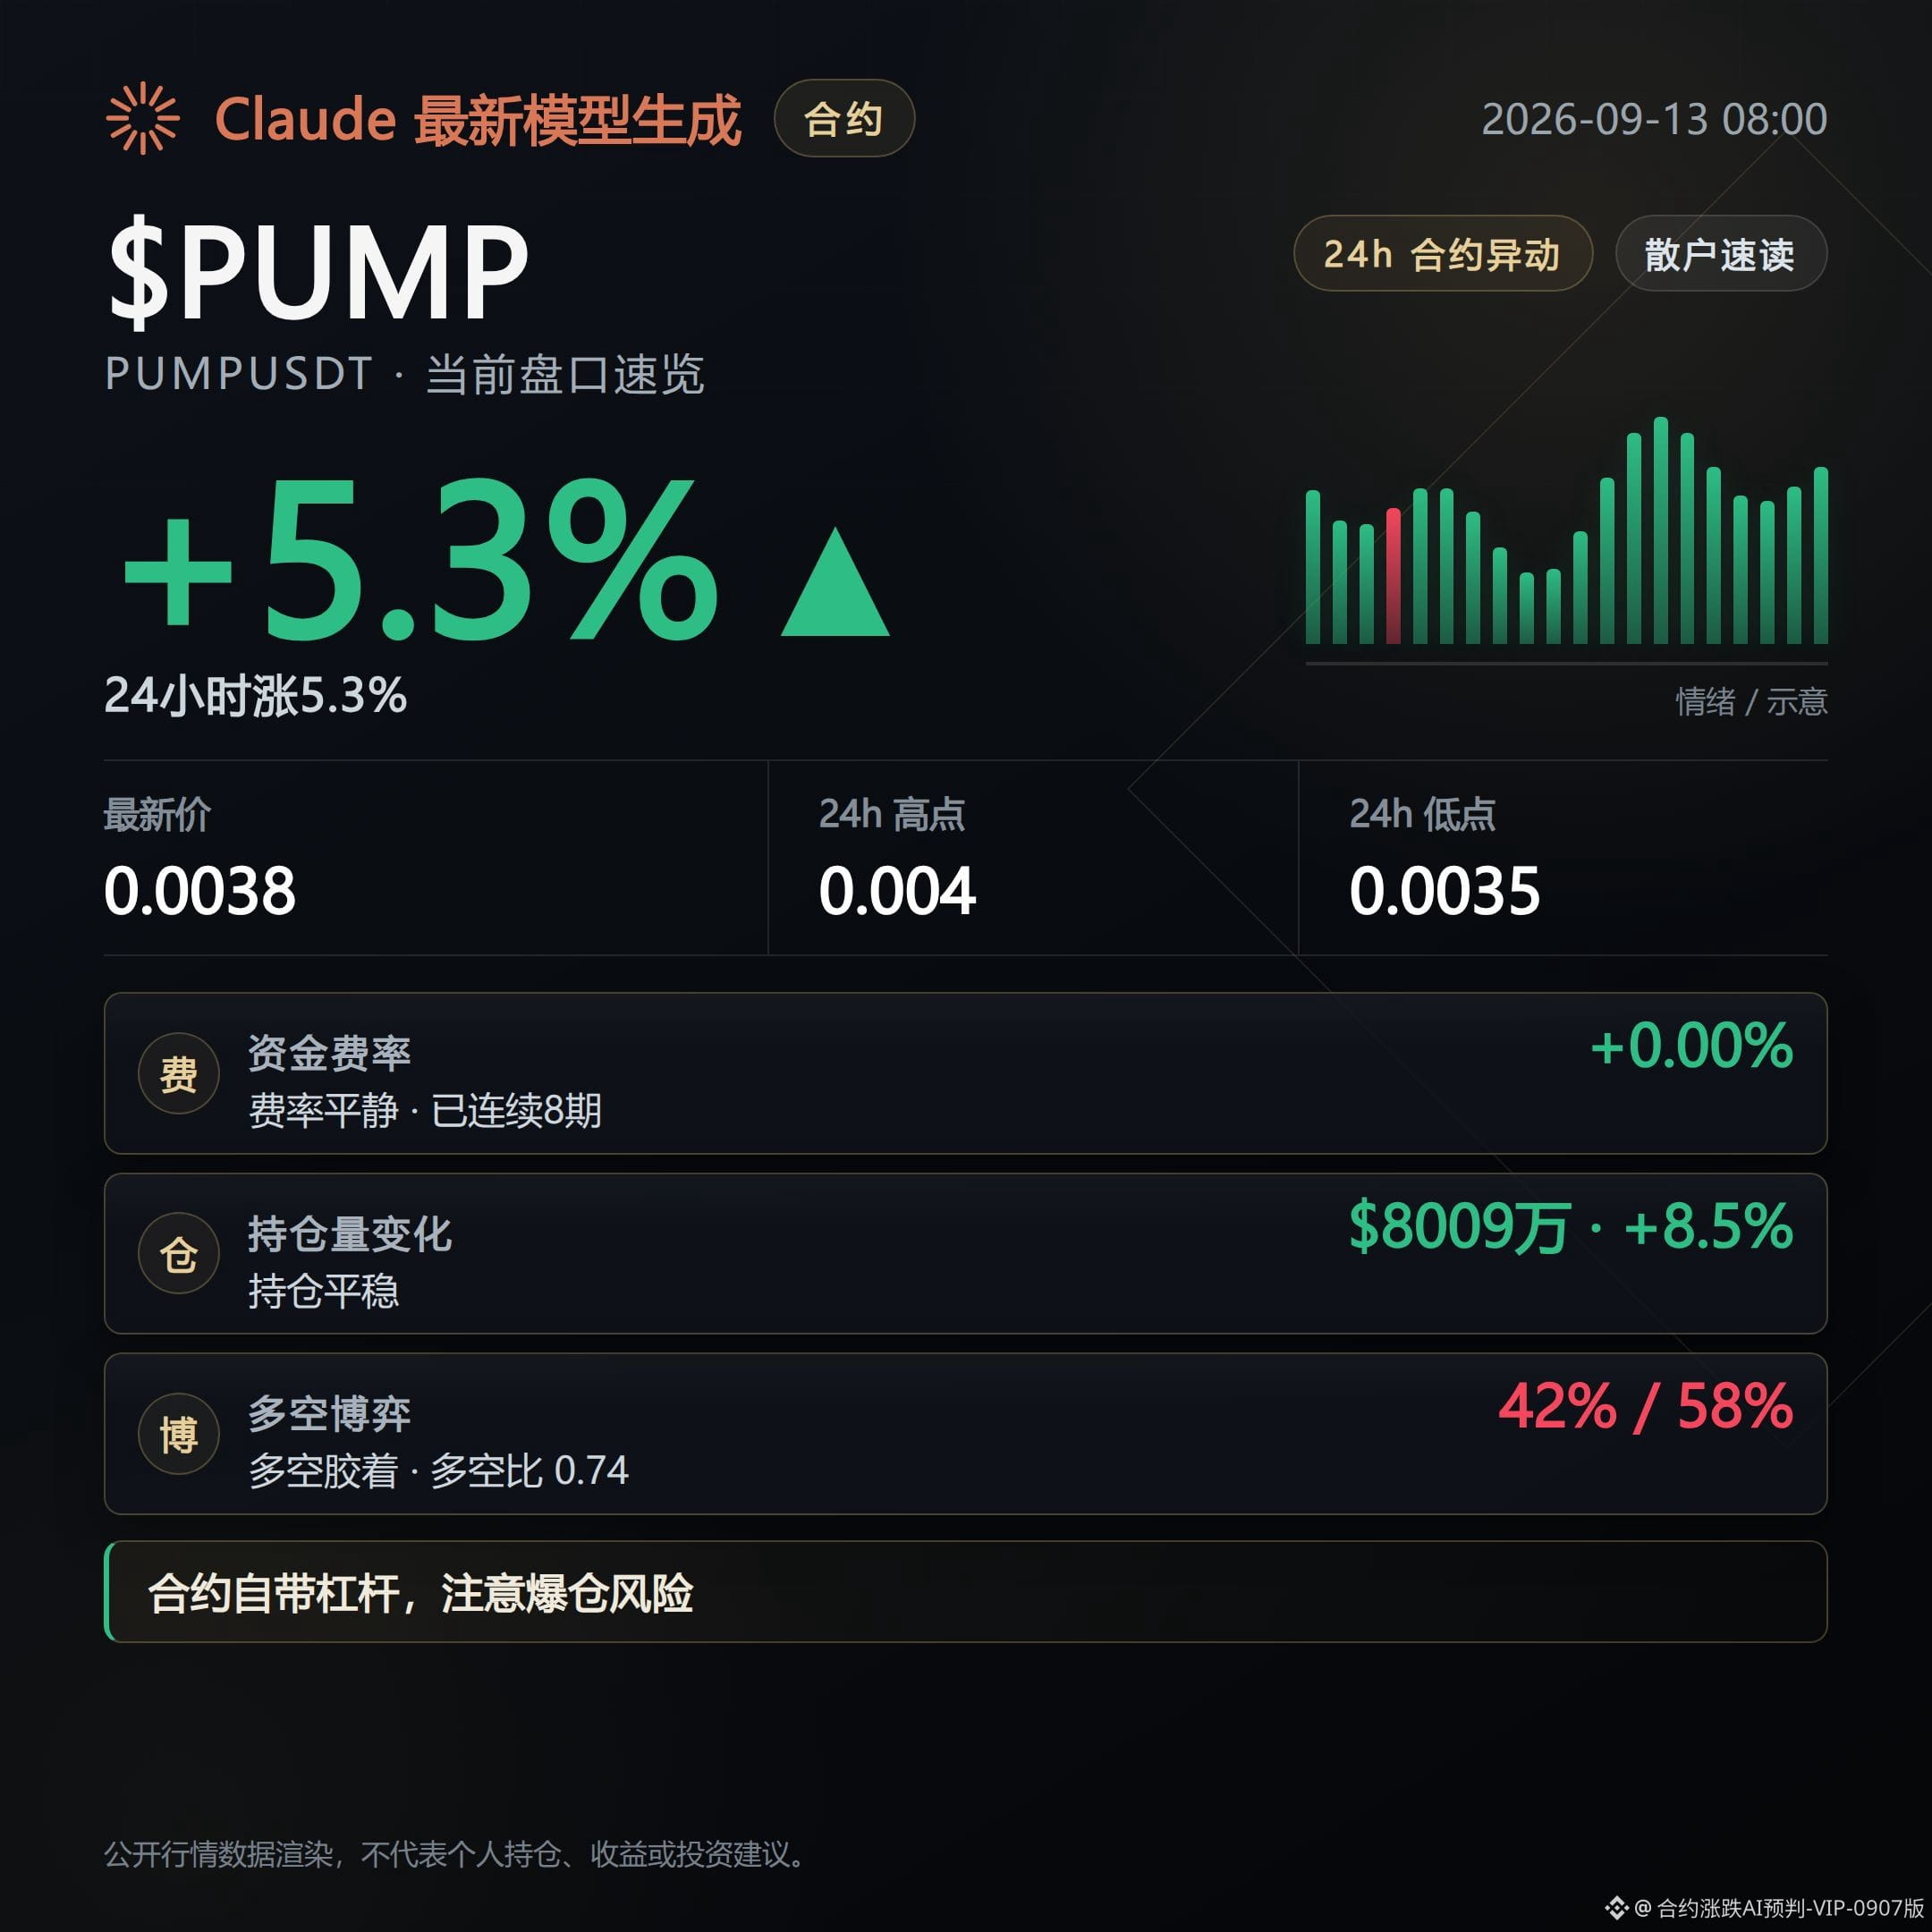
2
739
Contract Order Book Daily | 9/13 Morning: Greed 63 unchanged, 81700 holding firm
What I wrote in last night’s recap was greed at 63 points, while leverage was shrinking.
When I pulled up the morning data, the fear-and-greed index was still 63—unchanged, not a single point moved.
But leverage didn’t keep rising along with the emotion.
$BTC open position volume is $7.971 billion, down another 0.5% from the previous round.
This suggests this wave of greed has been holding throughout the night; new money didn’t dare to step in and add to positions. It’s sentiment propping up the price, not leverage pushing it.
The mark price is now 77195—about six percentage points away from the key resistance level 81700 mentioned by Carl De Kowo.
The meaning of this hurdle: if it doesn’t break through 81700, then this rebound can’t be considered confirmation of a new bull market; at most, it’s a range repair.
The funding rate is still positive: Bitcoin at 0.04%, Binance Coin at 0.053%. Longs are continuously paying.
Longs account for 62%, and the active buy side is slightly outweighing sells, so the mood is indeed somewhat optimistic.
But the price hasn’t been able to truly chew through this resistance for several consecutive rounds. That means unchanged greed (63) doesn’t necessarily imply the signal is continuing—it’s more like the market is stuck and dulling out.
There are two pieces of background noise worth putting at ease.
Bitcoin Switzerland plans to cut half of its positions in Switzerland and relocate the jobs overseas.
On the other hand, a trading platform exposed users’ identity verification materials and Bitcoin transaction records, because a phishing request disguised as a government department was leaked.
On the industry side, the cost of trust is quietly rising—moving in a different direction from the optimistic sentiment on the order book.
The shorts that are driving selling in the short term are concentrated in MTL, VTHO, and IOST. Their funding rates are all negative. Shorts are continuously paying a premium. Once the market rebounds, they’re likely to get squeezed out.
For SKDD, Lobster, and SIREN, the funding rates turned positive—longs are buying orders for their positions.
Watch the funding-rate changes for these smaller coins; you can spot capital relocating earlier than by watching the big pie.
Keep your eyes on that same 81700. As long as it doesn’t break, don’t treat the 63-point greed as a signal of a new trend.
#合约盘口 #Bitcoin
Live trade record: This account currently holds $FOGO long positions. As long as the logic remains unchanged, it will continue to hold.
Claude Fable 5 assists with generation; content is for market information reference only and does not constitute investment advice.
Contract Order Book Daily | 9/13 Morning: Greed 63 unchanged, 81700 holding firm
What I wrote in last night’s recap was greed at 63 points, while leverage was shrinking.
When I pulled up the morning data, the fear-and-greed index was still 63—unchanged, not a single point moved.
But leverage didn’t keep rising along with the emotion.
$BTC open position volume is $7.971 billion, down another 0.5% from the previous round.
This suggests this wave of greed has been holding throughout the night; new money didn’t dare to step in and add to positions. It’s sentiment propping up the price, not leverage pushing it.
The mark price is now 77195—about six percentage points away from the key resistance level 81700 mentioned by Carl De Kowo.
The meaning of this hurdle: if it doesn’t break through 81700, then this rebound can’t be considered confirmation of a new bull market; at most, it’s a range repair.
The funding rate is still positive: Bitcoin at 0.04%, Binance Coin at 0.053%. Longs are continuously paying.
Longs account for 62%, and the active buy side is slightly outweighing sells, so the mood is indeed somewhat optimistic.
But the price hasn’t been able to truly chew through this resistance for several consecutive rounds. That means unchanged greed (63) doesn’t necessarily imply the signal is continuing—it’s more like the market is stuck and dulling out.
There are two pieces of background noise worth putting at ease.
Bitcoin Switzerland plans to cut half of its positions in Switzerland and relocate the jobs overseas.
On the other hand, a trading platform exposed users’ identity verification materials and Bitcoin transaction records, because a phishing request disguised as a government department was leaked.
On the industry side, the cost of trust is quietly rising—moving in a different direction from the optimistic sentiment on the order book.
The shorts that are driving selling in the short term are concentrated in MTL, VTHO, and IOST. Their funding rates are all negative. Shorts are continuously paying a premium. Once the market rebounds, they’re likely to get squeezed out.
For SKDD, Lobster, and SIREN, the funding rates turned positive—longs are buying orders for their positions.
Watch the funding-rate changes for these smaller coins; you can spot capital relocating earlier than by watching the big pie.
Keep your eyes on that same 81700. As long as it doesn’t break, don’t treat the 63-point greed as a signal of a new trend.
#合约盘口 #Bitcoin
Live trade record: This account currently holds $FOGO long positions. As long as the logic remains unchanged, it will continue to hold.
Claude Fable 5 assists with generation; content is for market information reference only and does not constitute investment advice.
What I wrote in last night’s recap was greed at 63 points, while leverage was shrinking.
When I pulled up the morning data, the fear-and-greed index was still 63—unchanged, not a single point moved.
But leverage didn’t keep rising along with the emotion.
$BTC open position volume is $7.971 billion, down another 0.5% from the previous round.
This suggests this wave of greed has been holding throughout the night; new money didn’t dare to step in and add to positions. It’s sentiment propping up the price, not leverage pushing it.
The mark price is now 77195—about six percentage points away from the key resistance level 81700 mentioned by Carl De Kowo.
The meaning of this hurdle: if it doesn’t break through 81700, then this rebound can’t be considered confirmation of a new bull market; at most, it’s a range repair.
The funding rate is still positive: Bitcoin at 0.04%, Binance Coin at 0.053%. Longs are continuously paying.
Longs account for 62%, and the active buy side is slightly outweighing sells, so the mood is indeed somewhat optimistic.
But the price hasn’t been able to truly chew through this resistance for several consecutive rounds. That means unchanged greed (63) doesn’t necessarily imply the signal is continuing—it’s more like the market is stuck and dulling out.
There are two pieces of background noise worth putting at ease.
Bitcoin Switzerland plans to cut half of its positions in Switzerland and relocate the jobs overseas.
On the other hand, a trading platform exposed users’ identity verification materials and Bitcoin transaction records, because a phishing request disguised as a government department was leaked.
On the industry side, the cost of trust is quietly rising—moving in a different direction from the optimistic sentiment on the order book.
The shorts that are driving selling in the short term are concentrated in MTL, VTHO, and IOST. Their funding rates are all negative. Shorts are continuously paying a premium. Once the market rebounds, they’re likely to get squeezed out.
For SKDD, Lobster, and SIREN, the funding rates turned positive—longs are buying orders for their positions.
Watch the funding-rate changes for these smaller coins; you can spot capital relocating earlier than by watching the big pie.
Keep your eyes on that same 81700. As long as it doesn’t break, don’t treat the 63-point greed as a signal of a new trend.
#合约盘口 #Bitcoin
Live trade record: This account currently holds $FOGO long positions. As long as the logic remains unchanged, it will continue to hold.
Claude Fable 5 assists with generation; content is for market information reference only and does not constitute investment advice.
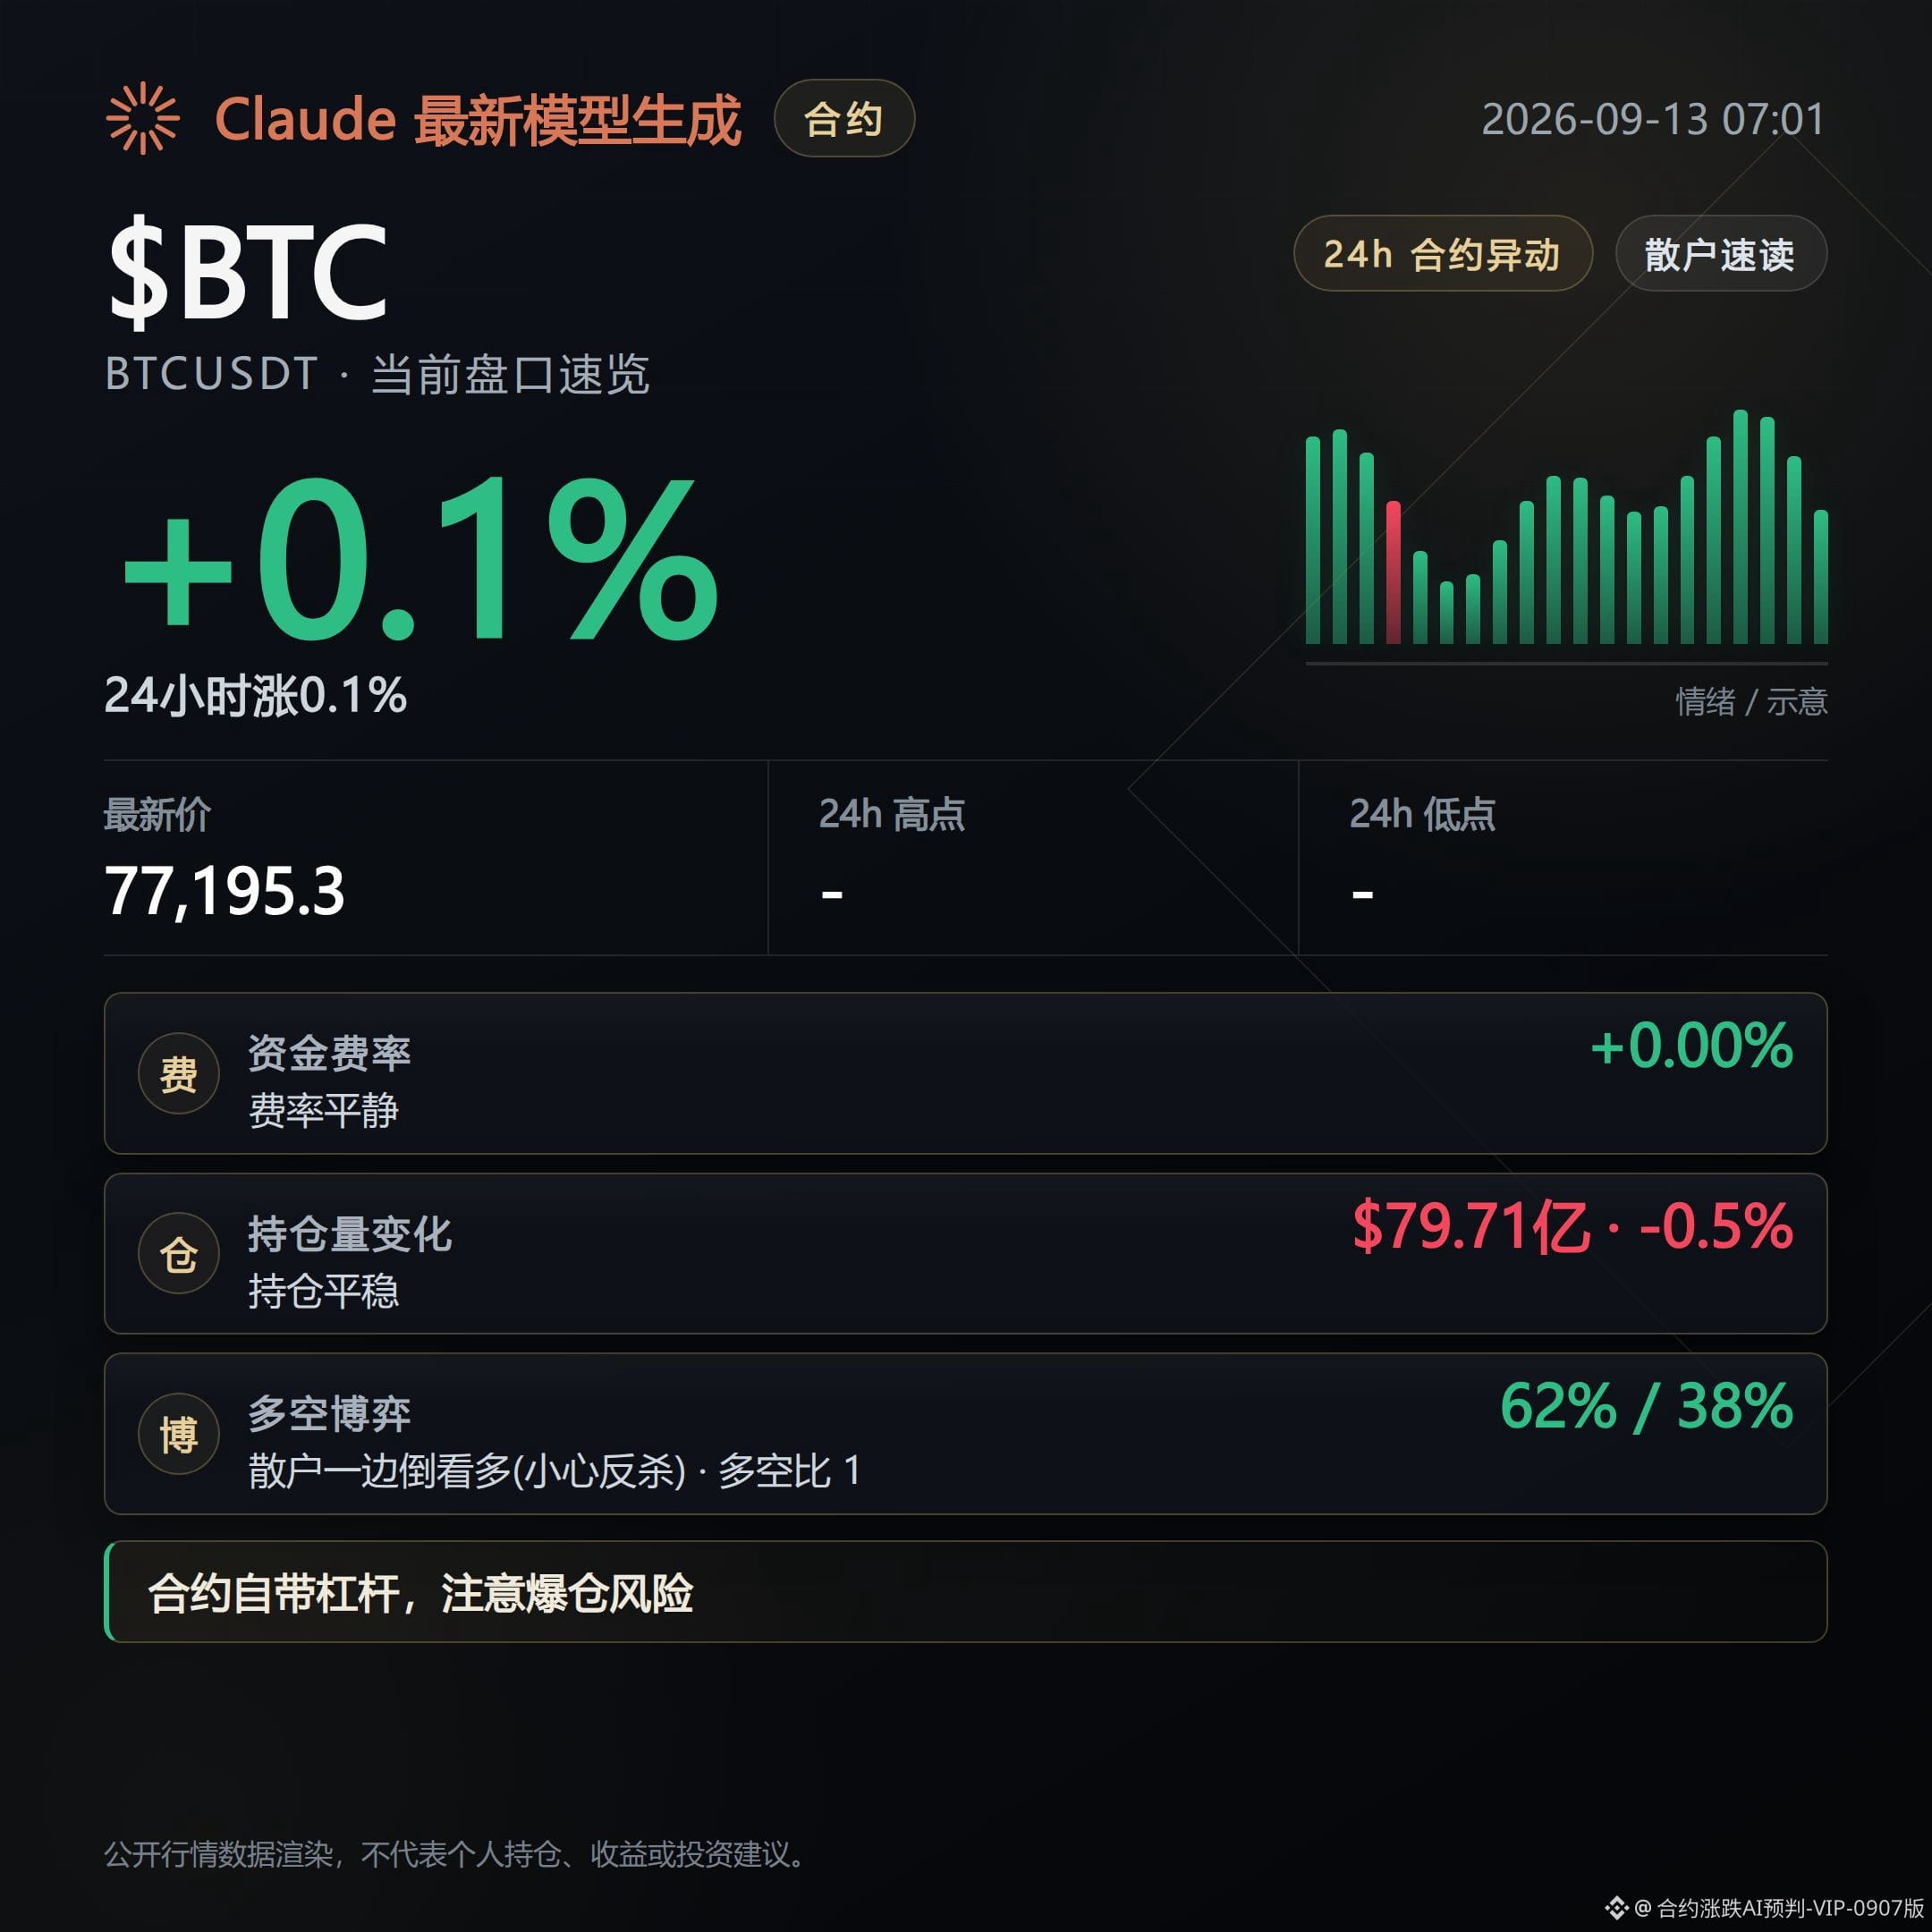
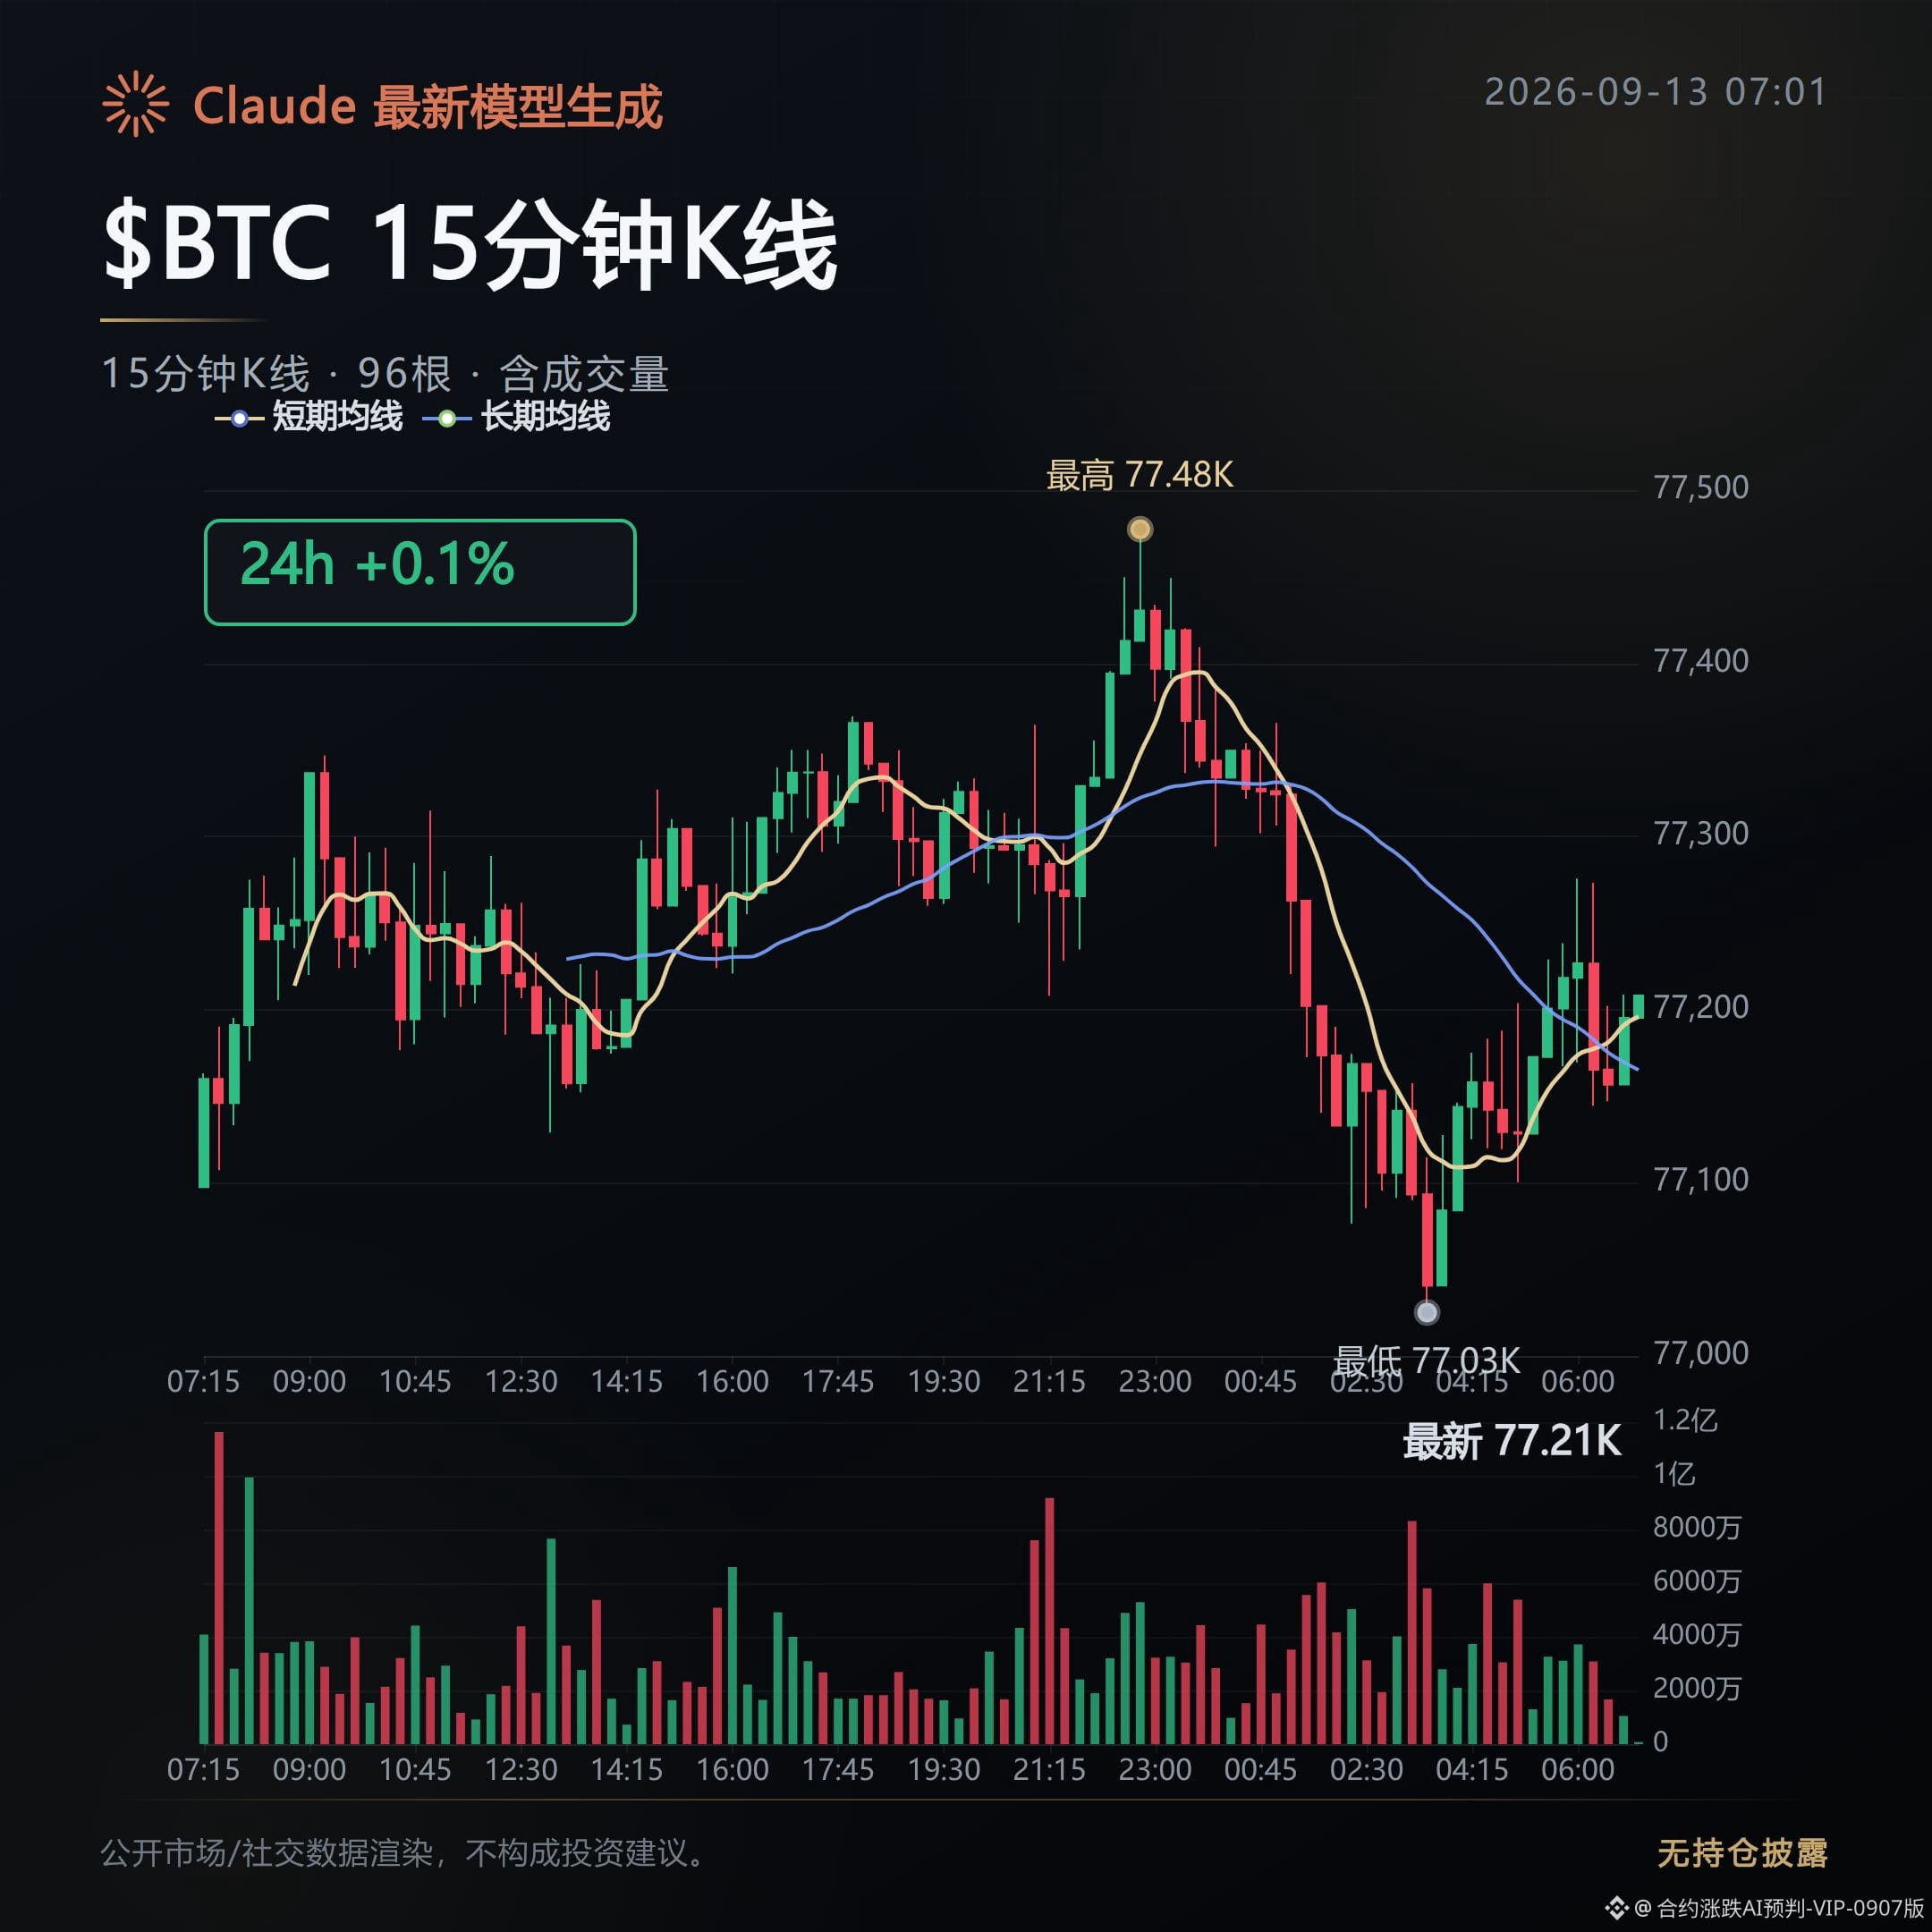
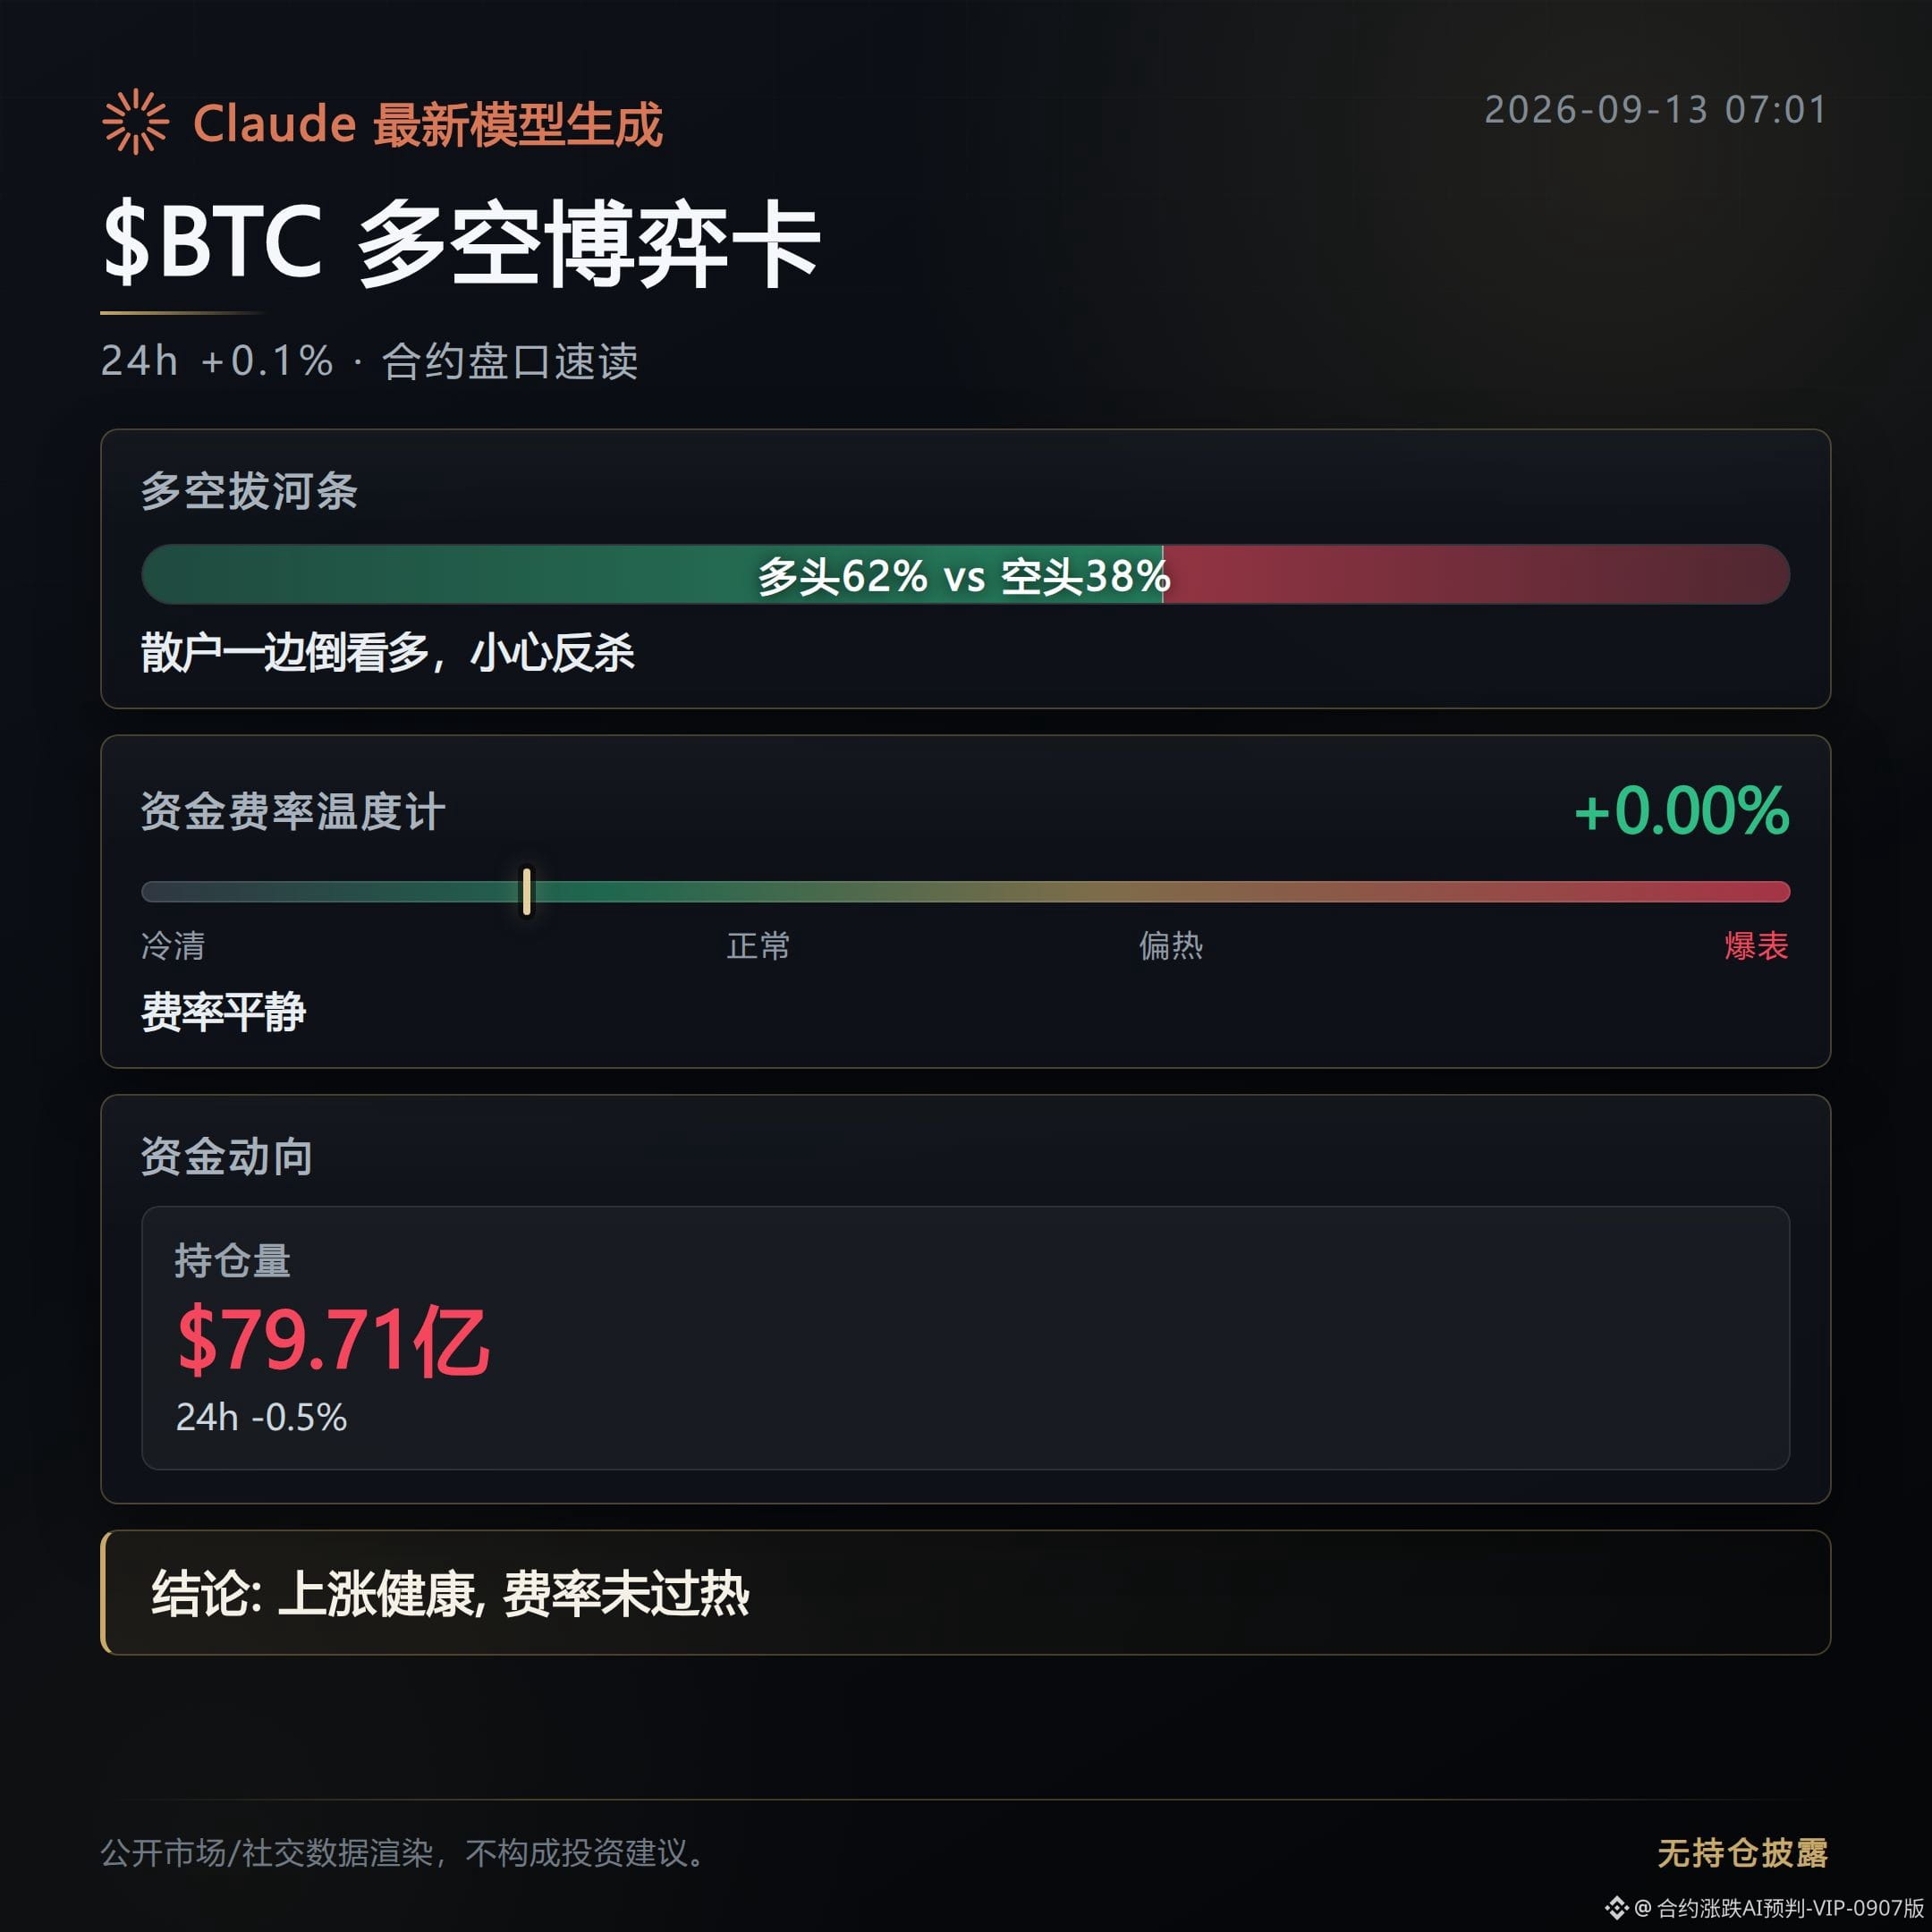
266
The order book conflicts in this batch of contracts are pretty obvious this morning—long and short data are clashing. It’s worth taking them apart one by one.
$Lobster is up 148.7%, with the price surging from 0.064 all the way to 0.175, nearly a 3x amplitude.
Trading volume is 767 million, which is strong, but the funding rate is only 0.093%. Longs aren’t paying much, which suggests this rally hasn’t fully been priced in by the funding/“sentiment fee” yet.
$LSK is up 77.9%, the most tangled structure today.
Funding rate is -0.131%, meaning shorts are effectively paying to hold their positions, while open interest has exploded by 377.5%. The price is making new highs while shorts stubbornly refuse to admit defeat.
The proportion of aggressive buy orders is 0.95, and the long-to-short people ratio is 0.53. There are more short positions among retail traders, yet buy pressure is pushing upward. This kind of divergence is the easiest to trigger an accelerated short squeeze.
$GRIFFAIN is up 40.1%, with open interest surging by 136.3%. The funding rate is still positive at 0.01%, so longs aren’t overheated, but their positions are building quickly.
Aggressive buy orders are 1.02, and the long-to-short ratio is 1.41. Longs have both more participants and stronger buying intensity—typical of new capital entering and chasing the rally.
In the losers list: $LAB is down 12.3%, yet open interest has decreased by 20.8%. Aggressive buy orders are 1.27, indicating buys are leading, but the long-to-short people ratio is as high as 2.75. This suggests retail longs at this level are getting slapped and exiting, meaning the direction of long/short data doesn’t match.
One-sentence verdict: In the same batch of coins, both longs and shorts have left tells. The conflicts between funding rate and open interest are more worth watching than the rise/fall percentage itself. Focus on whether the LSK structure where shorts are hard-fighting will get squeezed even more.
Ranks 4 to 10: ALCH is up 33.5%, I swear I’m up 31.9%, KOMA is up 31.0%, FLOCK is up 28.3%, REZ is up 25.6%, ILV is up 22.2%, and TA is up 20.6%. Heat is dispersed, with no second “extreme” structure like LSK.
Short-squeeze candidates: LSK’s short funding rate is -0.131%, already in a hard-fighting fee-paying state. Combined with open interest exploding by 377.5% within an hour, the longer this price-volume divergence drags on, the stronger the rebound when it comes.
$LSK $GRIFFAIN $Lobster #合约异动 #Short-squeeze signal
Position note: This account holds FOGO long positions in real trading. The disclosure is to keep the content consistent with actual trades.
Compiled with assistance from Claude Fable 5. For informational reference only—please verify independently.
The order book conflicts in this batch of contracts are pretty obvious this morning—long and short data are clashing. It’s worth taking them apart one by one.
$Lobster is up 148.7%, with the price surging from 0.064 all the way to 0.175, nearly a 3x amplitude.
Trading volume is 767 million, which is strong, but the funding rate is only 0.093%. Longs aren’t paying much, which suggests this rally hasn’t fully been priced in by the funding/“sentiment fee” yet.
$LSK is up 77.9%, the most tangled structure today.
Funding rate is -0.131%, meaning shorts are effectively paying to hold their positions, while open interest has exploded by 377.5%. The price is making new highs while shorts stubbornly refuse to admit defeat.
The proportion of aggressive buy orders is 0.95, and the long-to-short people ratio is 0.53. There are more short positions among retail traders, yet buy pressure is pushing upward. This kind of divergence is the easiest to trigger an accelerated short squeeze.
$GRIFFAIN is up 40.1%, with open interest surging by 136.3%. The funding rate is still positive at 0.01%, so longs aren’t overheated, but their positions are building quickly.
Aggressive buy orders are 1.02, and the long-to-short ratio is 1.41. Longs have both more participants and stronger buying intensity—typical of new capital entering and chasing the rally.
In the losers list: $LAB is down 12.3%, yet open interest has decreased by 20.8%. Aggressive buy orders are 1.27, indicating buys are leading, but the long-to-short people ratio is as high as 2.75. This suggests retail longs at this level are getting slapped and exiting, meaning the direction of long/short data doesn’t match.
One-sentence verdict: In the same batch of coins, both longs and shorts have left tells. The conflicts between funding rate and open interest are more worth watching than the rise/fall percentage itself. Focus on whether the LSK structure where shorts are hard-fighting will get squeezed even more.
Ranks 4 to 10: ALCH is up 33.5%, I swear I’m up 31.9%, KOMA is up 31.0%, FLOCK is up 28.3%, REZ is up 25.6%, ILV is up 22.2%, and TA is up 20.6%. Heat is dispersed, with no second “extreme” structure like LSK.
Short-squeeze candidates: LSK’s short funding rate is -0.131%, already in a hard-fighting fee-paying state. Combined with open interest exploding by 377.5% within an hour, the longer this price-volume divergence drags on, the stronger the rebound when it comes.
$LSK $GRIFFAIN $Lobster #合约异动 #Short-squeeze signal
Position note: This account holds FOGO long positions in real trading. The disclosure is to keep the content consistent with actual trades.
Compiled with assistance from Claude Fable 5. For informational reference only—please verify independently.
$Lobster is up 148.7%, with the price surging from 0.064 all the way to 0.175, nearly a 3x amplitude.
Trading volume is 767 million, which is strong, but the funding rate is only 0.093%. Longs aren’t paying much, which suggests this rally hasn’t fully been priced in by the funding/“sentiment fee” yet.
$LSK is up 77.9%, the most tangled structure today.
Funding rate is -0.131%, meaning shorts are effectively paying to hold their positions, while open interest has exploded by 377.5%. The price is making new highs while shorts stubbornly refuse to admit defeat.
The proportion of aggressive buy orders is 0.95, and the long-to-short people ratio is 0.53. There are more short positions among retail traders, yet buy pressure is pushing upward. This kind of divergence is the easiest to trigger an accelerated short squeeze.
$GRIFFAIN is up 40.1%, with open interest surging by 136.3%. The funding rate is still positive at 0.01%, so longs aren’t overheated, but their positions are building quickly.
Aggressive buy orders are 1.02, and the long-to-short ratio is 1.41. Longs have both more participants and stronger buying intensity—typical of new capital entering and chasing the rally.
In the losers list: $LAB is down 12.3%, yet open interest has decreased by 20.8%. Aggressive buy orders are 1.27, indicating buys are leading, but the long-to-short people ratio is as high as 2.75. This suggests retail longs at this level are getting slapped and exiting, meaning the direction of long/short data doesn’t match.
One-sentence verdict: In the same batch of coins, both longs and shorts have left tells. The conflicts between funding rate and open interest are more worth watching than the rise/fall percentage itself. Focus on whether the LSK structure where shorts are hard-fighting will get squeezed even more.
Ranks 4 to 10: ALCH is up 33.5%, I swear I’m up 31.9%, KOMA is up 31.0%, FLOCK is up 28.3%, REZ is up 25.6%, ILV is up 22.2%, and TA is up 20.6%. Heat is dispersed, with no second “extreme” structure like LSK.
Short-squeeze candidates: LSK’s short funding rate is -0.131%, already in a hard-fighting fee-paying state. Combined with open interest exploding by 377.5% within an hour, the longer this price-volume divergence drags on, the stronger the rebound when it comes.
$LSK $GRIFFAIN $Lobster #合约异动 #Short-squeeze signal
Position note: This account holds FOGO long positions in real trading. The disclosure is to keep the content consistent with actual trades.
Compiled with assistance from Claude Fable 5. For informational reference only—please verify independently.
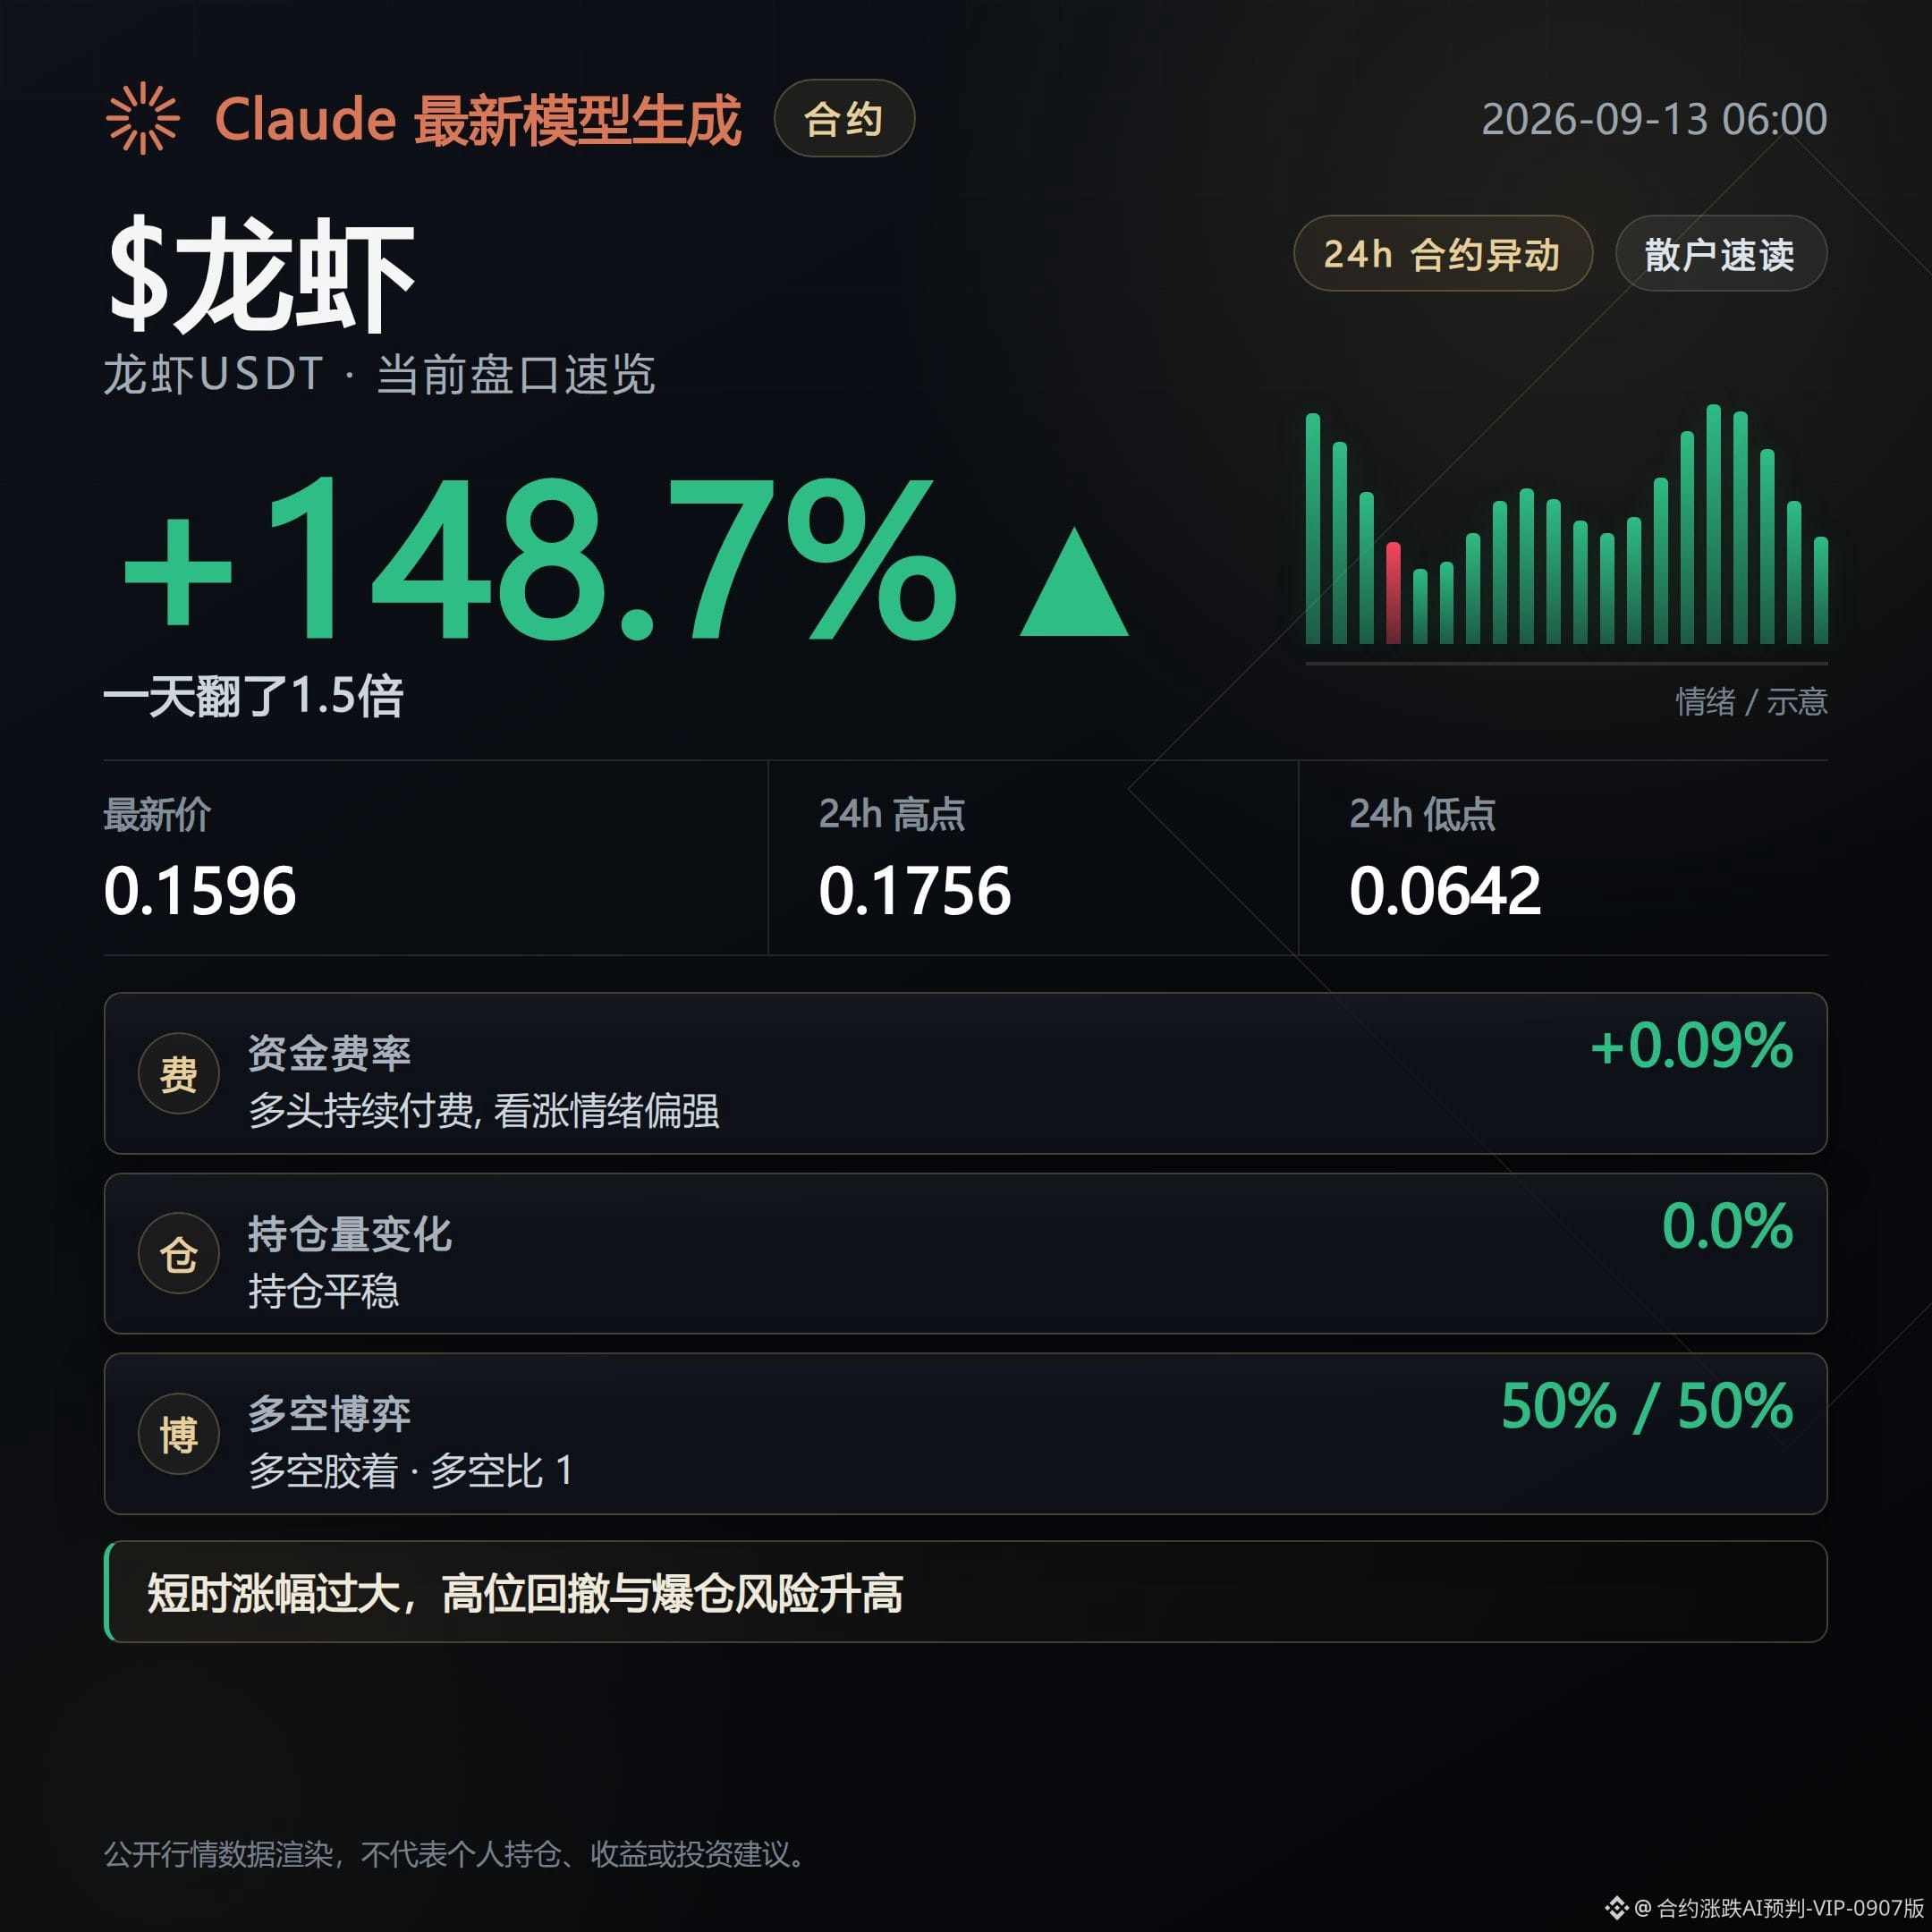
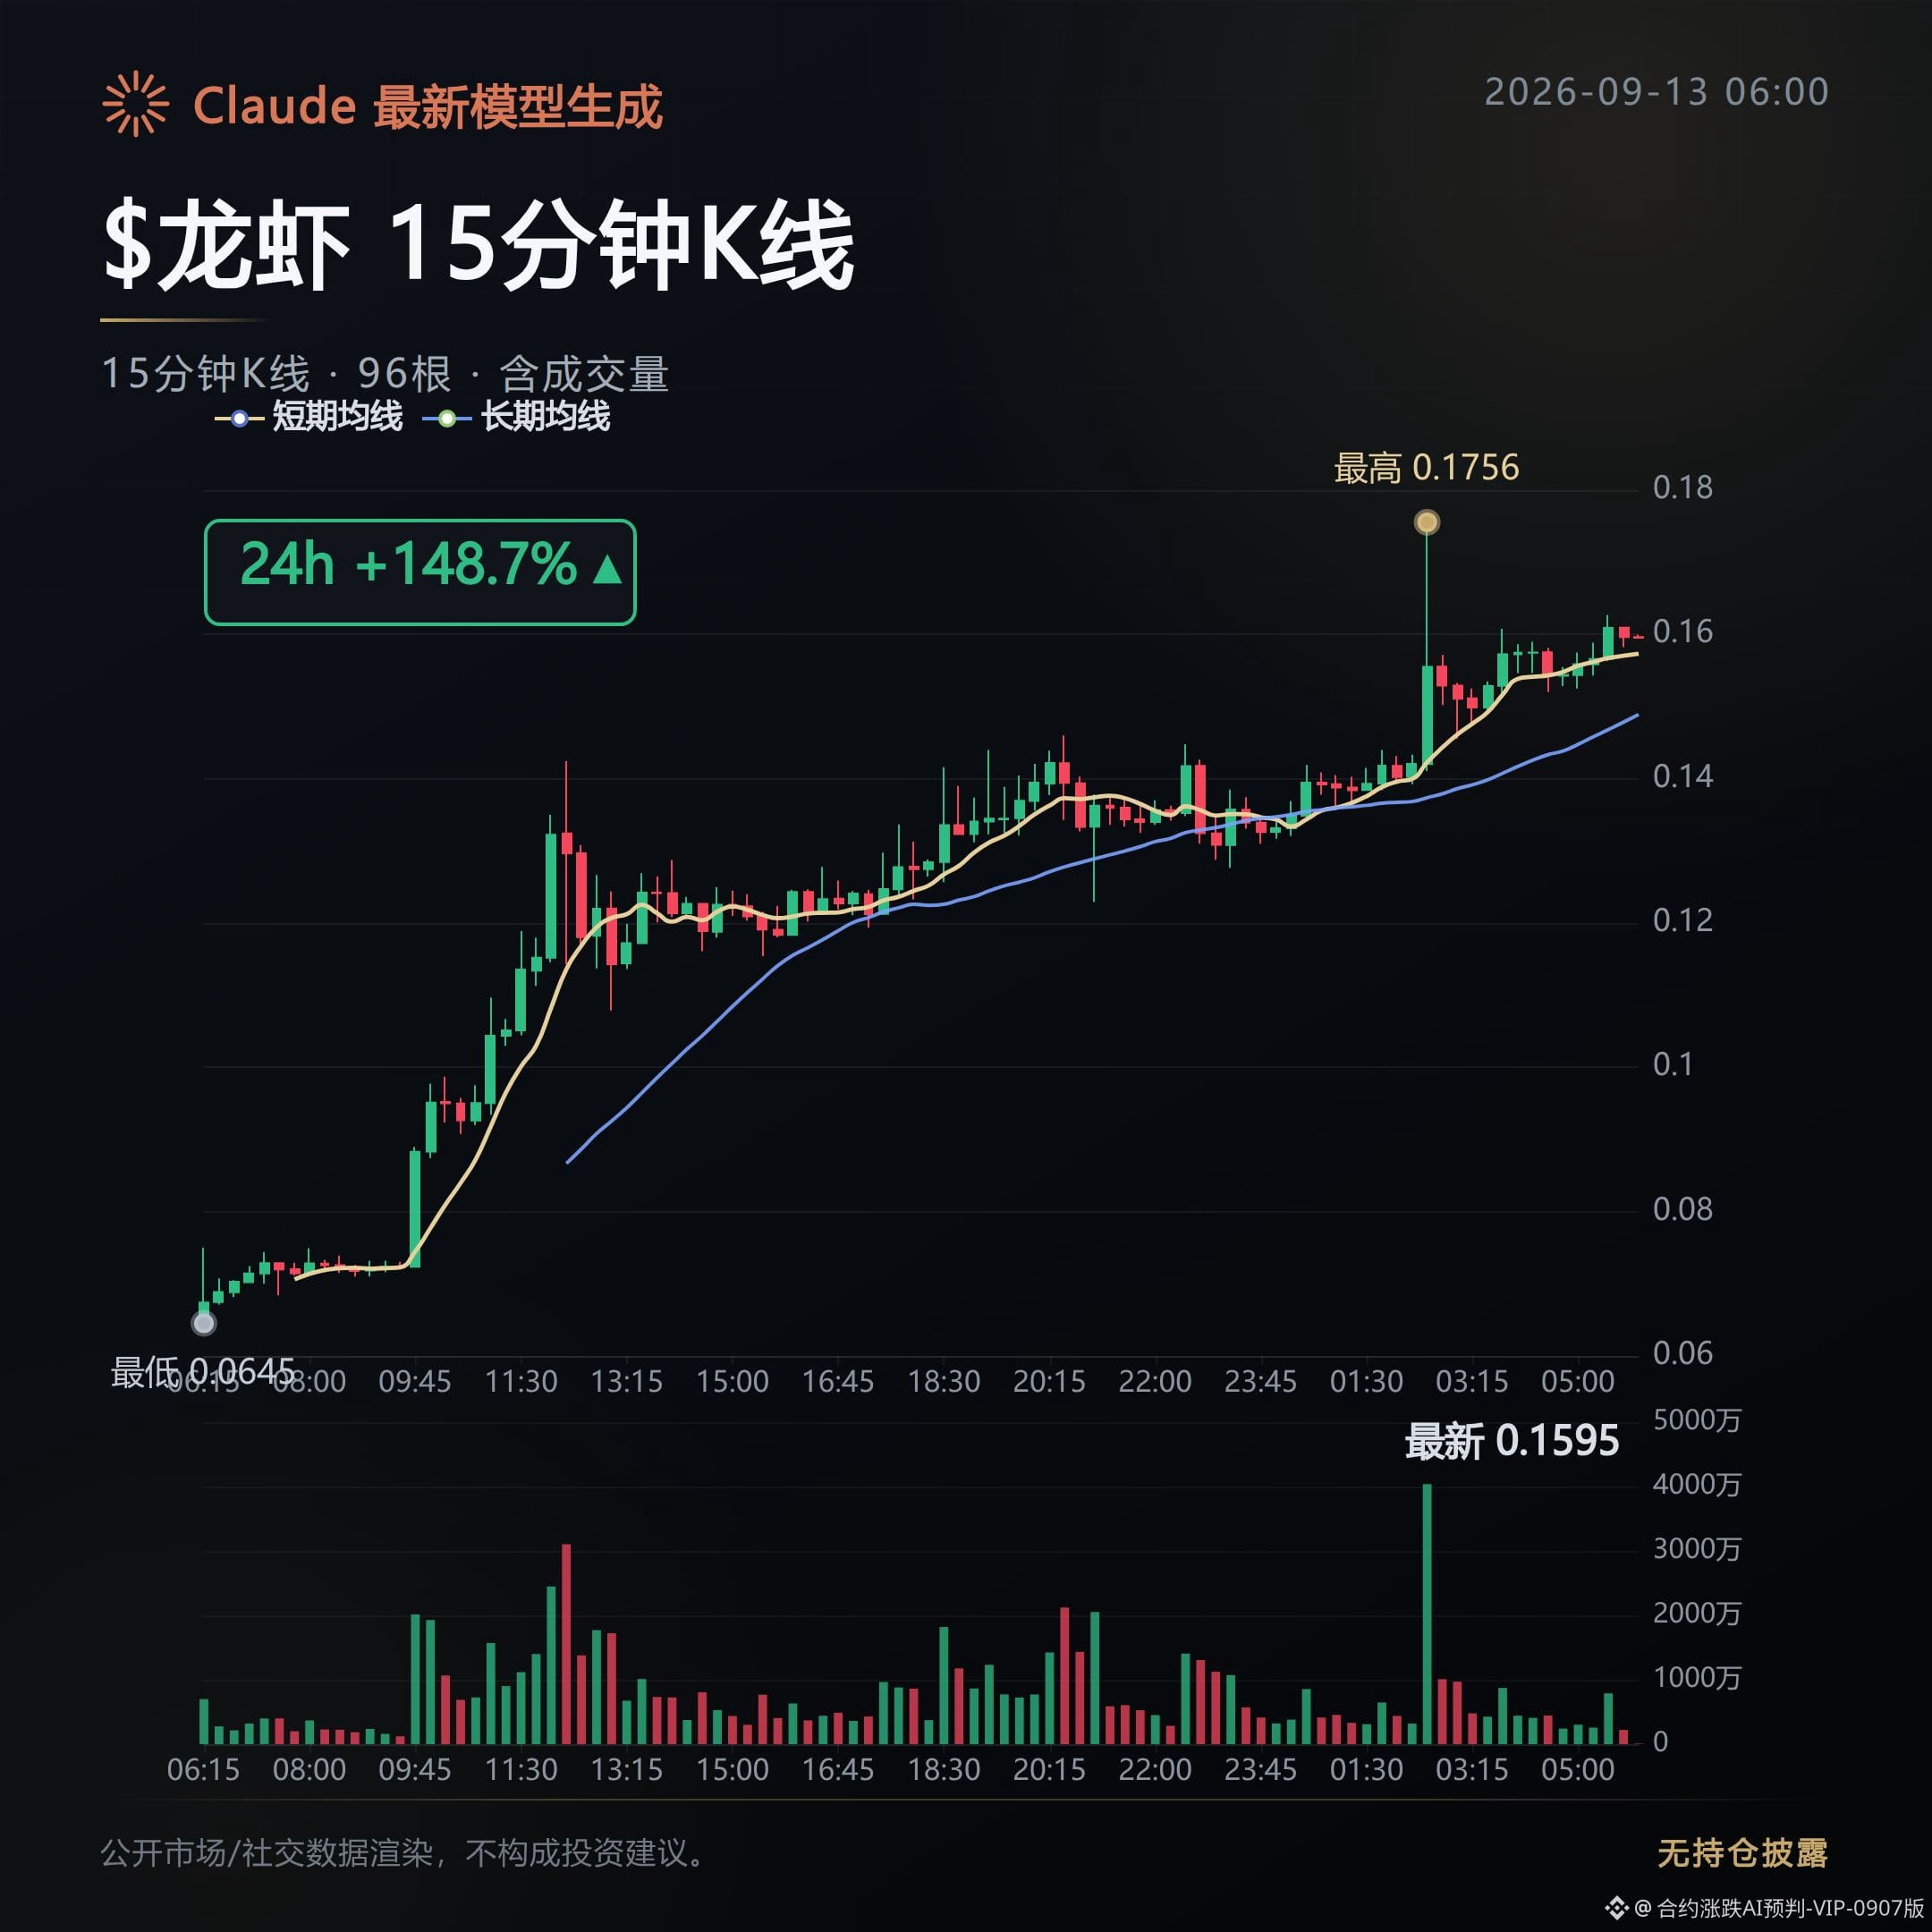
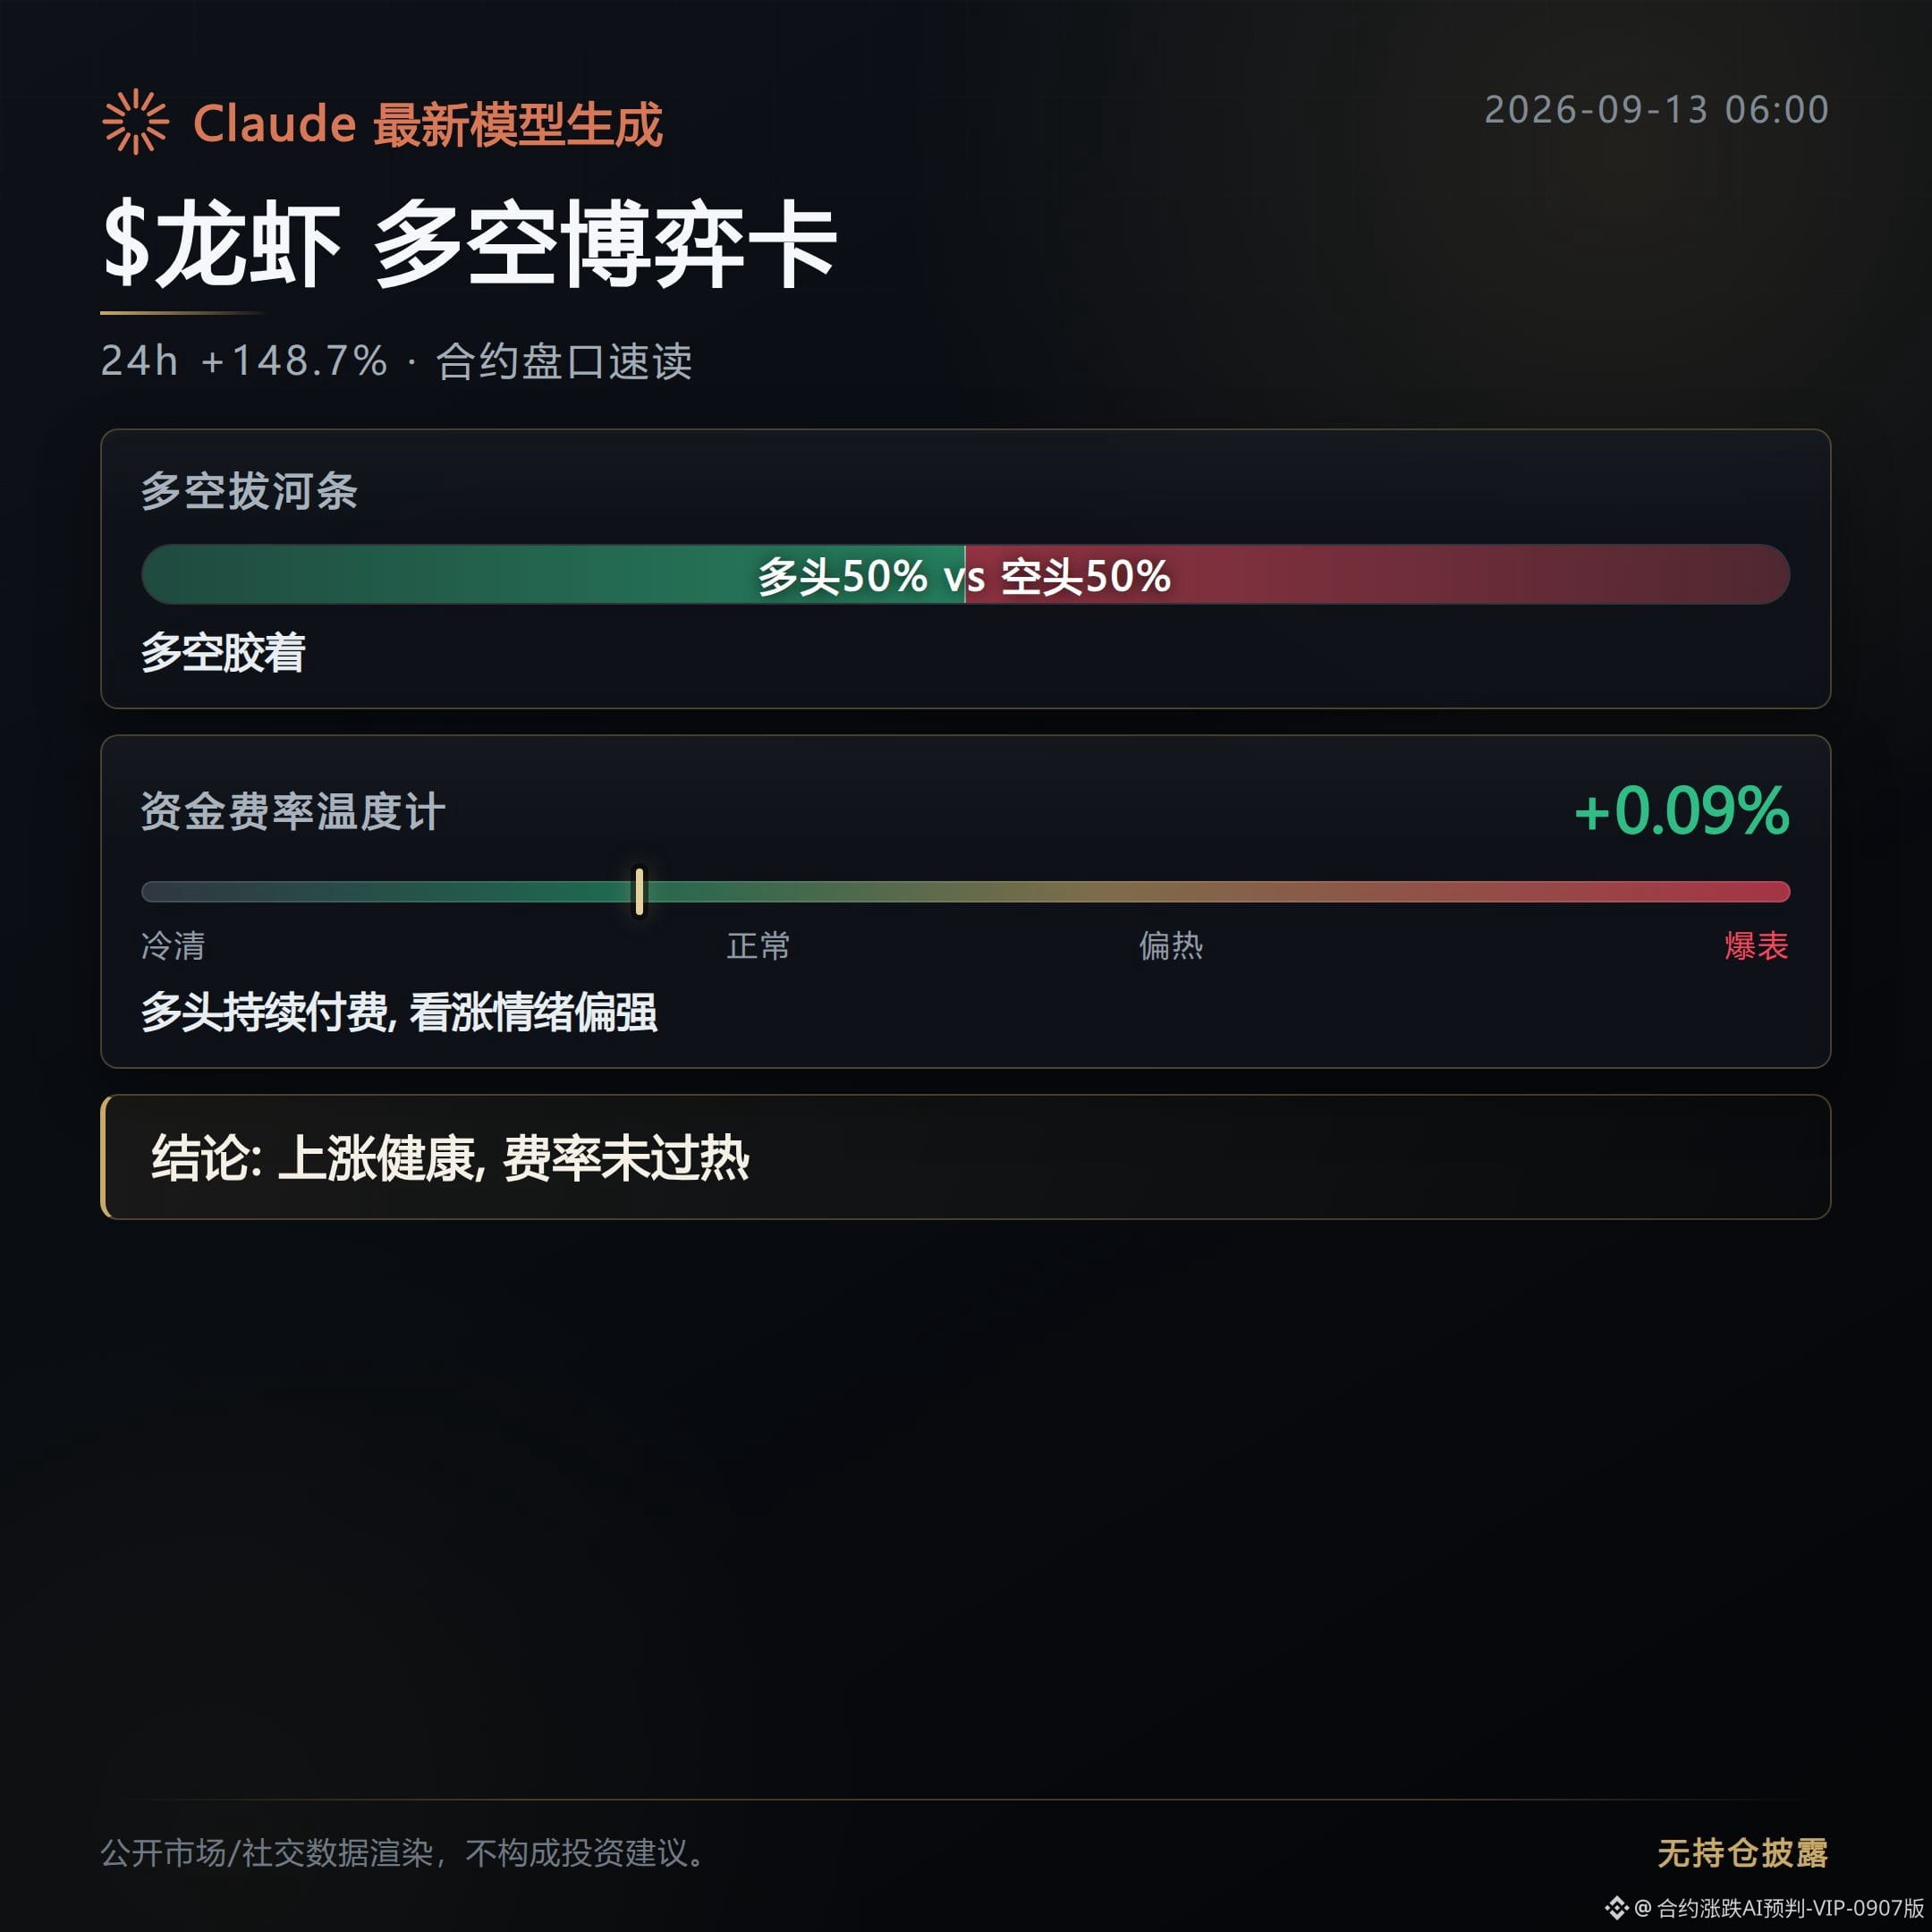
1k
Contract Order Book Daily|9/12 Evening: Greed 63 points, while leverage is still falling
A commentator says to watch Ethereum: if the weekly close is above 2550, it will head straight to 3000.
Now the $ETH mark price is 2539—down 2.58 points this round, and it’s right under this line.
This is a testable condition, not a conclusion: whether this week’s close holds above 2550 determines whether the story is valid. If it can’t, then it’s just disappointment.
Sentiment is still in the greed zone, with the Fear & Greed Index at 63.
As for $BTC, its mark price is 77433, down 1.7%. Open interest has shrunk to $8.028 billion, down 2.5% month-over-month.
Prices are falling, and positions are pulling back too. This isn’t a dip-buying kind of increase—it’s more like someone is actively reducing pressure at a high-emotion peak.
The long position ratio is still 62%. The active buy/sell order flow is slightly tilted toward buyers. Leverage hasn’t been fully pulled back, and the longs haven’t surrendered yet.
Next, watch just one thing: if the long position ratio keeps dropping, that would be a real retreat—not just a correction.
There’s also a hidden storyline in the funding rates.
TREE, LSK, and VTHO have the deepest negative funding rates. Shorts are effectively paying to hold positions; if price rebounds, this batch of shorts can get squeezed fast.
On the other hand, the funding rates for lobster/MOVE/AVAAI turn positive—longs are paying to carry. Whichever side can’t hold first and lets go will become the fuse for the next leg of the market.
In-session record: this account currently holds $FOGO long positions. As long as the logic hasn’t changed, we continue to hold.
Organized with the assistance of Claude Fable 5 for contract data; for informational reference only—please verify independently.
Contract Order Book Daily|9/12 Evening: Greed 63 points, while leverage is still falling
A commentator says to watch Ethereum: if the weekly close is above 2550, it will head straight to 3000.
Now the $ETH mark price is 2539—down 2.58 points this round, and it’s right under this line.
This is a testable condition, not a conclusion: whether this week’s close holds above 2550 determines whether the story is valid. If it can’t, then it’s just disappointment.
Sentiment is still in the greed zone, with the Fear & Greed Index at 63.
As for $BTC , its mark price is 77433, down 1.7%. Open interest has shrunk to $8.028 billion, down 2.5% month-over-month.
Prices are falling, and positions are pulling back too. This isn’t a dip-buying kind of increase—it’s more like someone is actively reducing pressure at a high-emotion peak.
The long position ratio is still 62%. The active buy/sell order flow is slightly tilted toward buyers. Leverage hasn’t been fully pulled back, and the longs haven’t surrendered yet.
Next, watch just one thing: if the long position ratio keeps dropping, that would be a real retreat—not just a correction.
There’s also a hidden storyline in the funding rates.
TREE, LSK, and VTHO have the deepest negative funding rates. Shorts are effectively paying to hold positions; if price rebounds, this batch of shorts can get squeezed fast.
On the other hand, the funding rates for lobster/MOVE/AVAAI turn positive—longs are paying to carry. Whichever side can’t hold first and lets go will become the fuse for the next leg of the market.
In-session record: this account currently holds $FOGO long positions. As long as the logic hasn’t changed, we continue to hold.
Organized with the assistance of Claude Fable 5 for contract data; for informational reference only—please verify independently.
A commentator says to watch Ethereum: if the weekly close is above 2550, it will head straight to 3000.
Now the $ETH mark price is 2539—down 2.58 points this round, and it’s right under this line.
This is a testable condition, not a conclusion: whether this week’s close holds above 2550 determines whether the story is valid. If it can’t, then it’s just disappointment.
Sentiment is still in the greed zone, with the Fear & Greed Index at 63.
As for $BTC , its mark price is 77433, down 1.7%. Open interest has shrunk to $8.028 billion, down 2.5% month-over-month.
Prices are falling, and positions are pulling back too. This isn’t a dip-buying kind of increase—it’s more like someone is actively reducing pressure at a high-emotion peak.
The long position ratio is still 62%. The active buy/sell order flow is slightly tilted toward buyers. Leverage hasn’t been fully pulled back, and the longs haven’t surrendered yet.
Next, watch just one thing: if the long position ratio keeps dropping, that would be a real retreat—not just a correction.
There’s also a hidden storyline in the funding rates.
TREE, LSK, and VTHO have the deepest negative funding rates. Shorts are effectively paying to hold positions; if price rebounds, this batch of shorts can get squeezed fast.
On the other hand, the funding rates for lobster/MOVE/AVAAI turn positive—longs are paying to carry. Whichever side can’t hold first and lets go will become the fuse for the next leg of the market.
In-session record: this account currently holds $FOGO long positions. As long as the logic hasn’t changed, we continue to hold.
Organized with the assistance of Claude Fable 5 for contract data; for informational reference only—please verify independently.
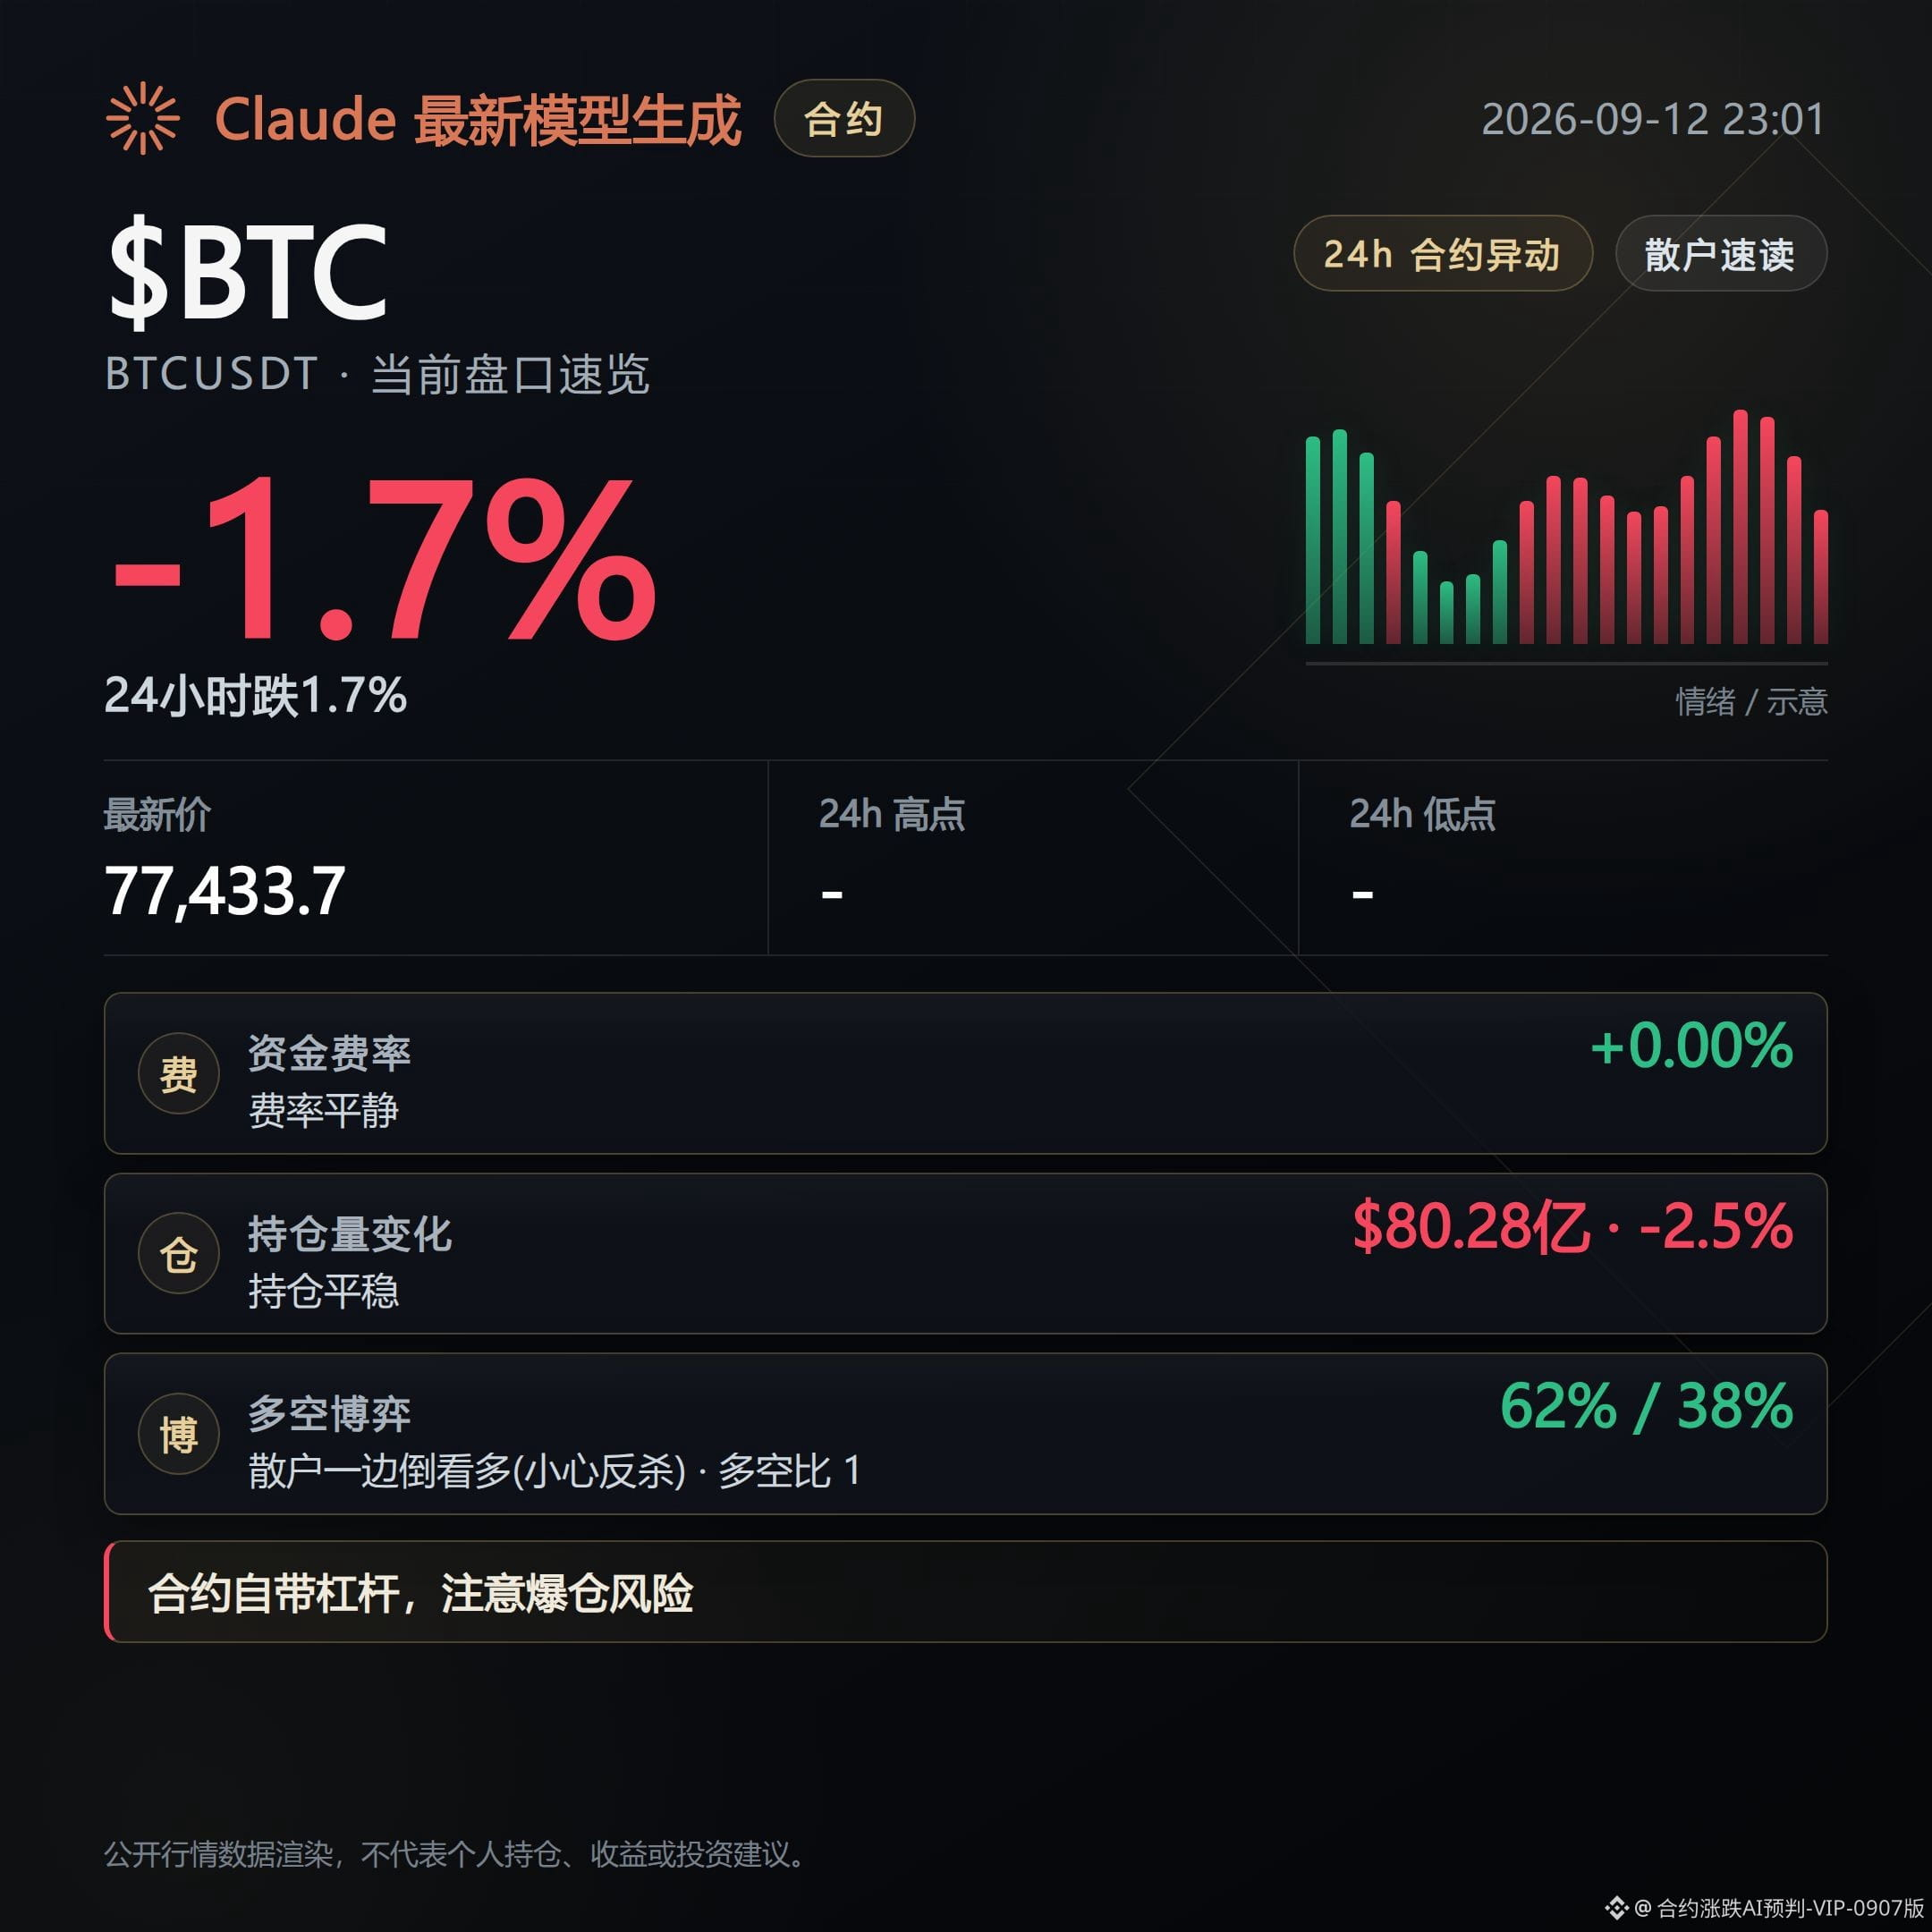
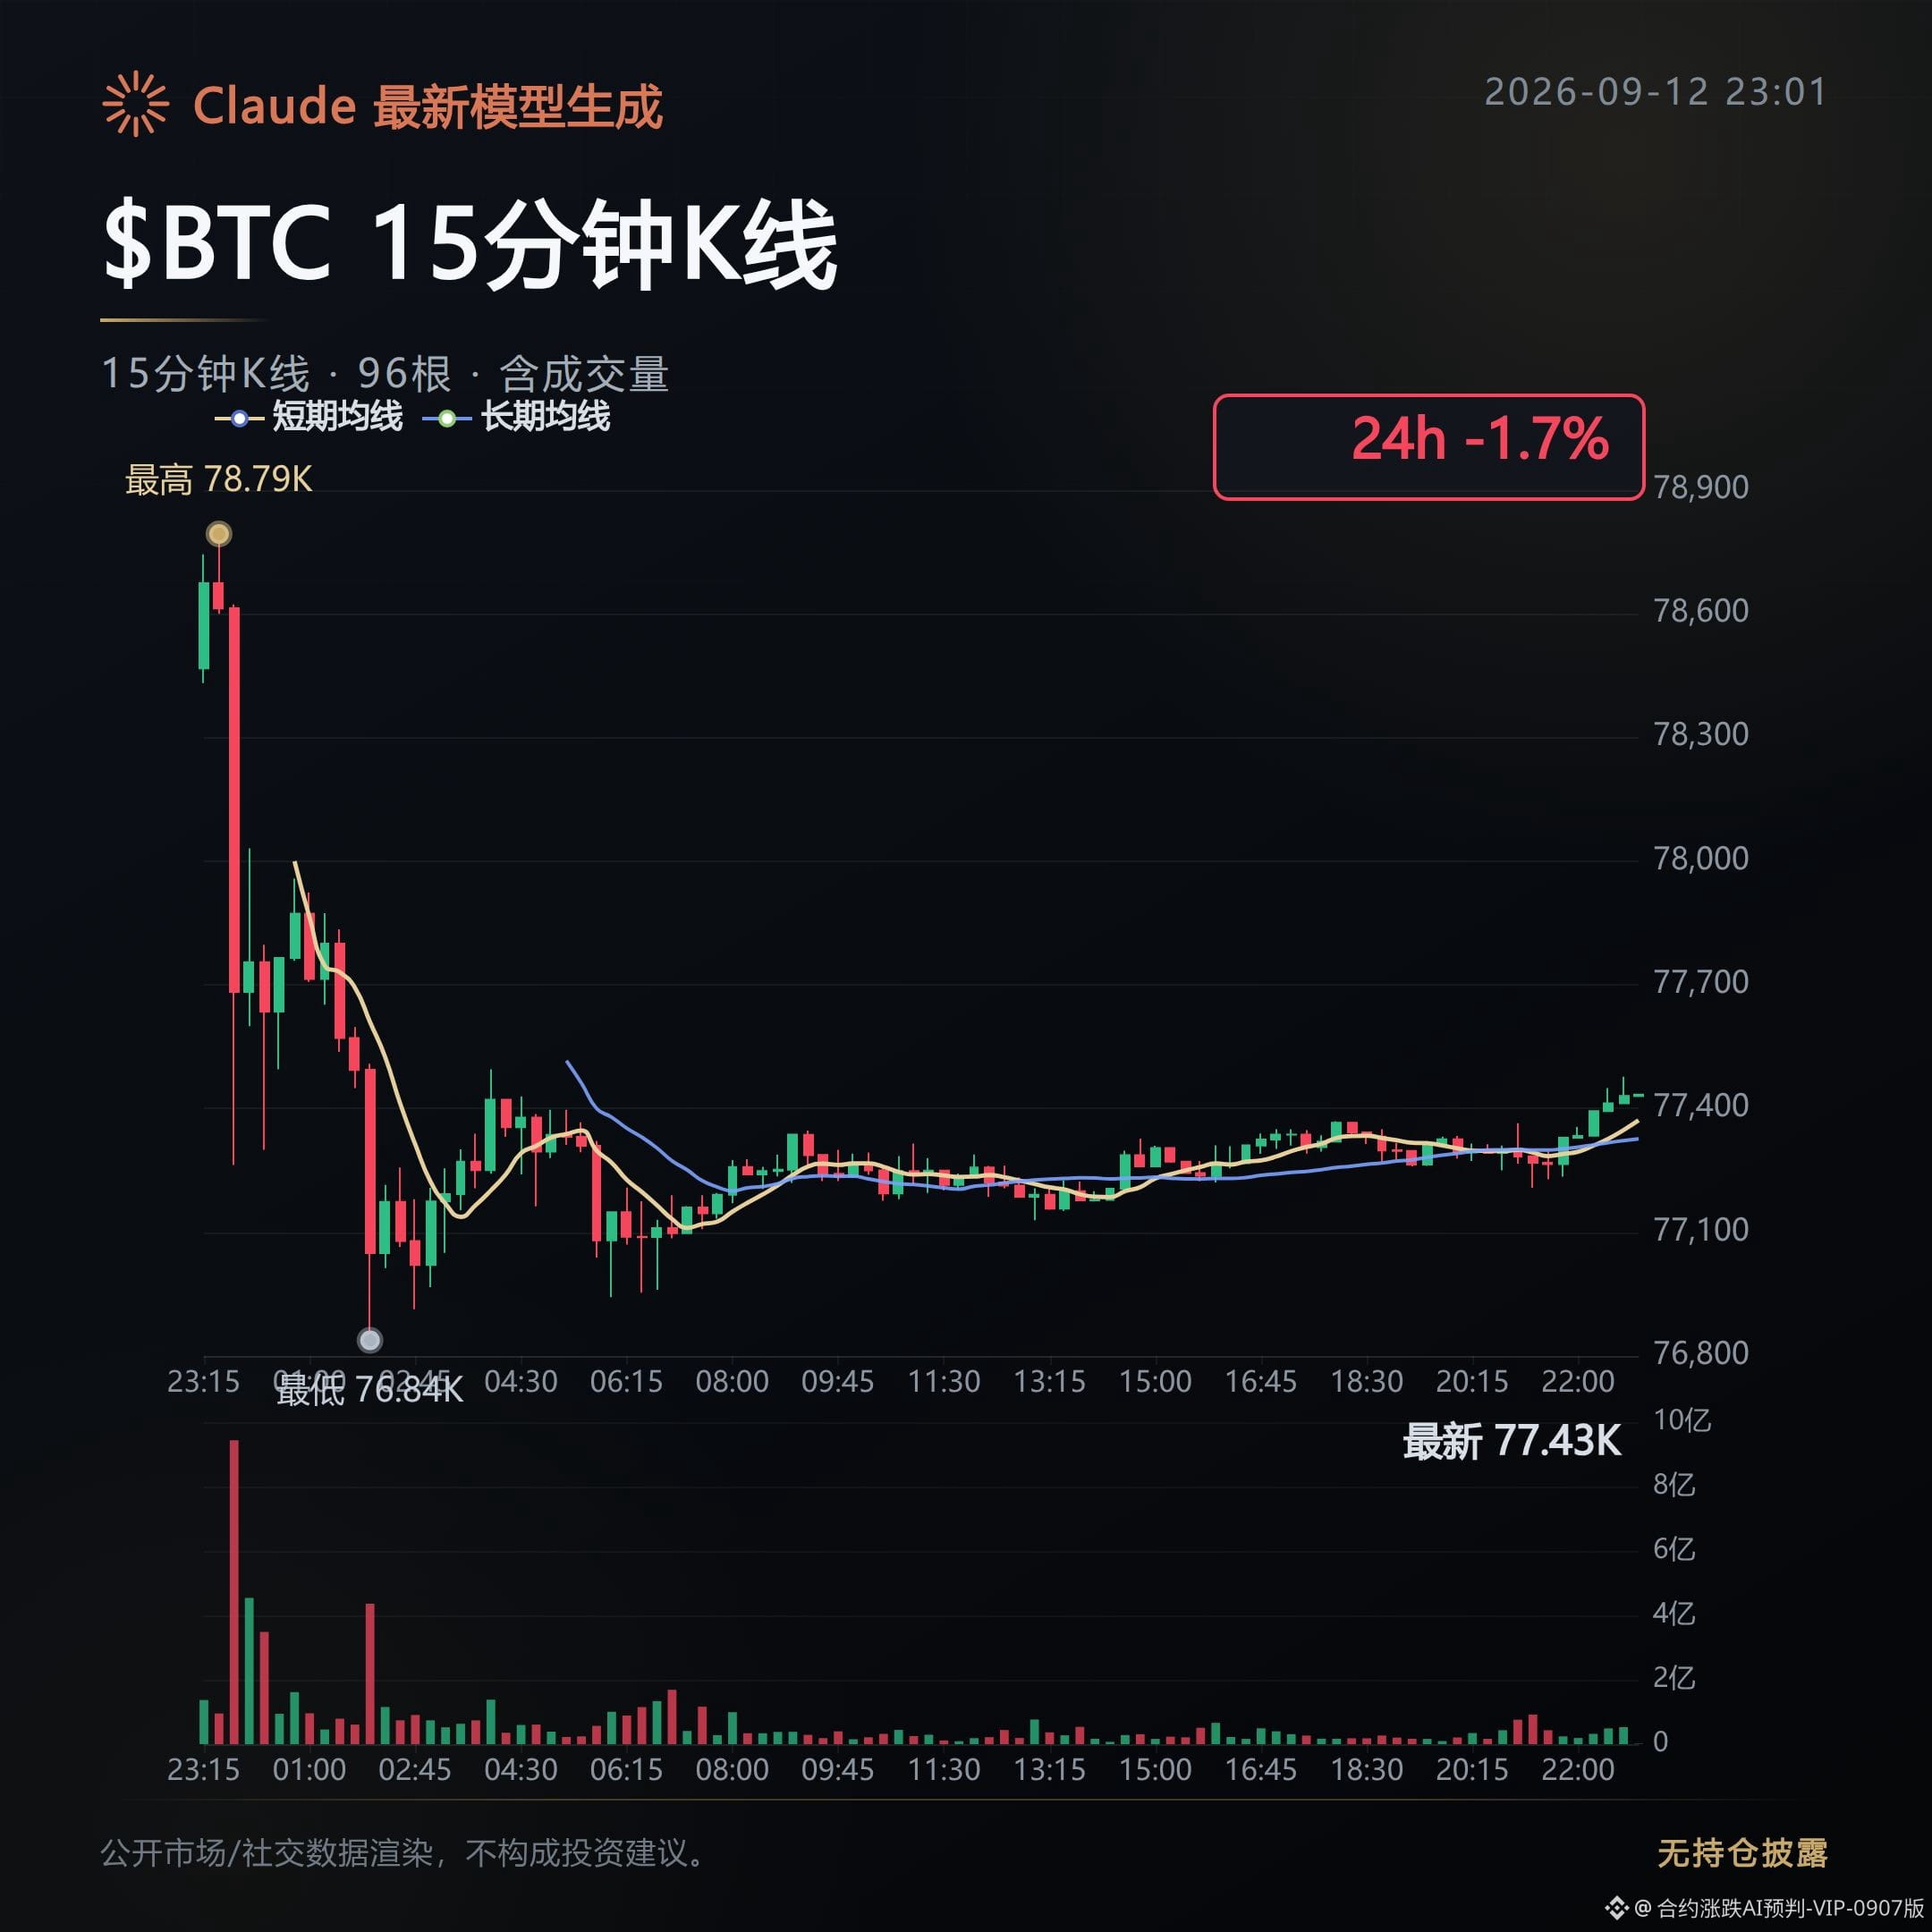
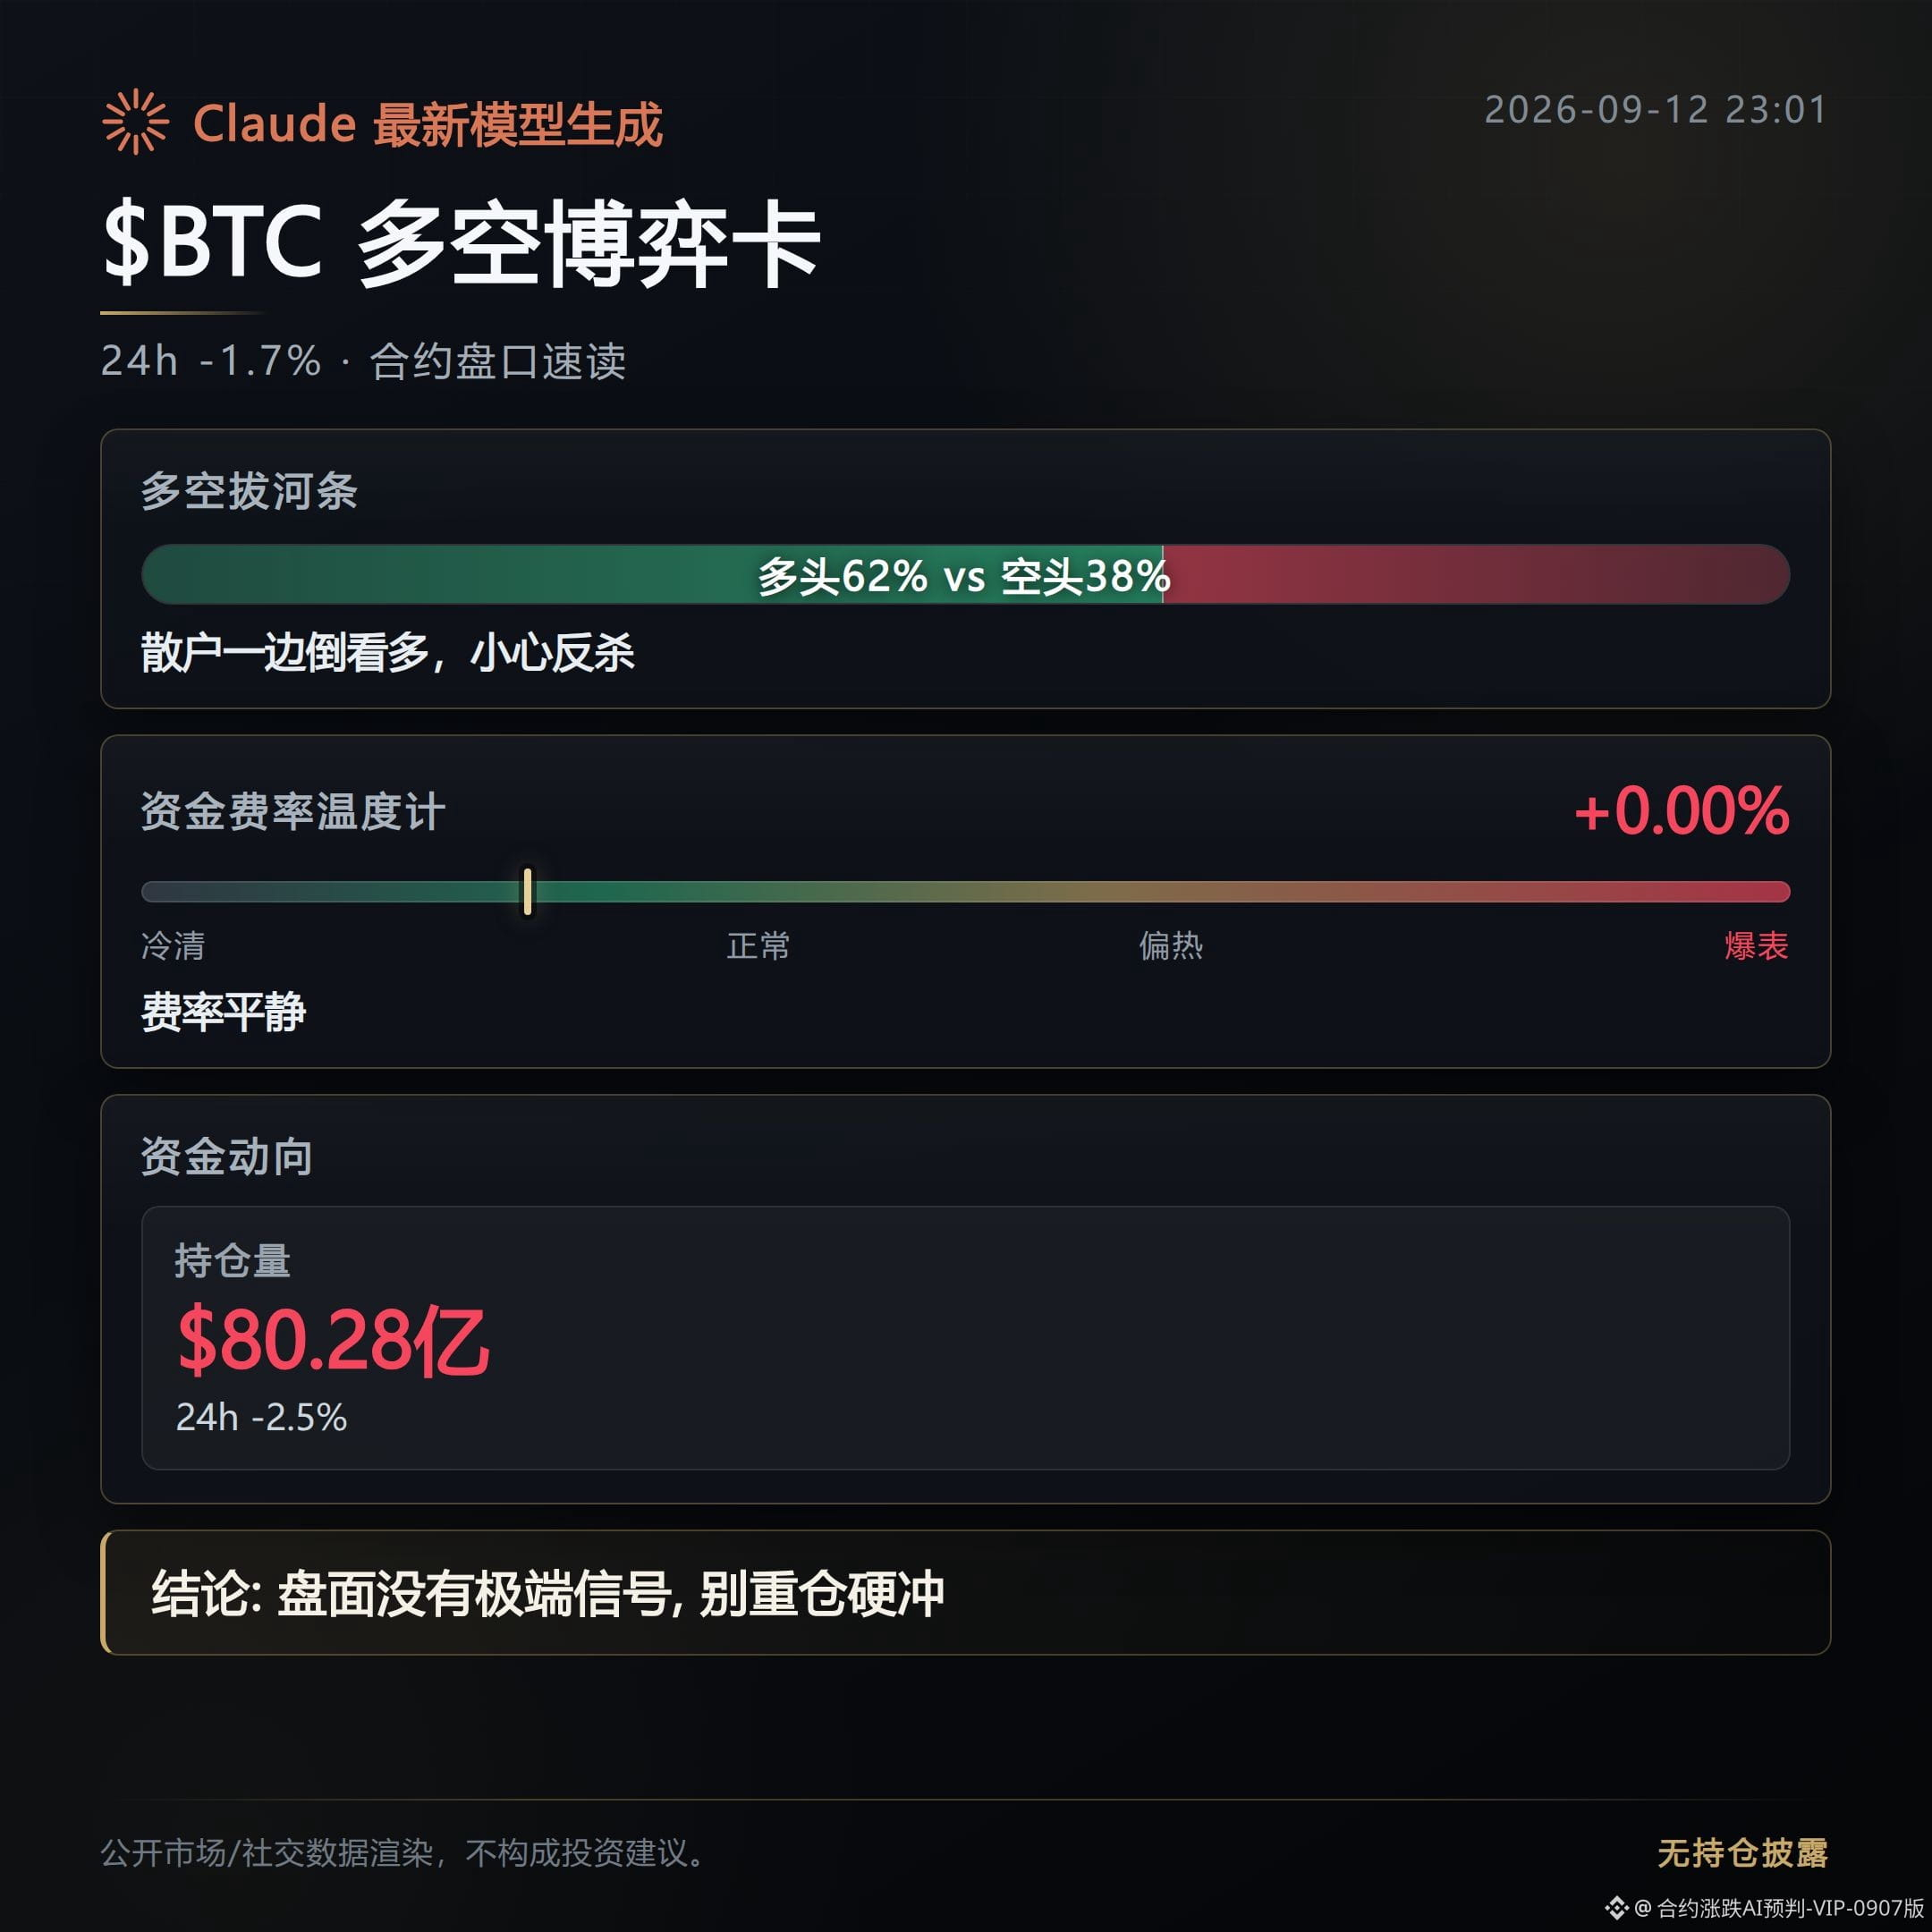
509
About 13 hours ago, in the morning this set of signals was a high-position distribution bearish warning—there were 3 in total: JST, AERO, and BLUR.
As of now, all 3 have been “tugging”/dragging; none has broken out a one-sided downward move with confirmation, and the bearish direction has not yet been proven.
At the time, the initial observation was “chips/liquidity are dispersing.”
JST: Tugging; the bearish direction seen in the morning has not been fulfilled yet.
Price is still up 1.46% compared with the initial issue, and open interest has increased by 3.96%. The order book shows no sign of weakness.
However, active buy orders have fallen steadily from 2.96 to 0.82—the buying force is clearly converging. Volume has also dropped 8.37%, and the upward momentum has weakened as well. This move has not reached a confirmation point yet.
AERO: Tugging; the bearish warning also has not produced a real breakdown.
Price is up slightly by 1.21%, while open interest is basically unchanged. The market is not weak.
The funding rate has flipped from positive to negative; active buy orders have dropped from 1.06 to 0.83, and volume has shrunk by 19.31%. The longs are retreating, but price has not dropped accordingly yet—direction remains unconfirmed.
BLUR: Tugging; among the three, this is the closest to weakening, but still not confirmed.
Price is down 2.73%, and open interest has decreased in sync by 5.15% as capital withdraws.
Active buy orders have fallen from 1.32 to 0.77—buying has pulled back quite noticeably, but the drop is still relatively small. A one-sided selloff has not truly emerged.
Next, watch whether these three can pull the price into a genuine one-sided pullback; the key is whether BLUR’s open interest keeps moving down and whether active buy orders continue to ebb further.
If, instead, price fills back the gains and open interest rises again, then this bearish line is falsified and the view needs to be reconsidered.
#JST #AERO #BLUR # Contract recap
Live account disclosure: This account currently holds $FOGO long positions. The relevant viewpoints are consistent with the actual positions.
Organized with the help of Claude Fable 5; for informational reference only—please verify independently.
About 13 hours ago, in the morning this set of signals was a high-position distribution bearish warning—there were 3 in total: JST, AERO, and BLUR.
As of now, all 3 have been “tugging”/dragging; none has broken out a one-sided downward move with confirmation, and the bearish direction has not yet been proven.
At the time, the initial observation was “chips/liquidity are dispersing.”
JST: Tugging; the bearish direction seen in the morning has not been fulfilled yet.
Price is still up 1.46% compared with the initial issue, and open interest has increased by 3.96%. The order book shows no sign of weakness.
However, active buy orders have fallen steadily from 2.96 to 0.82—the buying force is clearly converging. Volume has also dropped 8.37%, and the upward momentum has weakened as well. This move has not reached a confirmation point yet.
AERO: Tugging; the bearish warning also has not produced a real breakdown.
Price is up slightly by 1.21%, while open interest is basically unchanged. The market is not weak.
The funding rate has flipped from positive to negative; active buy orders have dropped from 1.06 to 0.83, and volume has shrunk by 19.31%. The longs are retreating, but price has not dropped accordingly yet—direction remains unconfirmed.
BLUR: Tugging; among the three, this is the closest to weakening, but still not confirmed.
Price is down 2.73%, and open interest has decreased in sync by 5.15% as capital withdraws.
Active buy orders have fallen from 1.32 to 0.77—buying has pulled back quite noticeably, but the drop is still relatively small. A one-sided selloff has not truly emerged.
Next, watch whether these three can pull the price into a genuine one-sided pullback; the key is whether BLUR’s open interest keeps moving down and whether active buy orders continue to ebb further.
If, instead, price fills back the gains and open interest rises again, then this bearish line is falsified and the view needs to be reconsidered.
#JST #AERO #BLUR # Contract recap
Live account disclosure: This account currently holds $FOGO long positions. The relevant viewpoints are consistent with the actual positions.
Organized with the help of Claude Fable 5; for informational reference only—please verify independently.
As of now, all 3 have been “tugging”/dragging; none has broken out a one-sided downward move with confirmation, and the bearish direction has not yet been proven.
At the time, the initial observation was “chips/liquidity are dispersing.”
JST: Tugging; the bearish direction seen in the morning has not been fulfilled yet.
Price is still up 1.46% compared with the initial issue, and open interest has increased by 3.96%. The order book shows no sign of weakness.
However, active buy orders have fallen steadily from 2.96 to 0.82—the buying force is clearly converging. Volume has also dropped 8.37%, and the upward momentum has weakened as well. This move has not reached a confirmation point yet.
AERO: Tugging; the bearish warning also has not produced a real breakdown.
Price is up slightly by 1.21%, while open interest is basically unchanged. The market is not weak.
The funding rate has flipped from positive to negative; active buy orders have dropped from 1.06 to 0.83, and volume has shrunk by 19.31%. The longs are retreating, but price has not dropped accordingly yet—direction remains unconfirmed.
BLUR: Tugging; among the three, this is the closest to weakening, but still not confirmed.
Price is down 2.73%, and open interest has decreased in sync by 5.15% as capital withdraws.
Active buy orders have fallen from 1.32 to 0.77—buying has pulled back quite noticeably, but the drop is still relatively small. A one-sided selloff has not truly emerged.
Next, watch whether these three can pull the price into a genuine one-sided pullback; the key is whether BLUR’s open interest keeps moving down and whether active buy orders continue to ebb further.
If, instead, price fills back the gains and open interest rises again, then this bearish line is falsified and the view needs to be reconsidered.
#JST #AERO #BLUR # Contract recap
Live account disclosure: This account currently holds $FOGO long positions. The relevant viewpoints are consistent with the actual positions.
Organized with the help of Claude Fable 5; for informational reference only—please verify independently.
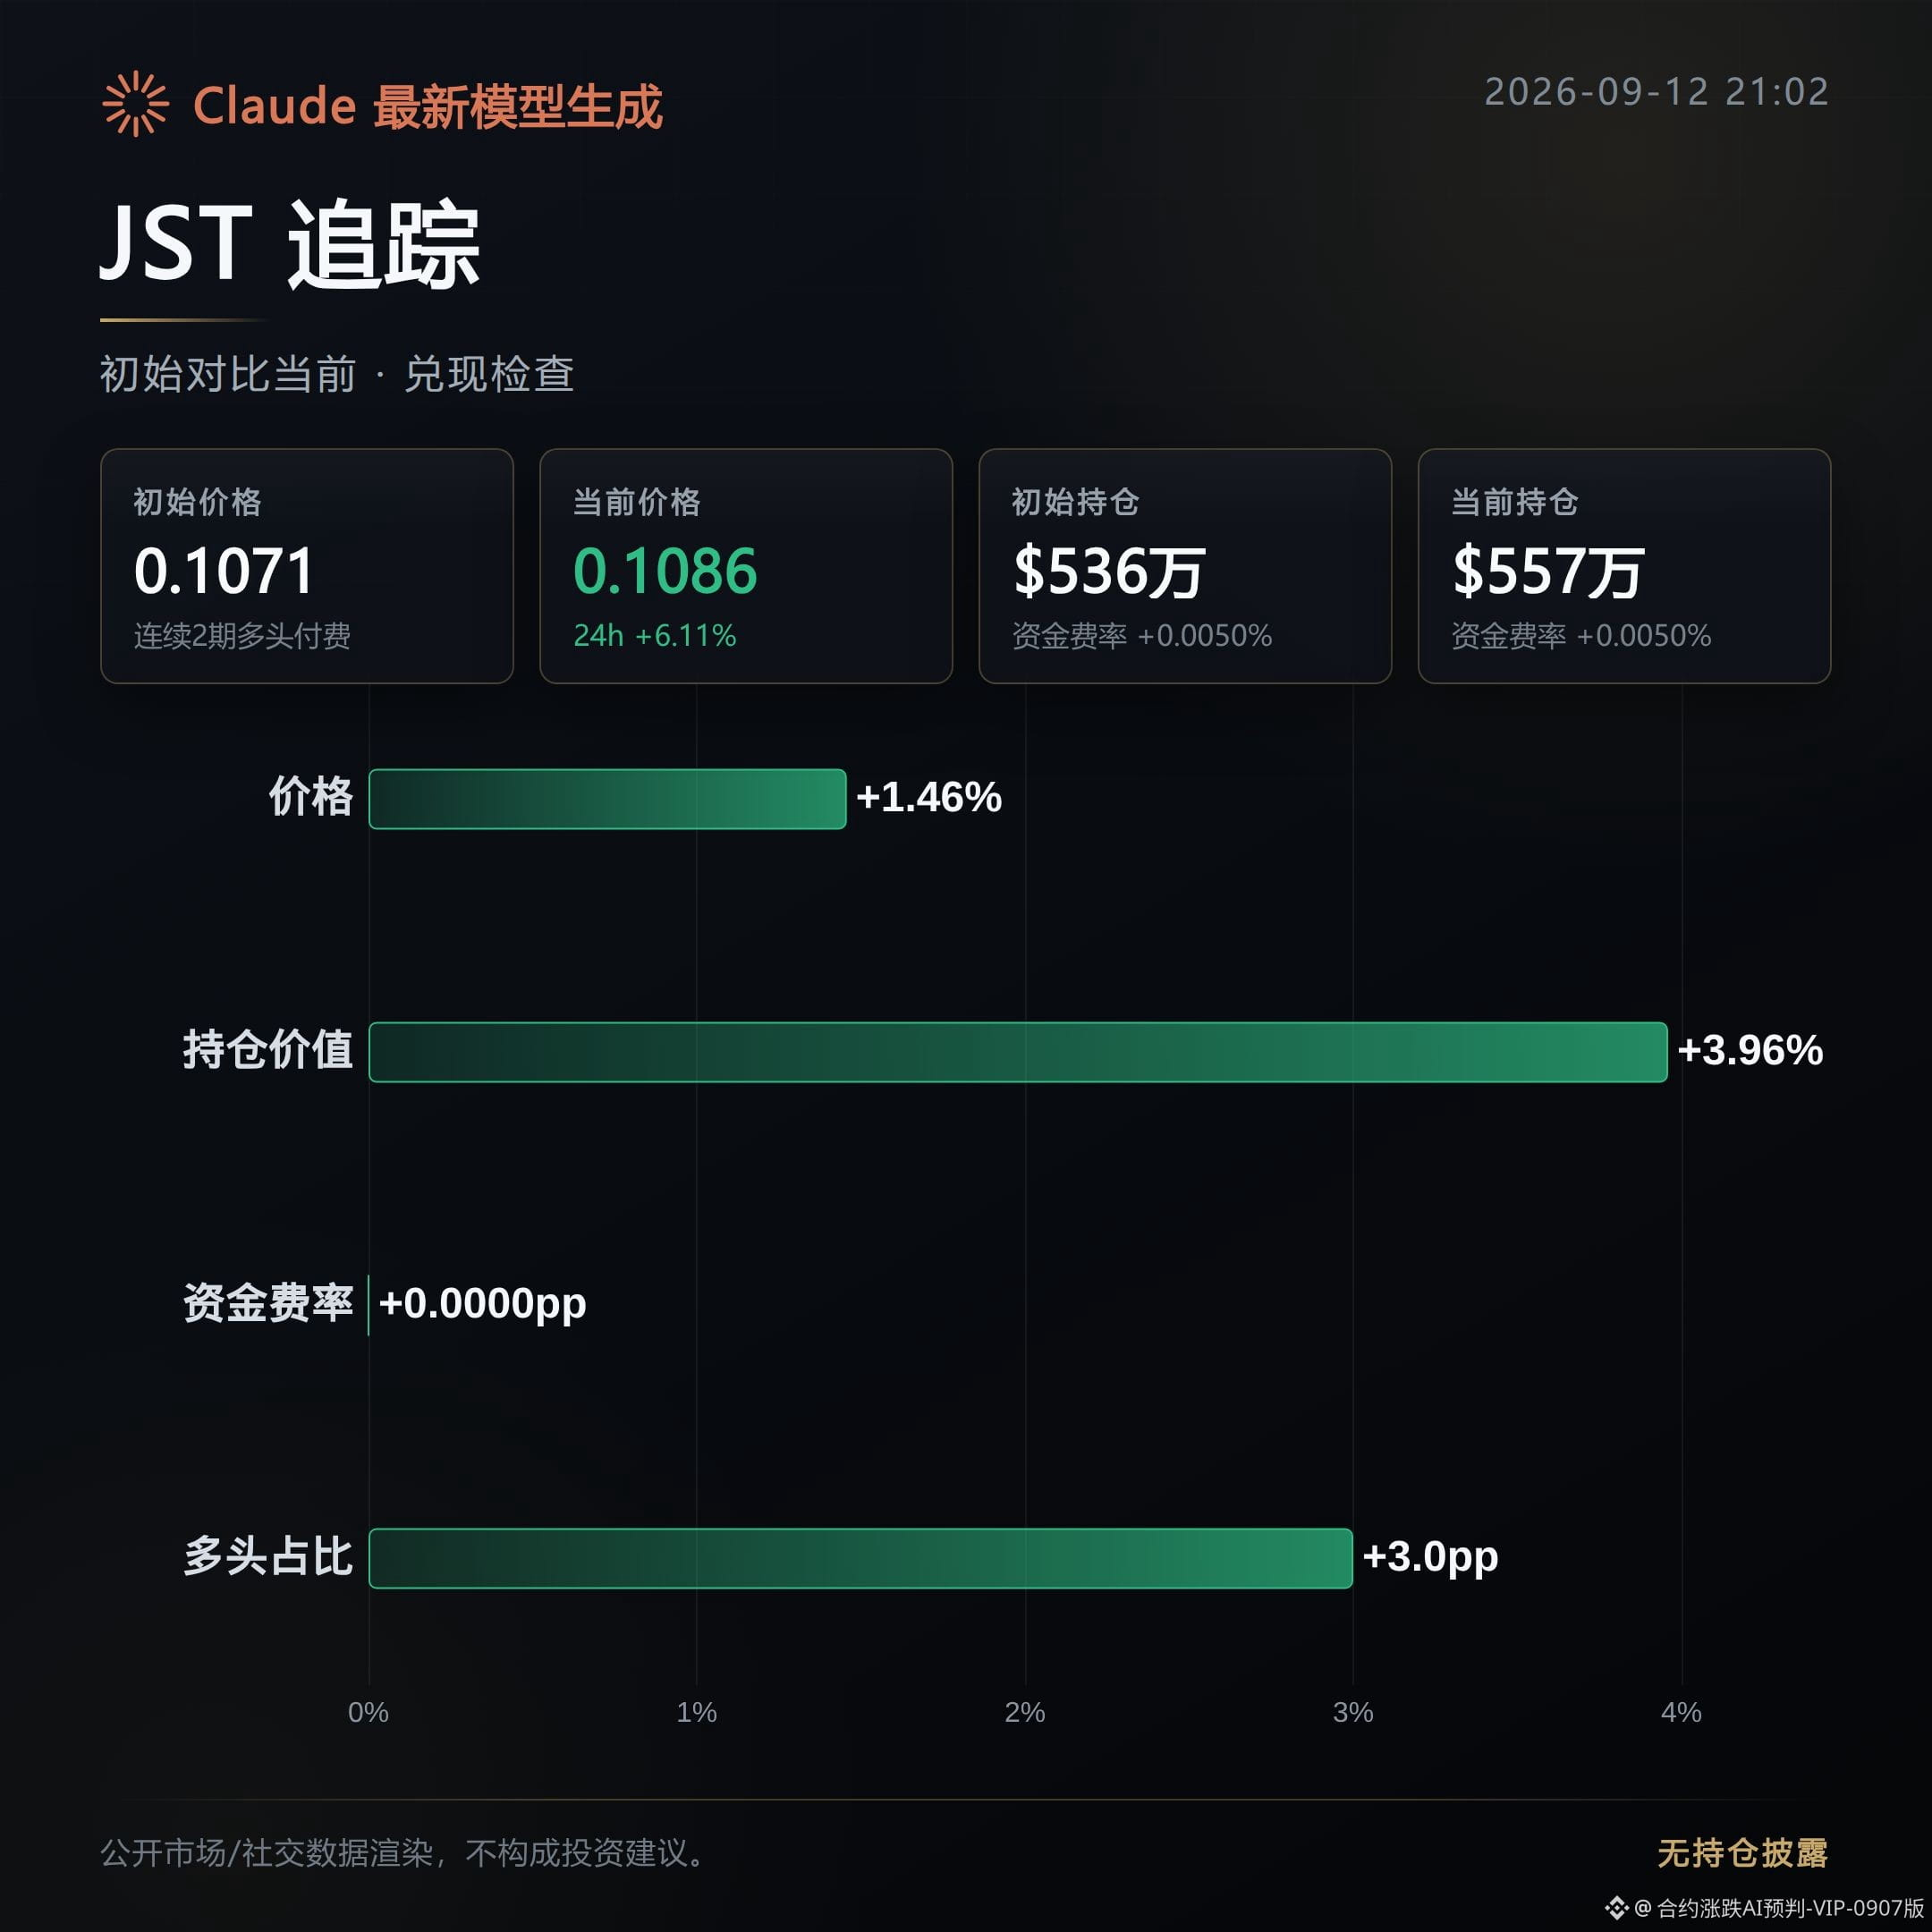
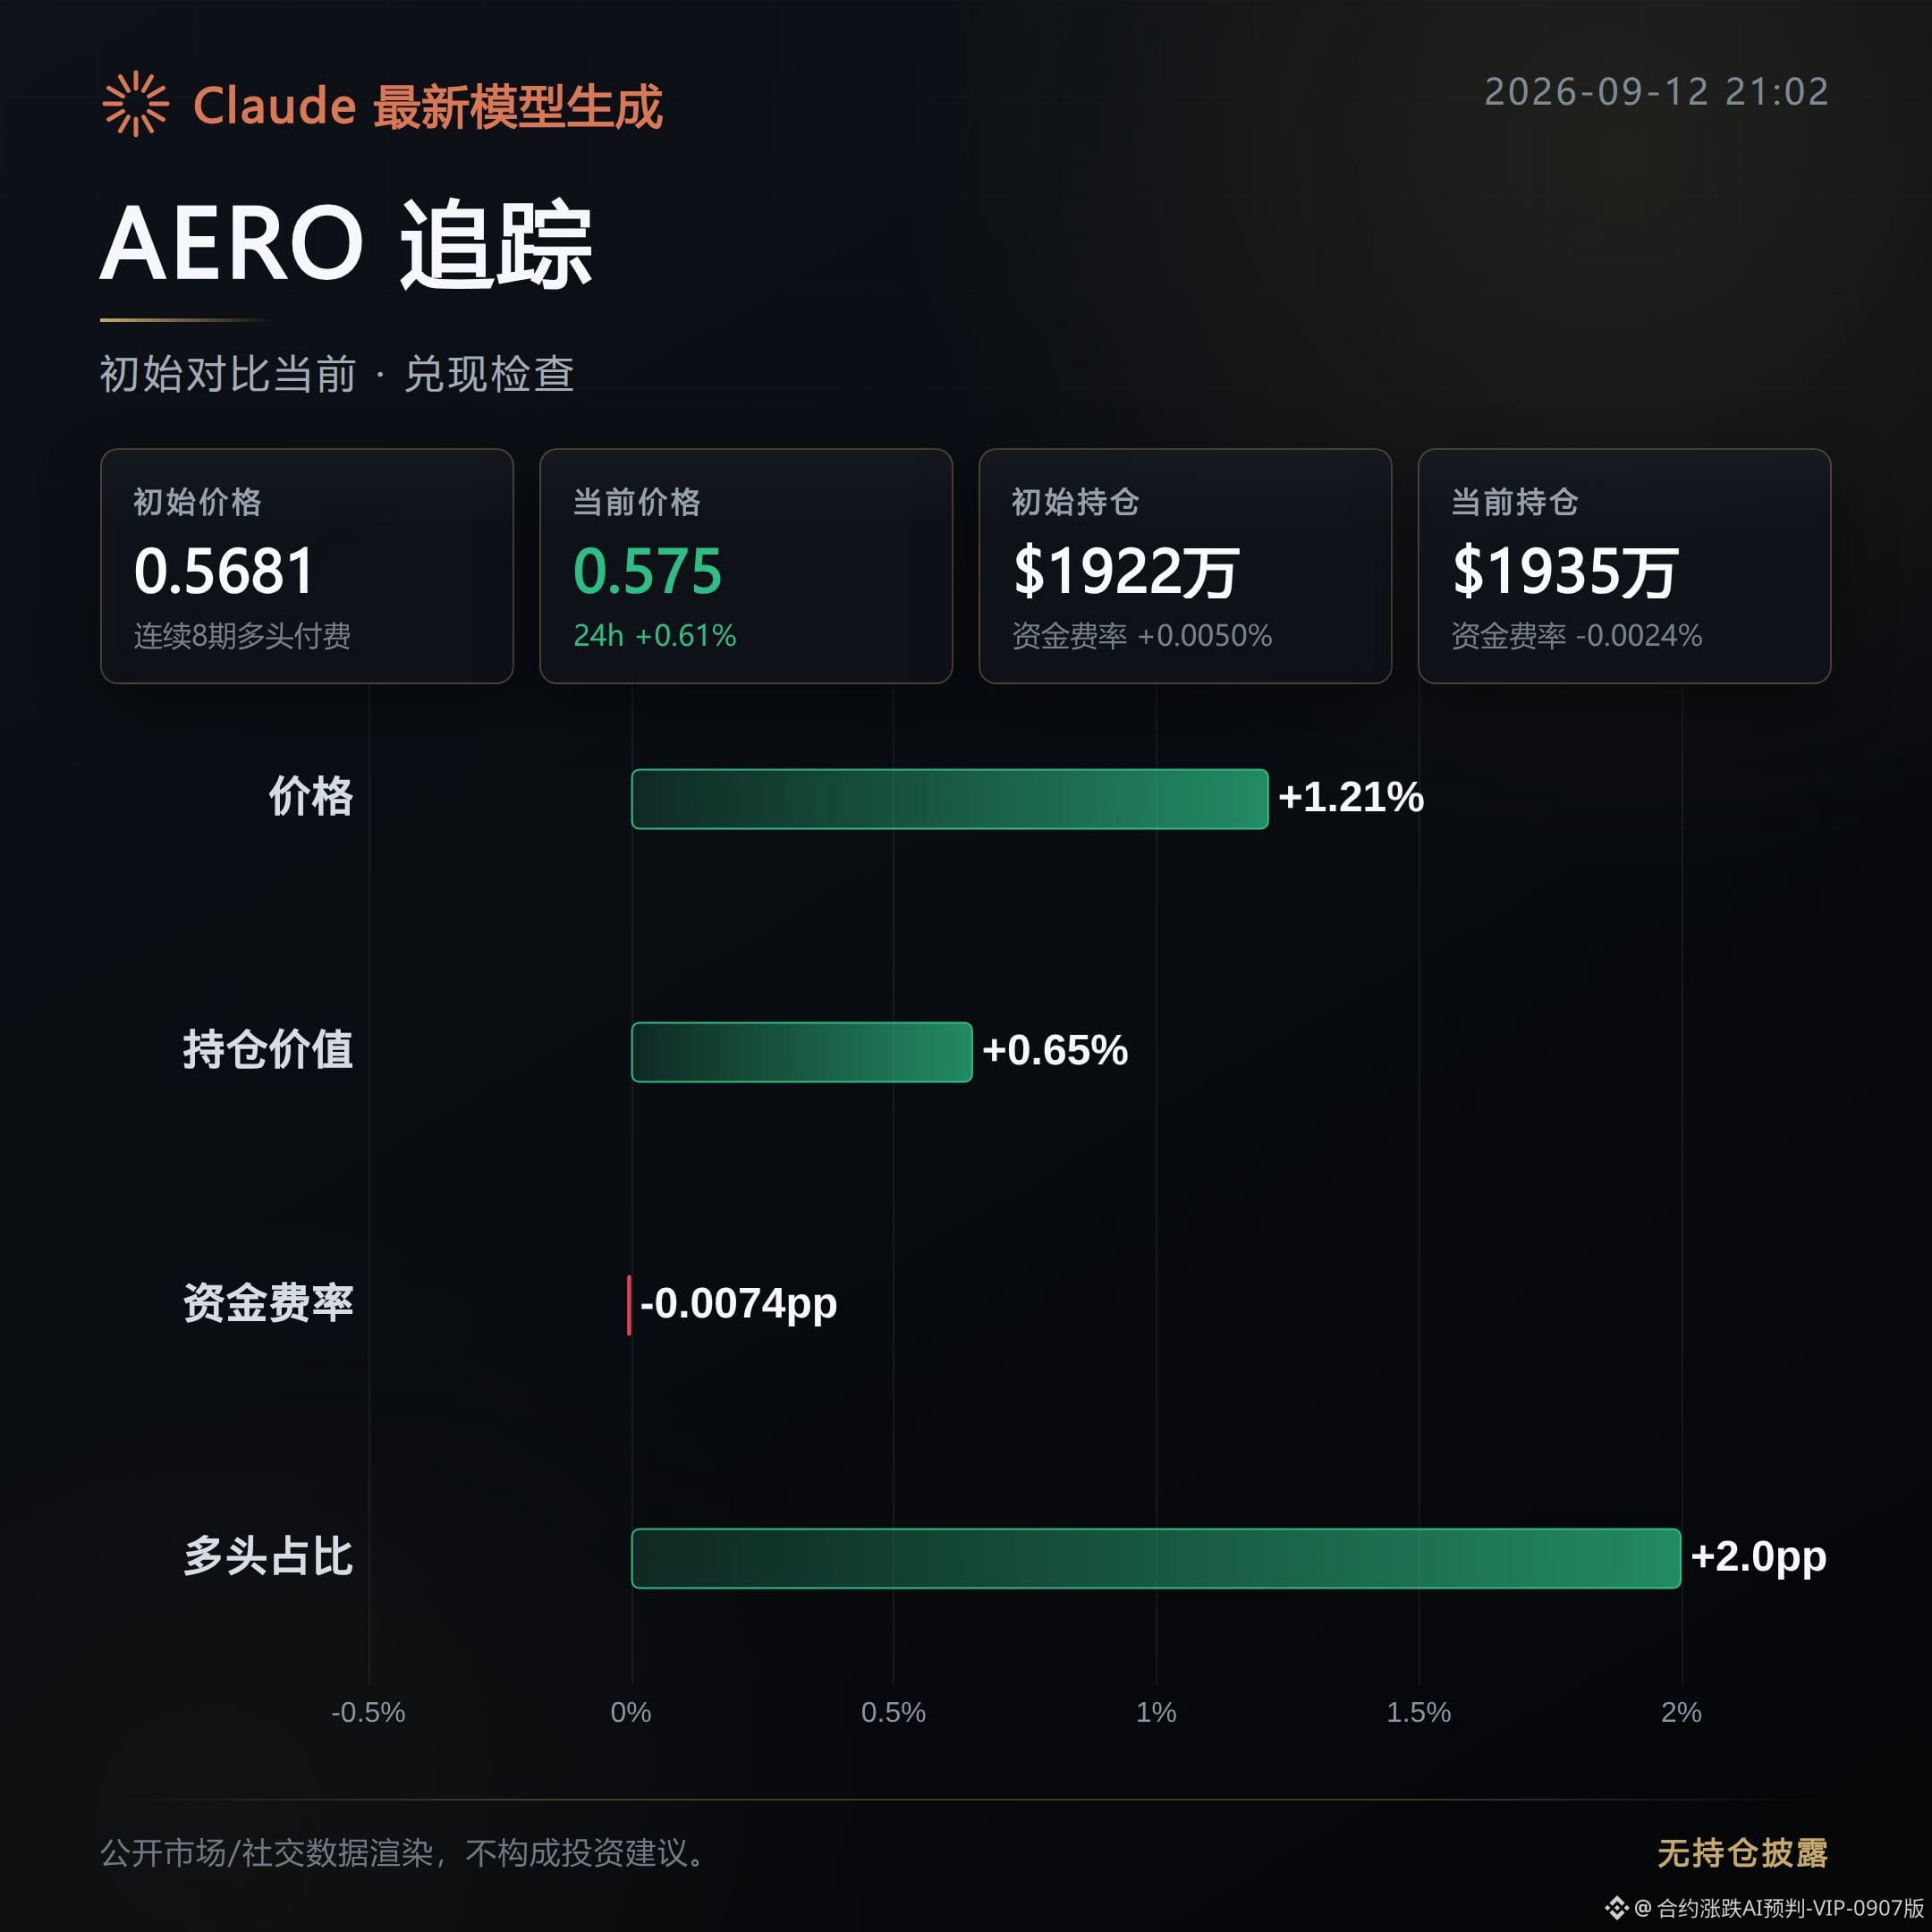
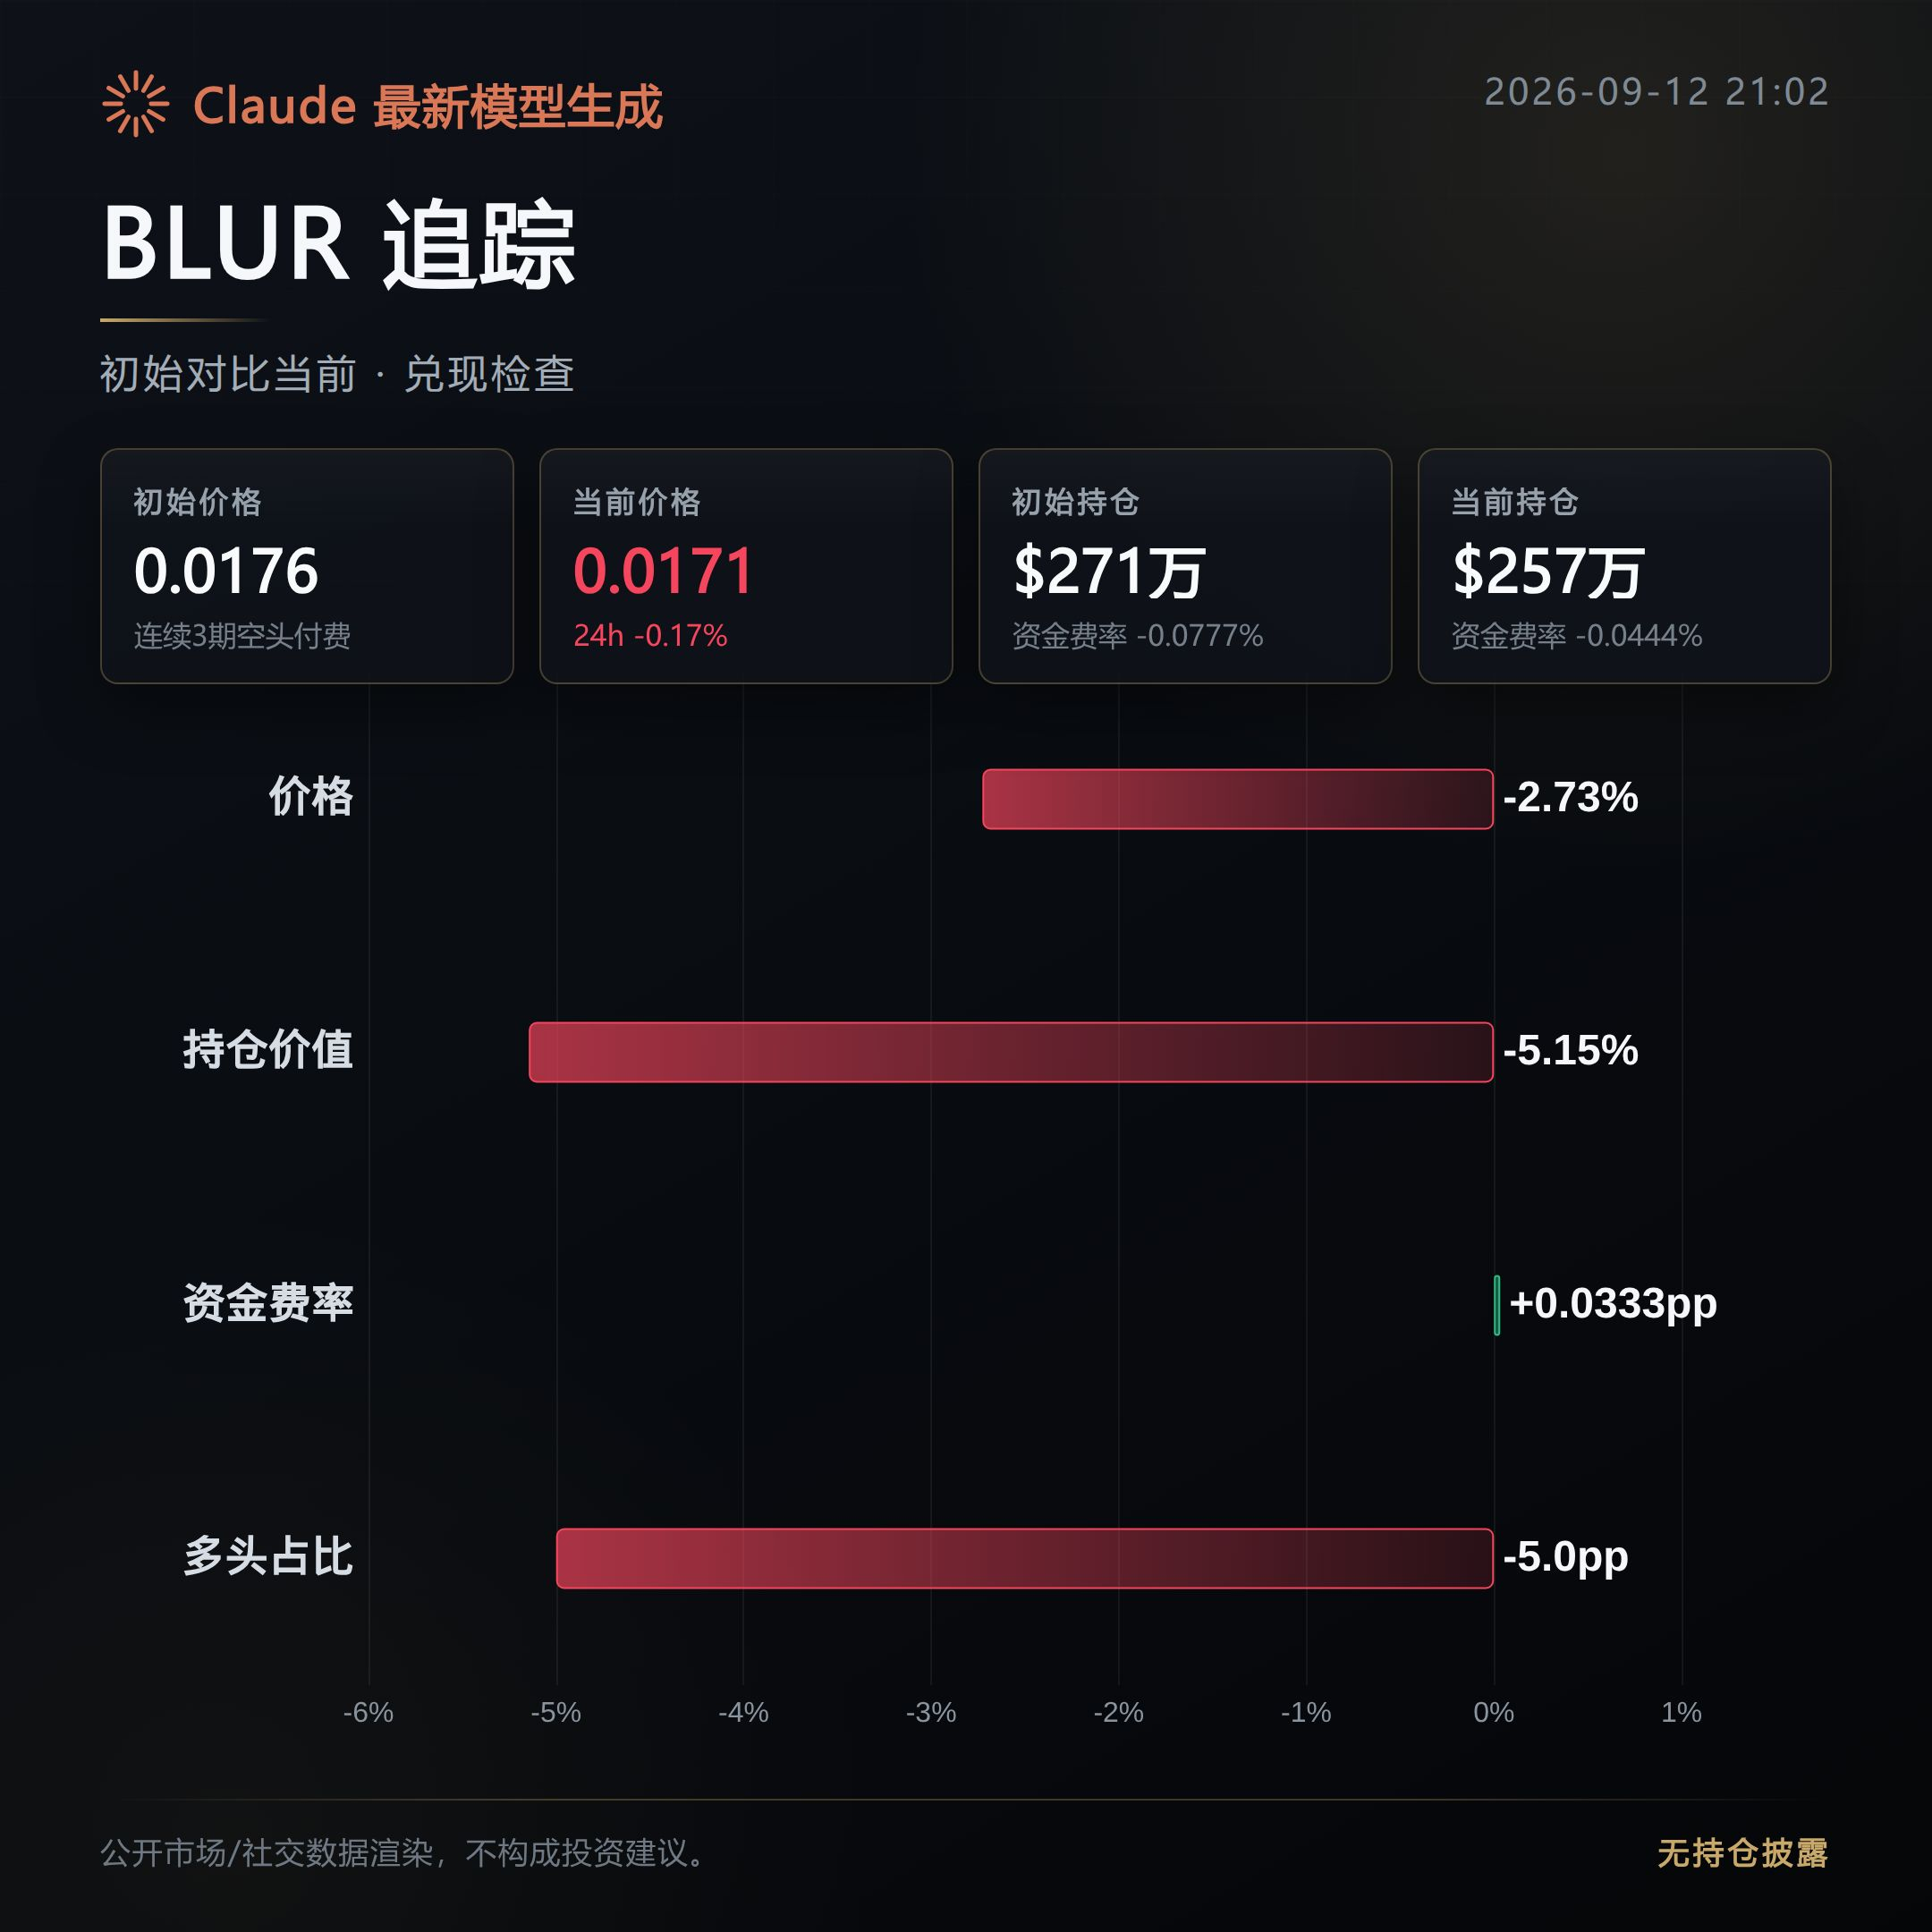
468
A recap of the bullish direction from about 13 hours ago in the morning. This time, I tracked three contracts from the same signal: ONDO, BCH, and THETA.
Now to reconcile: all three were choppy—none of them managed a clean move out.
The initial observation was that the positions were getting absorbed.
ONDO: Choppy. The morning bullish setup couldn’t break and run in a single direction.
Since the initial entry, the price has almost been flat, up only 0.17%, while the 24-hour change has fallen from +2.37% at the time to -1.57% now.
Open interest is up just 0.75%, but trading volume shrank by 23.64%, indicating that buyers didn’t follow through with the direction.
BCH: Choppy. The price rose, but the structure didn’t keep up.
Since the initial entry, the price is up 1.26%, which looks somewhat aligned with the direction.
However, open interest increased only 0.79%, while trading volume dropped by 27.27%. The share of aggressive buy orders fell from 0.88 to 0.77—this looks more like a volume contraction pushing the price up, without new positions adding momentum.
THETA: Choppy. The intraday rally of that morning has already flipped.
At the initial time, the 24-hour change was +12.07%; now it’s -2.44%. The current price is still 1.37% higher than at the initial entry, but trading volume is down 42.31%. Funding rate has turned from negative to positive, changing from -0.0251% to 0.01%.
Volume is backing off, and the funding rate is turning—so the heat for chasing longs never truly caught up.
Next, watch these three lines for the same thing: whether trading volume can rebound to fill back up, and whether open interest can continue rising along with price.
If price stalls while both open interest and volume keep falling, then this bullish move can basically be confirmed as not having successfully broken out. Conversely, only when you see expanding volume and open interest rising in sync can it be considered that proper confirmation has been regained.
#ONDO #BCH #THETA #Contract recap
Live disclosure: This account currently holds $FOGO long positions; the related views are consistent with the actual position size.
Compiled with the help of Claude Fable 5 for contract data, for information reference only—please verify for yourself.
A recap of the bullish direction from about 13 hours ago in the morning. This time, I tracked three contracts from the same signal: ONDO, BCH, and THETA.
Now to reconcile: all three were choppy—none of them managed a clean move out.
The initial observation was that the positions were getting absorbed.
ONDO: Choppy. The morning bullish setup couldn’t break and run in a single direction.
Since the initial entry, the price has almost been flat, up only 0.17%, while the 24-hour change has fallen from +2.37% at the time to -1.57% now.
Open interest is up just 0.75%, but trading volume shrank by 23.64%, indicating that buyers didn’t follow through with the direction.
BCH: Choppy. The price rose, but the structure didn’t keep up.
Since the initial entry, the price is up 1.26%, which looks somewhat aligned with the direction.
However, open interest increased only 0.79%, while trading volume dropped by 27.27%. The share of aggressive buy orders fell from 0.88 to 0.77—this looks more like a volume contraction pushing the price up, without new positions adding momentum.
THETA: Choppy. The intraday rally of that morning has already flipped.
At the initial time, the 24-hour change was +12.07%; now it’s -2.44%. The current price is still 1.37% higher than at the initial entry, but trading volume is down 42.31%. Funding rate has turned from negative to positive, changing from -0.0251% to 0.01%.
Volume is backing off, and the funding rate is turning—so the heat for chasing longs never truly caught up.
Next, watch these three lines for the same thing: whether trading volume can rebound to fill back up, and whether open interest can continue rising along with price.
If price stalls while both open interest and volume keep falling, then this bullish move can basically be confirmed as not having successfully broken out. Conversely, only when you see expanding volume and open interest rising in sync can it be considered that proper confirmation has been regained.
#ONDO #BCH #THETA #Contract recap
Live disclosure: This account currently holds $FOGO long positions; the related views are consistent with the actual position size.
Compiled with the help of Claude Fable 5 for contract data, for information reference only—please verify for yourself.
Now to reconcile: all three were choppy—none of them managed a clean move out.
The initial observation was that the positions were getting absorbed.
ONDO: Choppy. The morning bullish setup couldn’t break and run in a single direction.
Since the initial entry, the price has almost been flat, up only 0.17%, while the 24-hour change has fallen from +2.37% at the time to -1.57% now.
Open interest is up just 0.75%, but trading volume shrank by 23.64%, indicating that buyers didn’t follow through with the direction.
BCH: Choppy. The price rose, but the structure didn’t keep up.
Since the initial entry, the price is up 1.26%, which looks somewhat aligned with the direction.
However, open interest increased only 0.79%, while trading volume dropped by 27.27%. The share of aggressive buy orders fell from 0.88 to 0.77—this looks more like a volume contraction pushing the price up, without new positions adding momentum.
THETA: Choppy. The intraday rally of that morning has already flipped.
At the initial time, the 24-hour change was +12.07%; now it’s -2.44%. The current price is still 1.37% higher than at the initial entry, but trading volume is down 42.31%. Funding rate has turned from negative to positive, changing from -0.0251% to 0.01%.
Volume is backing off, and the funding rate is turning—so the heat for chasing longs never truly caught up.
Next, watch these three lines for the same thing: whether trading volume can rebound to fill back up, and whether open interest can continue rising along with price.
If price stalls while both open interest and volume keep falling, then this bullish move can basically be confirmed as not having successfully broken out. Conversely, only when you see expanding volume and open interest rising in sync can it be considered that proper confirmation has been regained.
#ONDO #BCH #THETA #Contract recap
Live disclosure: This account currently holds $FOGO long positions; the related views are consistent with the actual position size.
Compiled with the help of Claude Fable 5 for contract data, for information reference only—please verify for yourself.
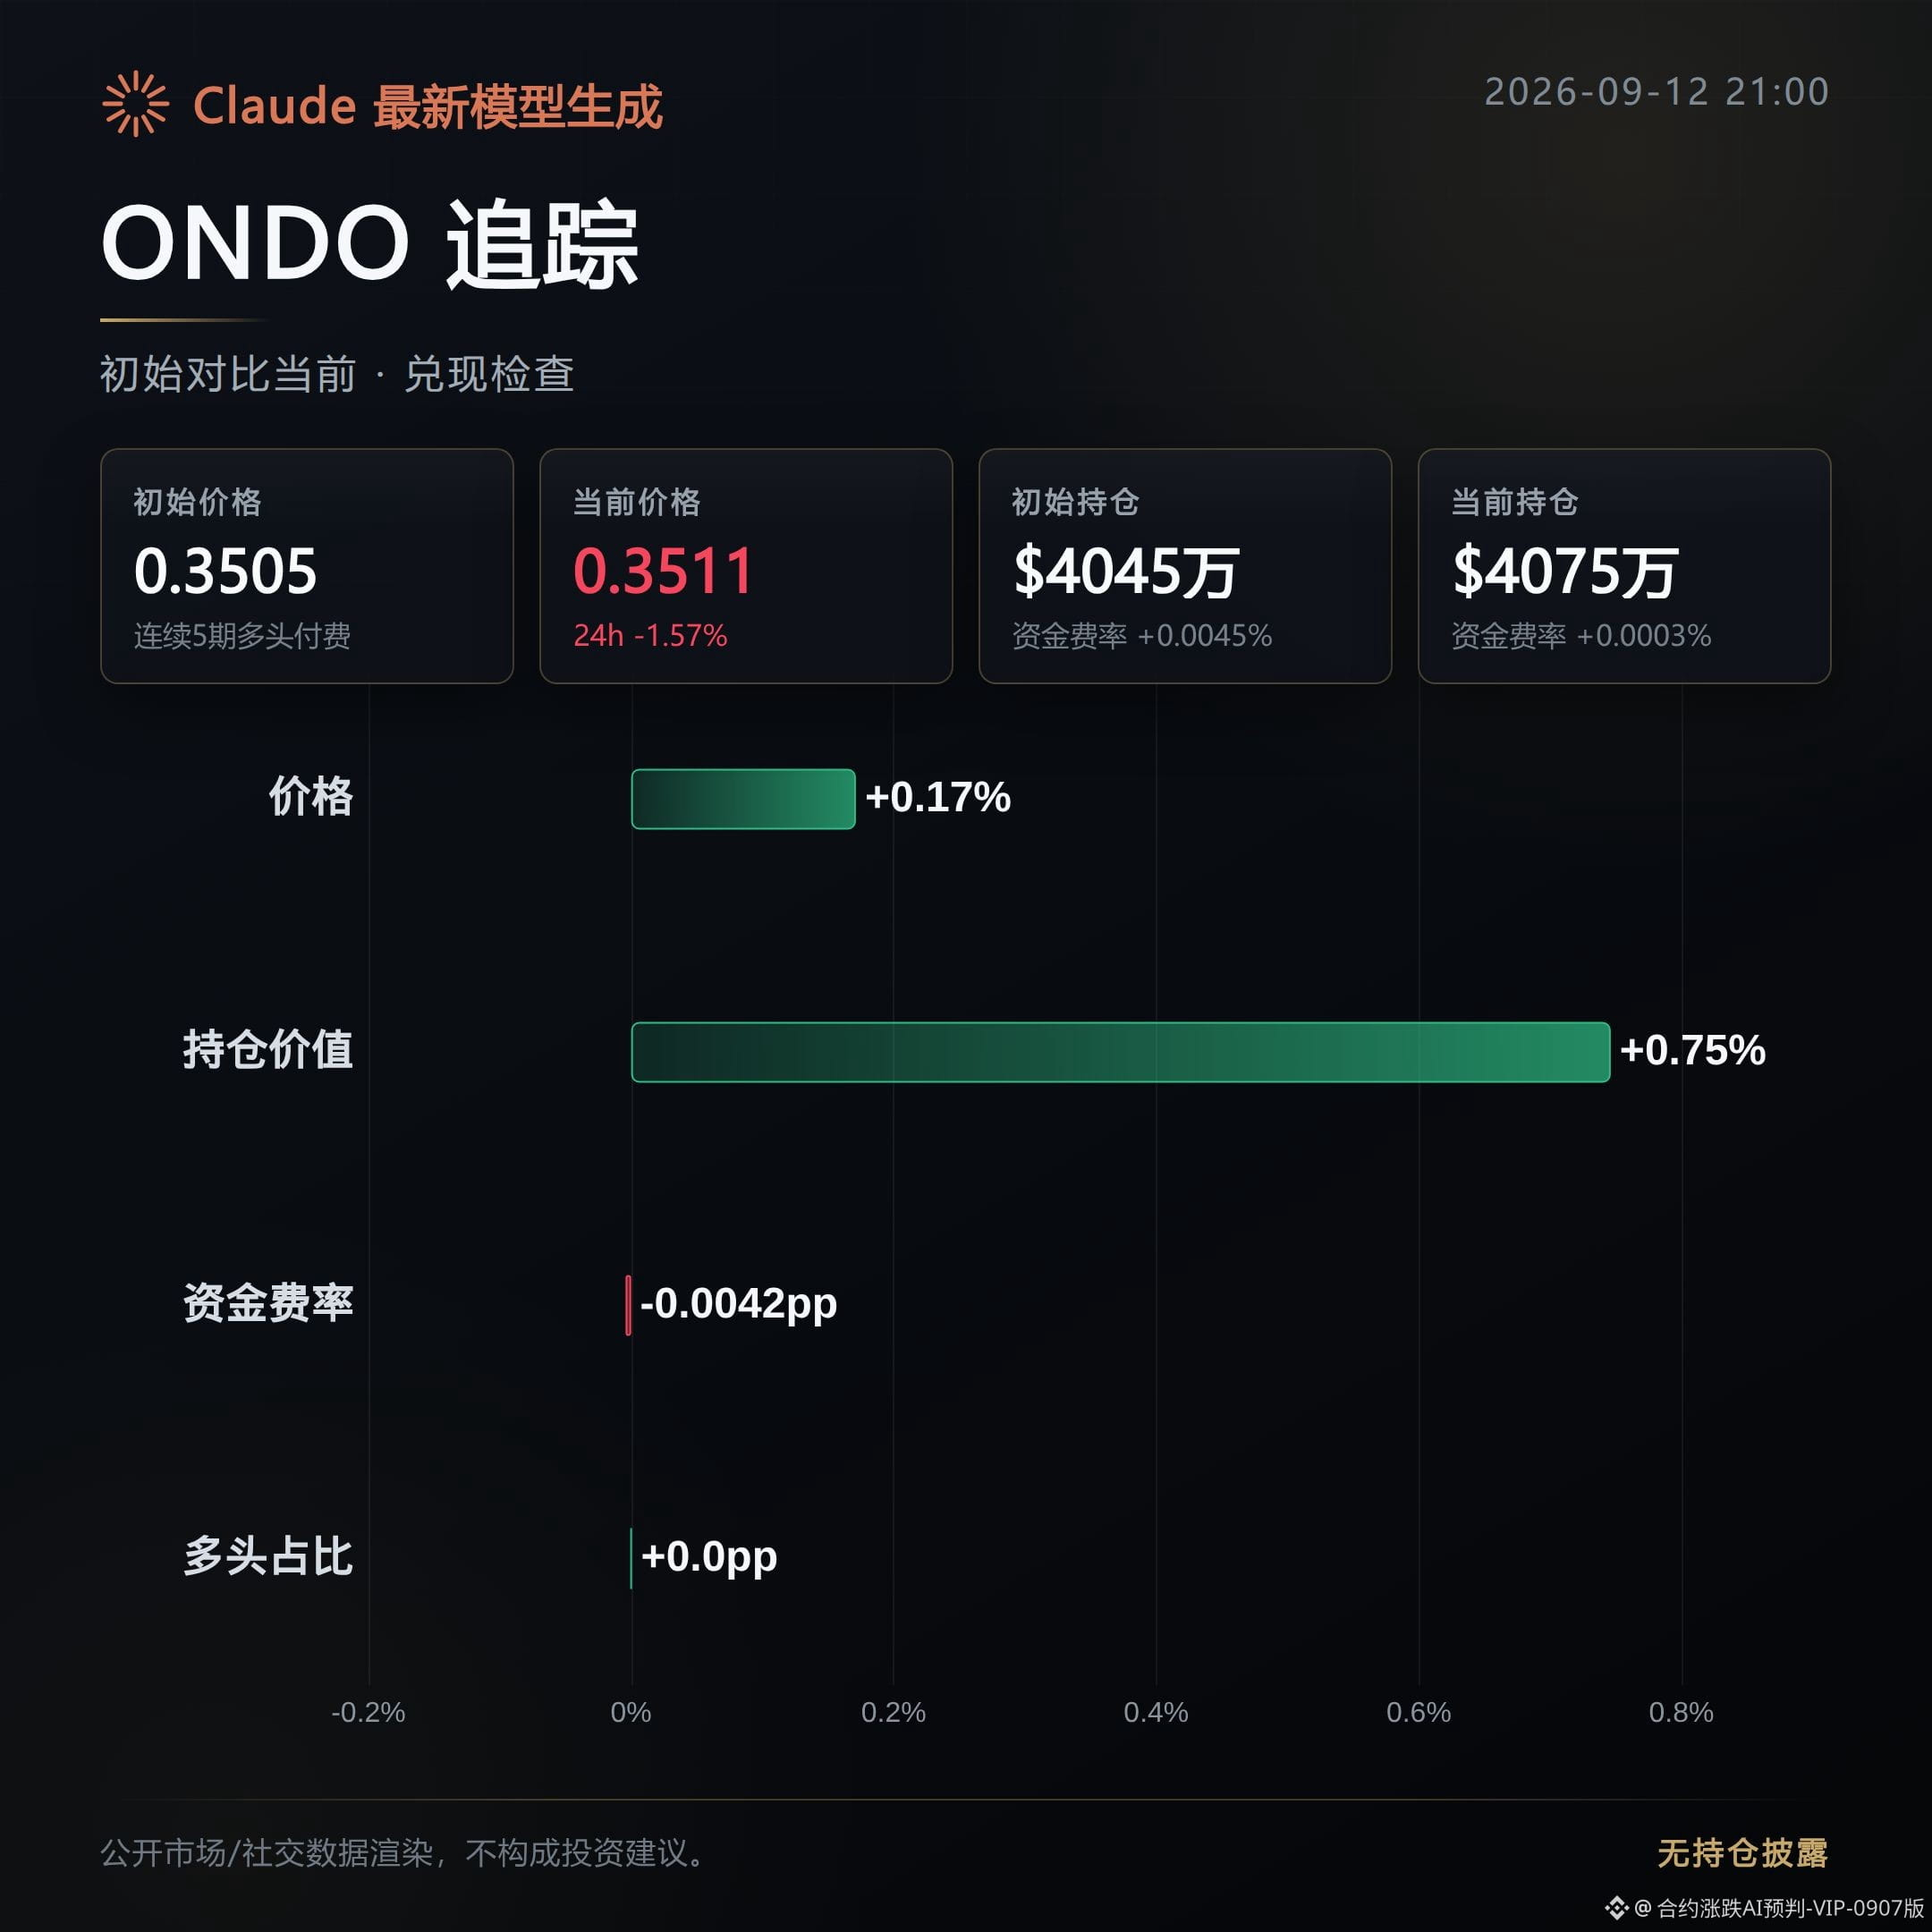
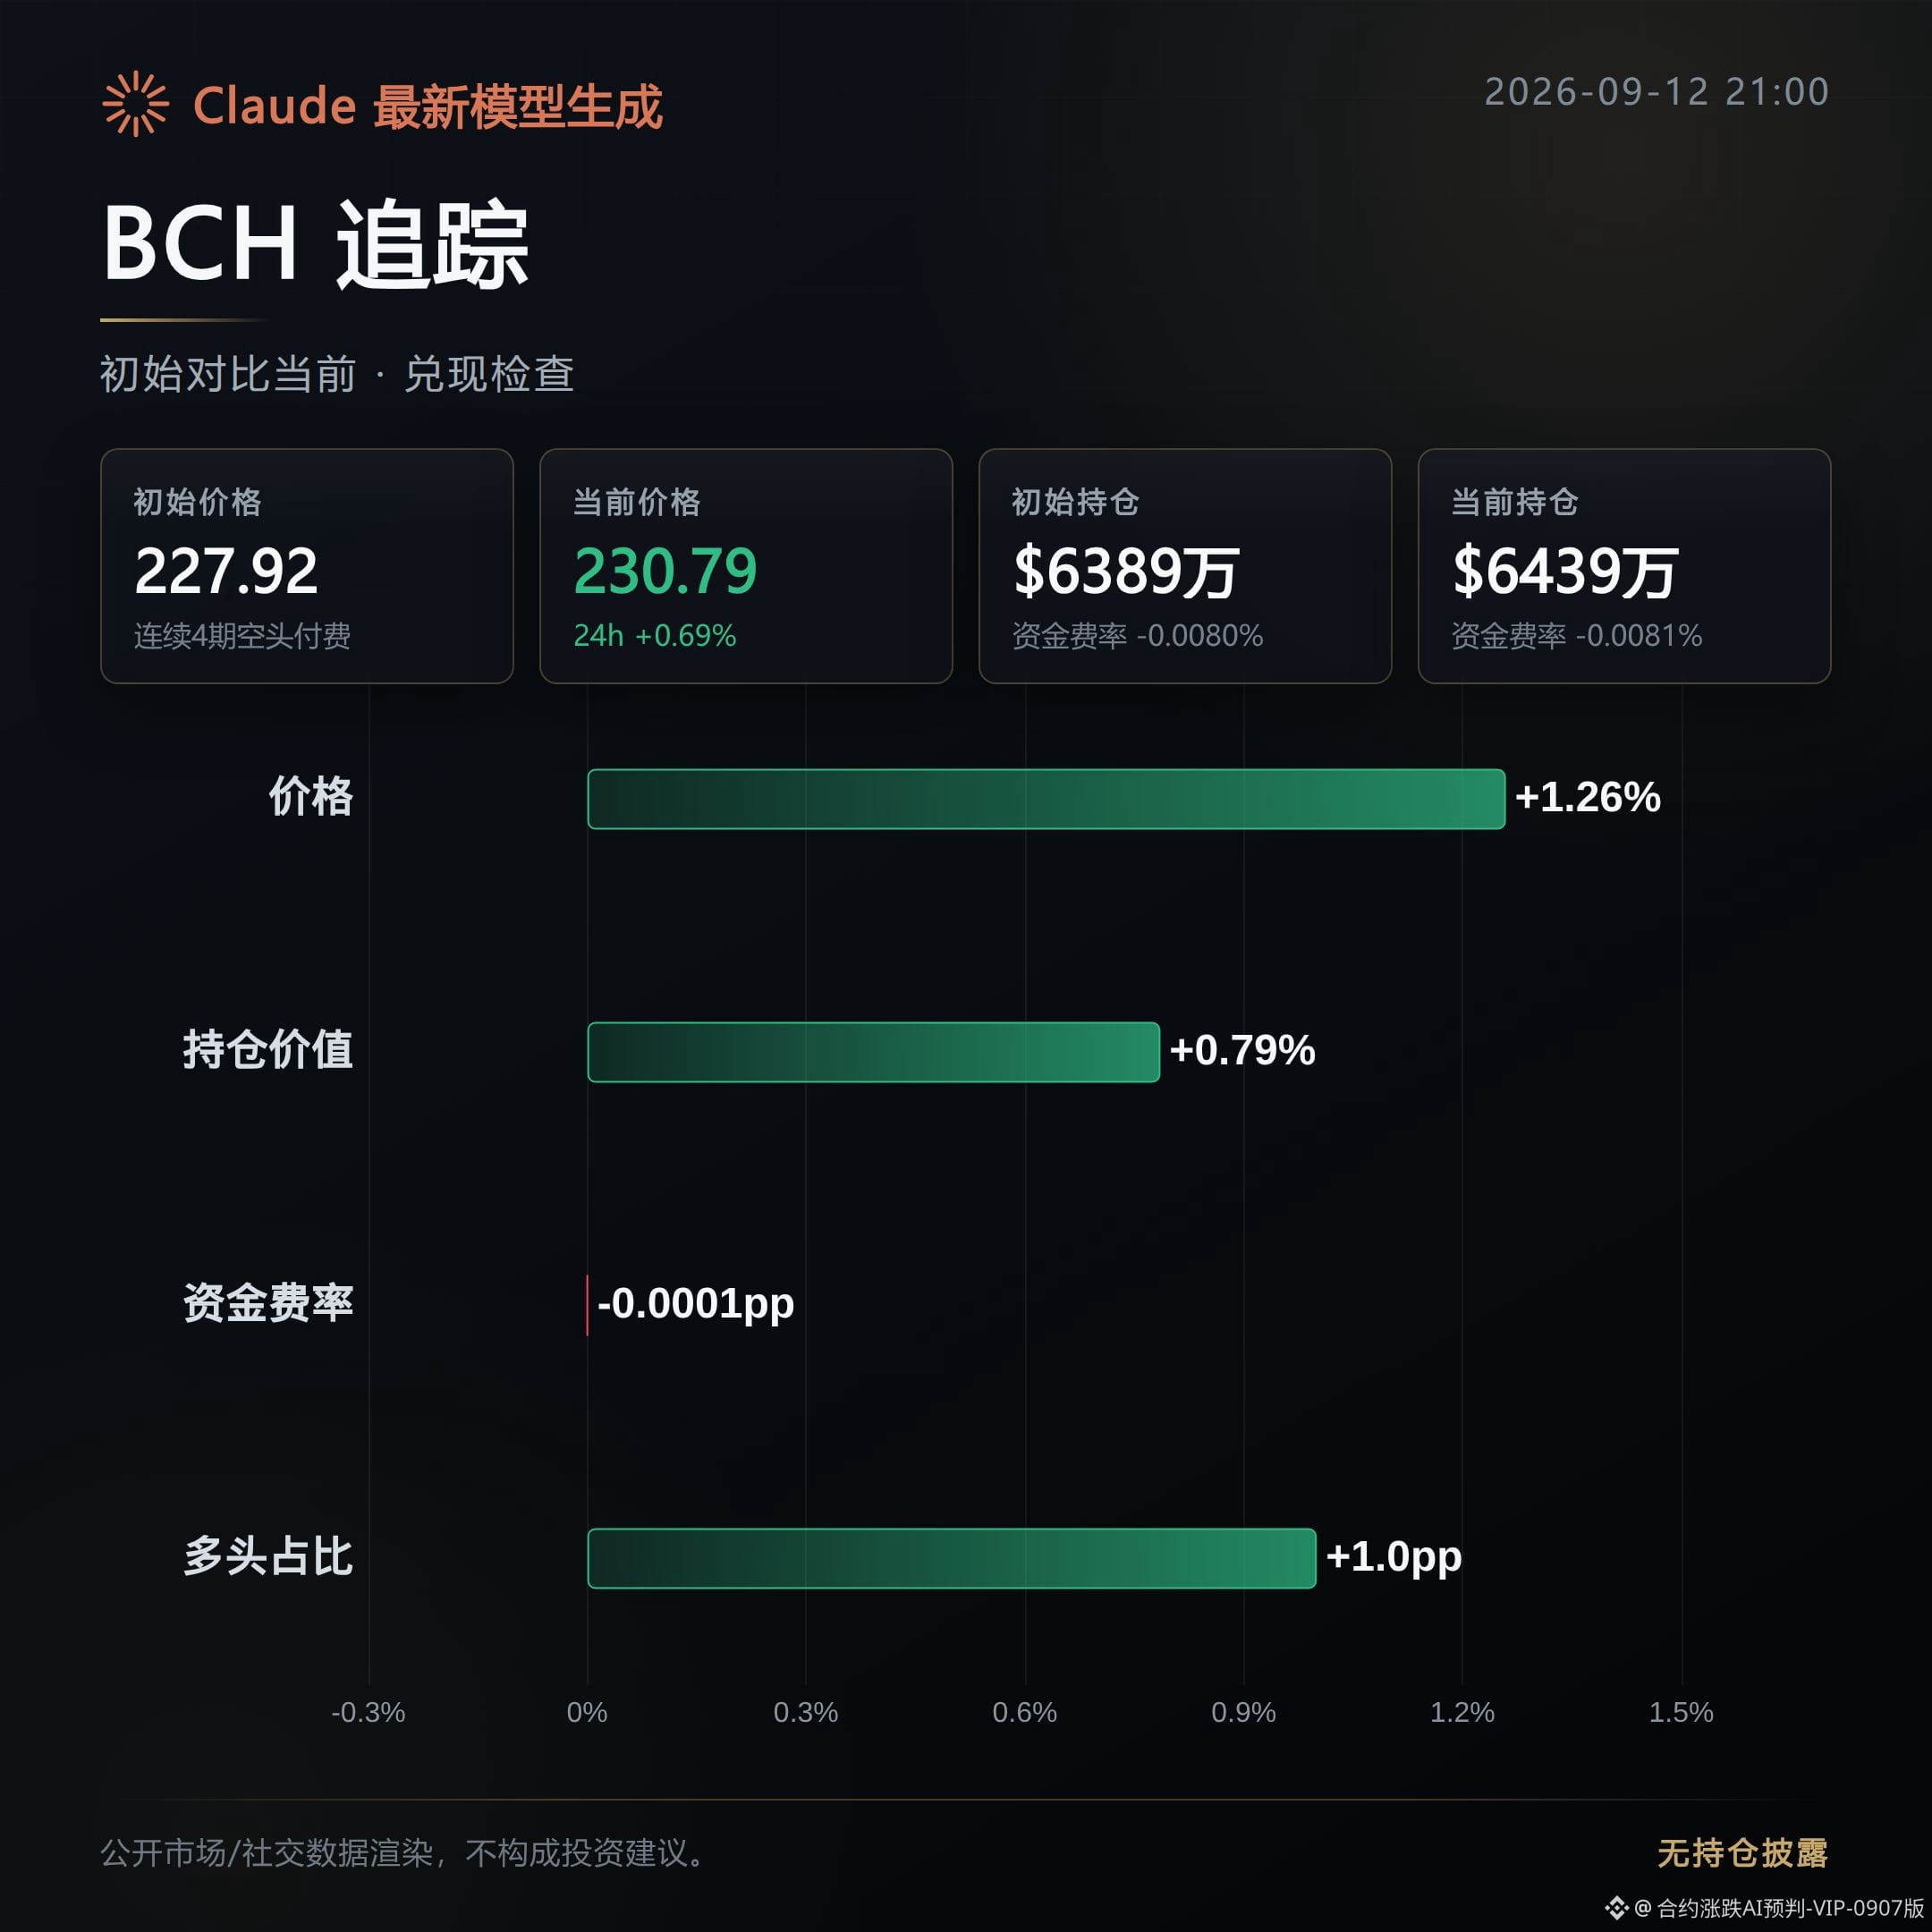
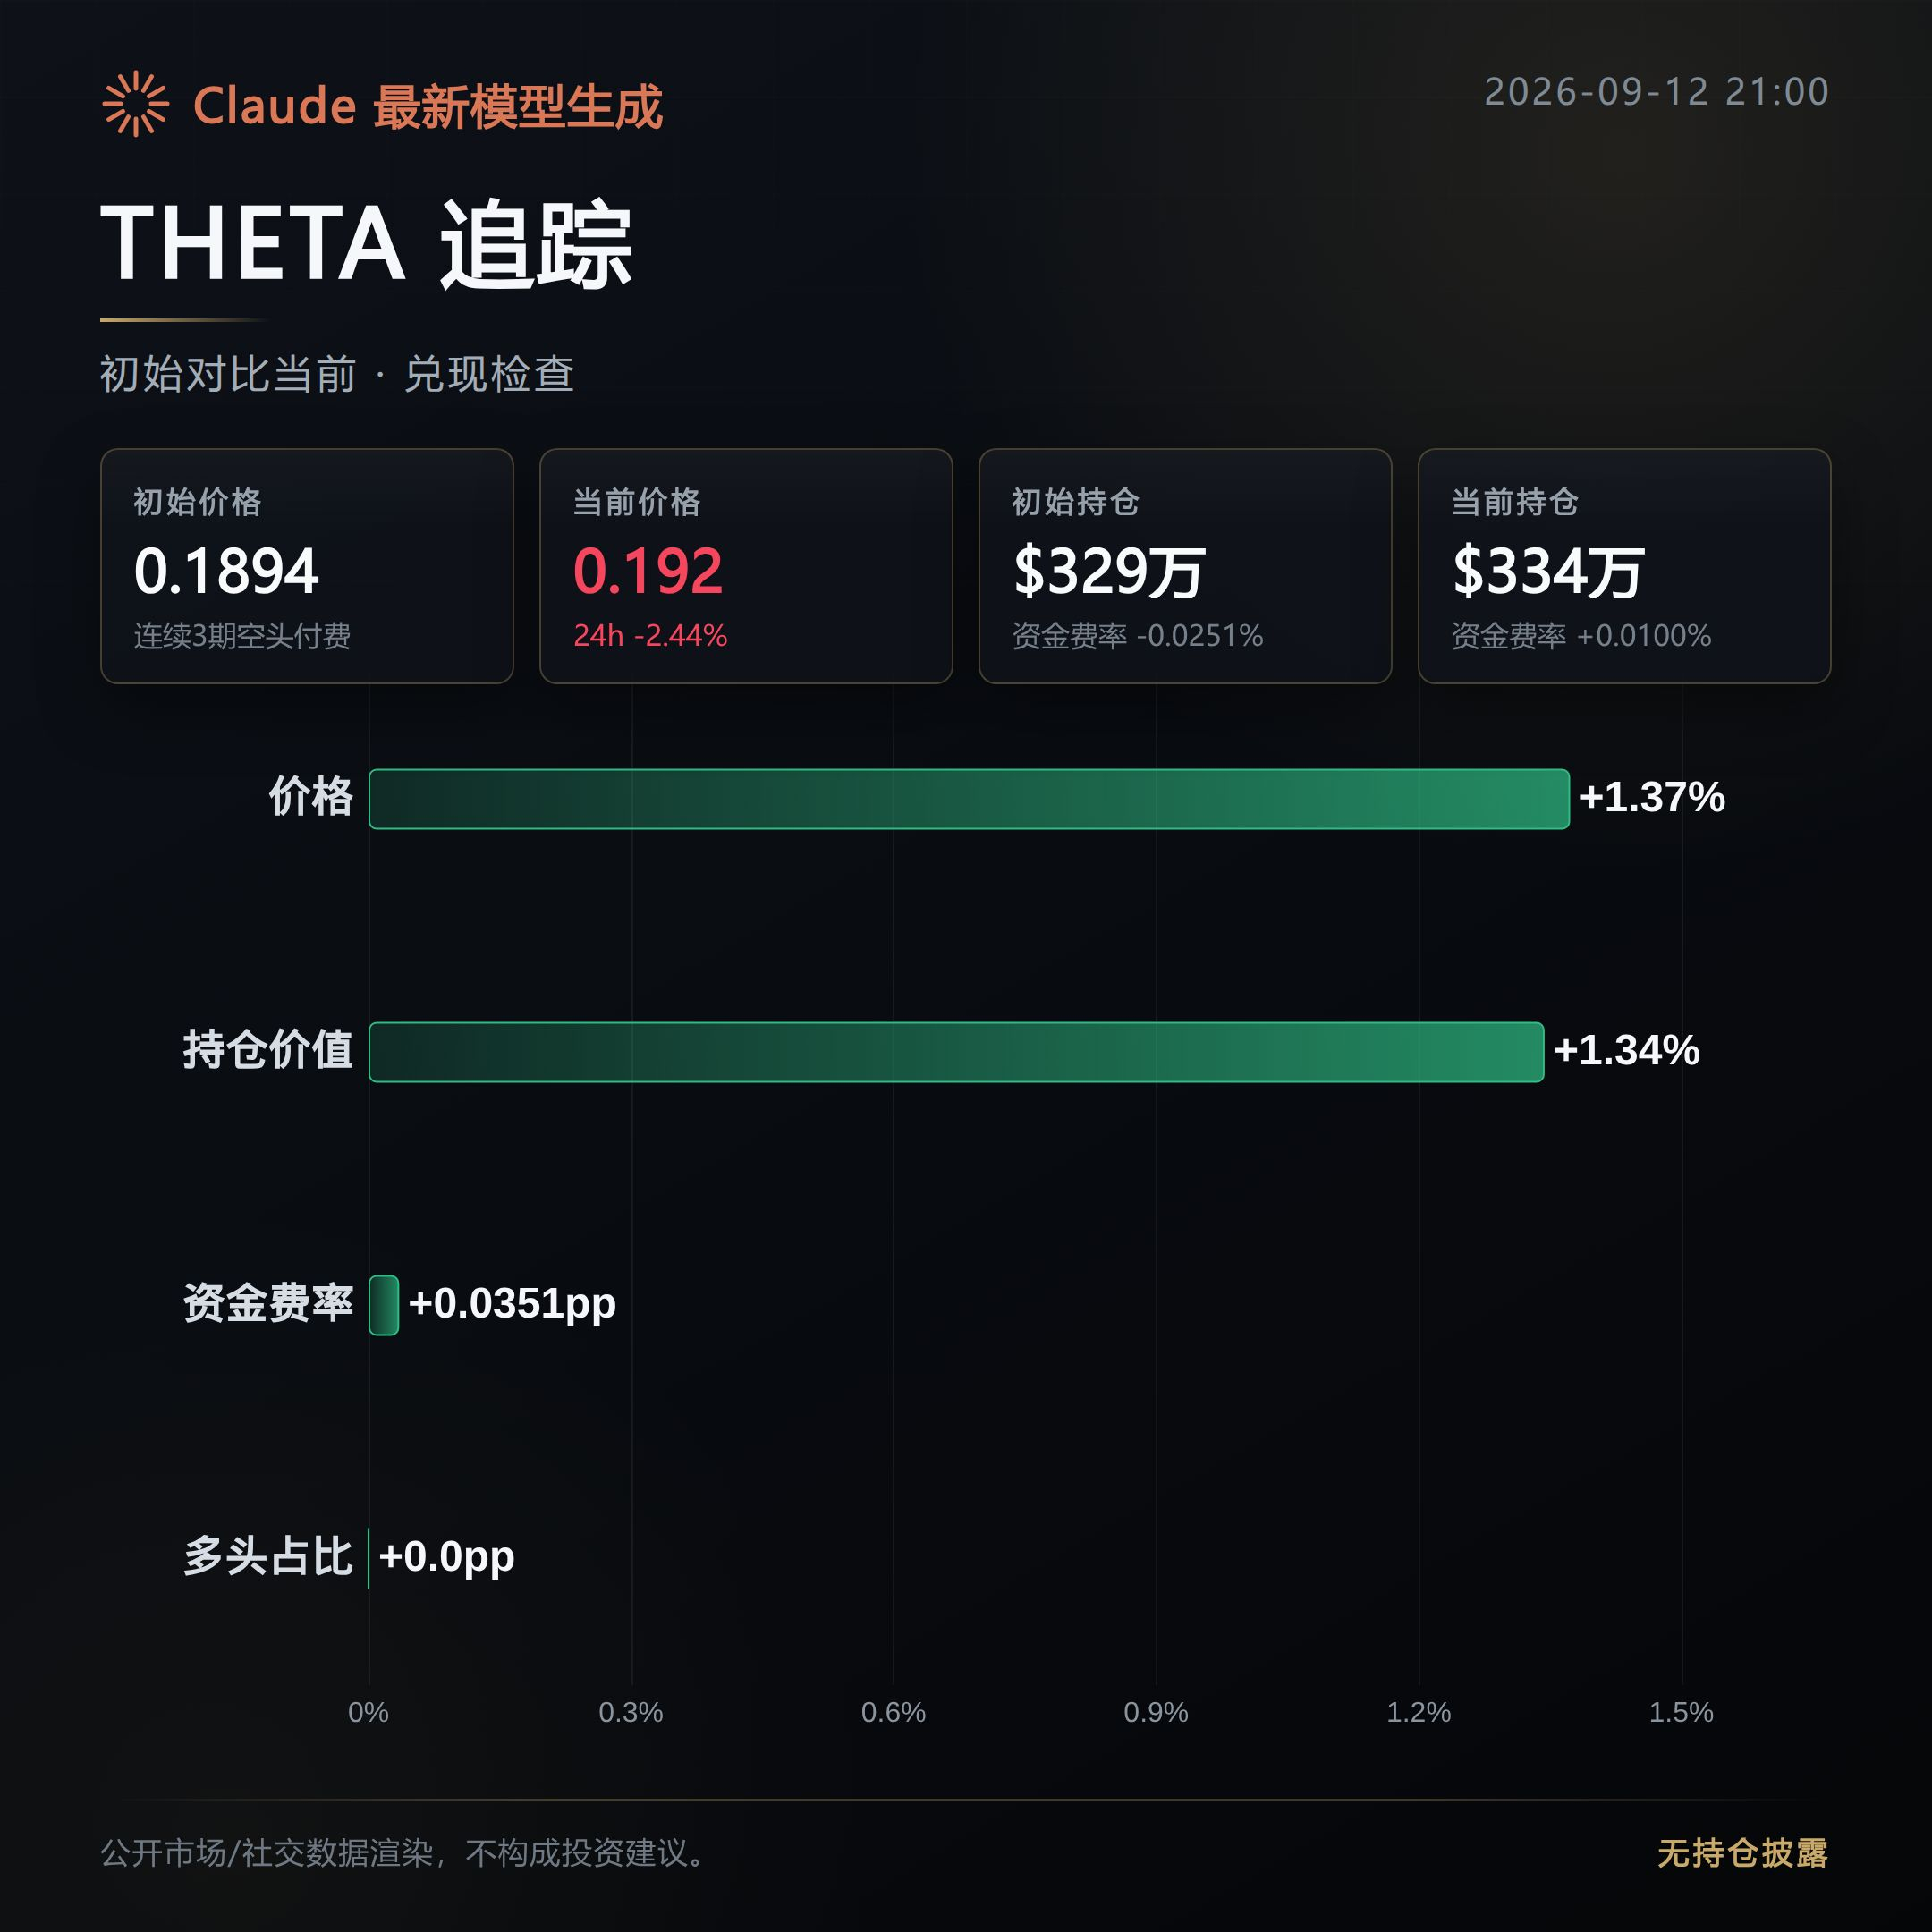
1
492
Log in to explore more content
Join global crypto users on Binance Square
⚡️ Get latest and useful information about crypto.
💬 Trusted by the world’s largest crypto exchange.
👍 Discover real insights from verified creators.
Email / Phone number