
VantaChain
7 Posts

VantaChain
Report
Block User
Decoding market trends, tracking smart money & identifying opportunities. Technical analysis | Market psychology | Risk management. Research over hype. Always
1 Following
0 Followers
0 Liked
Posts
·
--
📊 $ETH ETHEREUM MARKET ANALYSIS
🔴 Current Market Situation
Ethereum is facing strong selling pressure, trading around the $2,131 zone, with approximately 4.6% losses over the last 24 hours.
The breakdown below the important $2,170 support level has weakened the short-term market structure.
📉 Key Technical Levels
Current Price: $2,131
Immediate Support: $2,102
Major Support: $2,042
Next Support: $1,982
Immediate Resistance: $2,160
Major Resistance: $2,210
📈 Technical Indicators
RSI (Daily): Around 34 – Weak momentum.
Overall Trend: Bearish.
Selling pressure remains dominant across short-term timeframes.
🎯 What to Watch Next?
If ETH breaks below $2,102 with strong selling volume, the next downside levels could be $2,042 and $1,982.
However, a recovery above $2,160 could provide the first sign of short-term strength. A stronger bullish confirmation would require reclaiming $2,210.
💡 My View: The market currently favors caution. Traders should wait for confirmation rather than entering positions based on emotions.
What do you think? Will ETH recover from this support zone or continue its downward move?
👇 Share your analysis in the comments!
#ETH #CryptoAnalysis #CryptoMarket #VantaChain #NvidiaInvestigatesAfterHuang’sAffairApology
{spot}(ETHUSDT)
📊 $ETH ETHEREUM MARKET ANALYSIS
🔴 Current Market Situation
Ethereum is facing strong selling pressure, trading around the $2,131 zone, with approximately 4.6% losses over the last 24 hours.
The breakdown below the important $2,170 support level has weakened the short-term market structure.
📉 Key Technical Levels
Current Price: $2,131
Immediate Support: $2,102
Major Support: $2,042
Next Support: $1,982
Immediate Resistance: $2,160
Major Resistance: $2,210
📈 Technical Indicators
RSI (Daily): Around 34 – Weak momentum.
Overall Trend: Bearish.
Selling pressure remains dominant across short-term timeframes.
🎯 What to Watch Next?
If ETH breaks below $2,102 with strong selling volume, the next downside levels could be $2,042 and $1,982.
However, a recovery above $2,160 could provide the first sign of short-term strength. A stronger bullish confirmation would require reclaiming $2,210.
💡 My View: The market currently favors caution. Traders should wait for confirmation rather than entering positions based on emotions.
What do you think? Will ETH recover from this support zone or continue its downward move?
👇 Share your analysis in the comments!
#ETH #CryptoAnalysis #CryptoMarket #VantaChain #NvidiaInvestigatesAfterHuang’sAffairApology
🔴 Current Market Situation
Ethereum is facing strong selling pressure, trading around the $2,131 zone, with approximately 4.6% losses over the last 24 hours.
The breakdown below the important $2,170 support level has weakened the short-term market structure.
📉 Key Technical Levels
Current Price: $2,131
Immediate Support: $2,102
Major Support: $2,042
Next Support: $1,982
Immediate Resistance: $2,160
Major Resistance: $2,210
📈 Technical Indicators
RSI (Daily): Around 34 – Weak momentum.
Overall Trend: Bearish.
Selling pressure remains dominant across short-term timeframes.
🎯 What to Watch Next?
If ETH breaks below $2,102 with strong selling volume, the next downside levels could be $2,042 and $1,982.
However, a recovery above $2,160 could provide the first sign of short-term strength. A stronger bullish confirmation would require reclaiming $2,210.
💡 My View: The market currently favors caution. Traders should wait for confirmation rather than entering positions based on emotions.
What do you think? Will ETH recover from this support zone or continue its downward move?
👇 Share your analysis in the comments!
#ETH #CryptoAnalysis #CryptoMarket #VantaChain #NvidiaInvestigatesAfterHuang’sAffairApology

66
·
--
📉 BITCOIN $BTC – BEARS ARE STILL IN CONTROL?
📅 November 9, 2026
Bitcoin is facing renewed selling pressure after losing important support levels.
Market Snapshot:
Price reference: $74,473
24H change: -1.74%
Market trend: Bearish
🔍 Key Technical Levels
🟢 Support:
$73,444
$74,000–$74,500 zone
🔴 Resistance:
$74,891
$75,625
$76,096
📊 Technical Outlook
The daily MACD remains bearish, with negative momentum expanding. Buyers need to reclaim previous support levels to show signs of recovery.
Bullish Scenario: A recovery above $74,891 followed by a daily close above $75,625 could improve market sentiment.
Bearish Scenario: A breakdown below $73,444 may expose BTC to further downside.
💡 VantaChain Insight:
Don't rush into market decisions. Wait for confirmation, protect capital and always manage risk.
What's your view? Will BTC recover or continue falling?
#Bitcoin #BTC走势分析 #CryptoAnalysis #VantaChain #NvidiaInvestigatesAfterHuang’sAffairApology
{spot}(BTCUSDT)
📉 BITCOIN $BTC – BEARS ARE STILL IN CONTROL?
📅 November 9, 2026
Bitcoin is facing renewed selling pressure after losing important support levels.
Market Snapshot:
Price reference: $74,473
24H change: -1.74%
Market trend: Bearish
🔍 Key Technical Levels
🟢 Support:
$73,444
$74,000–$74,500 zone
🔴 Resistance:
$74,891
$75,625
$76,096
📊 Technical Outlook
The daily MACD remains bearish, with negative momentum expanding. Buyers need to reclaim previous support levels to show signs of recovery.
Bullish Scenario: A recovery above $74,891 followed by a daily close above $75,625 could improve market sentiment.
Bearish Scenario: A breakdown below $73,444 may expose BTC to further downside.
💡 VantaChain Insight:
Don't rush into market decisions. Wait for confirmation, protect capital and always manage risk.
What's your view? Will BTC recover or continue falling?
#Bitcoin #BTC走势分析 #CryptoAnalysis #VantaChain #NvidiaInvestigatesAfterHuang’sAffairApology
📅 November 9, 2026
Bitcoin is facing renewed selling pressure after losing important support levels.
Market Snapshot:
Price reference: $74,473
24H change: -1.74%
Market trend: Bearish
🔍 Key Technical Levels
🟢 Support:
$73,444
$74,000–$74,500 zone
🔴 Resistance:
$74,891
$75,625
$76,096
📊 Technical Outlook
The daily MACD remains bearish, with negative momentum expanding. Buyers need to reclaim previous support levels to show signs of recovery.
Bullish Scenario: A recovery above $74,891 followed by a daily close above $75,625 could improve market sentiment.
Bearish Scenario: A breakdown below $73,444 may expose BTC to further downside.
💡 VantaChain Insight:
Don't rush into market decisions. Wait for confirmation, protect capital and always manage risk.
What's your view? Will BTC recover or continue falling?
#Bitcoin #BTC走势分析 #CryptoAnalysis #VantaChain #NvidiaInvestigatesAfterHuang’sAffairApology

75
·
--
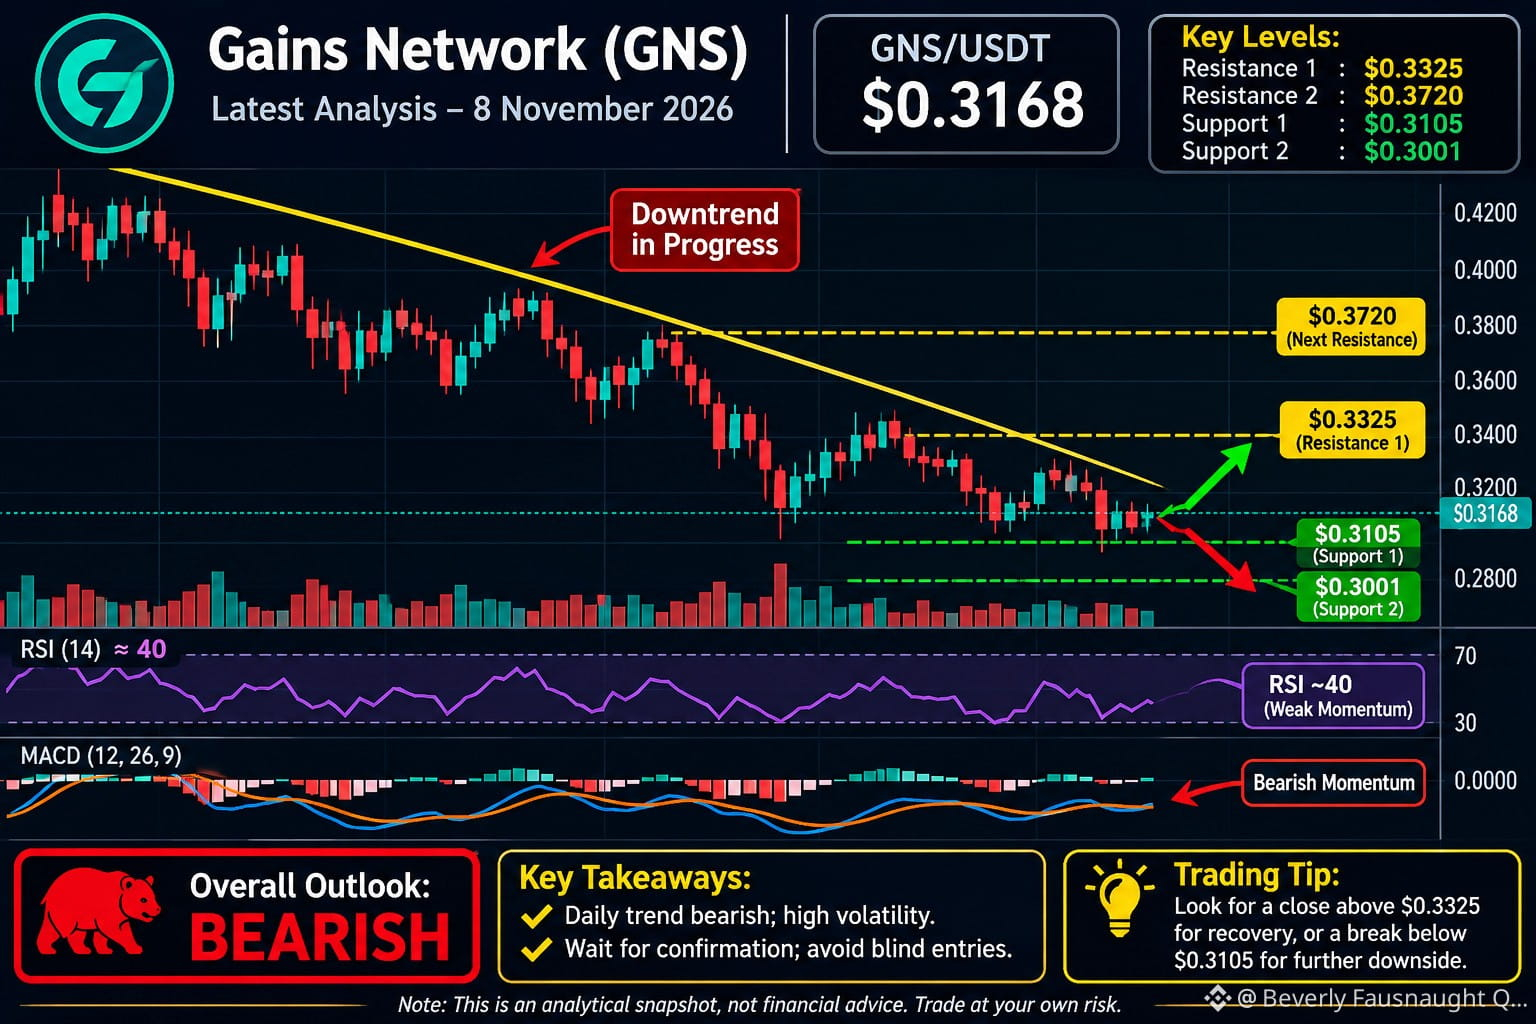
$GNS Technical overview:
RSI: approximately 40 – weak momentum.
Daily trend: Bearish.
Moving averages: Bearish alignment.
Volatility: High.
Important price levels:
Level
Price
Support 1
$0.3105
Support 2
$0.3001
Resistance 1
$0.3325
Resistance 2
$0.3720
Sources:
Live Price, Market Cap & Chart+2
Analytical chart – GNS/USDT
Trading insight: A close above $0.3325 may signal recovery. A breakdown below $0.3105 could expose $0.3001.#BinanceReopensWithdrawalsForHYPE&APT #SouthKoreaDraftLawTargets15To20%ShareholderCap #KeplrAdvisesSocialLoginUsersToTransferAssets
{spot}(GNSUSDT)
$GNS Technical overview:
RSI: approximately 40 – weak momentum.
Daily trend: Bearish.
Moving averages: Bearish alignment.
Volatility: High.
Important price levels:
Level
Price
Support 1
$0.3105
Support 2
$0.3001
Resistance 1
$0.3325
Resistance 2
$0.3720
Sources:
Live Price, Market Cap & Chart+2
Analytical chart – GNS/USDT
Trading insight: A close above $0.3325 may signal recovery. A breakdown below $0.3105 could expose $0.3001.#BinanceReopensWithdrawalsForHYPE&APT #SouthKoreaDraftLawTargets15To20%ShareholderCap #KeplrAdvisesSocialLoginUsersToTransferAssets
RSI: approximately 40 – weak momentum.
Daily trend: Bearish.
Moving averages: Bearish alignment.
Volatility: High.
Important price levels:
Level
Price
Support 1
$0.3105
Support 2
$0.3001
Resistance 1
$0.3325
Resistance 2
$0.3720
Sources:
Live Price, Market Cap & Chart+2
Analytical chart – GNS/USDT
Trading insight: A close above $0.3325 may signal recovery. A breakdown below $0.3105 could expose $0.3001.#BinanceReopensWithdrawalsForHYPE&APT #SouthKoreaDraftLawTargets15To20%ShareholderCap #KeplrAdvisesSocialLoginUsersToTransferAssets
63
·
--
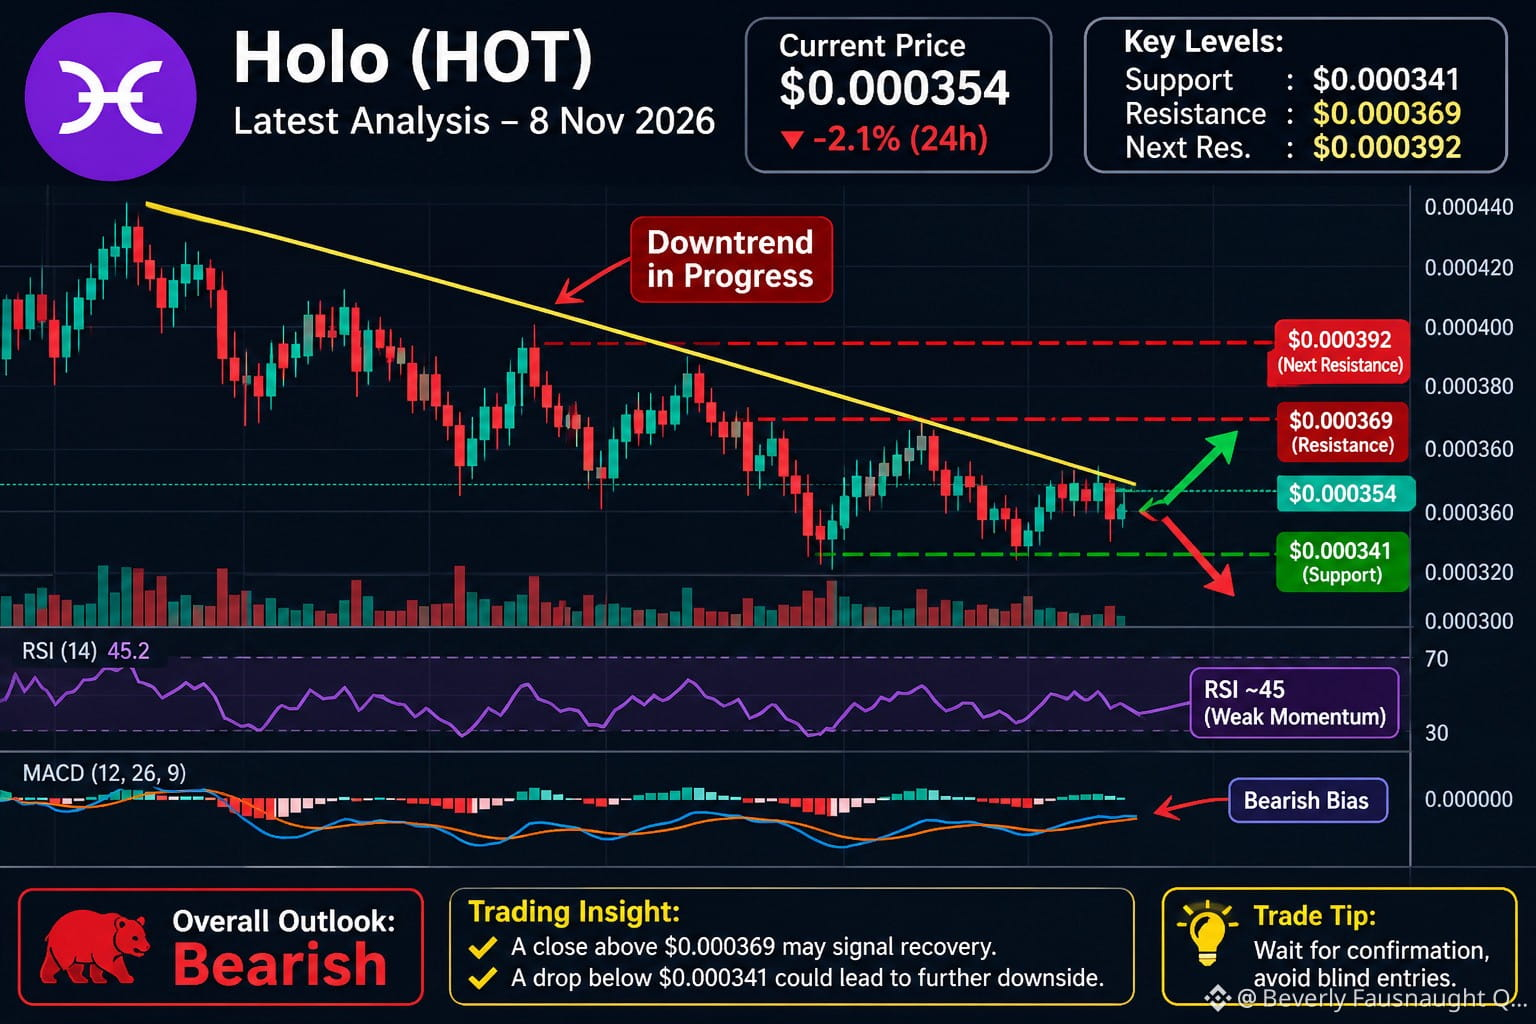
Market analysis; $HOT is showing a bearish trend on the daily chart. RSI is around 45, indicating weak momentum. Buyers need to defend support before a stronger recovery can develop.
CoinMarketCap+2
Key price levels
HOT/USDT approximate technical levels in USD.
$0$0.00015$0.0003$0.00045SupportCurrentResistanceNext resistance
Support: $0.000341
Resistance: $0.000369
Next resistance: $0.000392
Overall outlook: Bearish
Trading view: A daily close above $0.000369 could indicate recovery. A breakdown below $0.000341 may lead to further downside
#BinanceReopensWithdrawalsForHYPE&APT #SouthKoreaDraftLawTargets15To20%ShareholderCap #TradFiForBeginners
{spot}(HOTUSDT)
Market analysis; $HOT is showing a bearish trend on the daily chart. RSI is around 45, indicating weak momentum. Buyers need to defend support before a stronger recovery can develop.
CoinMarketCap+2
Key price levels
HOT/USDT approximate technical levels in USD.
$0$0.00015$0.0003$0.00045SupportCurrentResistanceNext resistance
Support: $0.000341
Resistance: $0.000369
Next resistance: $0.000392
Overall outlook: Bearish
Trading view: A daily close above $0.000369 could indicate recovery. A breakdown below $0.000341 may lead to further downside
#BinanceReopensWithdrawalsForHYPE&APT #SouthKoreaDraftLawTargets15To20%ShareholderCap #TradFiForBeginners
CoinMarketCap+2
Key price levels
HOT/USDT approximate technical levels in USD.
$0$0.00015$0.0003$0.00045SupportCurrentResistanceNext resistance
Support: $0.000341
Resistance: $0.000369
Next resistance: $0.000392
Overall outlook: Bearish
Trading view: A daily close above $0.000369 could indicate recovery. A breakdown below $0.000341 may lead to further downside
#BinanceReopensWithdrawalsForHYPE&APT #SouthKoreaDraftLawTargets15To20%ShareholderCap #TradFiForBeginners
148
·
--
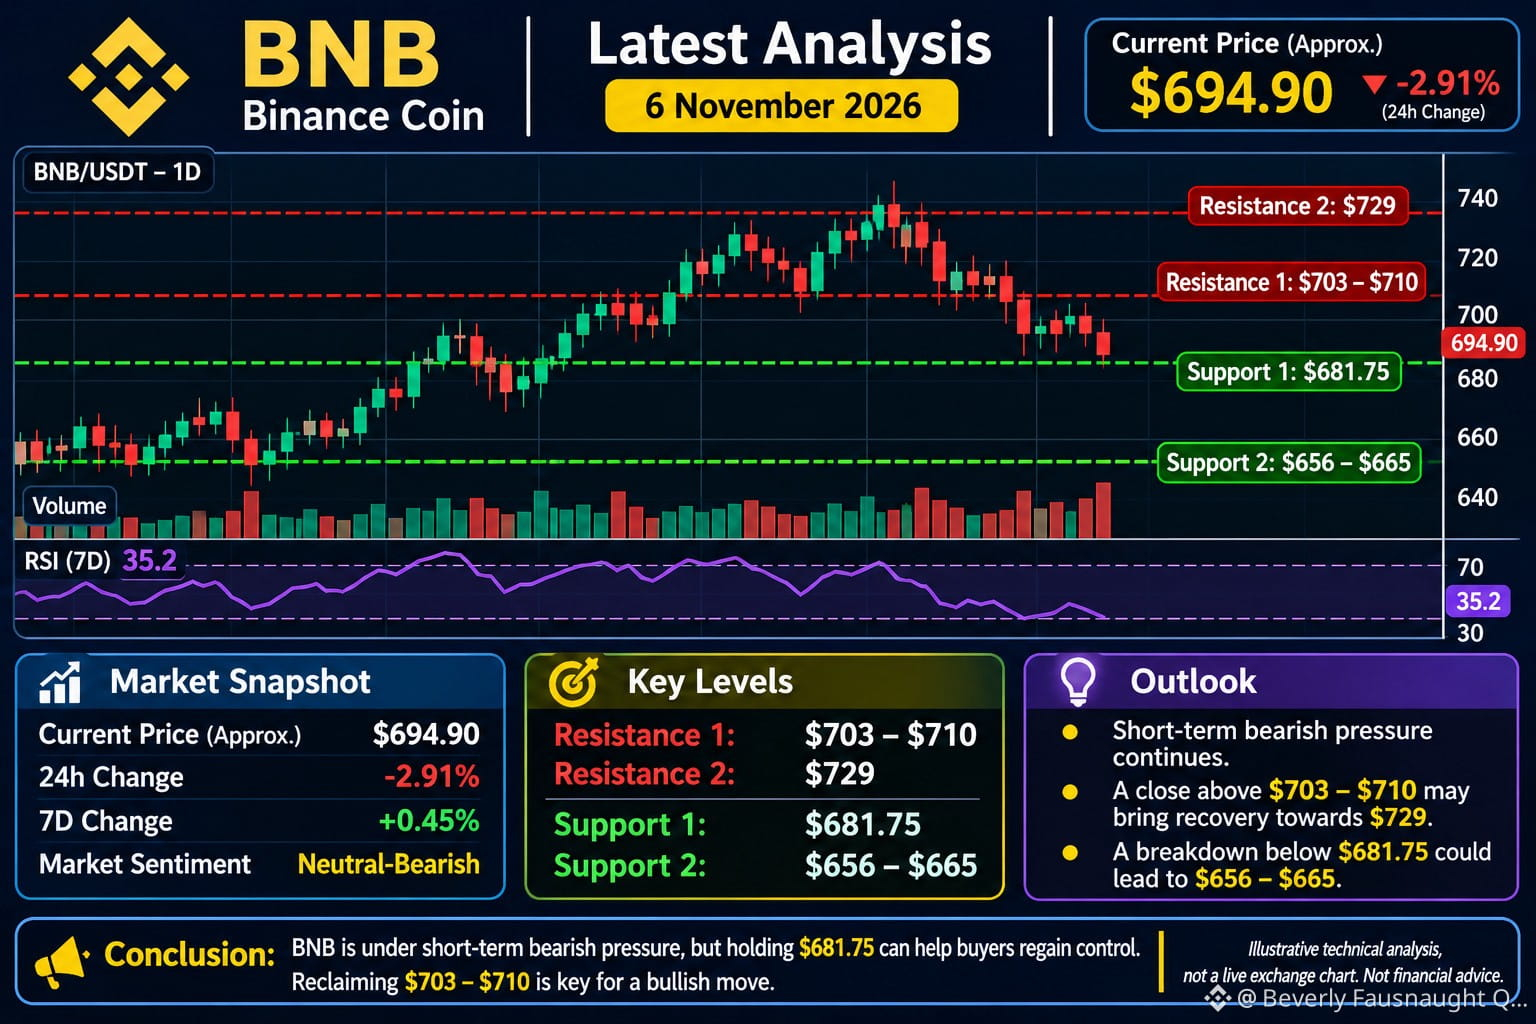
$BNB is facing selling pressure due to the broader crypto-market decline. Its short-term trend remains weak, although the RSI suggests the market is approaching oversold territory.
CoinMarketCap+1
Key technical levels
Support 1: $681.75
Support 2: $656–$665
Resistance 1: $703–$710
Resistance 2: $729
RSI: 35.2 – Weak / near oversold.
Trading outlook
Bullish scenario: If BNB reclaims $710, it could move towards $729.
Bearish scenario: If $681.75 breaks, downside towards $656–$665 becomes possible.
Conclusion: BNB is currently under bearish pressure. Watch the $681.75 support carefully. A recovery above $710 would improve the short-term outlook.
#BinanceReopensWithdrawalsForMoreAssets #ECBTargetsDigitalEuroIssuanceIn2029 #SouthKoreaDelaysCryptoTaxationUntil2029
{spot}(BNBUSDT)
$BNB is facing selling pressure due to the broader crypto-market decline. Its short-term trend remains weak, although the RSI suggests the market is approaching oversold territory.
CoinMarketCap+1
Key technical levels
Support 1: $681.75
Support 2: $656–$665
Resistance 1: $703–$710
Resistance 2: $729
RSI: 35.2 – Weak / near oversold.
Trading outlook
Bullish scenario: If BNB reclaims $710, it could move towards $729.
Bearish scenario: If $681.75 breaks, downside towards $656–$665 becomes possible.
Conclusion: BNB is currently under bearish pressure. Watch the $681.75 support carefully. A recovery above $710 would improve the short-term outlook.
#BinanceReopensWithdrawalsForMoreAssets #ECBTargetsDigitalEuroIssuanceIn2029 #SouthKoreaDelaysCryptoTaxationUntil2029
CoinMarketCap+1
Key technical levels
Support 1: $681.75
Support 2: $656–$665
Resistance 1: $703–$710
Resistance 2: $729
RSI: 35.2 – Weak / near oversold.
Trading outlook
Bullish scenario: If BNB reclaims $710, it could move towards $729.
Bearish scenario: If $681.75 breaks, downside towards $656–$665 becomes possible.
Conclusion: BNB is currently under bearish pressure. Watch the $681.75 support carefully. A recovery above $710 would improve the short-term outlook.
#BinanceReopensWithdrawalsForMoreAssets #ECBTargetsDigitalEuroIssuanceIn2029 #SouthKoreaDelaysCryptoTaxationUntil2029
70
·
--
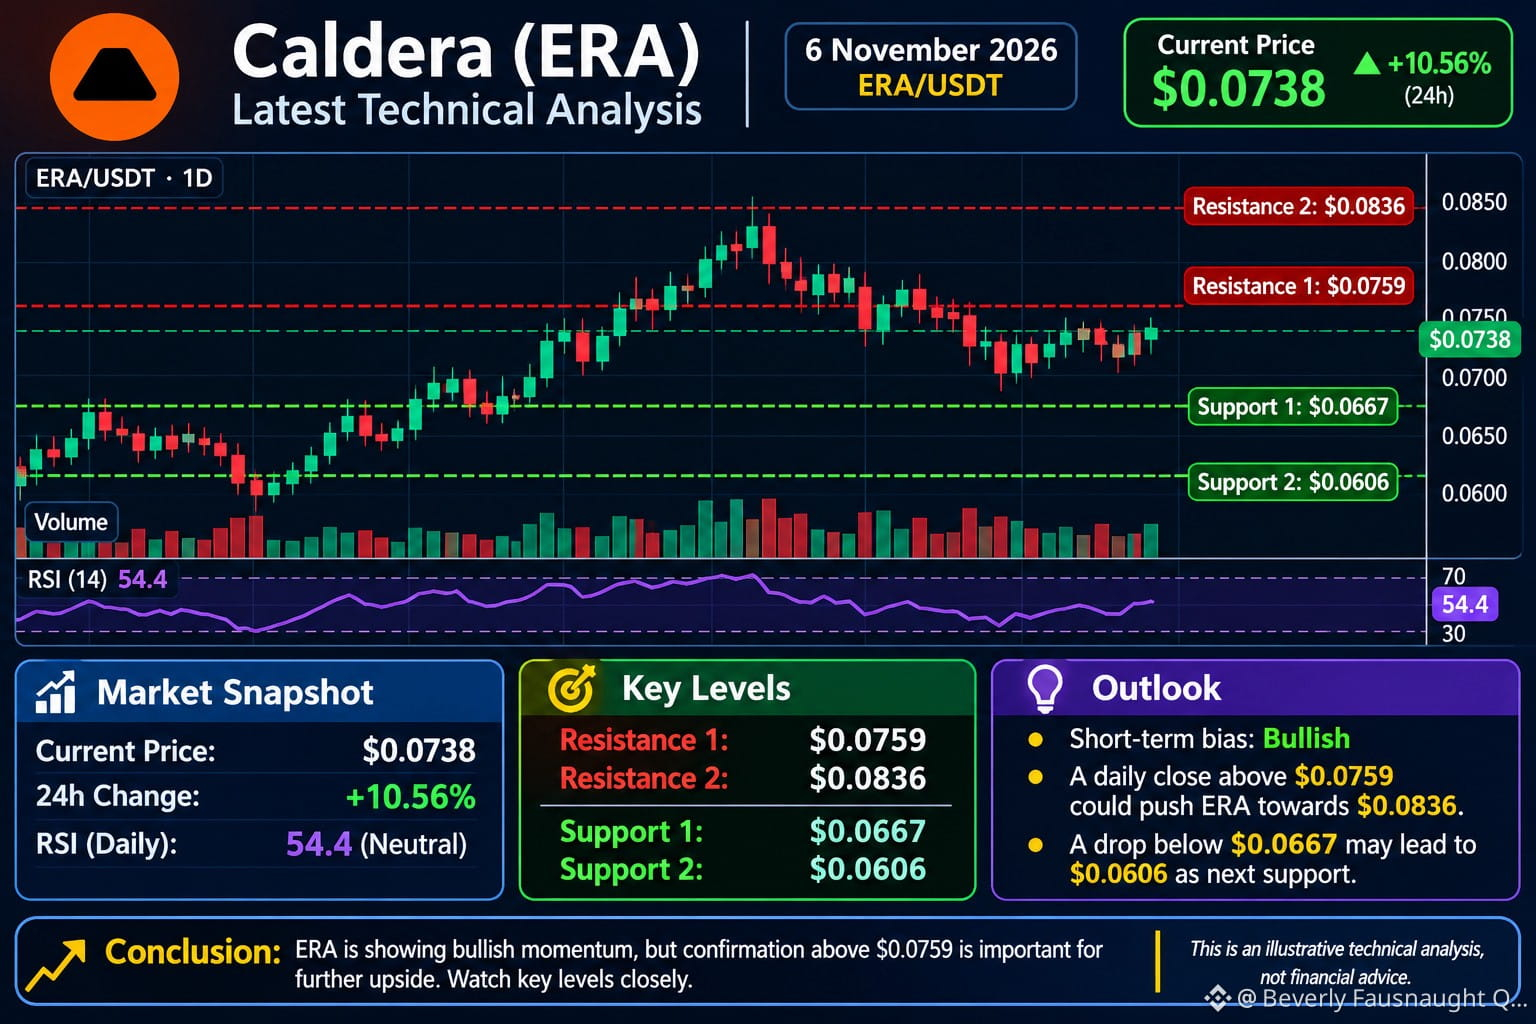
$ERA Current price: Approximately $0.0738 (+10.56% in 24 hours).
CoinMarketCap+1
Technical analysis
Support 1: $0.0667
Support 2: $0.0606
Resistance 1: $0.0759
Resistance 2: $0.0836
RSI: 54.4 – Neutral.
Trend: Daily bullish, but short-term volatility remains high.
Conclusion: ERA is showing positive momentum. A daily close above $0.0759 could open the way towards $0.0836. However, losing $0.0667 would weaken the bullish setup
#BinanceReopensWithdrawalsForMoreAssets #$2TWipedOutHedgeFundsFaceLiquidation #SouthKoreaDelaysCryptoTaxationUntil2029
{spot}(ERAUSDT)
$ERA Current price: Approximately $0.0738 (+10.56% in 24 hours).
CoinMarketCap+1
Technical analysis
Support 1: $0.0667
Support 2: $0.0606
Resistance 1: $0.0759
Resistance 2: $0.0836
RSI: 54.4 – Neutral.
Trend: Daily bullish, but short-term volatility remains high.
Conclusion: ERA is showing positive momentum. A daily close above $0.0759 could open the way towards $0.0836. However, losing $0.0667 would weaken the bullish setup
#BinanceReopensWithdrawalsForMoreAssets #$2TWipedOutHedgeFundsFaceLiquidation #SouthKoreaDelaysCryptoTaxationUntil2029
CoinMarketCap+1
Technical analysis
Support 1: $0.0667
Support 2: $0.0606
Resistance 1: $0.0759
Resistance 2: $0.0836
RSI: 54.4 – Neutral.
Trend: Daily bullish, but short-term volatility remains high.
Conclusion: ERA is showing positive momentum. A daily close above $0.0759 could open the way towards $0.0836. However, losing $0.0667 would weaken the bullish setup
#BinanceReopensWithdrawalsForMoreAssets #$2TWipedOutHedgeFundsFaceLiquidation #SouthKoreaDelaysCryptoTaxationUntil2029
161
·
--
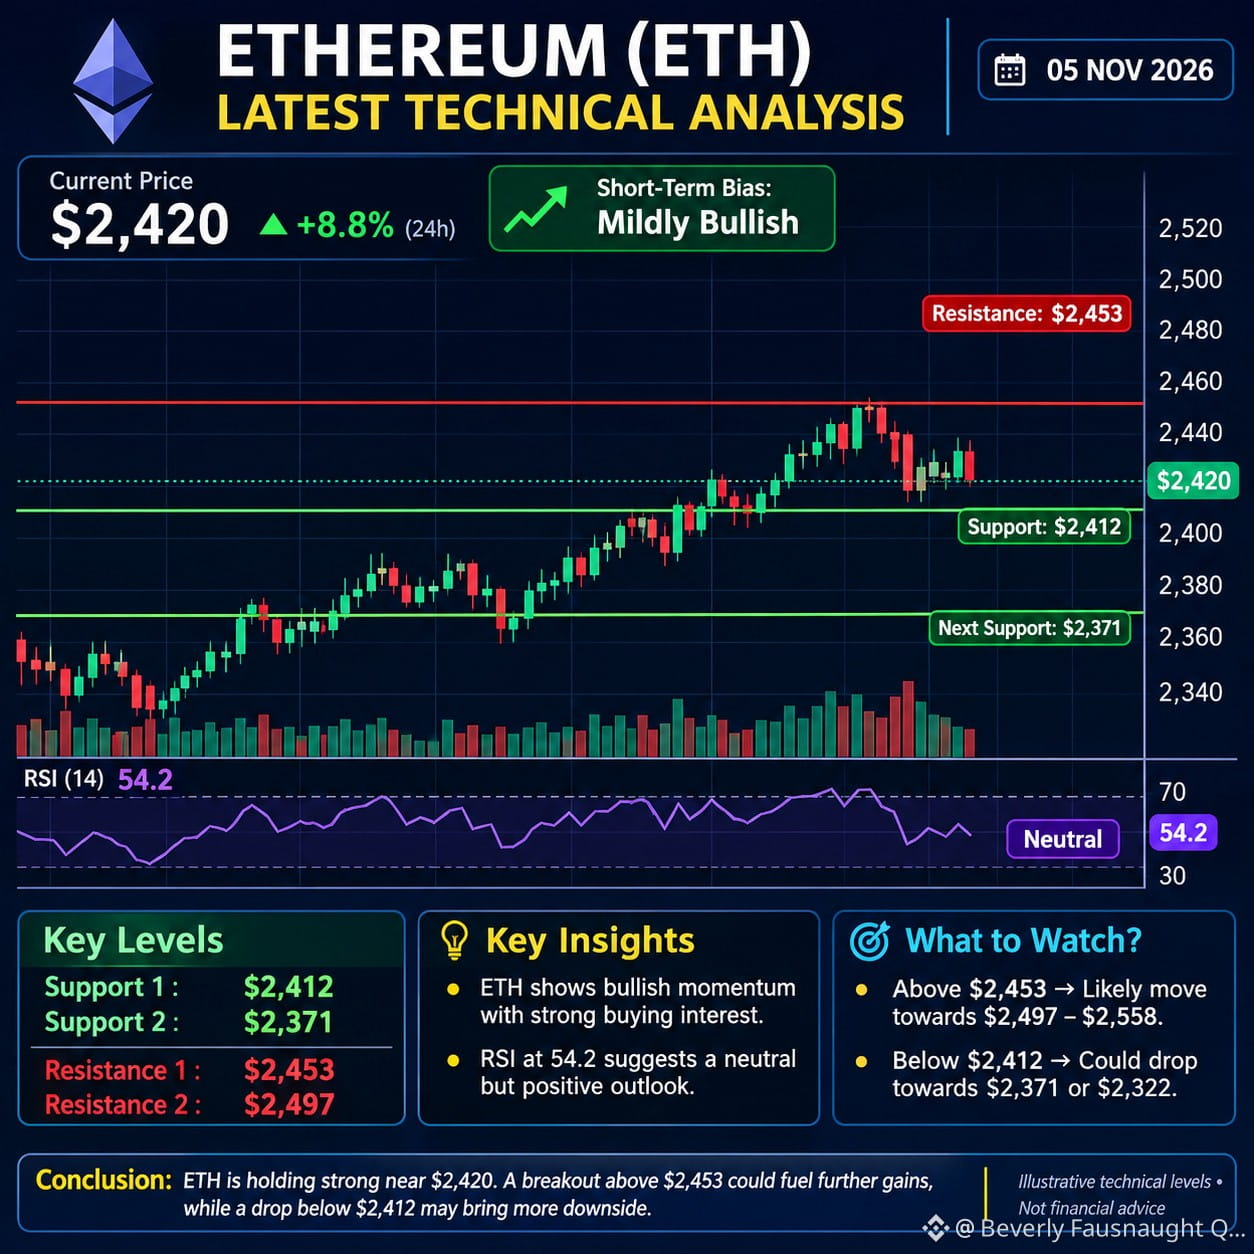
Technical Analysis $ETH
Trend: Short-term bullish momentum.
Support: $2,412, then $2,371.
Resistance: $2,453, then $2,497.
RSI: 54.2 (daily), indicating room for further movement.
Market sentiment: Buyers currently have the advantage, but volatility is high.
Short-term prediction
Bullish scenario: A breakout above $2,453 could push ETH towards $2,497–$2,558.
Bearish scenario: A fall below $2,412 could bring prices towards $2,371 or $2,322.
Conclusion: ETH currently shows bullish momentum, supported by increased trading volume and a broader crypto-market recovery. However, confirmation above $2,453 is important before expecting
{spot}(ETHUSDT)
further upside.
#BinanceReopensWithdrawalsForMoreAssets #BTCRebounds80K #Binance98PercentReplenished
Technical Analysis $ETH
Trend: Short-term bullish momentum.
Support: $2,412, then $2,371.
Resistance: $2,453, then $2,497.
RSI: 54.2 (daily), indicating room for further movement.
Market sentiment: Buyers currently have the advantage, but volatility is high.
Short-term prediction
Bullish scenario: A breakout above $2,453 could push ETH towards $2,497–$2,558.
Bearish scenario: A fall below $2,412 could bring prices towards $2,371 or $2,322.
Conclusion: ETH currently shows bullish momentum, supported by increased trading volume and a broader crypto-market recovery. However, confirmation above $2,453 is important before expecting
further upside.
#BinanceReopensWithdrawalsForMoreAssets #BTCRebounds80K #Binance98PercentReplenished
Trend: Short-term bullish momentum.
Support: $2,412, then $2,371.
Resistance: $2,453, then $2,497.
RSI: 54.2 (daily), indicating room for further movement.
Market sentiment: Buyers currently have the advantage, but volatility is high.
Short-term prediction
Bullish scenario: A breakout above $2,453 could push ETH towards $2,497–$2,558.
Bearish scenario: A fall below $2,412 could bring prices towards $2,371 or $2,322.
Conclusion: ETH currently shows bullish momentum, supported by increased trading volume and a broader crypto-market recovery. However, confirmation above $2,453 is important before expecting
further upside.
#BinanceReopensWithdrawalsForMoreAssets #BTCRebounds80K #Binance98PercentReplenished
73
Log in to explore more content
Join global crypto users on Binance Square
⚡️ Get latest and useful information about crypto.
💬 Trusted by the world’s largest crypto exchange.
👍 Discover real insights from verified creators.
Email / Phone number
Trending Topics
CPITestsDecemberRateOutlook
724,118 views
3,417 Discussing
October CPI Seen Up 0.3%, Keeping Fed on Course for December Rate Increase
Binance News
·6 Likes
·7.8k views
NvidiaInvestigatesAfterHuang’sAffairApology
281,004 views
2,195 Discussing
AnthropicRejectsIPODelayValuationinQuestion
73,239 views
687 Discussing