

Trading Different
2k Posts

Trading Different
Report
Block User
Enhance your investments and trading strategy with our indicators.
Optimize your entry points.
Extend your take profits.
Minimize your stop loss.
118 Following
7.7K+ Followers
2.7K+ Liked
Posts
All
Quotes
Videos
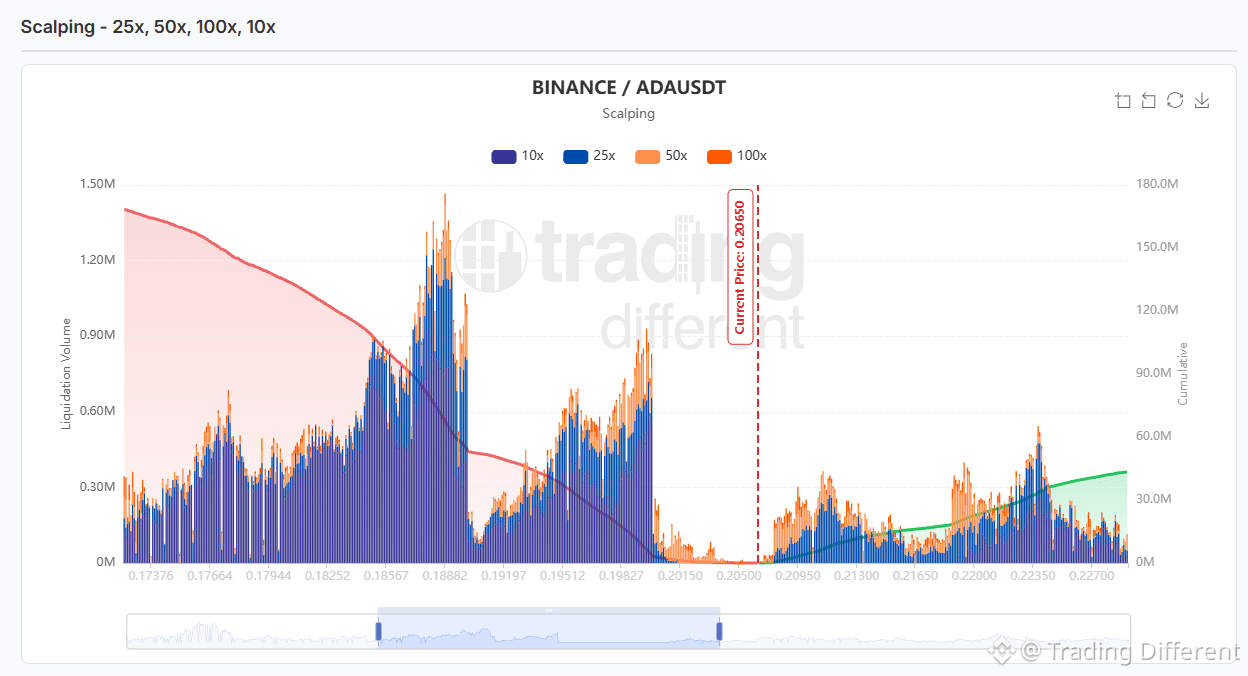
#ADA | Cardano scalping liquidation map
Current price: 0.2065
🔴 Shorts exposed above:
• 0.2080–0.2130: a first pocket close to the price, with a peak near 0.2115
• 0.2190–0.2260: the strongest block above, with a peak near 0.2235
🟢 Longs exposed below:
• 0.2010–0.2060: an almost-empty gap, with only thin 50x bands
• 0.1935–0.2000: a dense cluster, with a peak near 0.1990
• 0.1855–0.1905: the highest peak on the entire map, near 0.1888
• 0.1735–0.1830: a broad base of 10x and 25x positions
🔥 Accumulated long liquidations below are about 3.5 times those of shorts above, but liquidity above starts closer to the price.
The map does not indicate the price direction. It shows where leveraged positions are located that would be liquidated if the price reaches those levels.
👉 tradingdifferent.com/es/dashboard/liquidation-heatmap?code=binance-square
{future}(ADAUSDT)
#ADA | Cardano scalping liquidation map
Current price: 0.2065
🔴 Shorts exposed above:
• 0.2080–0.2130: a first pocket close to the price, with a peak near 0.2115
• 0.2190–0.2260: the strongest block above, with a peak near 0.2235
🟢 Longs exposed below:
• 0.2010–0.2060: an almost-empty gap, with only thin 50x bands
• 0.1935–0.2000: a dense cluster, with a peak near 0.1990
• 0.1855–0.1905: the highest peak on the entire map, near 0.1888
• 0.1735–0.1830: a broad base of 10x and 25x positions
🔥 Accumulated long liquidations below are about 3.5 times those of shorts above, but liquidity above starts closer to the price.
The map does not indicate the price direction. It shows where leveraged positions are located that would be liquidated if the price reaches those levels.
👉 tradingdifferent.com/es/dashboard/liquidation-heatmap?code=binance-square
436
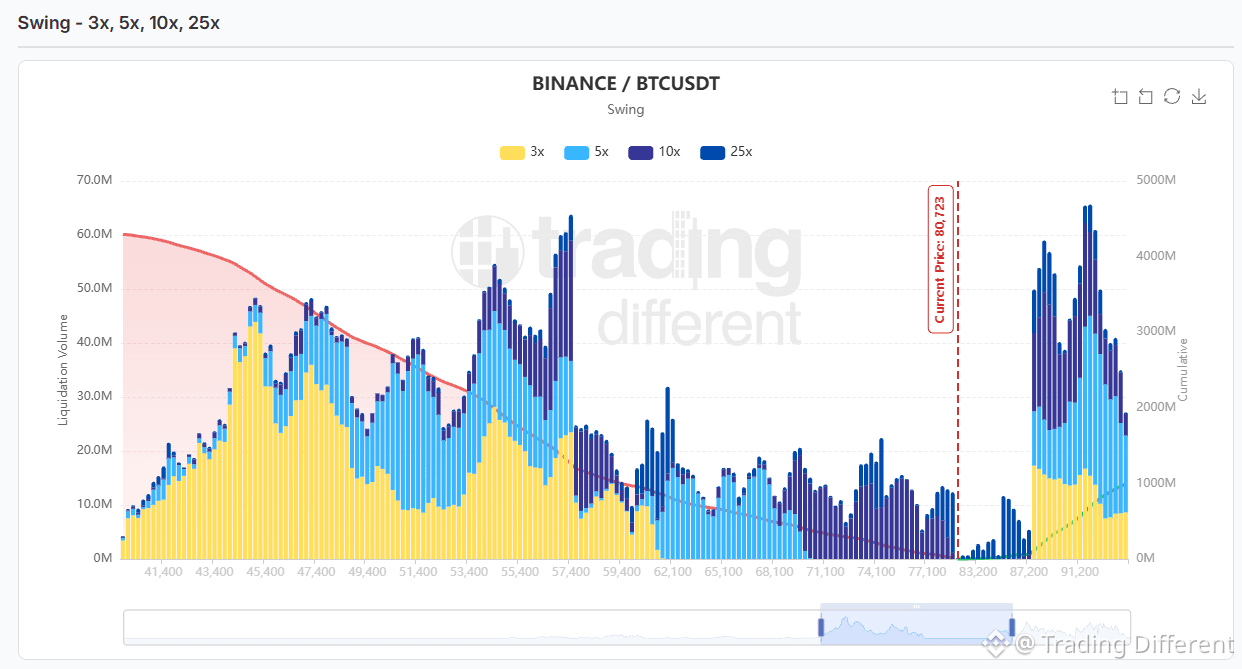
#BTC | Bitcoin Swing Liquidation Map
Current price: 80.723
🔴 Shorts exposed above:
• There’s an almost empty gap up to ~87,200
• 87,200–92,500: the main cluster, with a peak near 91,700 and lots of 10x and 25x
🟢 Longs exposed below:
• 69,000–80,000: steady but moderate pockets of 10x and 25x
• 53,400–57,600: the largest cluster below, with a peak near 57,400
• 44,400–48,000: a broad base of 3x and 5x
🔥 Cumulative long liquidations below are about 4 times those of shorts above. On a swing timeframe, the nearest major liquidity is in the shorts cluster, ~8% from the price. The large longs cluster is ~30% below.
The map does not indicate the price direction. It shows where leveraged positions would be liquidated if the price reaches those levels.
👉 tradingdifferent.com/es/dashboard/liquidation-heatmap?code=binance-square
{future}(BTCUSDT)
#BTC | Bitcoin Swing Liquidation Map
Current price: 80.723
🔴 Shorts exposed above:
• There’s an almost empty gap up to ~87,200
• 87,200–92,500: the main cluster, with a peak near 91,700 and lots of 10x and 25x
🟢 Longs exposed below:
• 69,000–80,000: steady but moderate pockets of 10x and 25x
• 53,400–57,600: the largest cluster below, with a peak near 57,400
• 44,400–48,000: a broad base of 3x and 5x
🔥 Cumulative long liquidations below are about 4 times those of shorts above. On a swing timeframe, the nearest major liquidity is in the shorts cluster, ~8% from the price. The large longs cluster is ~30% below.
The map does not indicate the price direction. It shows where leveraged positions would be liquidated if the price reaches those levels.
👉 tradingdifferent.com/es/dashboard/liquidation-heatmap?code=binance-square
1
2
578
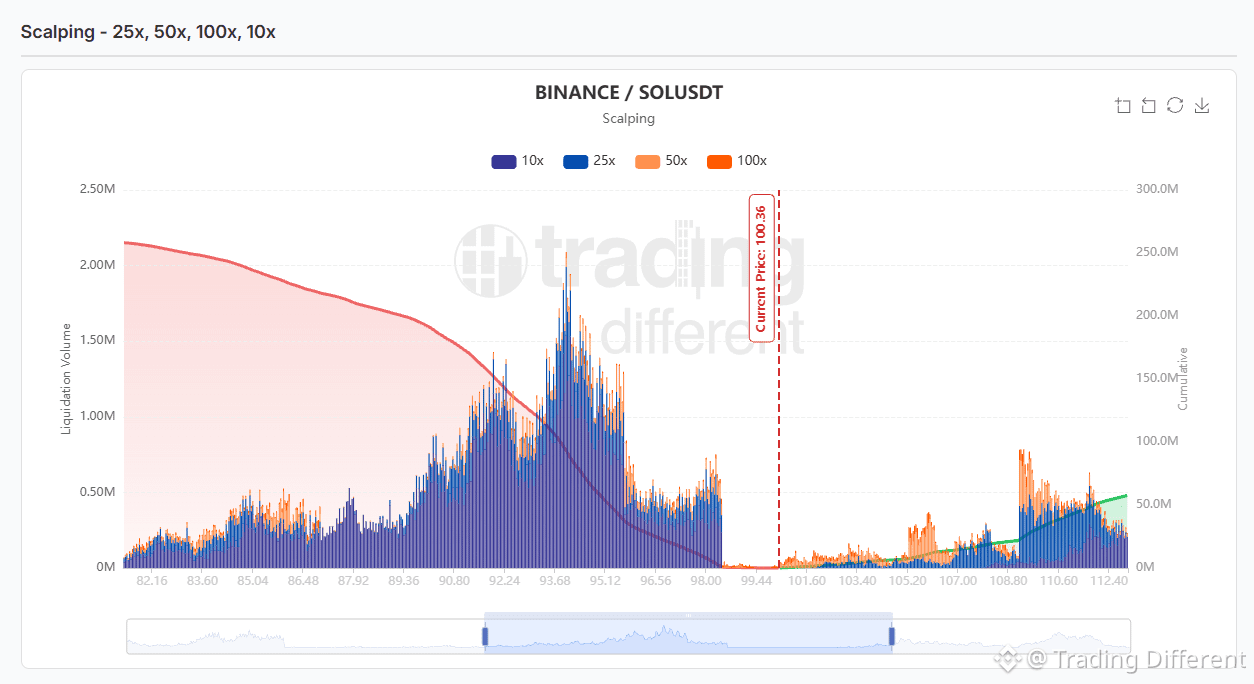
#sol | Solana scalping liquidation map
Current price: 100.36
🔴 Shorts exposed above:
• 101.60–105: thin bands of 50x positions close to the price
• ~105.5: a 50x pocket
• 109.20–112.40: the strongest block above, with a peak near 109.3
🟢 Longs exposed below:
• 98.10–99.40: an almost empty gap
• 95.50–98.10: a steady cluster
• 90.80–95.10: the main block, with the highest peak on the entire map near 93.7
• 82–90: a lighter base of 10x and 25x positions
🔥 Cumulative long liquidations below are nearly 5 times those of shorts above.
The map does not indicate the price direction. It shows where leveraged positions are that would be liquidated if the price reaches those levels.
👉 tradingdifferent.com/es/dashboard/liquidation-heatmap?code=binance-square
{future}(SOLUSDT)
#sol | Solana scalping liquidation map
Current price: 100.36
🔴 Shorts exposed above:
• 101.60–105: thin bands of 50x positions close to the price
• ~105.5: a 50x pocket
• 109.20–112.40: the strongest block above, with a peak near 109.3
🟢 Longs exposed below:
• 98.10–99.40: an almost empty gap
• 95.50–98.10: a steady cluster
• 90.80–95.10: the main block, with the highest peak on the entire map near 93.7
• 82–90: a lighter base of 10x and 25x positions
🔥 Cumulative long liquidations below are nearly 5 times those of shorts above.
The map does not indicate the price direction. It shows where leveraged positions are that would be liquidated if the price reaches those levels.
👉 tradingdifferent.com/es/dashboard/liquidation-heatmap?code=binance-square
1
1k
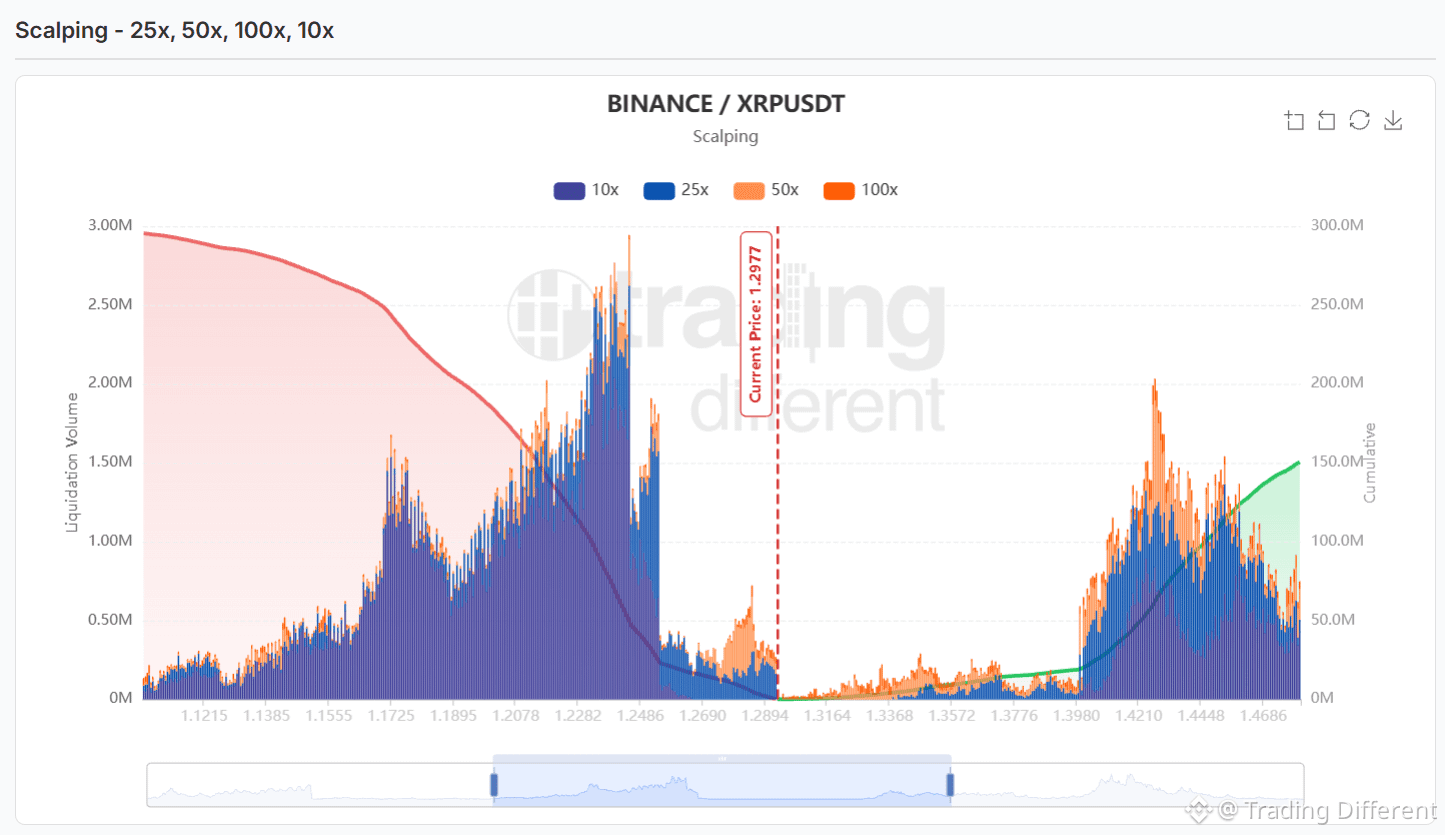
#xrp | XRP scalping liquidation map
Current price: 1.2977
🔴 Shorts exposed above:
• Up to ~1.3980, there is little liquidity, just thin 50x bands
• 1.4000–1.4700: the main block, with the strongest peak near 1.4250
🟢 Longs exposed below:
• 1.2690–1.2950: a 50x pocket right next to the price
• ~1.2282–1.2486: the highest peak on the entire map
• 1.1725–1.2200: a dense block of 10x and 25x positions
🔥 Accumulated long liquidations below are about 2 times the short liquidations above. Also, the pressure below is much closer: the long peak is ~5% away, while the short peak is ~10% away.
The map does not indicate the direction of the price. It shows where leveraged positions would be liquidated if the price reaches those levels.
👉 tradingdifferent.com/es/dashboard/liquidation-heatmap?code=binance-square
1
857
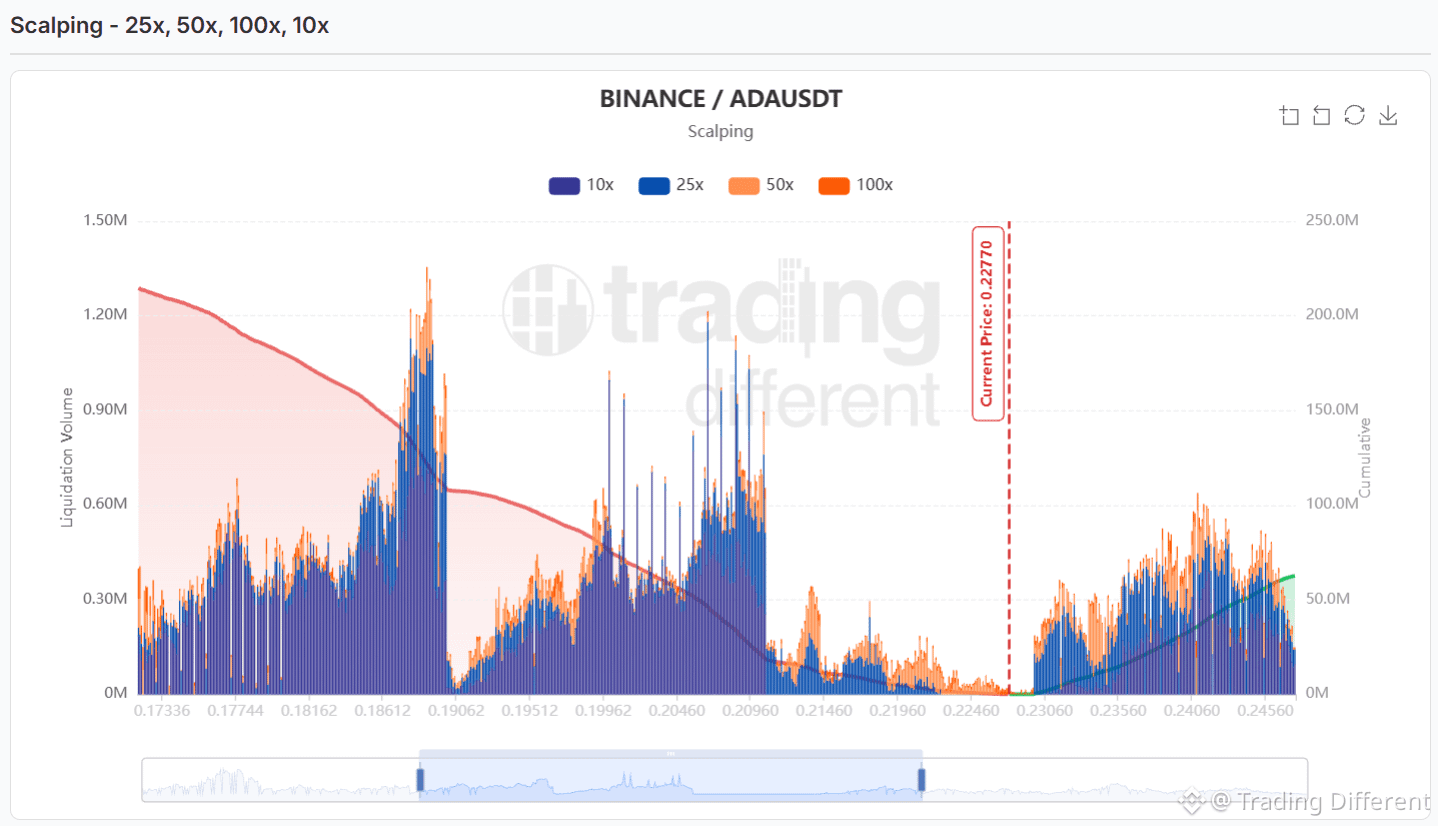
#ADA | Cardano scalping liquidation map
Current price: 0.2277
⚡ The rally has already swept the 0.2224–0.2260 short pocket.
🔴 Exposed shorts above:
• There’s an empty gap up to ~0.2300
• 0.2306–0.2356: a first pocket, with lots of 50x positions
• 0.2380–0.2456: the strongest cluster above, with a peak near 0.2406
🟢 Exposed longs below:
• 0.2146–0.2246: thin bands, with lots of 50x/100x positions
• 0.2000–0.2096: a dense cluster with pronounced peaks
• ~0.1880–0.1895: the highest peak on the entire map
• 0.173–0.186: a broad base of 10x and 25x positions
🔥 Cumulative long liquidations below are about 3 times higher than short liquidations above.
The map does not indicate the price direction. It shows where leveraged positions would be liquidated if the price reaches those levels.
👉 tradingdifferent.com/es/dashboard/liquidation-heatmap?code=binance-square
{future}(ADAUSDT)
#ADA | Cardano scalping liquidation map
Current price: 0.2277
⚡ The rally has already swept the 0.2224–0.2260 short pocket.
🔴 Exposed shorts above:
• There’s an empty gap up to ~0.2300
• 0.2306–0.2356: a first pocket, with lots of 50x positions
• 0.2380–0.2456: the strongest cluster above, with a peak near 0.2406
🟢 Exposed longs below:
• 0.2146–0.2246: thin bands, with lots of 50x/100x positions
• 0.2000–0.2096: a dense cluster with pronounced peaks
• ~0.1880–0.1895: the highest peak on the entire map
• 0.173–0.186: a broad base of 10x and 25x positions
🔥 Cumulative long liquidations below are about 3 times higher than short liquidations above.
The map does not indicate the price direction. It shows where leveraged positions would be liquidated if the price reaches those levels.
👉 tradingdifferent.com/es/dashboard/liquidation-heatmap?code=binance-square
1
630
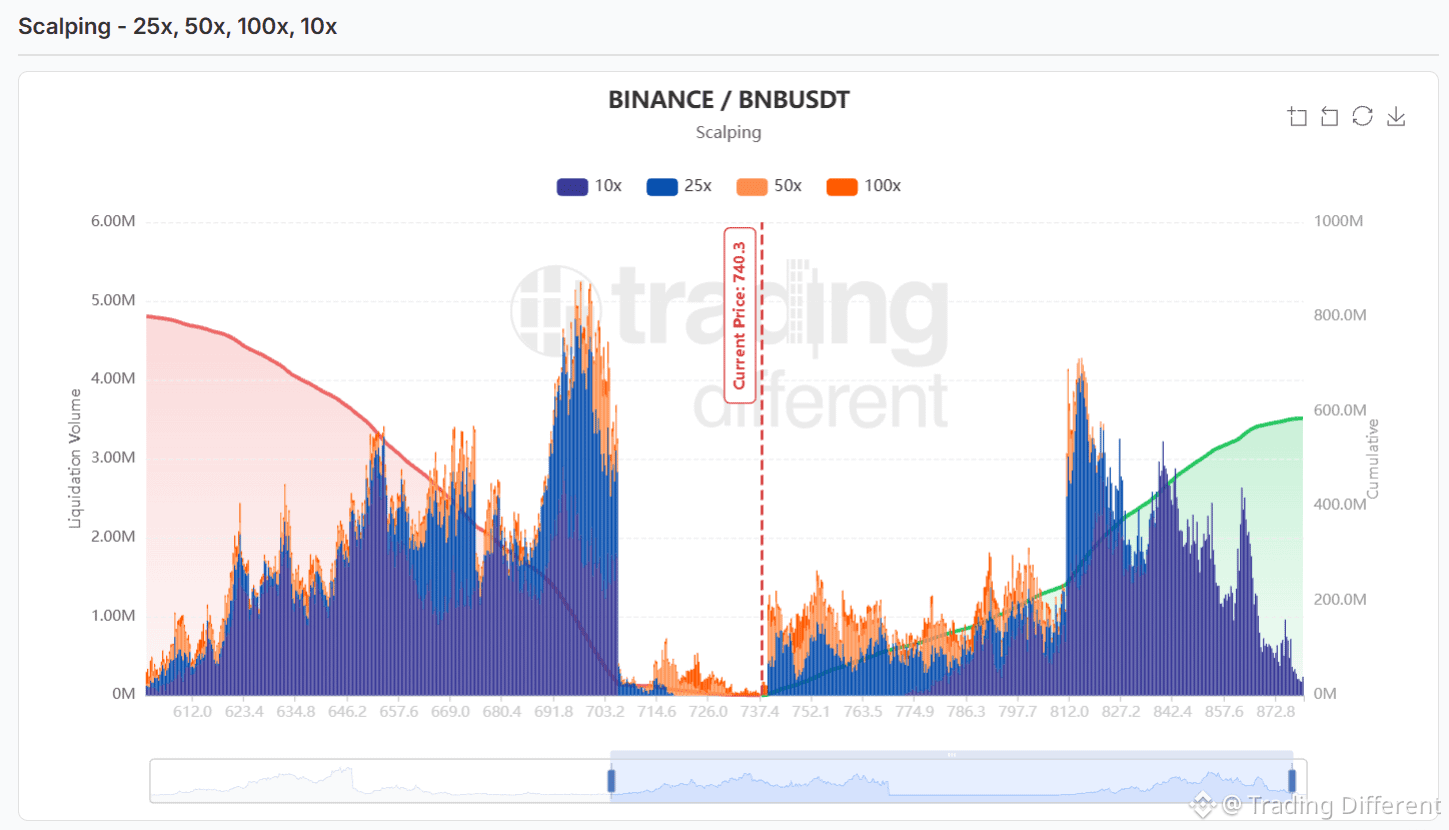
#BNB | BNB scalping liquidation map
Current price: 740.3
🔴 Shorts exposed above:
• 752–775: a 50x pocket right next to the price
• 786–805: an intermediate cluster
• ~812–827: the strongest peak above, with the high near 815
• ~842 and ~865: more blocks further up
🟢 Longs exposed below:
• 705–737: an almost empty gap, with just a small 100x pocket at 714–726
• ~692–703: the highest peak on the entire map
• 646–690: a dense 10x and 25x block
• 612–640: another base further down
🔥 The map is fairly balanced: the longs accumulated below slightly outnumber the shorts above. The difference is the distance, since the shorts start right next to the price, while the longs' peak is ~5% lower.
The map doesn't indicate the price direction. It shows where leveraged positions would be liquidated if the price reaches those levels.
👉 tradingdifferent.com/es/dashboard/liquidation-heatmap?code=binance-square
{future}(BNBUSDT)
#BNB | BNB scalping liquidation map
Current price: 740.3
🔴 Shorts exposed above:
• 752–775: a 50x pocket right next to the price
• 786–805: an intermediate cluster
• ~812–827: the strongest peak above, with the high near 815
• ~842 and ~865: more blocks further up
🟢 Longs exposed below:
• 705–737: an almost empty gap, with just a small 100x pocket at 714–726
• ~692–703: the highest peak on the entire map
• 646–690: a dense 10x and 25x block
• 612–640: another base further down
🔥 The map is fairly balanced: the longs accumulated below slightly outnumber the shorts above. The difference is the distance, since the shorts start right next to the price, while the longs' peak is ~5% lower.
The map doesn't indicate the price direction. It shows where leveraged positions would be liquidated if the price reaches those levels.
👉 tradingdifferent.com/es/dashboard/liquidation-heatmap?code=binance-square
2
933
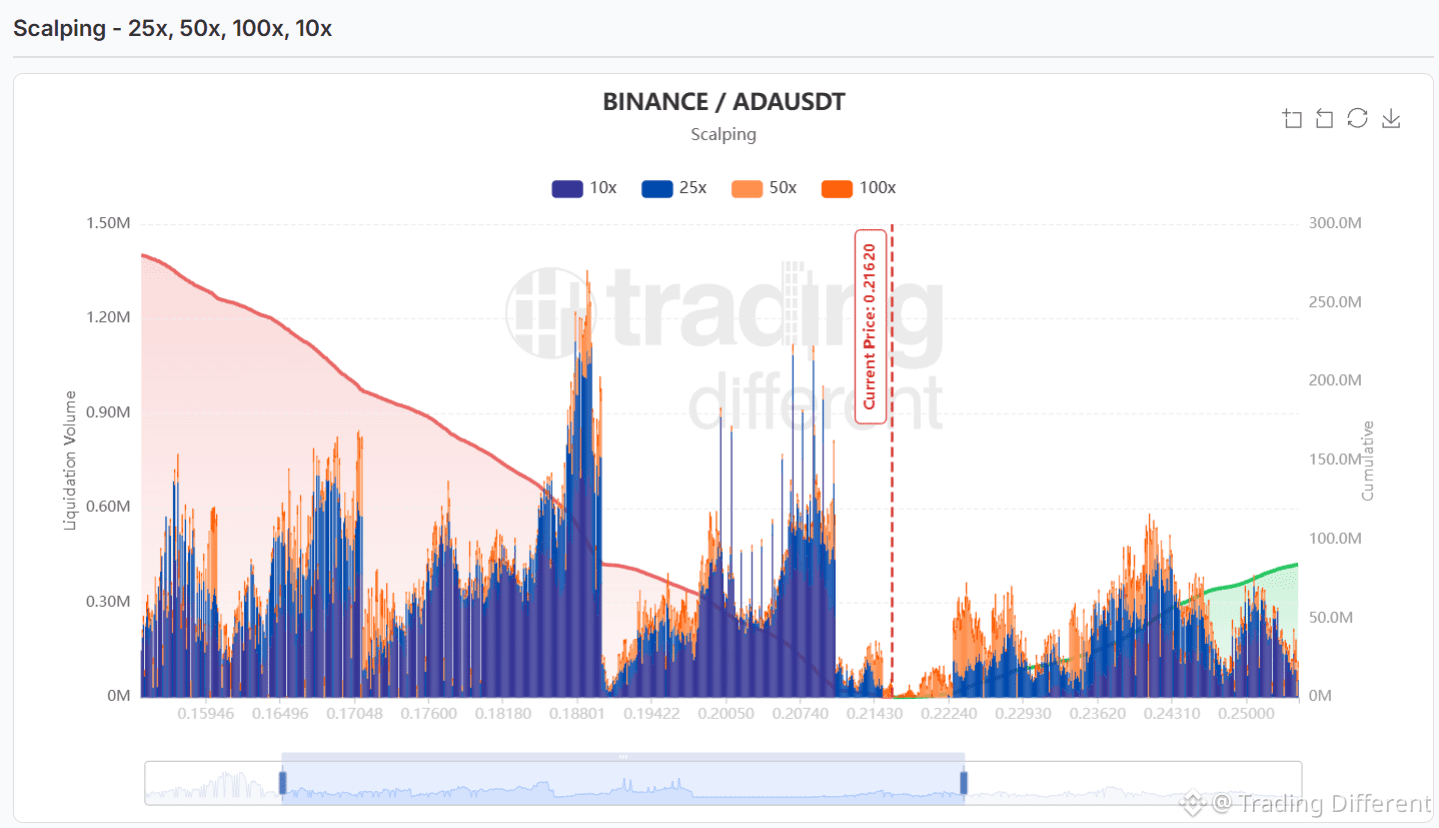
#ADA | Cardano scalping liquidation map
Current price: 0.2162
🔴 Shorts exposed above:
• 0.2224–0.2260: a 50x pocket near the price
• 0.2362–0.2440: the strongest cluster above, with a peak near 0.2420
• ~0.2500: another cluster higher up
🟢 Longs exposed below:
• ~0.2143–0.2150: a small first pocket
• 0.2005–0.2120: a dense cluster, with clear peaks near 0.207
• ~0.1880–0.1895: the highest peak on the entire map
• 0.159–0.184: a broad 10x and 25x base
🔥 Accumulated long liquidations below are about 3 times those of shorts above.
The map does not indicate the price direction. It shows where leveraged positions are located that would be liquidated if the price reaches those levels.
👉 tradingdifferent.com/es/dashboard/liquidation-heatmap?code=binance-square
{future}(ADAUSDT)
#ADA | Cardano scalping liquidation map
Current price: 0.2162
🔴 Shorts exposed above:
• 0.2224–0.2260: a 50x pocket near the price
• 0.2362–0.2440: the strongest cluster above, with a peak near 0.2420
• ~0.2500: another cluster higher up
🟢 Longs exposed below:
• ~0.2143–0.2150: a small first pocket
• 0.2005–0.2120: a dense cluster, with clear peaks near 0.207
• ~0.1880–0.1895: the highest peak on the entire map
• 0.159–0.184: a broad 10x and 25x base
🔥 Accumulated long liquidations below are about 3 times those of shorts above.
The map does not indicate the price direction. It shows where leveraged positions are located that would be liquidated if the price reaches those levels.
👉 tradingdifferent.com/es/dashboard/liquidation-heatmap?code=binance-square
1
1.2k
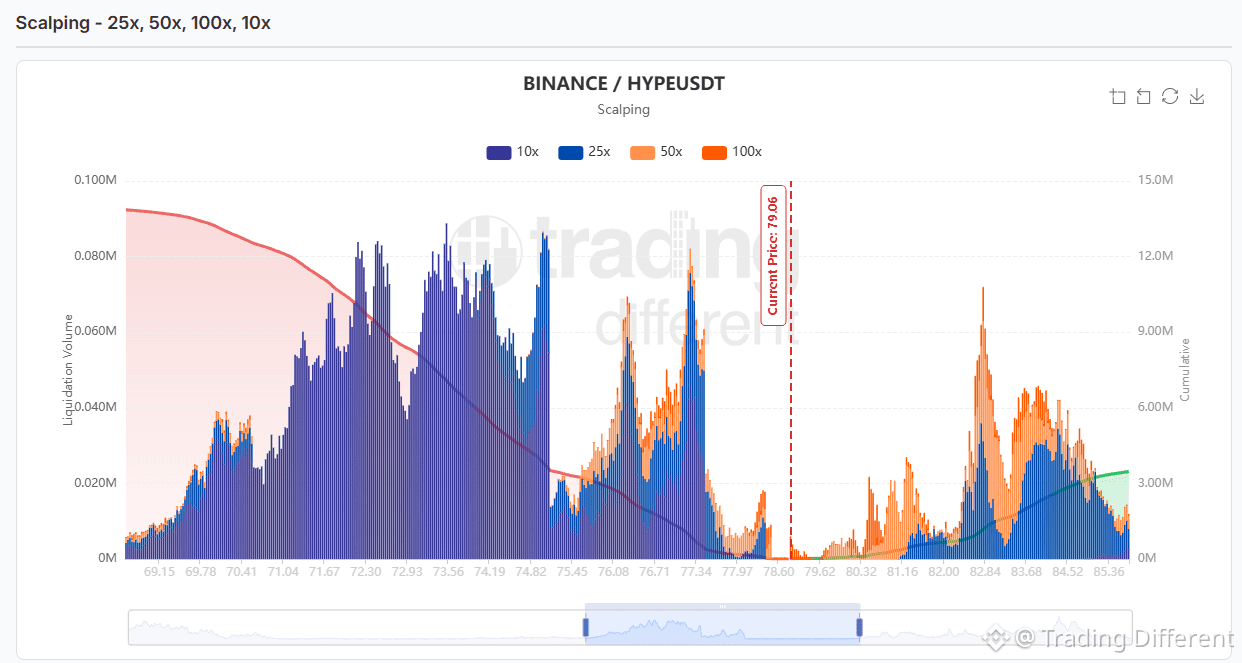
#hype | Hyperliquid liquidation map for scalping
Current price: 79.06
🔴 Shorts exposed above:
• 80.30–81.20: scattered 100x pockets
• ~82.84: the strongest peak above the price
• 83.30–84.50: a steady block just beyond
🟢 Longs exposed below:
• ~78.60: a small pocket, almost entirely 100x
• 76.00–77.40: a dense cluster with lots of 50x, peaking near 77.34
• 71.60–74.90: the main block, supported by 10x and 25x
🔥 Accumulated long liquidations below are about 4 times those of shorts above. There are high-leverage pockets on both sides near the price.
The map does not indicate the price direction. It shows where leveraged positions would be liquidated if the price reaches those levels.
👉 tradingdifferent.com/es/dashboard/liquidation-heatmap?code=binance-square
{future}(HYPEUSDT)
#hype | Hyperliquid liquidation map for scalping
Current price: 79.06
🔴 Shorts exposed above:
• 80.30–81.20: scattered 100x pockets
• ~82.84: the strongest peak above the price
• 83.30–84.50: a steady block just beyond
🟢 Longs exposed below:
• ~78.60: a small pocket, almost entirely 100x
• 76.00–77.40: a dense cluster with lots of 50x, peaking near 77.34
• 71.60–74.90: the main block, supported by 10x and 25x
🔥 Accumulated long liquidations below are about 4 times those of shorts above. There are high-leverage pockets on both sides near the price.
The map does not indicate the price direction. It shows where leveraged positions would be liquidated if the price reaches those levels.
👉 tradingdifferent.com/es/dashboard/liquidation-heatmap?code=binance-square
1
585
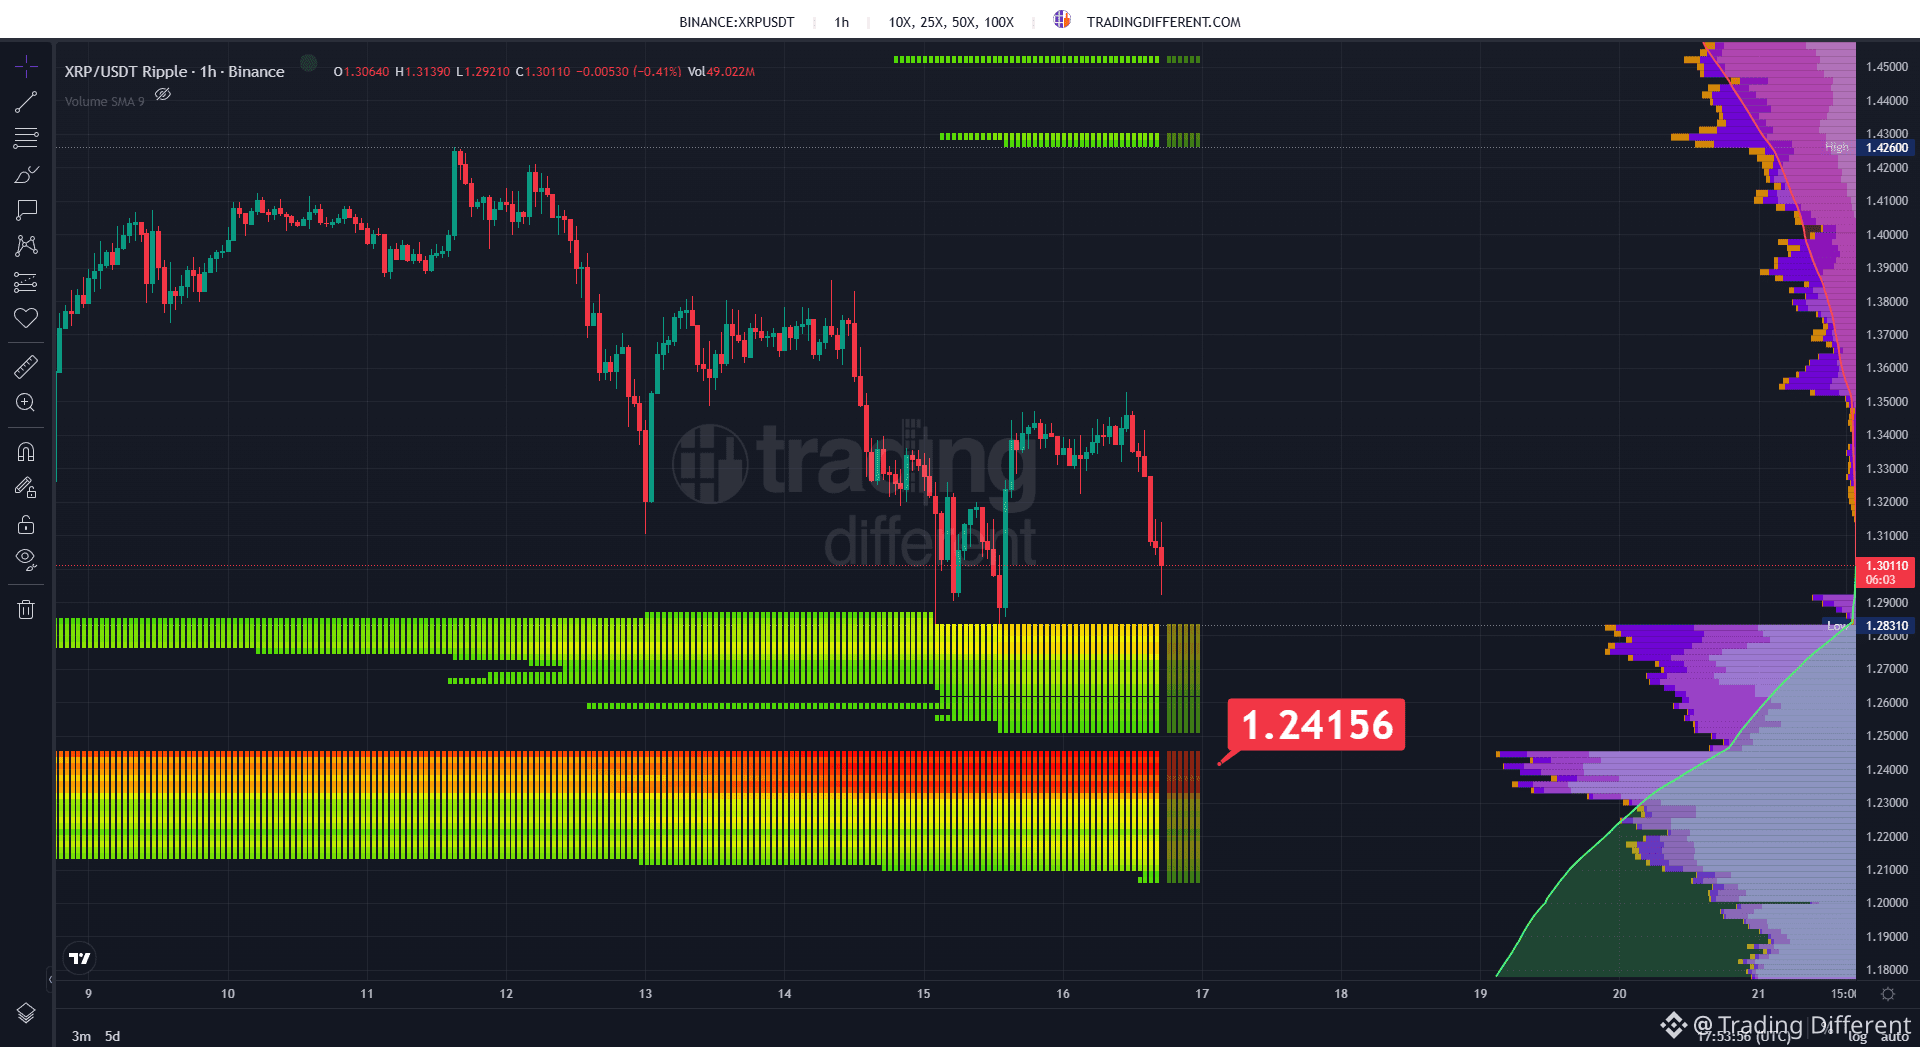
#Xrp🔥🔥 | XRP liquidation heatmap over 1h
Current price: 1.3011. In the selected range, the high is 1.4260 and the low is 1.2831.
🔴 Shorts exposed above:
~1.4300: a band just above the range high ~1.4500: another thinner line a little higher
🟢 Longs exposed below:
1.2550–1.2850: a heavily concentrated band, just below the range low 1.2100–1.2500: the most intense block on the entire map, with its core in red near 1.2416
🔥 XRP is falling toward its low, with the map’s two most heavily concentrated zones below. Above, by contrast, only thin lines remain, far from the price.
The map does not indicate the price direction. It shows where leveraged positions would be liquidated if the price reaches those levels.
👉 tradingdifferent.com/es/dashboard/liquidation-heatmap?code=binance-square
{future}(XRPUSDT)
#Xrp🔥🔥 | XRP liquidation heatmap over 1h
Current price: 1.3011. In the selected range, the high is 1.4260 and the low is 1.2831.
🔴 Shorts exposed above:
~1.4300: a band just above the range high ~1.4500: another thinner line a little higher
🟢 Longs exposed below:
1.2550–1.2850: a heavily concentrated band, just below the range low 1.2100–1.2500: the most intense block on the entire map, with its core in red near 1.2416
🔥 XRP is falling toward its low, with the map’s two most heavily concentrated zones below. Above, by contrast, only thin lines remain, far from the price.
The map does not indicate the price direction. It shows where leveraged positions would be liquidated if the price reaches those levels.
👉 tradingdifferent.com/es/dashboard/liquidation-heatmap?code=binance-square
1.1k
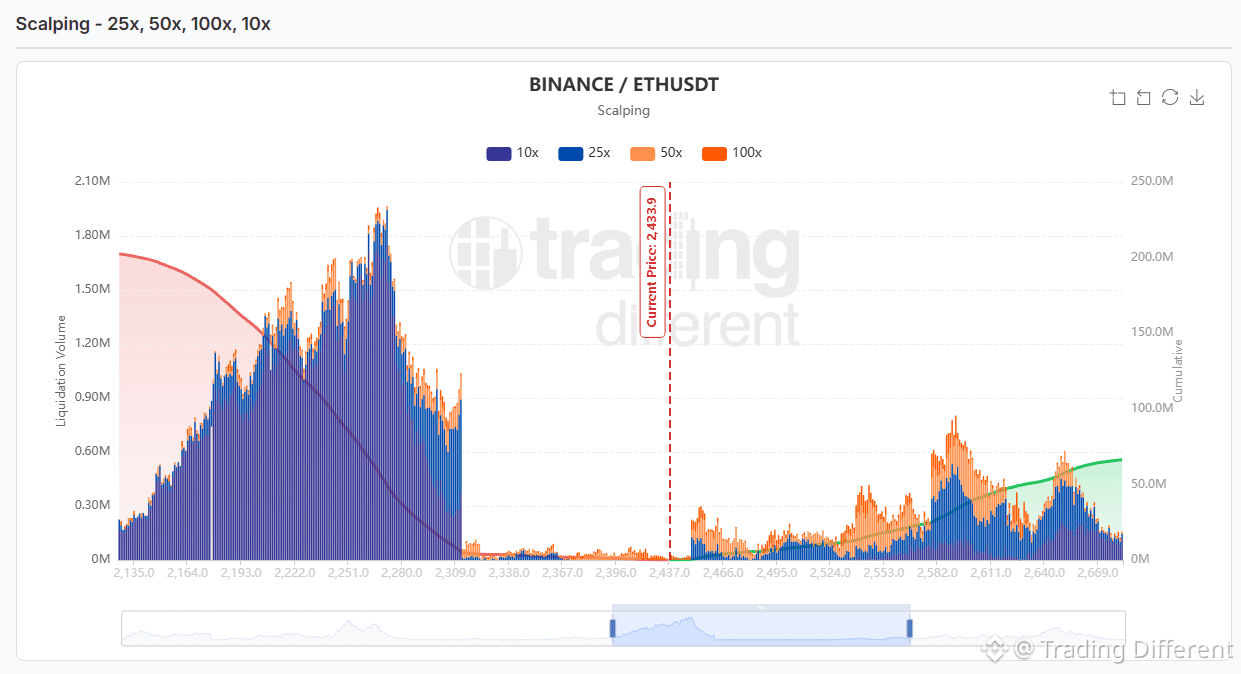
#ETH | Ethereum scalping liquidation map
Current price: 2,433.9
🔴 Shorts exposed above:
• 2,450–2,470: the first pocket, close to the price and with lots of 50x/100x positions
• ~2,555 and ~2,585–2,595: the strongest cluster above
• ~2,650: another cluster further up
🟢 Longs exposed below:
• There’s an almost empty gap from the price down to ~2,310
• 2,135–2,310: the main cluster, with the map’s highest peak near ~2,265
🔥 The long liquidations accumulating below are about 3 times the short liquidations above. The long side is heavier, but it’s ~5% away from the price; shorts start just above.
The map does not indicate the price direction. It shows where leveraged positions are located that would be liquidated if the price reaches those levels.
👉 tradingdifferent.com/es/dashboard/liquidation-heatmap?code=binance-square
{future}(ETHUSDT)
#ETH | Ethereum scalping liquidation map
Current price: 2,433.9
🔴 Shorts exposed above:
• 2,450–2,470: the first pocket, close to the price and with lots of 50x/100x positions
• ~2,555 and ~2,585–2,595: the strongest cluster above
• ~2,650: another cluster further up
🟢 Longs exposed below:
• There’s an almost empty gap from the price down to ~2,310
• 2,135–2,310: the main cluster, with the map’s highest peak near ~2,265
🔥 The long liquidations accumulating below are about 3 times the short liquidations above. The long side is heavier, but it’s ~5% away from the price; shorts start just above.
The map does not indicate the price direction. It shows where leveraged positions are located that would be liquidated if the price reaches those levels.
👉 tradingdifferent.com/es/dashboard/liquidation-heatmap?code=binance-square
2
886
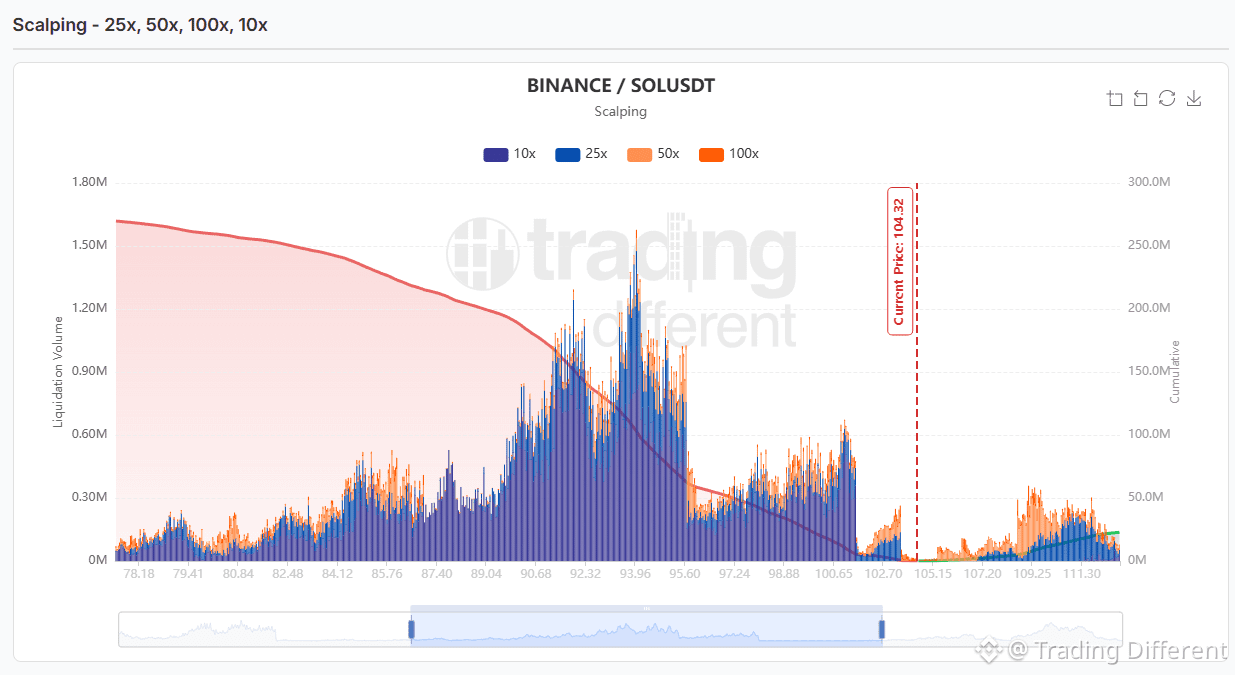
#SOL | Solana liquidation map for scalping
Current price: 104.32
🔴 Shorts exposed above:
• Low liquidity up to ~107
• 109.20–111.30: the strongest block above the price, with lots of 50x
🟢 Longs exposed below:
• ~102.70: a small first pocket
• 97.20–100.70: a steady cluster, with a peak near 100.65
• 90.70–95.60: the main block, with the map’s highest peak around ~94
• ~85.80: an intermediate support zone for 10x and 25x
🔥 Long liquidations accumulated below the price exceed short liquidations above it by more than 10 times. Almost all the liquidity on the map is below.
The map does not indicate the price direction. It shows where leveraged positions would be liquidated if the price reaches those levels.
👉 tradingdifferent.com/es/dashboard/liquidation-heatmap?code=binance-square
{future}(SOLUSDT)
#SOL | Solana liquidation map for scalping
Current price: 104.32
🔴 Shorts exposed above:
• Low liquidity up to ~107
• 109.20–111.30: the strongest block above the price, with lots of 50x
🟢 Longs exposed below:
• ~102.70: a small first pocket
• 97.20–100.70: a steady cluster, with a peak near 100.65
• 90.70–95.60: the main block, with the map’s highest peak around ~94
• ~85.80: an intermediate support zone for 10x and 25x
🔥 Long liquidations accumulated below the price exceed short liquidations above it by more than 10 times. Almost all the liquidity on the map is below.
The map does not indicate the price direction. It shows where leveraged positions would be liquidated if the price reaches those levels.
👉 tradingdifferent.com/es/dashboard/liquidation-heatmap?code=binance-square
2
2
1.7k
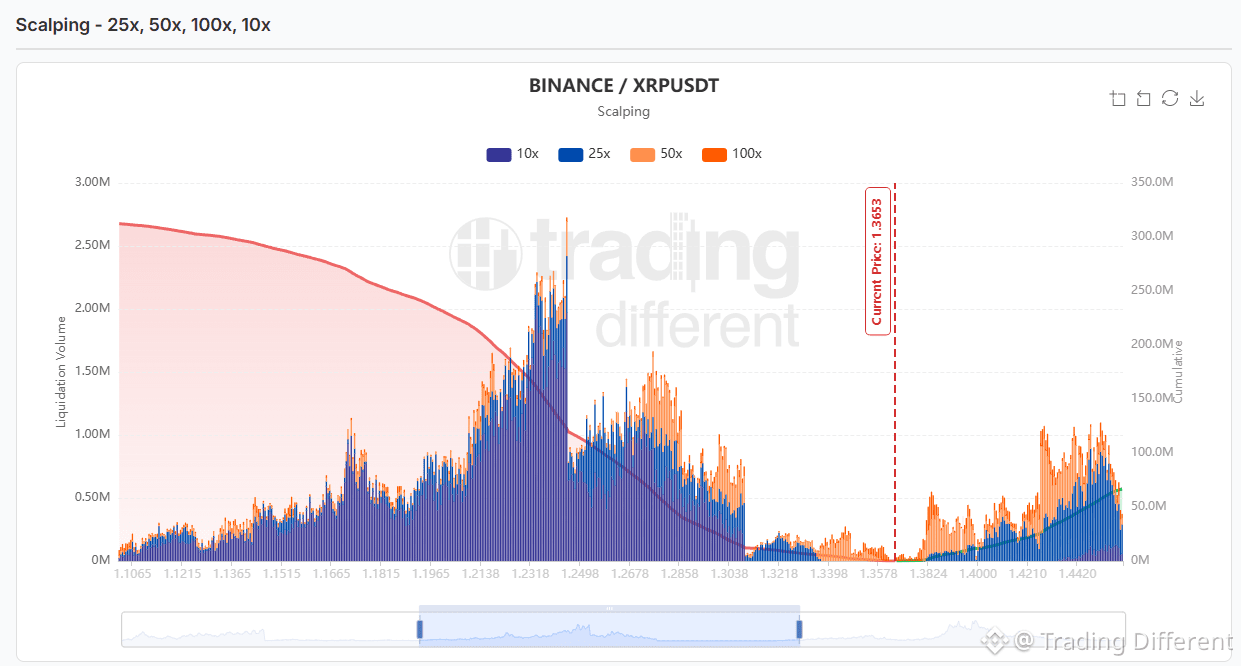
#xrp | XRP liquidation map for scalping
Current price: 1,3653
🔴 Shorts exposed above:
• ~1,3824: first pocket, mainly 50x and 100x
• 1,4210–1,4500: the strongest block above the price
🟢 Longs exposed below:
• Little liquidity down to ~1,3040
• 1,2680–1,2860: dense cluster, with lots of 50x/100x
• ~1,2320–1,2450: the highest peak on the entire map
• ~1,1700: an intermediate support level for 10x and 25x
🔥 The amount of long positions below that could be liquidated is about 5 times the amount of shorts above. There’s an empty gap on the map around the price.
The map doesn’t indicate the price direction. It shows where leveraged positions are located that would be liquidated if the price reached those levels.
👉 tradingdifferent.com/es/dashboard/liquidation-heatmap?code=binance-square
{future}(XRPUSDT)
#xrp | XRP liquidation map for scalping
Current price: 1,3653
🔴 Shorts exposed above:
• ~1,3824: first pocket, mainly 50x and 100x
• 1,4210–1,4500: the strongest block above the price
🟢 Longs exposed below:
• Little liquidity down to ~1,3040
• 1,2680–1,2860: dense cluster, with lots of 50x/100x
• ~1,2320–1,2450: the highest peak on the entire map
• ~1,1700: an intermediate support level for 10x and 25x
🔥 The amount of long positions below that could be liquidated is about 5 times the amount of shorts above. There’s an empty gap on the map around the price.
The map doesn’t indicate the price direction. It shows where leveraged positions are located that would be liquidated if the price reached those levels.
👉 tradingdifferent.com/es/dashboard/liquidation-heatmap?code=binance-square
1
943
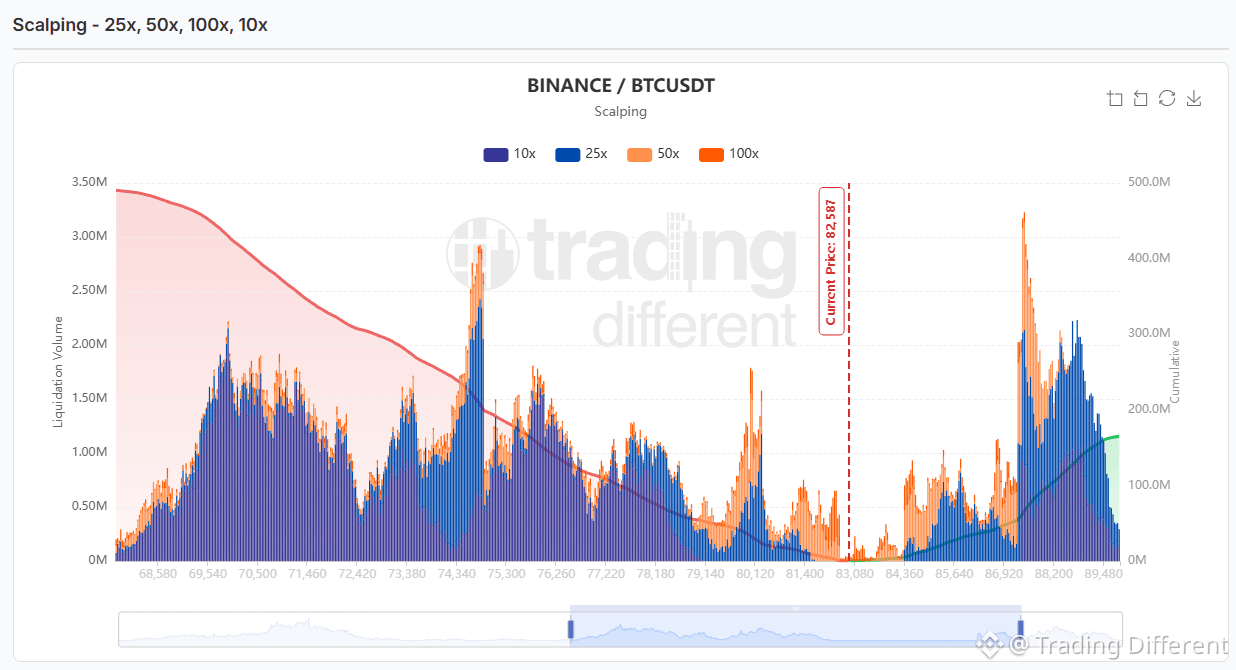
#BTC | Bitcoin scalping liquidation map
Current price: 82.587
🔴 Shorts exposed above:
• 84.400–86.000: moderate liquidity, mostly from high leverage (50x and 100x)
• ~87.400: the highest peak on the entire map
• 88.200–89.000: a dense cluster just beyond
🟢 Longs exposed below:
• ~80.100: the first significant magnet, with lots of 50x/100x
• 78.000–78.200: an intermediate cluster
• ~74.800: the second-strongest peak on the map
• 69.500–71.500: a broad base of 10x and 25x
🔥 The cumulative long liquidations below the price are almost triple those of shorts above it. However, near the price, the map is fairly empty on both sides.
The map does not indicate the price direction. It shows where leveraged positions would be liquidated if the price reaches those levels.
👉 tradingdifferent.com/es/dashboard/liquidation-heatmap?code=binance-square
{future}(BTCUSDT)
#BTC | Bitcoin scalping liquidation map
Current price: 82.587
🔴 Shorts exposed above:
• 84.400–86.000: moderate liquidity, mostly from high leverage (50x and 100x)
• ~87.400: the highest peak on the entire map
• 88.200–89.000: a dense cluster just beyond
🟢 Longs exposed below:
• ~80.100: the first significant magnet, with lots of 50x/100x
• 78.000–78.200: an intermediate cluster
• ~74.800: the second-strongest peak on the map
• 69.500–71.500: a broad base of 10x and 25x
🔥 The cumulative long liquidations below the price are almost triple those of shorts above it. However, near the price, the map is fairly empty on both sides.
The map does not indicate the price direction. It shows where leveraged positions would be liquidated if the price reaches those levels.
👉 tradingdifferent.com/es/dashboard/liquidation-heatmap?code=binance-square
2
1.2k
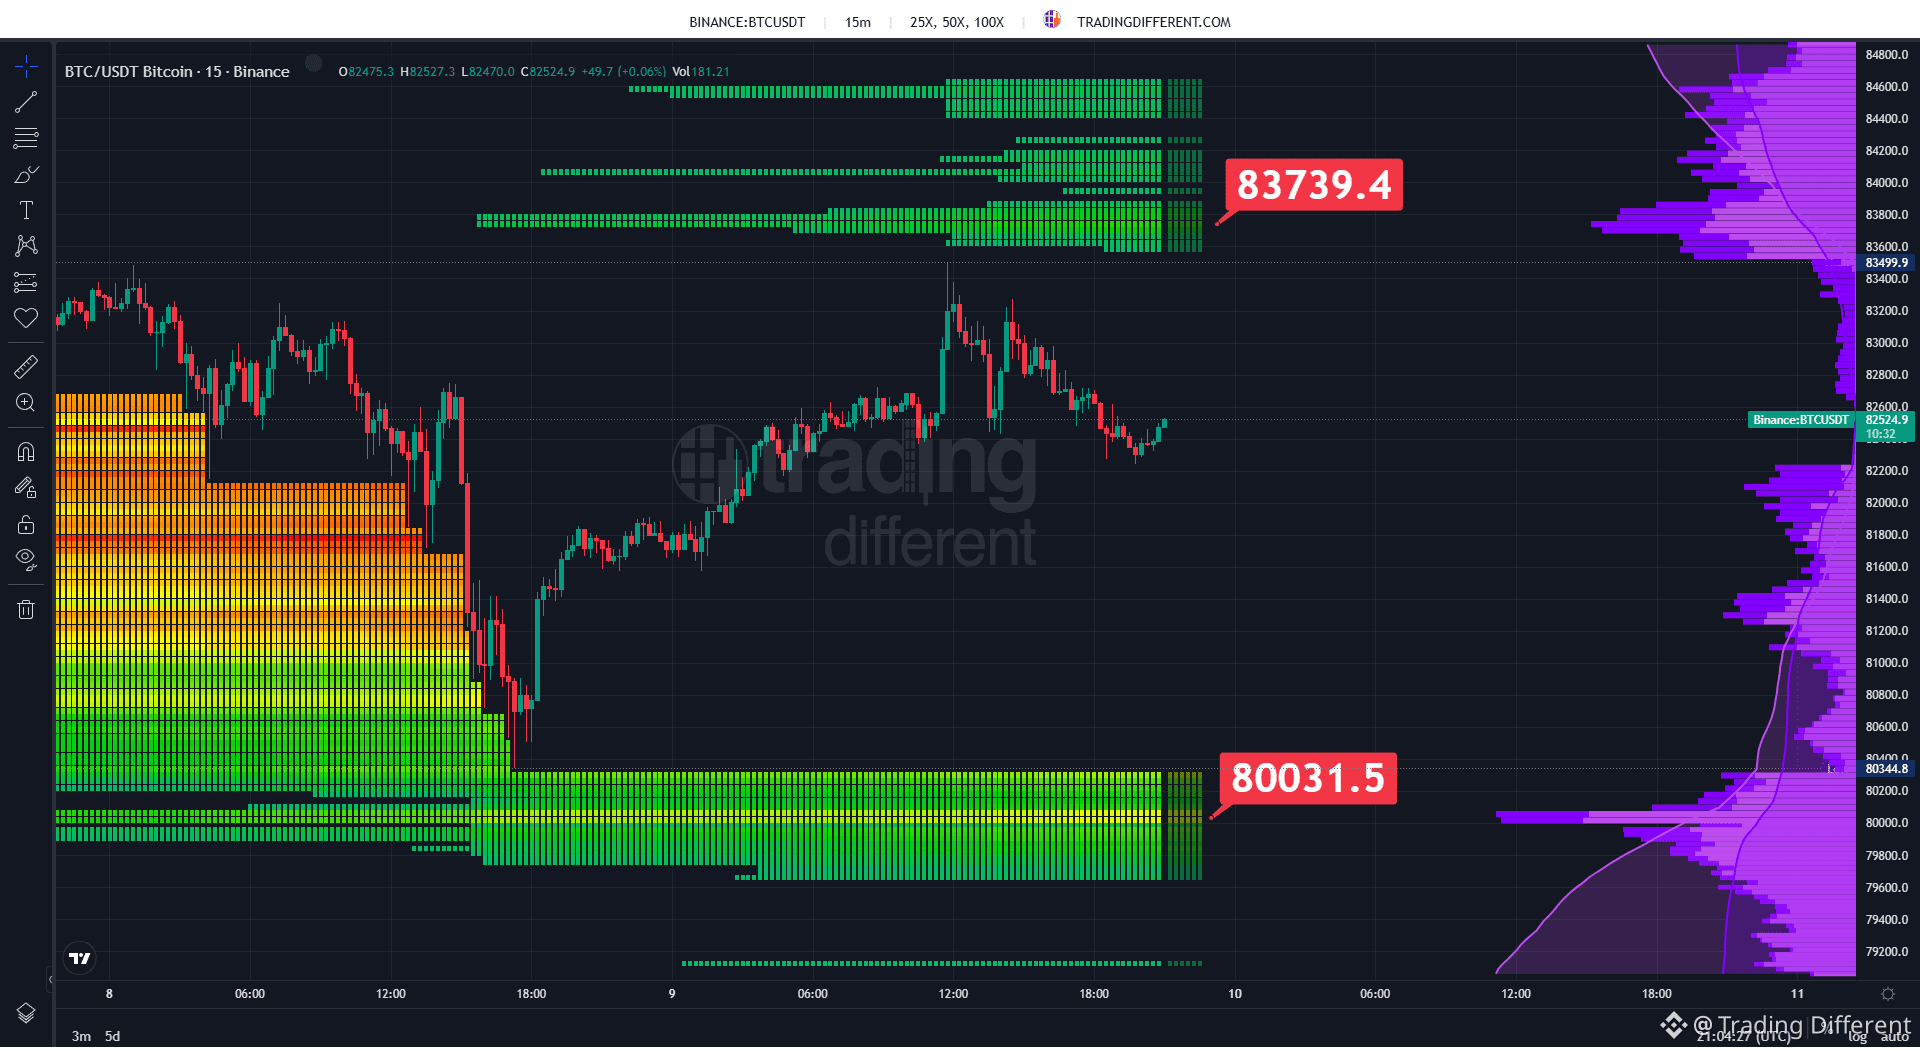
#BTC | Bounce from 80,344.8, with price between two blocks
Bitcoin bounced from a low of 80,344.8, reached 83,499.9, and is now trading at 82,524.9. On Binance’s 15-minute heatmap (25x-50x-100x), the price is in a low-liquidity zone between two estimated liquidation blocks.
🔴 Shorts block: 83,600–84,700. The most intense level is at 83,739.4, about $1,200 from the current price.
🔴 The rebound high of 83,499.9 stalled just below that block.
🟢 Longs block: 79,600–80,400, with its most intense level at 80,031.5.
🟢 Farther down, there is a smaller band near 79,200.
The long liquidity that was between 80,400 and 82,400 was consumed in Thursday’s drop and no longer appears on the map. There are almost no liquidations left between 80,400 and 83,600.
The sideways profile shows the largest accumulation at 80,000 below and between 83,600 and 83,800 above.
#BTC
🔗 tradingdifferent.com/es/dashboard/liquidation-heatmap?code=binance-square
{future}(BTCUSDT)
#BTC | Bounce from 80,344.8, with price between two blocks
Bitcoin bounced from a low of 80,344.8, reached 83,499.9, and is now trading at 82,524.9. On Binance’s 15-minute heatmap (25x-50x-100x), the price is in a low-liquidity zone between two estimated liquidation blocks.
🔴 Shorts block: 83,600–84,700. The most intense level is at 83,739.4, about $1,200 from the current price.
🔴 The rebound high of 83,499.9 stalled just below that block.
🟢 Longs block: 79,600–80,400, with its most intense level at 80,031.5.
🟢 Farther down, there is a smaller band near 79,200.
The long liquidity that was between 80,400 and 82,400 was consumed in Thursday’s drop and no longer appears on the map. There are almost no liquidations left between 80,400 and 83,600.
The sideways profile shows the largest accumulation at 80,000 below and between 83,600 and 83,800 above.
#BTC
🔗 tradingdifferent.com/es/dashboard/liquidation-heatmap?code=binance-square
1
1
423
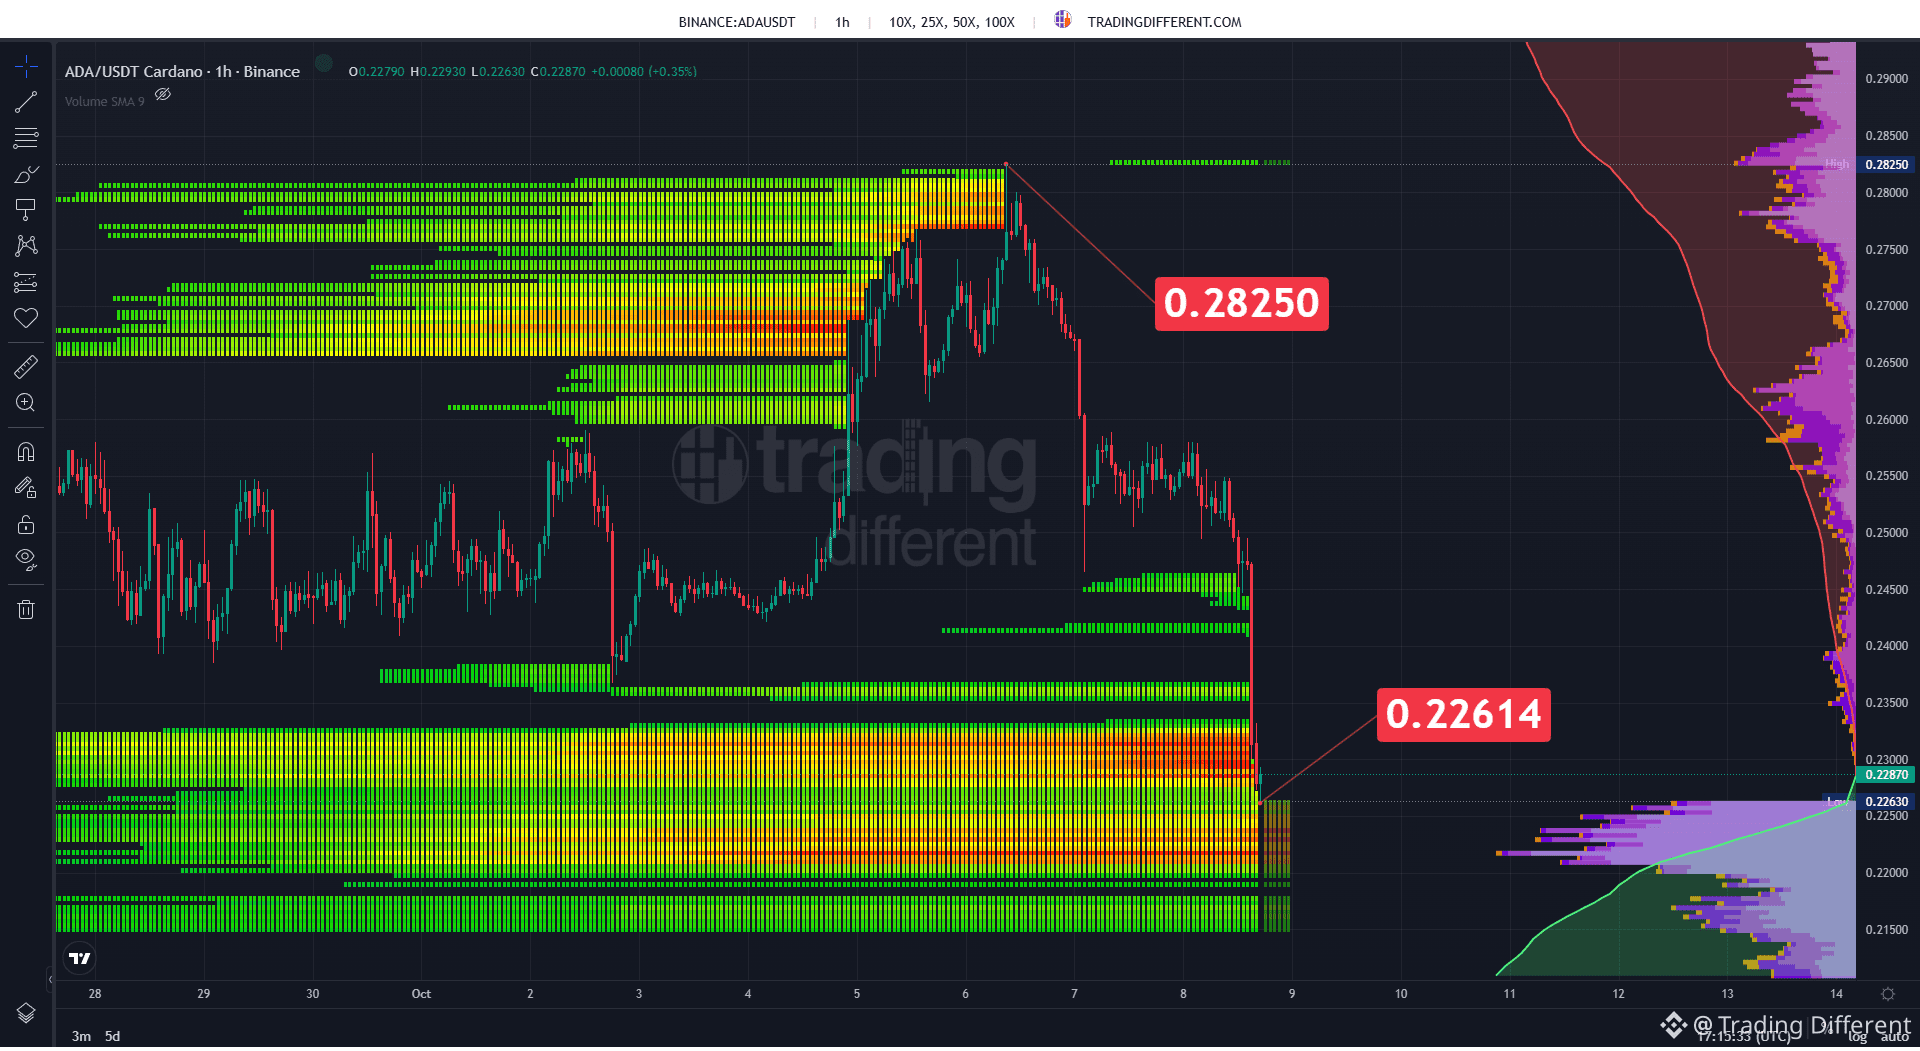
#ADA | Drop of 20% from 0.2825 to the long positions liquidation block
ADA dropped by about 20% from the October 6 high, at 0.28250, to a low of 0.22614. It is now trading at 0.2287. In Binance’s 1-hour heatmap (10x-25x-50x-100x), the drop reached the main block of estimated long liquidations.
🟢 Main long positions block: 0.2150 – 0.2300. Today’s low has already entered its upper range.
🔥 Densest band of the block: 0.2200 – 0.2240, still not touched.
🔴 Thin short bands remain above between 0.2350 and 0.2475.
🔴 There is an isolated line at 0.2825, at the level of the October 6 high.
The short block that was between 0.265 and 0.282 was swept during the prior upswing, before the drop.
The first reference is the dense band of 0.2200 – 0.2240, just below the current price.
#ADA
🔗 tradingdifferent.com/es/dashboard/liquidation-heatmap?code=binance-square
{future}(ADAUSDT)
#ADA | Drop of 20% from 0.2825 to the long positions liquidation block
ADA dropped by about 20% from the October 6 high, at 0.28250, to a low of 0.22614. It is now trading at 0.2287. In Binance’s 1-hour heatmap (10x-25x-50x-100x), the drop reached the main block of estimated long liquidations.
🟢 Main long positions block: 0.2150 – 0.2300. Today’s low has already entered its upper range.
🔥 Densest band of the block: 0.2200 – 0.2240, still not touched.
🔴 Thin short bands remain above between 0.2350 and 0.2475.
🔴 There is an isolated line at 0.2825, at the level of the October 6 high.
The short block that was between 0.265 and 0.282 was swept during the prior upswing, before the drop.
The first reference is the dense band of 0.2200 – 0.2240, just below the current price.
#ADA
🔗 tradingdifferent.com/es/dashboard/liquidation-heatmap?code=binance-square
2
845
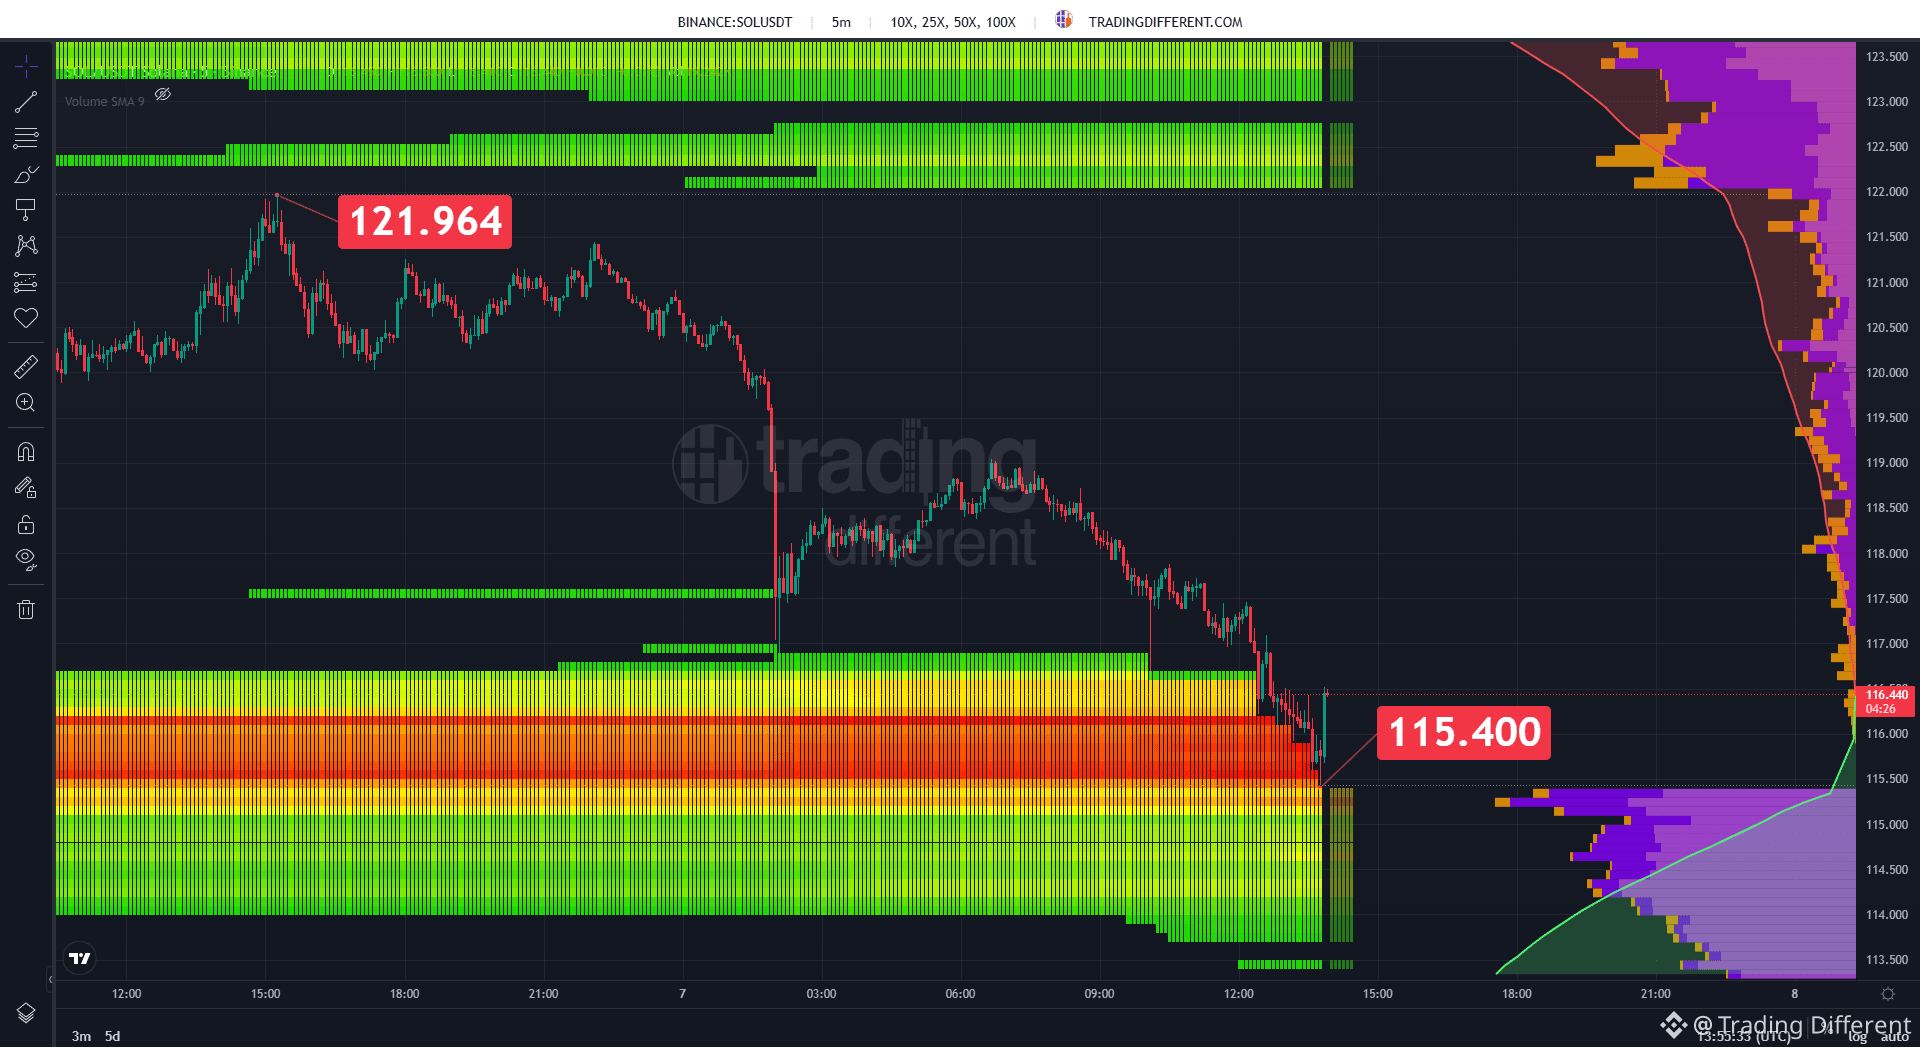
#sol | Drop from 121,964 to the longs block
SOL fell about 5.4% from yesterday’s high of 121,964 to a low of 115,400, and is now trading at 116.44. On Binance’s 5-minute heatmap (10x-25x-50x-100x), the drop reached the densest band of estimated long liquidations.
🔥 The map’s most intense band: 115.5–116.2, already swept by the low.
🟢 Remaining longs block: 113.7–115.4, still untouched.
🔴 First shorts block: 122.0–122.7.
🔴 Second shorts block: 123.0–123.5.
There is almost no liquidity on the map between 117 and 122. The sideways profile shows the largest accumulation just below 115.4.
The first reference point is 115.4 below. Above, the shorts block is far away, at 122.
#SOL
🔗 tradingdifferent.com/es/dashboard/liquidation-heatmap?code=binance-square
{future}(SOLUSDT)
#sol | Drop from 121,964 to the longs block
SOL fell about 5.4% from yesterday’s high of 121,964 to a low of 115,400, and is now trading at 116.44. On Binance’s 5-minute heatmap (10x-25x-50x-100x), the drop reached the densest band of estimated long liquidations.
🔥 The map’s most intense band: 115.5–116.2, already swept by the low.
🟢 Remaining longs block: 113.7–115.4, still untouched.
🔴 First shorts block: 122.0–122.7.
🔴 Second shorts block: 123.0–123.5.
There is almost no liquidity on the map between 117 and 122. The sideways profile shows the largest accumulation just below 115.4.
The first reference point is 115.4 below. Above, the shorts block is far away, at 122.
#SOL
🔗 tradingdifferent.com/es/dashboard/liquidation-heatmap?code=binance-square
1
1.9k
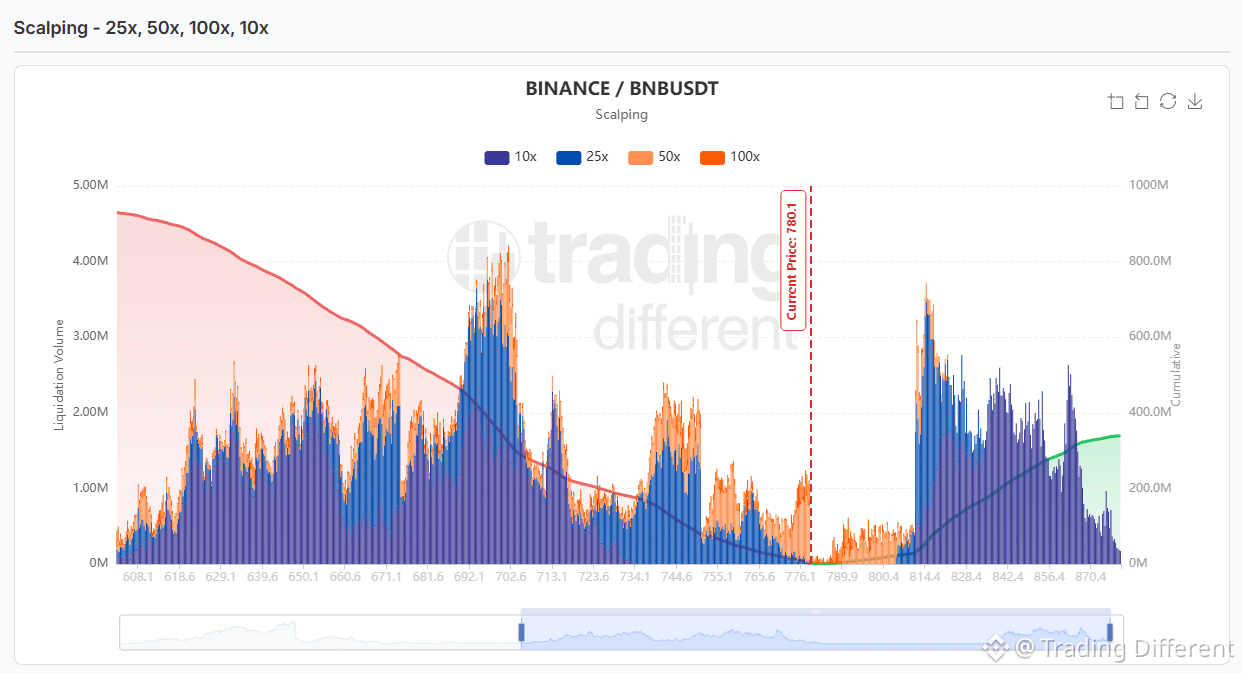
#bnb | Long liquidity starts just below the price
BNB is trading at 780.1. On Binance’s Scalping map (10x-25x-50x-100x), estimated long liquidations start almost right at the current price and extend downward. Above it, the first major cluster is farther away.
🟢 Nearest long cluster: 772 – 779, with high leverage and a peak of around 1.2M USD.
🟢 Intermediate cluster: 737 – 750, with a peak near 744 of around 2.4M USD.
🔥 Main long cluster: 690 – 706. The strongest level on the map is near 702, at around 4.2M USD.
🔴 Between 782 and 808, short liquidity is low, with levels of up to 0.5M USD.
🔴 Main short cluster: 810 – 830, with a peak near 814 of around 3.7M USD.
🔴 Second cluster: 835 – 860, with around 2.5M USD per level.
Estimated cumulative liquidations total around 930M USD for longs below, compared with around 335M USD for shorts above.
The first key levels are 772 below and 810 above.
#BNB
🔗 tradingdifferent.com/es/dashboard/liquidation-heatmap?code=binance-square
{future}(BNBUSDT)
#bnb | Long liquidity starts just below the price
BNB is trading at 780.1. On Binance’s Scalping map (10x-25x-50x-100x), estimated long liquidations start almost right at the current price and extend downward. Above it, the first major cluster is farther away.
🟢 Nearest long cluster: 772 – 779, with high leverage and a peak of around 1.2M USD.
🟢 Intermediate cluster: 737 – 750, with a peak near 744 of around 2.4M USD.
🔥 Main long cluster: 690 – 706. The strongest level on the map is near 702, at around 4.2M USD.
🔴 Between 782 and 808, short liquidity is low, with levels of up to 0.5M USD.
🔴 Main short cluster: 810 – 830, with a peak near 814 of around 3.7M USD.
🔴 Second cluster: 835 – 860, with around 2.5M USD per level.
Estimated cumulative liquidations total around 930M USD for longs below, compared with around 335M USD for shorts above.
The first key levels are 772 below and 810 above.
#BNB
🔗 tradingdifferent.com/es/dashboard/liquidation-heatmap?code=binance-square
667
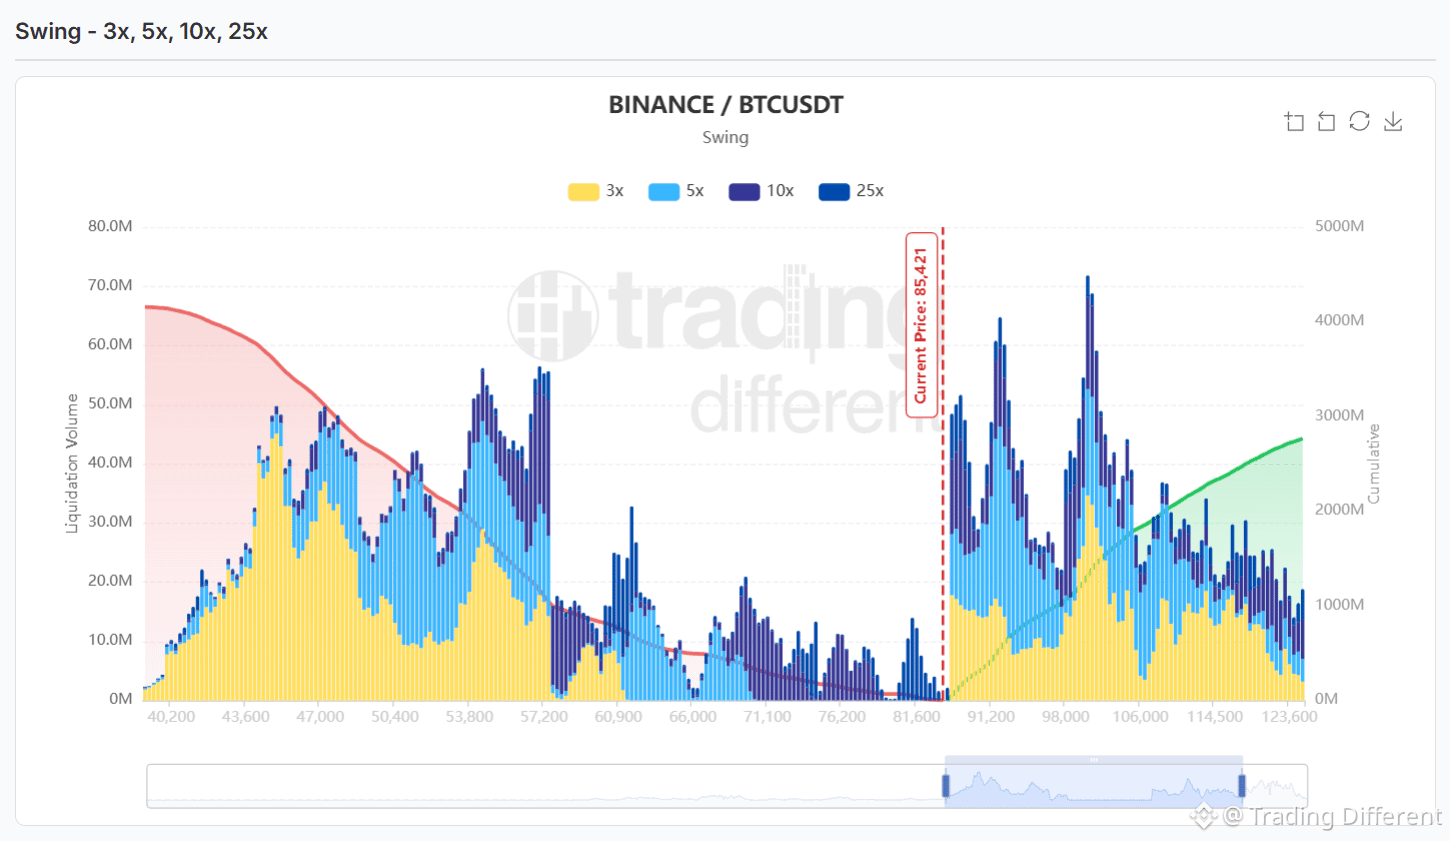
#BTC | Swing Map: short liquidity starts just above the price
BTC is trading at 85,421. On Binance’s Swing map (3x-5x-10x-25x), estimated short liquidations start almost at the current price, while the immediate area below has little liquidity.
🔴 First short cluster: 86,000–89,000, with around 50M USD per level.
🔴 Second cluster: 92,000–93,000, with a peak of around 65M USD.
🔥 Main short cluster: 98,000–101,000. The map’s most intense level is near 100,300, with around 72M USD.
🟢 Between 60,000 and 84,000, liquidity is low, generally 10M to 20M USD per level.
🟢 Main long cluster: 53,800–57,200, with a peak of around 56M USD.
🟢 Deepest cluster: 44,000–49,000, with around 50M USD per level.
The estimated total is around 4,150M USD in long liquidations below, compared with around 2,750M USD in short liquidations above. Most of the long liquidity is far from the price, below 57,200.
#BTC
🔗 tradingdifferent.com/es/dashboard/liquidation-heatmap?code=binance-square
{future}(BTCUSDT)
#BTC | Swing Map: short liquidity starts just above the price
BTC is trading at 85,421. On Binance’s Swing map (3x-5x-10x-25x), estimated short liquidations start almost at the current price, while the immediate area below has little liquidity.
🔴 First short cluster: 86,000–89,000, with around 50M USD per level.
🔴 Second cluster: 92,000–93,000, with a peak of around 65M USD.
🔥 Main short cluster: 98,000–101,000. The map’s most intense level is near 100,300, with around 72M USD.
🟢 Between 60,000 and 84,000, liquidity is low, generally 10M to 20M USD per level.
🟢 Main long cluster: 53,800–57,200, with a peak of around 56M USD.
🟢 Deepest cluster: 44,000–49,000, with around 50M USD per level.
The estimated total is around 4,150M USD in long liquidations below, compared with around 2,750M USD in short liquidations above. Most of the long liquidity is far from the price, below 57,200.
#BTC
🔗 tradingdifferent.com/es/dashboard/liquidation-heatmap?code=binance-square
1
674
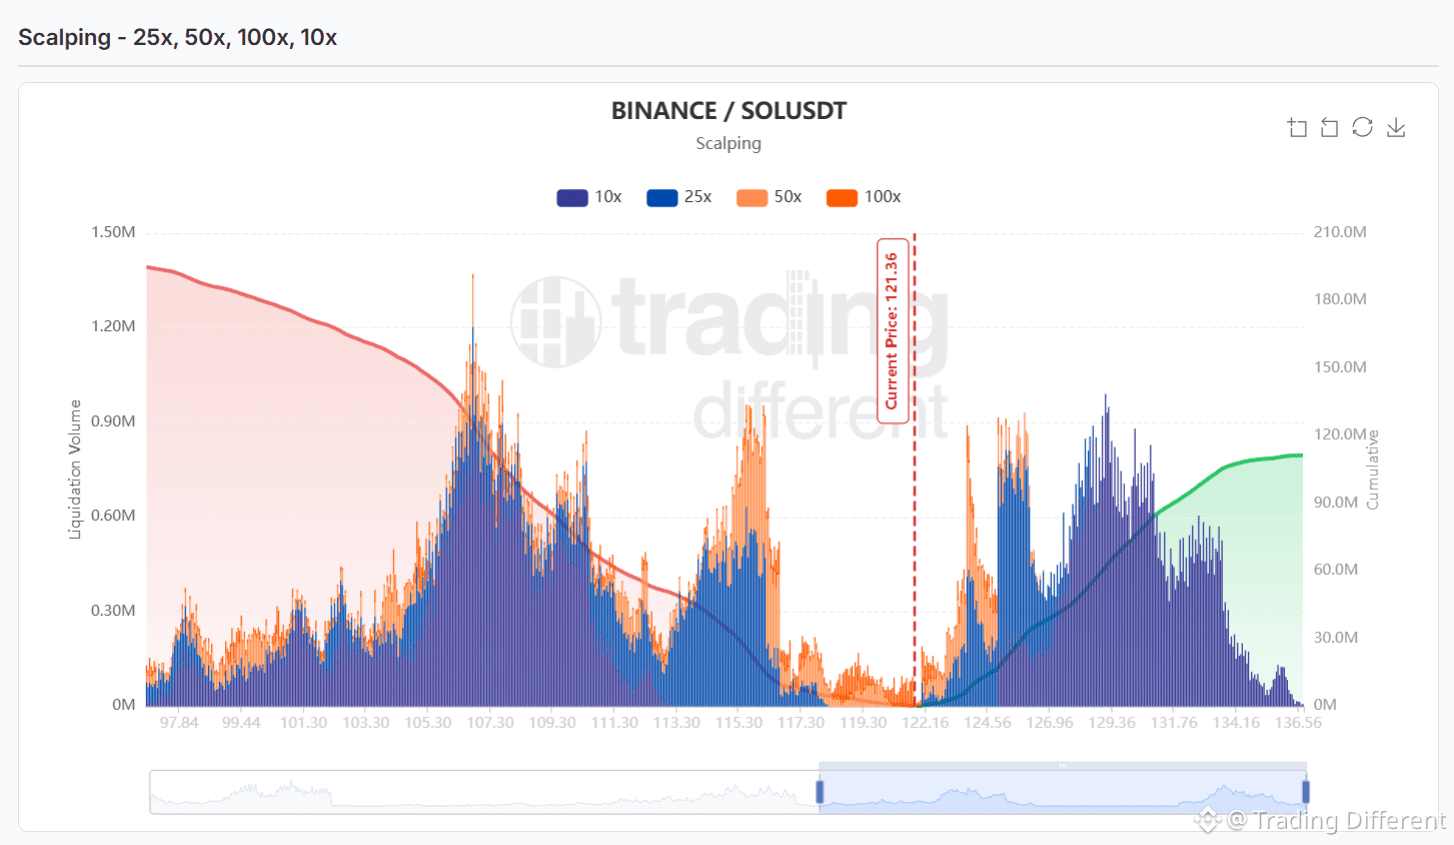
#sol | The first shorts block was about $2 away from the price
SOL is trading at 121.36, above yesterday’s 119.50. On Binance’s Scalping liquidation map (10x-25x-50x-100x), the closest estimated shorts liquidation block now starts just above the price.
🔴 First shorts block: 123.3 – 126, with spikes of around $0.9M per level.
🔴 Second shorts block: 127.5 – 131.5, with a peak near 129.2 of around $1M.
🟢 Closest longs block: 113.5 – 116.5, with a peak near 115.9 of around $0.95M.
🔥 Main longs block: 105.5 – 108.5. The map’s strongest level is near 106.7, with around $1.37M.
The estimated buildup is about $195M in long liquidations below, versus about $110M in short liquidations above.
Between 117 and 122 there’s very little liquidity. The closest reference is 123.3 above.
#SOL
🔗 tradingdifferent.com/es/dashboard/liquidation-heatmap?code=binance-square
{future}(SOLUSDT)
#sol | The first shorts block was about $2 away from the price
SOL is trading at 121.36, above yesterday’s 119.50. On Binance’s Scalping liquidation map (10x-25x-50x-100x), the closest estimated shorts liquidation block now starts just above the price.
🔴 First shorts block: 123.3 – 126, with spikes of around $0.9M per level.
🔴 Second shorts block: 127.5 – 131.5, with a peak near 129.2 of around $1M.
🟢 Closest longs block: 113.5 – 116.5, with a peak near 115.9 of around $0.95M.
🔥 Main longs block: 105.5 – 108.5. The map’s strongest level is near 106.7, with around $1.37M.
The estimated buildup is about $195M in long liquidations below, versus about $110M in short liquidations above.
Between 117 and 122 there’s very little liquidity. The closest reference is 123.3 above.
#SOL
🔗 tradingdifferent.com/es/dashboard/liquidation-heatmap?code=binance-square
3
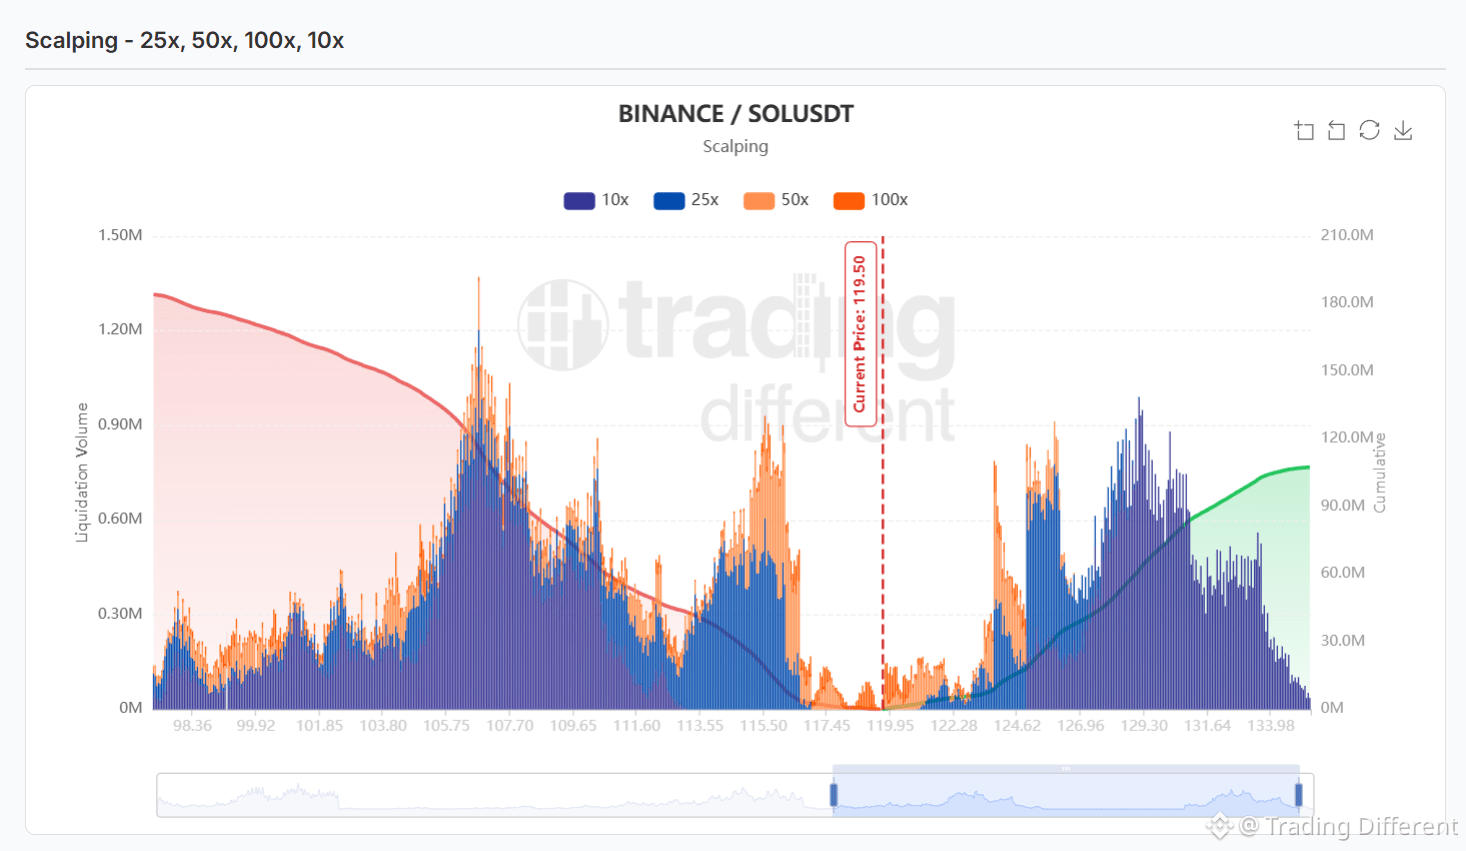
957
#SOL | Liquidity liquidation blocks on both sides of the price
SOL is trading at 119.50. In Binance’s Scalping map (10x-25x-50x-100x) there are few estimated liquidations between 117 and 123.
🟢 Closest long block: 113.5 – 116.5, with a peak near 115.6 of around 0.9M USD per level.
🔥 Main long block: 105 – 108.5. The most intense level on the map is near 106.7, with around 1.37M USD.
🔴 First shorts block: 124 – 126.5, with a peak near 126.1 of around 0.9M USD.
🔴 Second shorts block: 127.5 – 131, with a peak near 129.1 of around 1M USD.
The estimated total is about 183M USD in long liquidations below, versus about 106M USD in short liquidations above.
The first reference points are 116.5 below and 124 above.
#sol
🔗 tradingdifferent.com/es/dashboard/liquidation-heatmap?code=binance-square
{future}(SOLUSDT)
#SOL | Liquidity liquidation blocks on both sides of the price
SOL is trading at 119.50. In Binance’s Scalping map (10x-25x-50x-100x) there are few estimated liquidations between 117 and 123.
🟢 Closest long block: 113.5 – 116.5, with a peak near 115.6 of around 0.9M USD per level.
🔥 Main long block: 105 – 108.5. The most intense level on the map is near 106.7, with around 1.37M USD.
🔴 First shorts block: 124 – 126.5, with a peak near 126.1 of around 0.9M USD.
🔴 Second shorts block: 127.5 – 131, with a peak near 129.1 of around 1M USD.
The estimated total is about 183M USD in long liquidations below, versus about 106M USD in short liquidations above.
The first reference points are 116.5 below and 124 above.
#sol
🔗 tradingdifferent.com/es/dashboard/liquidation-heatmap?code=binance-square
1
730
Log in to explore more content
Join global crypto users on Binance Square
⚡️ Get latest and useful information about crypto.
💬 Trusted by the world’s largest crypto exchange.
👍 Discover real insights from verified creators.
Email / Phone number