
美股OK哥搬运号
250 Posts

美股OK哥搬运号
Report
Block User
投资丛林里的狩猎者。
0 Following
1.1K+ Followers
813 Liked
Posts
All
Videos
·
--
Verified
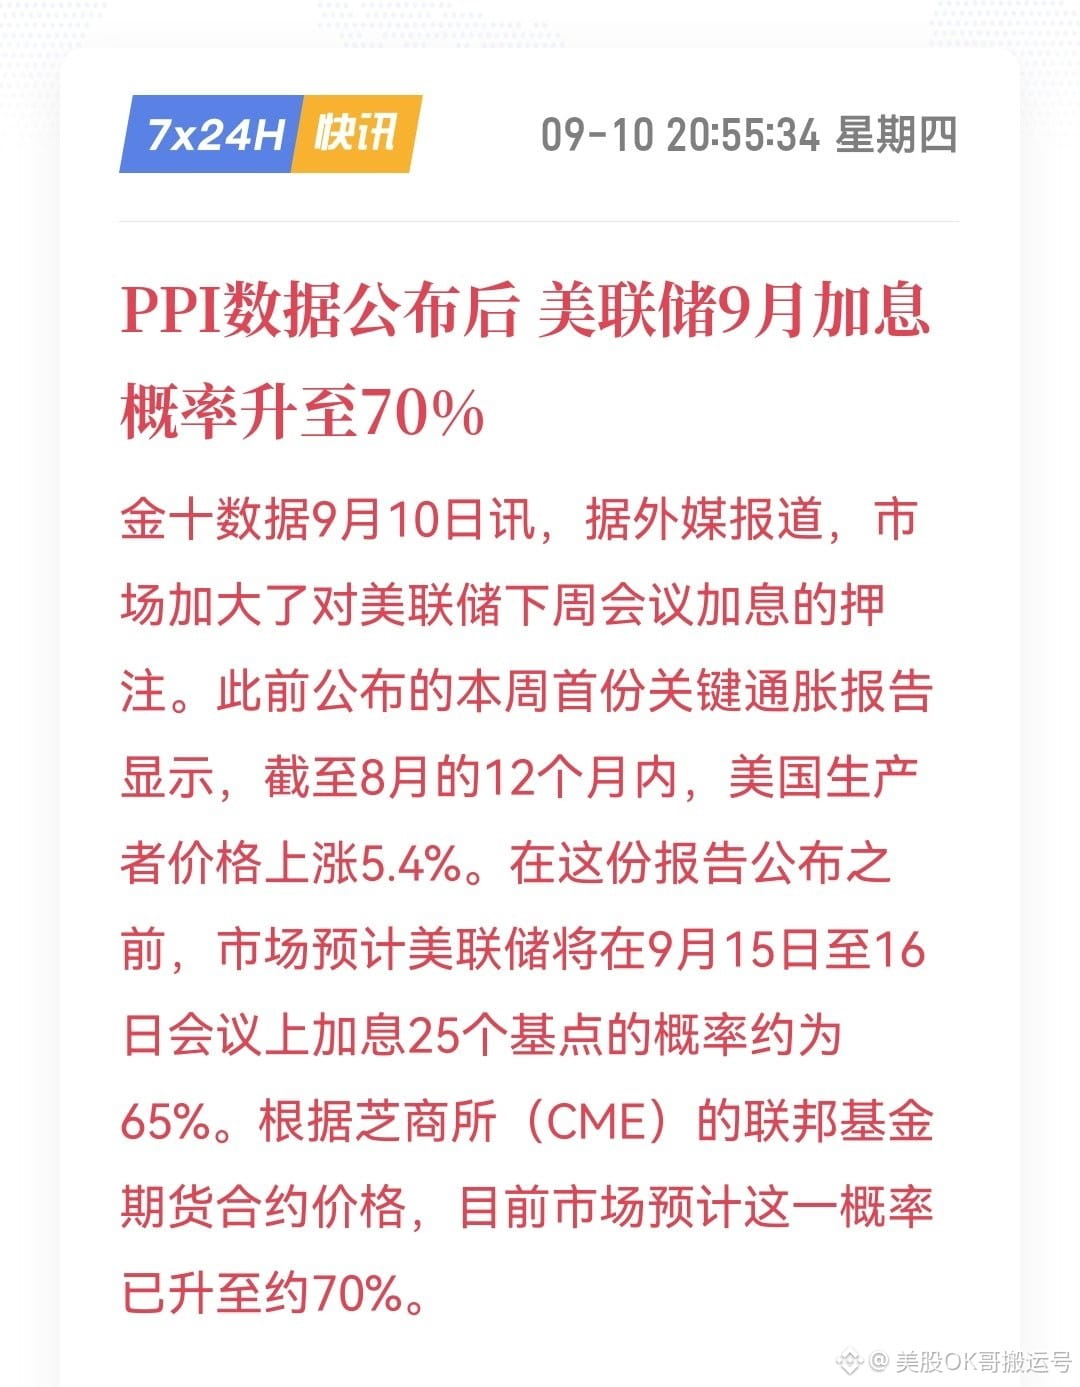
With tonight’s official release of PPI data, U.S. stock index futures have shown a very clear downturn, and market sentiment appears quite pessimistic.
Even so, the Federal Reserve’s final line of defense on the rate-hike question remains the core PCE indicator. We can patiently wait for tomorrow night’s CPI data to be released; then everyone will be able to make a rough estimate of core PCE. What needs to be reminded is that as long as the inflation level is slightly above market expectations, Warsh will ultimately have no choice but to make a decision to raise rates.
To better respond to potential policy changes, it’s recommended that everyone review the materials I shared earlier now, in advance, to reference and prepare asset allocation strategies for a broader rate-hike environment.
With tonight’s official release of PPI data, U.S. stock index futures have shown a very clear downturn, and market sentiment appears quite pessimistic.
Even so, the Federal Reserve’s final line of defense on the rate-hike question remains the core PCE indicator. We can patiently wait for tomorrow night’s CPI data to be released; then everyone will be able to make a rough estimate of core PCE. What needs to be reminded is that as long as the inflation level is slightly above market expectations, Warsh will ultimately have no choice but to make a decision to raise rates.
To better respond to potential policy changes, it’s recommended that everyone review the materials I shared earlier now, in advance, to reference and prepare asset allocation strategies for a broader rate-hike environment.
Even so, the Federal Reserve’s final line of defense on the rate-hike question remains the core PCE indicator. We can patiently wait for tomorrow night’s CPI data to be released; then everyone will be able to make a rough estimate of core PCE. What needs to be reminded is that as long as the inflation level is slightly above market expectations, Warsh will ultimately have no choice but to make a decision to raise rates.
To better respond to potential policy changes, it’s recommended that everyone review the materials I shared earlier now, in advance, to reference and prepare asset allocation strategies for a broader rate-hike environment.
2
1
11
10.8k
·
--
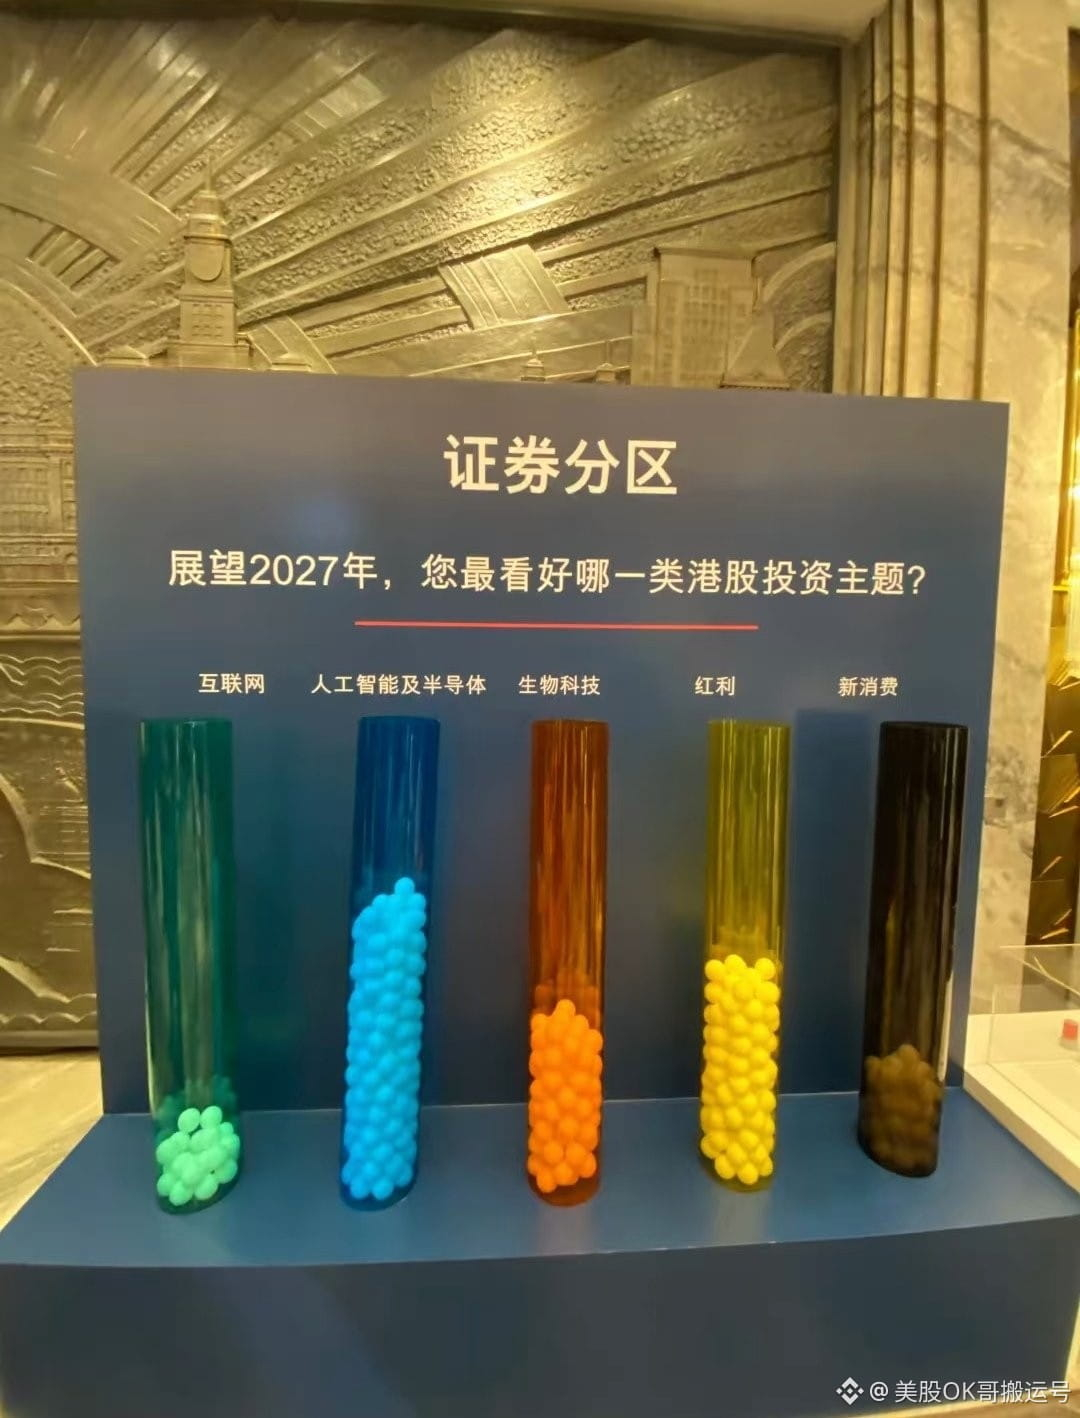
At the Hong Kong Exchanges and Clearing Limited China Opportunities Forum held today, many leading figures from the securities industry took part in the live voting. The final voting results have now been officially announced. I wonder whether this collective choice by seasoned industry insiders aligns with the direction you personally favor?
At the Hong Kong Exchanges and Clearing Limited China Opportunities Forum held today, many leading figures from the securities industry took part in the live voting. The final voting results have now been officially announced. I wonder whether this collective choice by seasoned industry insiders aligns with the direction you personally favor?
1
1.3k
·
--
If the Federal Reserve announces a rate hike on September 16, which ETFs should investors prioritize buying? Here, I’ve put together a curated set of asset allocations to respond to this market scenario.
First, there are several funds that typically benefit directly from a rate-hike decision and face a favorable outlook. You may want to focus on the following tickers: $USFR, $SGOV, $BIL, $FLOT, $FDRR, $XLE, $XLF, and $KBE.
In addition, to better keep your account stable amid market fluctuations, it’s also a smart choice to allocate to some funds with strong downside-resilience. In defensive sectors under a rate-hike environment, you may consider focusing on $XLV, $SPLV, $SCHD, $VYM, $KRE, and $SHY.
If the Federal Reserve announces a rate hike on September 16, which ETFs should investors prioritize buying? Here, I’ve put together a curated set of asset allocations to respond to this market scenario.
First, there are several funds that typically benefit directly from a rate-hike decision and face a favorable outlook. You may want to focus on the following tickers: $USFR, $SGOV, $BIL, $FLOT, $FDRR, $XLE, $XLF, and $KBE.
In addition, to better keep your account stable amid market fluctuations, it’s also a smart choice to allocate to some funds with strong downside-resilience. In defensive sectors under a rate-hike environment, you may consider focusing on $XLV, $SPLV, $SCHD, $VYM, $KRE, and $SHY.
First, there are several funds that typically benefit directly from a rate-hike decision and face a favorable outlook. You may want to focus on the following tickers: $USFR, $SGOV, $BIL, $FLOT, $FDRR, $XLE, $XLF, and $KBE.
In addition, to better keep your account stable amid market fluctuations, it’s also a smart choice to allocate to some funds with strong downside-resilience. In defensive sectors under a rate-hike environment, you may consider focusing on $XLV, $SPLV, $SCHD, $VYM, $KRE, and $SHY.
1.1k
·
--
Here I will share a US stock investment strategy with a win rate as high as 96%. The method is very clear in its operation: as long as it is a midterm election year, buy the S&P on September 27, and then sell it on July 18 of the following year. Tracing back historical data starting from 1930, this approach has been carried out a total of 24 times, and in no less than 23 of those cases it has allowed investors to earn profits, with an overall average return of +19%.
Here I will share a US stock investment strategy with a win rate as high as 96%. The method is very clear in its operation: as long as it is a midterm election year, buy the S&P on September 27, and then sell it on July 18 of the following year. Tracing back historical data starting from 1930, this approach has been carried out a total of 24 times, and in no less than 23 of those cases it has allowed investors to earn profits, with an overall average return of +19%.
87
·
--
When we review the top twenty stocks in the U.S. stock market with market caps exceeding 200 million USD in August—by share price increase—we can clearly see a very obvious trend: innovation-driven biotech and the cryptocurrency sector have an absolute dominant presence. This seems to suggest that market capital is flowing out from the artificial intelligence segment and actively looking for new investment “value pockets” in other industries. Feel free to take a bold guess: in September, which directions will this active capital flow toward next? Here are the details of the specific leaderboard:
1、$RFAI RF Acquisition II surged 287.8%; the target involves NanYang Biotech’s shell acquisition and AI medicine-related business.
2、$CYPH Cypherpunk Technologies rose 186.6%; its core business is the Zcash token treasury.
3、$VOGX Vogenx climbed 161.5%; it mainly focuses on biologic drugs for metabolic diseases.
4、$MRNA Moderna increased 154.5%; it is known for mRNA vaccines.
5、$ARCT Arcturus Therapeutics recorded a 146.0% gain; it focuses on mRNA biopharmaceuticals.
6、$CAPR Capricor Therapeutics rose 136.0%; its business covers cell therapy.
7、$QMCO Quantum grew 130.4%; it is mainly focused on data storage.
8、$OABI OmniAb rose 123.5%; it belongs to an antibody discovery platform.
9、$RCEL AVITA Medical increased 118.6%; it is deeply involved in regenerative medicine.
10、$STDN Standard Nuclear surged 109.8%; it primarily promotes advanced nuclear fuel.
11、$CAN Canaan Technology achieved a 105.8% gain, driven mainly by Bitcoin mining machine business.
12、$ASST Strive rose 105.3%; positioned as a Bitcoin treasury.
13、$ABCL AbCellera rose 96.9%; it focuses on antibody discovery.
14、$IOVA Iovance grew 89.3%; it is involved in cancer cell therapy.
15、$HTFL Heartflow rose 88.3%; its core business is AI cardiac imaging.
16、$TEAM Atlassian rose 87.2%; it provides enterprise collaboration software services.
17、$PURR Hyperliquid Strategies recorded an 86.2% increase; as a HYPE token treasury.
18、$SENS Senseonics grew 76.7%; its main products are continuous glucose monitoring devices.
19、$IVVD Invivyd saw a 73.1% gain; it mainly targets antibody drug R&D.
20、$NEOV NeoVolta rose 71.7%; its business covers residential and commercial energy storage.
When we review the top twenty stocks in the U.S. stock market with market caps exceeding 200 million USD in August—by share price increase—we can clearly see a very obvious trend: innovation-driven biotech and the cryptocurrency sector have an absolute dominant presence. This seems to suggest that market capital is flowing out from the artificial intelligence segment and actively looking for new investment “value pockets” in other industries. Feel free to take a bold guess: in September, which directions will this active capital flow toward next? Here are the details of the specific leaderboard:
1、$RFAI RF Acquisition II surged 287.8%; the target involves NanYang Biotech’s shell acquisition and AI medicine-related business.
2、$CYPH Cypherpunk Technologies rose 186.6%; its core business is the Zcash token treasury.
3、$VOGX Vogenx climbed 161.5%; it mainly focuses on biologic drugs for metabolic diseases.
4、$MRNA Moderna increased 154.5%; it is known for mRNA vaccines.
5、$ARCT Arcturus Therapeutics recorded a 146.0% gain; it focuses on mRNA biopharmaceuticals.
6、$CAPR Capricor Therapeutics rose 136.0%; its business covers cell therapy.
7、$QMCO Quantum grew 130.4%; it is mainly focused on data storage.
8、$OABI OmniAb rose 123.5%; it belongs to an antibody discovery platform.
9、$RCEL AVITA Medical increased 118.6%; it is deeply involved in regenerative medicine.
10、$STDN Standard Nuclear surged 109.8%; it primarily promotes advanced nuclear fuel.
11、$CAN Canaan Technology achieved a 105.8% gain, driven mainly by Bitcoin mining machine business.
12、$ASST Strive rose 105.3%; positioned as a Bitcoin treasury.
13、$ABCL AbCellera rose 96.9%; it focuses on antibody discovery.
14、$IOVA Iovance grew 89.3%; it is involved in cancer cell therapy.
15、$HTFL Heartflow rose 88.3%; its core business is AI cardiac imaging.
16、$TEAM Atlassian rose 87.2%; it provides enterprise collaboration software services.
17、$PURR Hyperliquid Strategies recorded an 86.2% increase; as a HYPE token treasury.
18、$SENS Senseonics grew 76.7%; its main products are continuous glucose monitoring devices.
19、$IVVD Invivyd saw a 73.1% gain; it mainly targets antibody drug R&D.
20、$NEOV NeoVolta rose 71.7%; its business covers residential and commercial energy storage.
1、$RFAI RF Acquisition II surged 287.8%; the target involves NanYang Biotech’s shell acquisition and AI medicine-related business.
2、$CYPH Cypherpunk Technologies rose 186.6%; its core business is the Zcash token treasury.
3、$VOGX Vogenx climbed 161.5%; it mainly focuses on biologic drugs for metabolic diseases.
4、$MRNA Moderna increased 154.5%; it is known for mRNA vaccines.
5、$ARCT Arcturus Therapeutics recorded a 146.0% gain; it focuses on mRNA biopharmaceuticals.
6、$CAPR Capricor Therapeutics rose 136.0%; its business covers cell therapy.
7、$QMCO Quantum grew 130.4%; it is mainly focused on data storage.
8、$OABI OmniAb rose 123.5%; it belongs to an antibody discovery platform.
9、$RCEL AVITA Medical increased 118.6%; it is deeply involved in regenerative medicine.
10、$STDN Standard Nuclear surged 109.8%; it primarily promotes advanced nuclear fuel.
11、$CAN Canaan Technology achieved a 105.8% gain, driven mainly by Bitcoin mining machine business.
12、$ASST Strive rose 105.3%; positioned as a Bitcoin treasury.
13、$ABCL AbCellera rose 96.9%; it focuses on antibody discovery.
14、$IOVA Iovance grew 89.3%; it is involved in cancer cell therapy.
15、$HTFL Heartflow rose 88.3%; its core business is AI cardiac imaging.
16、$TEAM Atlassian rose 87.2%; it provides enterprise collaboration software services.
17、$PURR Hyperliquid Strategies recorded an 86.2% increase; as a HYPE token treasury.
18、$SENS Senseonics grew 76.7%; its main products are continuous glucose monitoring devices.
19、$IVVD Invivyd saw a 73.1% gain; it mainly targets antibody drug R&D.
20、$NEOV NeoVolta rose 71.7%; its business covers residential and commercial energy storage.
161
·
--
Share an interesting piece of trivia.
Suppose that starting in May 2014, you began buying and selling in sync with Pelosi’s publicly disclosed trading records. Then, over the 12 years you have followed this strategy up to now, it would have generated about 200 trades in total. With this approach, your annualized return could reach about 21%. If this performance is compared with the returns from simply holding an S&P ETF over the same period, the above strategy would have earned an additional 550% in cumulative profit.
Share an interesting piece of trivia.
Suppose that starting in May 2014, you began buying and selling in sync with Pelosi’s publicly disclosed trading records. Then, over the 12 years you have followed this strategy up to now, it would have generated about 200 trades in total. With this approach, your annualized return could reach about 21%. If this performance is compared with the returns from simply holding an S&P ETF over the same period, the above strategy would have earned an additional 550% in cumulative profit.
Suppose that starting in May 2014, you began buying and selling in sync with Pelosi’s publicly disclosed trading records. Then, over the 12 years you have followed this strategy up to now, it would have generated about 200 trades in total. With this approach, your annualized return could reach about 21%. If this performance is compared with the returns from simply holding an S&P ETF over the same period, the above strategy would have earned an additional 550% in cumulative profit.
126
·
--
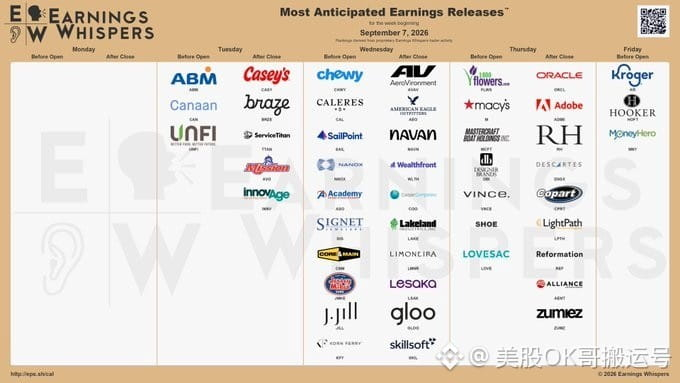
Hello everyone, the upcoming 9.7 U.S. stock earnings week is full of highlights. This week, not only will two industry giants, Oracle and Adobe, lead the earnings releases, but on Wednesday and Friday we will also迎来 the two major inflation data bombs, PPI and CPI. There is no doubt that the market has already priced in the intense volatility ahead. Below is the core schedule I have compiled for everyone.
Tuesday, September 8. Before the U.S. stock market opens, please pay attention to bitcoin miner Canaan $CAN. After the market closes that day, marketing SaaS company Braze $BRZE and home improvement cloud software provider ServiceTitan $TTAN will each release their financial results.
Wednesday, September 9 is tightly packed. In the pre-market session, online pet retailer Chewy $CHWY and identity security software company SailPoint $SAIL will take the stage first. After the market closes, military drone manufacturer AeroVironment $AVAV, casual apparel brand American Eagle $AEO, travel SaaS platform Navan $NAVN, and ophthalmic equipment leader Cooper $COO will all successively release earnings reports.
Thursday, September 10 is arguably the main event of the week. The long-established department store Macy's $M will disclose its results before the market opens. In the after-hours session, database and cloud giant Oracle $ORCL and creative software leader Adobe $ADBE will be the center of attention, while premium home furnishings retailer RH $RH and used car auction platform Copart $CPRT will also announce earnings.
Friday, September 11. U.S. supermarket chain Kroger $KR will wrap up this busy earnings week in the pre-market session.
Facing such a packed schedule, are you ready to choose which call to buy?
This content is sponsored by @bitget_zh. Bitget for buying U.S. stocks: second-level entry and smooth trading.
Hello everyone, the upcoming 9.7 U.S. stock earnings week is full of highlights. This week, not only will two industry giants, Oracle and Adobe, lead the earnings releases, but on Wednesday and Friday we will also迎来 the two major inflation data bombs, PPI and CPI. There is no doubt that the market has already priced in the intense volatility ahead. Below is the core schedule I have compiled for everyone.
Tuesday, September 8. Before the U.S. stock market opens, please pay attention to bitcoin miner Canaan $CAN. After the market closes that day, marketing SaaS company Braze $BRZE and home improvement cloud software provider ServiceTitan $TTAN will each release their financial results.
Wednesday, September 9 is tightly packed. In the pre-market session, online pet retailer Chewy $CHWY and identity security software company SailPoint $SAIL will take the stage first. After the market closes, military drone manufacturer AeroVironment $AVAV, casual apparel brand American Eagle $AEO, travel SaaS platform Navan $NAVN, and ophthalmic equipment leader Cooper $COO will all successively release earnings reports.
Thursday, September 10 is arguably the main event of the week. The long-established department store Macy's $M will disclose its results before the market opens. In the after-hours session, database and cloud giant Oracle $ORCL and creative software leader Adobe $ADBE will be the center of attention, while premium home furnishings retailer RH $RH and used car auction platform Copart $CPRT will also announce earnings.
Friday, September 11. U.S. supermarket chain Kroger $KR will wrap up this busy earnings week in the pre-market session.
Facing such a packed schedule, are you ready to choose which call to buy?
This content is sponsored by @bitget_zh. Bitget for buying U.S. stocks: second-level entry and smooth trading.
Tuesday, September 8. Before the U.S. stock market opens, please pay attention to bitcoin miner Canaan $CAN. After the market closes that day, marketing SaaS company Braze $BRZE and home improvement cloud software provider ServiceTitan $TTAN will each release their financial results.
Wednesday, September 9 is tightly packed. In the pre-market session, online pet retailer Chewy $CHWY and identity security software company SailPoint $SAIL will take the stage first. After the market closes, military drone manufacturer AeroVironment $AVAV, casual apparel brand American Eagle $AEO, travel SaaS platform Navan $NAVN, and ophthalmic equipment leader Cooper $COO will all successively release earnings reports.
Thursday, September 10 is arguably the main event of the week. The long-established department store Macy's $M will disclose its results before the market opens. In the after-hours session, database and cloud giant Oracle $ORCL and creative software leader Adobe $ADBE will be the center of attention, while premium home furnishings retailer RH $RH and used car auction platform Copart $CPRT will also announce earnings.
Friday, September 11. U.S. supermarket chain Kroger $KR will wrap up this busy earnings week in the pre-market session.
Facing such a packed schedule, are you ready to choose which call to buy?
This content is sponsored by @bitget_zh. Bitget for buying U.S. stocks: second-level entry and smooth trading.
294
·
--
Verified
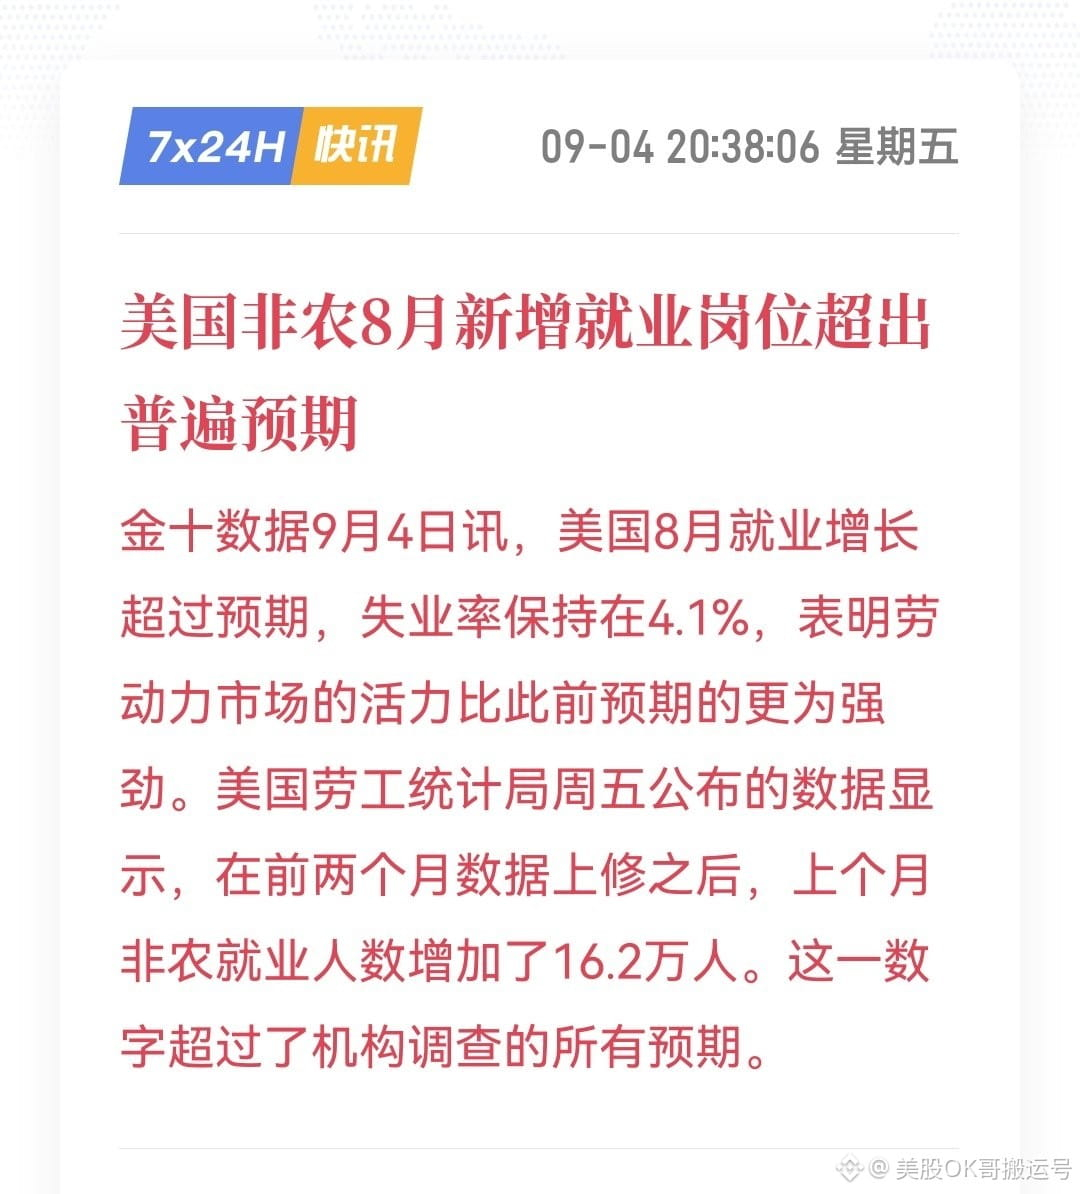
The situation everyone has been worried about has still happened. The expectations for rate hikes, which had finally been calmed down by Waller, quickly surged again in the blink of an eye.
Assessing the current overall situation, if inflation data cannot come in far below market expectations, the Fed will probably find it very hard to justify not taking action to raise rates.
Facing the current complex situation, it is indeed very much necessary now for Chuanzi to release a major piece of extremely significant good news for everyone.
The situation everyone has been worried about has still happened. The expectations for rate hikes, which had finally been calmed down by Waller, quickly surged again in the blink of an eye.
Assessing the current overall situation, if inflation data cannot come in far below market expectations, the Fed will probably find it very hard to justify not taking action to raise rates.
Facing the current complex situation, it is indeed very much necessary now for Chuanzi to release a major piece of extremely significant good news for everyone.
Assessing the current overall situation, if inflation data cannot come in far below market expectations, the Fed will probably find it very hard to justify not taking action to raise rates.
Facing the current complex situation, it is indeed very much necessary now for Chuanzi to release a major piece of extremely significant good news for everyone.
2.5k
·
--
Verified
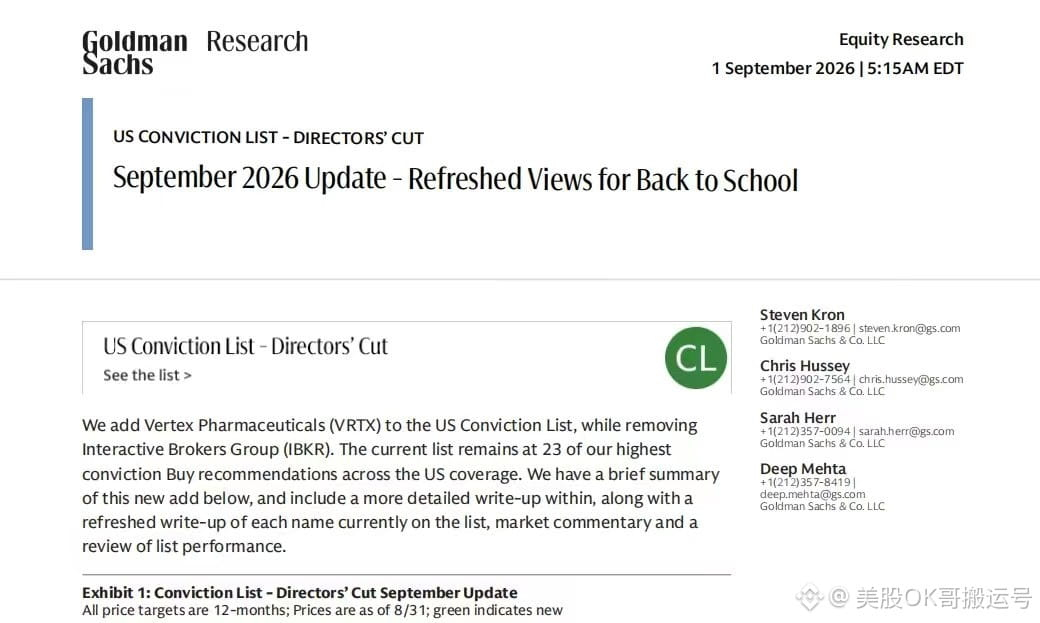
Hello, fellow investors. Goldman Sachs has just released its September U.S. stock “strong buy” conviction list. This edition includes adjustments to stock selection: VRTX has been newly added, while IBKR has been removed. This roster doesn’t seem to crowd too many of the hottest names in the market, so it offers relatively high reference value. Below, I’ll go through and present the complete list along with the rationale for each inclusion.
First, let’s look at the key companies in the consumer sector. Estee Lauder (EL) is currently in a high-growth track, with its operating revenue set to approach an important growth inflection point. O’Reilly Automotive (ORLY) adopts an active expansion strategy within a comparatively defensive industry backdrop. Tyson Foods (TSN), thanks to its diversified business layout, is fully benefiting from the momentum of the hottest food-industry growth themes. Viking Holdings (VIK), though it operates in the cruise industry where macro conditions are more volatile, still shows top-tier growth potential within the sector.
In the financial sector, Citizens Financial Group (CFG) stands out as a top-tier operating institution in the industry, with its overall strength continuing to climb. TPG (TPG) is compelling in that it’s not only a platform with sustainable development capabilities, but its current valuation level is also highly discounted and attractive. Wells Fargo (WFC) demonstrates very strong revenue growth momentum and also has a clear advantage in operating leverage.
The healthcare and medical sector list is also worth a careful look. The newly added large biotechnology company, Vertex Pharmaceuticals (VRTX), is very likely to capture major business opportunities in the future—five large-scale initiatives with potential reaching the multi-billion-dollar level. UnitedHealth Group (UNH), a giant in the insurance industry, is currently seeking longer-term development by streamlining its businesses, and is expected to see an additional acceleration in earnings per share in the context of a more favorable, cyclical environment soon.
The number of industrial companies included is relatively high. Air Products and Chemicals (APD) is steadily returning to its core business, and the condition of its downstream markets is extremely strong. As a typical value stock, Carlisle (CSL) is about to enter an important turning point that will drive positive earnings growth. Casella Waste Systems (CWST) not only has sustainable growth momentum, but its overall profit margin is also expected to expand further. Delta Air Lines (DAL), by continually optimizing the competitive landscape of the industry, maintains a leading position among industry peers. Loar Holdings (LOAR) is an aviation and aerospace M&A “compound upside” type business in the early stage of development, with broad future potential. United Parcel Service (UPS) has extremely solid and reliable fundamentals; both its operating revenue and overall profitability have turned toward improvement.
Turning to natural resources, ConocoPhillips (COP) is now in a phase of rich harvest. Golar LNG (GLNG) continues to grow under the catalyst of multiple favorable factors, while also maintaining stable and reliable profitability. Nextpower (NXT), as an emerging technology platform provider within electrification, shows truly distinctive development potential.
Finally, we have the technology, media, and communications industries. Applied Materials (AMAT), as a leader in both technology and its industry segment, currently has product demand that is urgently needed in the market. DoorDash (DASH), a leader in the online delivery sector, continues to benefit from consumers’ healthier preference for online delivery. Celestica (CLS) is a scalable technology hardware supplier with very unique design advantages. Microsoft (MSFT), a hyperscale cloud provider, is seeing its performance indicators begin a new upward trend. Block (XYZ) not only has ample cash flow and continuously improving market share, but also has a fresh growth logic driven by AI efficiency gains.
If you need to open a U.S. stock account, you can check the pinned content on my homepage at any time to get detailed instructions.
Hello, fellow investors. Goldman Sachs has just released its September U.S. stock “strong buy” conviction list. This edition includes adjustments to stock selection: VRTX has been newly added, while IBKR has been removed. This roster doesn’t seem to crowd too many of the hottest names in the market, so it offers relatively high reference value. Below, I’ll go through and present the complete list along with the rationale for each inclusion.
First, let’s look at the key companies in the consumer sector. Estee Lauder (EL) is currently in a high-growth track, with its operating revenue set to approach an important growth inflection point. O’Reilly Automotive (ORLY) adopts an active expansion strategy within a comparatively defensive industry backdrop. Tyson Foods (TSN), thanks to its diversified business layout, is fully benefiting from the momentum of the hottest food-industry growth themes. Viking Holdings (VIK), though it operates in the cruise industry where macro conditions are more volatile, still shows top-tier growth potential within the sector.
In the financial sector, Citizens Financial Group (CFG) stands out as a top-tier operating institution in the industry, with its overall strength continuing to climb. TPG (TPG) is compelling in that it’s not only a platform with sustainable development capabilities, but its current valuation level is also highly discounted and attractive. Wells Fargo (WFC) demonstrates very strong revenue growth momentum and also has a clear advantage in operating leverage.
The healthcare and medical sector list is also worth a careful look. The newly added large biotechnology company, Vertex Pharmaceuticals (VRTX), is very likely to capture major business opportunities in the future—five large-scale initiatives with potential reaching the multi-billion-dollar level. UnitedHealth Group (UNH), a giant in the insurance industry, is currently seeking longer-term development by streamlining its businesses, and is expected to see an additional acceleration in earnings per share in the context of a more favorable, cyclical environment soon.
The number of industrial companies included is relatively high. Air Products and Chemicals (APD) is steadily returning to its core business, and the condition of its downstream markets is extremely strong. As a typical value stock, Carlisle (CSL) is about to enter an important turning point that will drive positive earnings growth. Casella Waste Systems (CWST) not only has sustainable growth momentum, but its overall profit margin is also expected to expand further. Delta Air Lines (DAL), by continually optimizing the competitive landscape of the industry, maintains a leading position among industry peers. Loar Holdings (LOAR) is an aviation and aerospace M&A “compound upside” type business in the early stage of development, with broad future potential. United Parcel Service (UPS) has extremely solid and reliable fundamentals; both its operating revenue and overall profitability have turned toward improvement.
Turning to natural resources, ConocoPhillips (COP) is now in a phase of rich harvest. Golar LNG (GLNG) continues to grow under the catalyst of multiple favorable factors, while also maintaining stable and reliable profitability. Nextpower (NXT), as an emerging technology platform provider within electrification, shows truly distinctive development potential.
Finally, we have the technology, media, and communications industries. Applied Materials (AMAT), as a leader in both technology and its industry segment, currently has product demand that is urgently needed in the market. DoorDash (DASH), a leader in the online delivery sector, continues to benefit from consumers’ healthier preference for online delivery. Celestica (CLS) is a scalable technology hardware supplier with very unique design advantages. Microsoft (MSFT), a hyperscale cloud provider, is seeing its performance indicators begin a new upward trend. Block (XYZ) not only has ample cash flow and continuously improving market share, but also has a fresh growth logic driven by AI efficiency gains.
If you need to open a U.S. stock account, you can check the pinned content on my homepage at any time to get detailed instructions.
First, let’s look at the key companies in the consumer sector. Estee Lauder (EL) is currently in a high-growth track, with its operating revenue set to approach an important growth inflection point. O’Reilly Automotive (ORLY) adopts an active expansion strategy within a comparatively defensive industry backdrop. Tyson Foods (TSN), thanks to its diversified business layout, is fully benefiting from the momentum of the hottest food-industry growth themes. Viking Holdings (VIK), though it operates in the cruise industry where macro conditions are more volatile, still shows top-tier growth potential within the sector.
In the financial sector, Citizens Financial Group (CFG) stands out as a top-tier operating institution in the industry, with its overall strength continuing to climb. TPG (TPG) is compelling in that it’s not only a platform with sustainable development capabilities, but its current valuation level is also highly discounted and attractive. Wells Fargo (WFC) demonstrates very strong revenue growth momentum and also has a clear advantage in operating leverage.
The healthcare and medical sector list is also worth a careful look. The newly added large biotechnology company, Vertex Pharmaceuticals (VRTX), is very likely to capture major business opportunities in the future—five large-scale initiatives with potential reaching the multi-billion-dollar level. UnitedHealth Group (UNH), a giant in the insurance industry, is currently seeking longer-term development by streamlining its businesses, and is expected to see an additional acceleration in earnings per share in the context of a more favorable, cyclical environment soon.
The number of industrial companies included is relatively high. Air Products and Chemicals (APD) is steadily returning to its core business, and the condition of its downstream markets is extremely strong. As a typical value stock, Carlisle (CSL) is about to enter an important turning point that will drive positive earnings growth. Casella Waste Systems (CWST) not only has sustainable growth momentum, but its overall profit margin is also expected to expand further. Delta Air Lines (DAL), by continually optimizing the competitive landscape of the industry, maintains a leading position among industry peers. Loar Holdings (LOAR) is an aviation and aerospace M&A “compound upside” type business in the early stage of development, with broad future potential. United Parcel Service (UPS) has extremely solid and reliable fundamentals; both its operating revenue and overall profitability have turned toward improvement.
Turning to natural resources, ConocoPhillips (COP) is now in a phase of rich harvest. Golar LNG (GLNG) continues to grow under the catalyst of multiple favorable factors, while also maintaining stable and reliable profitability. Nextpower (NXT), as an emerging technology platform provider within electrification, shows truly distinctive development potential.
Finally, we have the technology, media, and communications industries. Applied Materials (AMAT), as a leader in both technology and its industry segment, currently has product demand that is urgently needed in the market. DoorDash (DASH), a leader in the online delivery sector, continues to benefit from consumers’ healthier preference for online delivery. Celestica (CLS) is a scalable technology hardware supplier with very unique design advantages. Microsoft (MSFT), a hyperscale cloud provider, is seeing its performance indicators begin a new upward trend. Block (XYZ) not only has ample cash flow and continuously improving market share, but also has a fresh growth logic driven by AI efficiency gains.
If you need to open a U.S. stock account, you can check the pinned content on my homepage at any time to get detailed instructions.
624
·
--
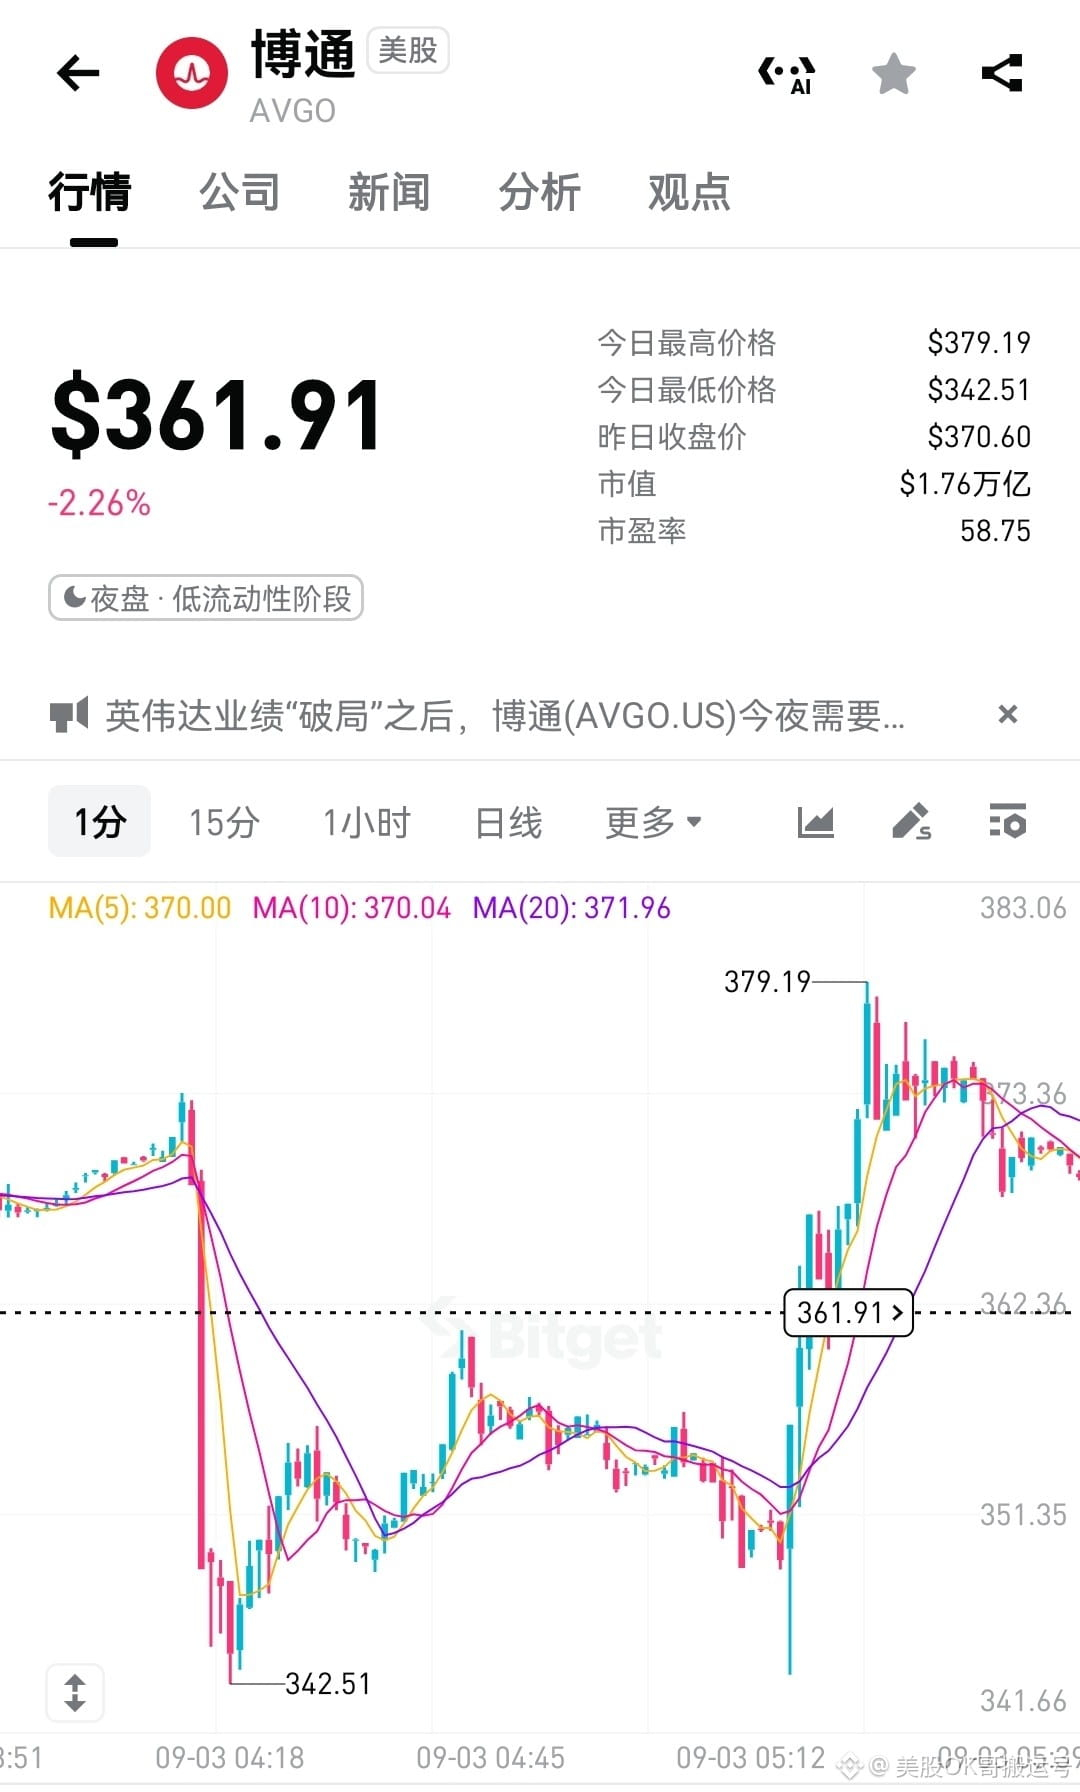
By observing the data trends on the Bitget platform, it is clear that the latest earnings report released by Broadcom was relatively lackluster, causing its stock price to drop sharply in the early part of the data release. However, thanks to the positive signals released by the company’s CEO during the subsequent earnings call, the stock price quickly managed to recover. This market reaction is very similar to the situation faced by MRVL, another company in the ASIC space, after it released its earnings report at the end of August. As long as performance fails to deliver enough surprises, the stock price is inevitably likely to meet a cool reception. The core logic behind this is that investors have already become accustomed to using Nvidia’s outstanding results as an extremely high benchmark, and they apply that standard to scrutinize all leading companies in the industry.
Although market sentiment may fluctuate in the short term, the industry is still sending encouraging positive signals. First, the current AI arms race is still in full swing, with no sign that this momentum is approaching a turning point. Second, the growth momentum of ASIC chips has already surpassed that of GPUs, and it is expected that by 2027, their total units shipped will overtake GPU shipments. As the focus of AI capital expenditures gradually shifts from model training to application inference, this is undoubtedly a potential major positive for AVGO and MRVL, both of which saw their stocks fall more than warranted earlier on. These two companies are very well positioned to benefit significantly from this shift in the future.
Looking ahead to upcoming macro developments, all market attention will be centered on Waller’s public remarks at 8:30 tonight, as well as the non-farm employment data scheduled to be released at 8:30 tomorrow evening. As the last heavyweight policymaker to speak publicly before the quiet period ahead of the September FOMC, Waller’s stance carries extremely high indicator significance, and he is also a key swing vote in determining the direction of policy. In addition, the impact of the major non-farm data on market expectations needs no further elaboration—these two core events will directly determine whether the final decision on future rate hikes will be made. Investors are advised to prepare in advance so they can respond calmly to the significant market volatility that is likely to come.
By observing the data trends on the Bitget platform, it is clear that the latest earnings report released by Broadcom was relatively lackluster, causing its stock price to drop sharply in the early part of the data release. However, thanks to the positive signals released by the company’s CEO during the subsequent earnings call, the stock price quickly managed to recover. This market reaction is very similar to the situation faced by MRVL, another company in the ASIC space, after it released its earnings report at the end of August. As long as performance fails to deliver enough surprises, the stock price is inevitably likely to meet a cool reception. The core logic behind this is that investors have already become accustomed to using Nvidia’s outstanding results as an extremely high benchmark, and they apply that standard to scrutinize all leading companies in the industry.
Although market sentiment may fluctuate in the short term, the industry is still sending encouraging positive signals. First, the current AI arms race is still in full swing, with no sign that this momentum is approaching a turning point. Second, the growth momentum of ASIC chips has already surpassed that of GPUs, and it is expected that by 2027, their total units shipped will overtake GPU shipments. As the focus of AI capital expenditures gradually shifts from model training to application inference, this is undoubtedly a potential major positive for AVGO and MRVL, both of which saw their stocks fall more than warranted earlier on. These two companies are very well positioned to benefit significantly from this shift in the future.
Looking ahead to upcoming macro developments, all market attention will be centered on Waller’s public remarks at 8:30 tonight, as well as the non-farm employment data scheduled to be released at 8:30 tomorrow evening. As the last heavyweight policymaker to speak publicly before the quiet period ahead of the September FOMC, Waller’s stance carries extremely high indicator significance, and he is also a key swing vote in determining the direction of policy. In addition, the impact of the major non-farm data on market expectations needs no further elaboration—these two core events will directly determine whether the final decision on future rate hikes will be made. Investors are advised to prepare in advance so they can respond calmly to the significant market volatility that is likely to come.
Although market sentiment may fluctuate in the short term, the industry is still sending encouraging positive signals. First, the current AI arms race is still in full swing, with no sign that this momentum is approaching a turning point. Second, the growth momentum of ASIC chips has already surpassed that of GPUs, and it is expected that by 2027, their total units shipped will overtake GPU shipments. As the focus of AI capital expenditures gradually shifts from model training to application inference, this is undoubtedly a potential major positive for AVGO and MRVL, both of which saw their stocks fall more than warranted earlier on. These two companies are very well positioned to benefit significantly from this shift in the future.
Looking ahead to upcoming macro developments, all market attention will be centered on Waller’s public remarks at 8:30 tonight, as well as the non-farm employment data scheduled to be released at 8:30 tomorrow evening. As the last heavyweight policymaker to speak publicly before the quiet period ahead of the September FOMC, Waller’s stance carries extremely high indicator significance, and he is also a key swing vote in determining the direction of policy. In addition, the impact of the major non-farm data on market expectations needs no further elaboration—these two core events will directly determine whether the final decision on future rate hikes will be made. Investors are advised to prepare in advance so they can respond calmly to the significant market volatility that is likely to come.
238
·
--
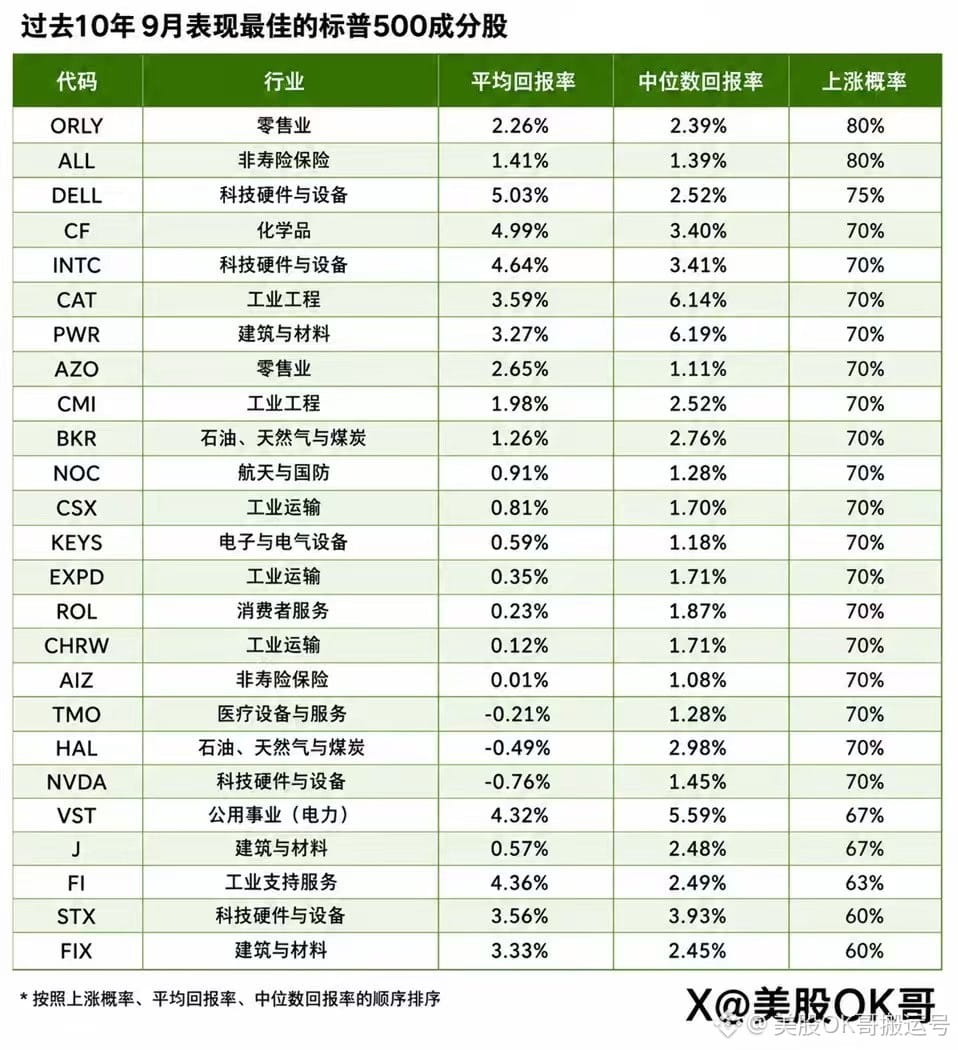
Looking back at the historical performance of the U.S. stock market, September is typically the weakest month of the year, which makes the entire market inevitably filled with caution and anxiety. However, the latest release of the small non-farm payroll data has given this month a rather positive start.
Despite this good news, major investment banks are still maintaining a high level of alertness. Across the industry, there is a prevailing sense of tense anticipation, as if a storm is on the way. Based on market statistical experience from the past decade, during this kind of challenging period, defensive sectors often stand out and achieve better results. Wishing all investors good luck and positive returns this September.
Looking back at the historical performance of the U.S. stock market, September is typically the weakest month of the year, which makes the entire market inevitably filled with caution and anxiety. However, the latest release of the small non-farm payroll data has given this month a rather positive start.
Despite this good news, major investment banks are still maintaining a high level of alertness. Across the industry, there is a prevailing sense of tense anticipation, as if a storm is on the way. Based on market statistical experience from the past decade, during this kind of challenging period, defensive sectors often stand out and achieve better results. Wishing all investors good luck and positive returns this September.
Despite this good news, major investment banks are still maintaining a high level of alertness. Across the industry, there is a prevailing sense of tense anticipation, as if a storm is on the way. Based on market statistical experience from the past decade, during this kind of challenging period, defensive sectors often stand out and achieve better results. Wishing all investors good luck and positive returns this September.
284
·
--
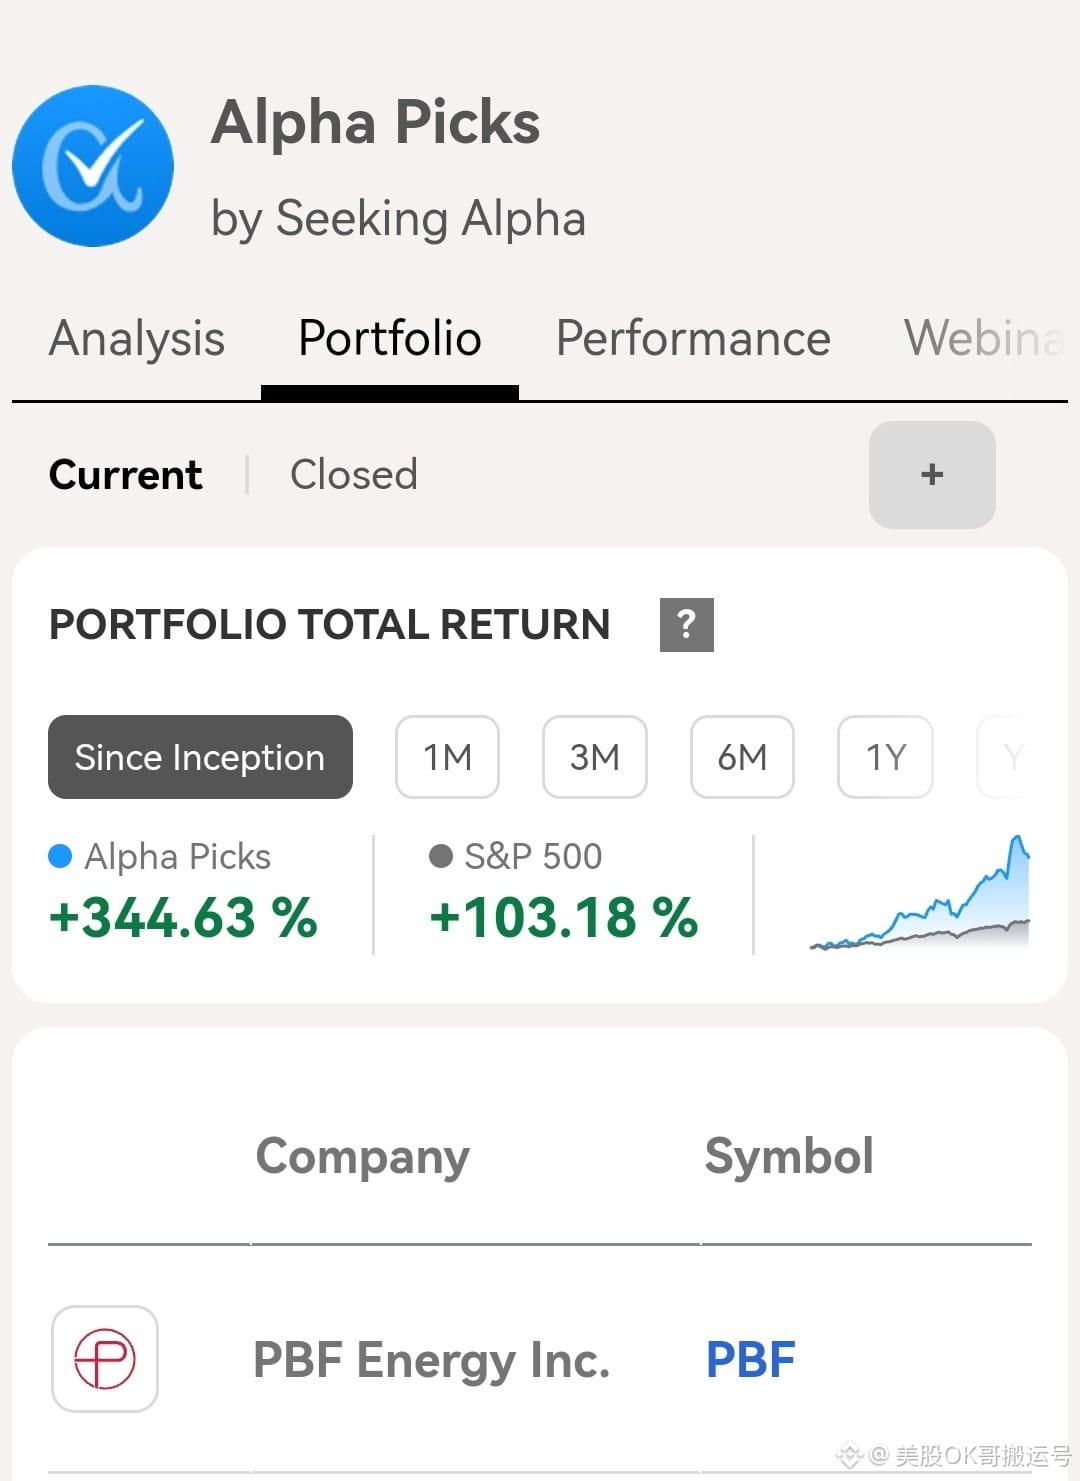
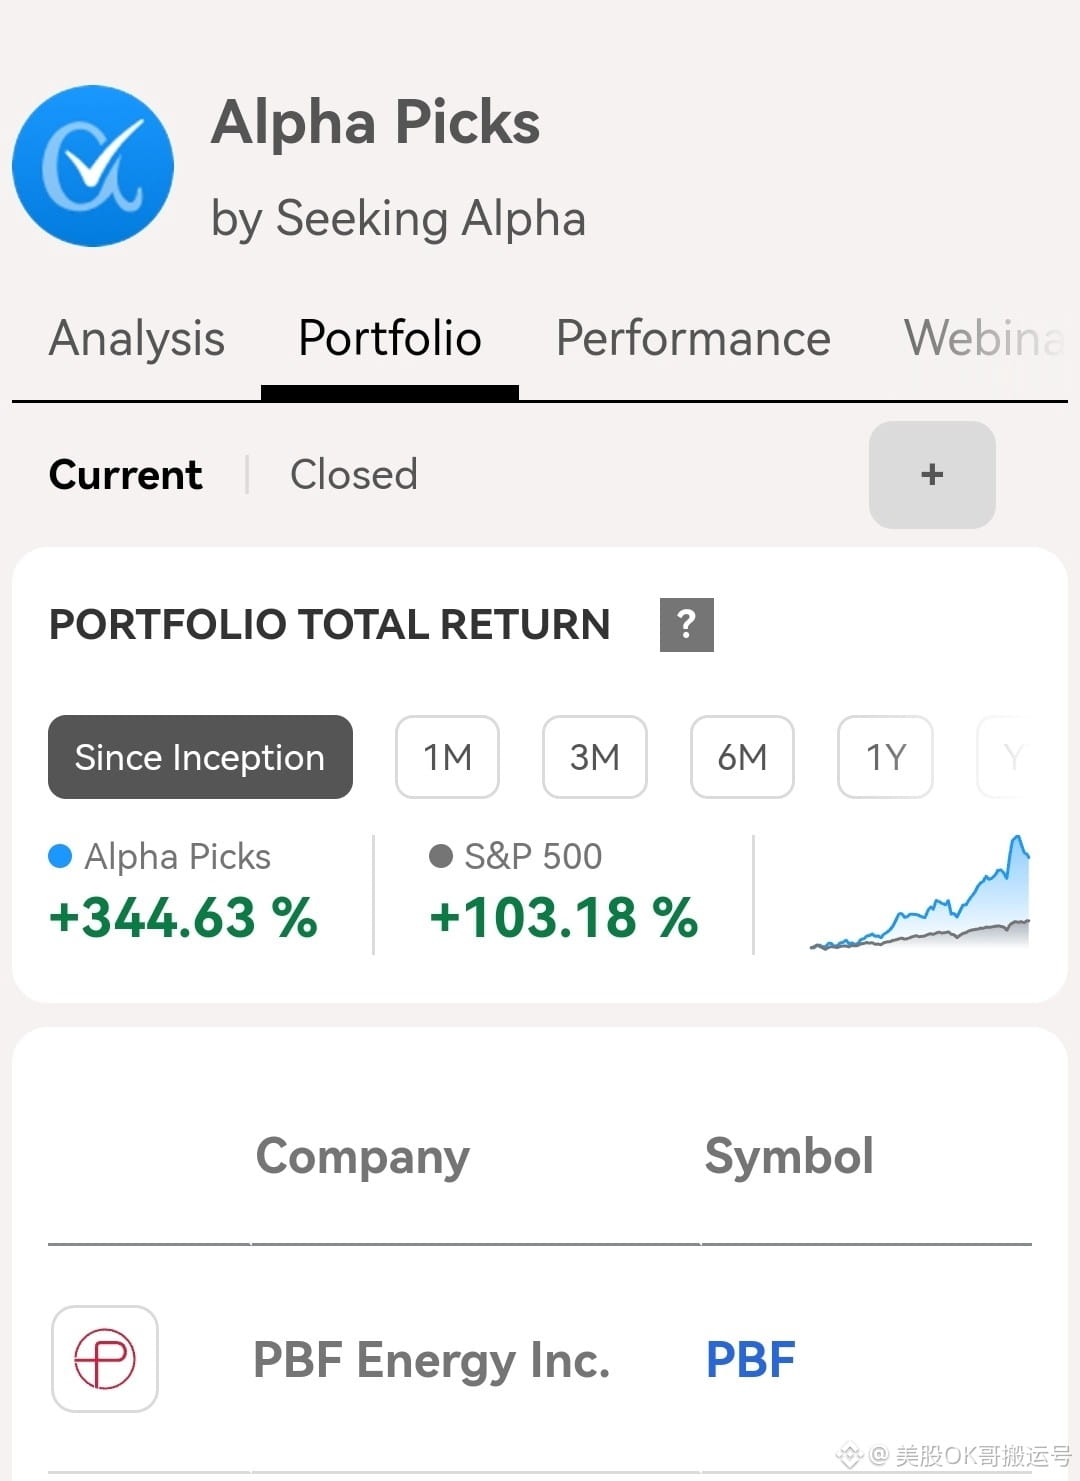
The latest curated stock list published by Seeking Alpha in September has been revealed, and the star this time is the cyclical refiner $PBF. To help everyone understand the core buy logic, I’ve systematically整理 it for this stock.
As one of the largest independent refiners in the U.S., $PBF currently operates six refineries. Of particular note is that its refining facility in California successfully resumed production in May of this year. Given that refinery capacity along the U.S. West Coast is relatively scarce, the company is well positioned to benefit from California’s local supply gap, as well as the globally tight supply of refined products.
On the financial front, the company’s second-quarter results were impressive. Its adjusted earnings per share reached as high as $6.22, which significantly exceeded prior market expectations. Meanwhile, during the quarter the company successfully reduced net debt by more than $1.4 billion. With this move, the company expects to save roughly $60 million in annual day-to-day operating costs, and its return on net assets also clearly outpaces the industry median.
Market professionals have also given high praise to the company’s outlook. Over the most recent 90-day period, analysts have collectively raised their full-year earnings forecast for the company 10 times, with no downgrades during the same period. In terms of quantified ratings across areas such as business growth, market momentum, and earnings estimate revisions, this stock has demonstrated exceptionally strong momentum. Compared with the broader energy sector, its current stock price is trading at a significant discount. In addition, the stock’s forward dividend yield is 1.51%. Backed by the company’s ample cash reserves, its dividend payments offer a very high margin of safety.
If you’d like to unlock more professional investment insights, please feel free to use the 20%-off exclusive offer link below to subscribe to Seeking Alpha’s member service:
Seeking Alpha Premium:https://link.seekingalpha.com/4CMF46B/4G6SHH/
Seeking Alpha Alpha Picks:https://link.seekingalpha.com/4CMF46B/4HKP84/
The latest curated stock list published by Seeking Alpha in September has been revealed, and the star this time is the cyclical refiner $PBF. To help everyone understand the core buy logic, I’ve systematically整理 it for this stock.
As one of the largest independent refiners in the U.S., $PBF currently operates six refineries. Of particular note is that its refining facility in California successfully resumed production in May of this year. Given that refinery capacity along the U.S. West Coast is relatively scarce, the company is well positioned to benefit from California’s local supply gap, as well as the globally tight supply of refined products.
On the financial front, the company’s second-quarter results were impressive. Its adjusted earnings per share reached as high as $6.22, which significantly exceeded prior market expectations. Meanwhile, during the quarter the company successfully reduced net debt by more than $1.4 billion. With this move, the company expects to save roughly $60 million in annual day-to-day operating costs, and its return on net assets also clearly outpaces the industry median.
Market professionals have also given high praise to the company’s outlook. Over the most recent 90-day period, analysts have collectively raised their full-year earnings forecast for the company 10 times, with no downgrades during the same period. In terms of quantified ratings across areas such as business growth, market momentum, and earnings estimate revisions, this stock has demonstrated exceptionally strong momentum. Compared with the broader energy sector, its current stock price is trading at a significant discount. In addition, the stock’s forward dividend yield is 1.51%. Backed by the company’s ample cash reserves, its dividend payments offer a very high margin of safety.
If you’d like to unlock more professional investment insights, please feel free to use the 20%-off exclusive offer link below to subscribe to Seeking Alpha’s member service:
Seeking Alpha Premium:https://link.seekingalpha.com/4CMF46B/4G6SHH/
Seeking Alpha Alpha Picks:https://link.seekingalpha.com/4CMF46B/4HKP84/
As one of the largest independent refiners in the U.S., $PBF currently operates six refineries. Of particular note is that its refining facility in California successfully resumed production in May of this year. Given that refinery capacity along the U.S. West Coast is relatively scarce, the company is well positioned to benefit from California’s local supply gap, as well as the globally tight supply of refined products.
On the financial front, the company’s second-quarter results were impressive. Its adjusted earnings per share reached as high as $6.22, which significantly exceeded prior market expectations. Meanwhile, during the quarter the company successfully reduced net debt by more than $1.4 billion. With this move, the company expects to save roughly $60 million in annual day-to-day operating costs, and its return on net assets also clearly outpaces the industry median.
Market professionals have also given high praise to the company’s outlook. Over the most recent 90-day period, analysts have collectively raised their full-year earnings forecast for the company 10 times, with no downgrades during the same period. In terms of quantified ratings across areas such as business growth, market momentum, and earnings estimate revisions, this stock has demonstrated exceptionally strong momentum. Compared with the broader energy sector, its current stock price is trading at a significant discount. In addition, the stock’s forward dividend yield is 1.51%. Backed by the company’s ample cash reserves, its dividend payments offer a very high margin of safety.
If you’d like to unlock more professional investment insights, please feel free to use the 20%-off exclusive offer link below to subscribe to Seeking Alpha’s member service:
Seeking Alpha Premium:https://link.seekingalpha.com/4CMF46B/4G6SHH/
Seeking Alpha Alpha Picks:https://link.seekingalpha.com/4CMF46B/4HKP84/
94
·
--
Seeking Alpha’s latest selected stocks for September have been released. This time, our key recommendation is the cyclical stock in the refining industry: $PBF. Here is a brief rundown of the core reasons why this stock is worth buying.
As one of the leading independent refiners in the United States by scale, PBF currently owns and operates six refineries. Notably, its refinery in California successfully resumed production in May of this year. With refining capacity relatively scarce on the U.S. West Coast, plus a supply gap in the California local market, and the global refined products supply overall remaining tight, these factors are all expected to directly benefit the company.
From the financials, the company delivered an outstanding performance in Q2. Its adjusted earnings per share were as high as $6.22, far exceeding market expectations. In this quarter, PBF not only significantly reduced net debt by more than $1.4 billion—an action that can also save the company approximately $60 million in operating costs each year. Meanwhile, the company’s ROE is also clearly above the industry’s median.
Analysts are very optimistic about this stock. Over the past 90 days, full-year earnings forecasts have been raised 10 times in succession, with no downgrades recorded. In terms of quant-based ratings such as earnings revisions, growth, and momentum, the stock has shown strong momentum. Compared with the broader energy sector, the stock’s current price offers substantial valuation discount potential. In addition, its forward dividend yield is 1.51%, and with ample cash reserves, the safety margin for dividend payments is very high.
If you’d like to become an SA member, feel free to use the links below to get a 20% discount exclusive offer:
Seeking Alpha Premium:https://link.seekingalpha.com/4CMF46B/4G6SHH/
Seeking Alpha Alpha Picks:https://link.seekingalpha.com/4CMF46B/4HKP84/
Seeking Alpha’s latest selected stocks for September have been released. This time, our key recommendation is the cyclical stock in the refining industry: $PBF. Here is a brief rundown of the core reasons why this stock is worth buying.
As one of the leading independent refiners in the United States by scale, PBF currently owns and operates six refineries. Notably, its refinery in California successfully resumed production in May of this year. With refining capacity relatively scarce on the U.S. West Coast, plus a supply gap in the California local market, and the global refined products supply overall remaining tight, these factors are all expected to directly benefit the company.
From the financials, the company delivered an outstanding performance in Q2. Its adjusted earnings per share were as high as $6.22, far exceeding market expectations. In this quarter, PBF not only significantly reduced net debt by more than $1.4 billion—an action that can also save the company approximately $60 million in operating costs each year. Meanwhile, the company’s ROE is also clearly above the industry’s median.
Analysts are very optimistic about this stock. Over the past 90 days, full-year earnings forecasts have been raised 10 times in succession, with no downgrades recorded. In terms of quant-based ratings such as earnings revisions, growth, and momentum, the stock has shown strong momentum. Compared with the broader energy sector, the stock’s current price offers substantial valuation discount potential. In addition, its forward dividend yield is 1.51%, and with ample cash reserves, the safety margin for dividend payments is very high.
If you’d like to become an SA member, feel free to use the links below to get a 20% discount exclusive offer:
Seeking Alpha Premium:https://link.seekingalpha.com/4CMF46B/4G6SHH/
Seeking Alpha Alpha Picks:https://link.seekingalpha.com/4CMF46B/4HKP84/
As one of the leading independent refiners in the United States by scale, PBF currently owns and operates six refineries. Notably, its refinery in California successfully resumed production in May of this year. With refining capacity relatively scarce on the U.S. West Coast, plus a supply gap in the California local market, and the global refined products supply overall remaining tight, these factors are all expected to directly benefit the company.
From the financials, the company delivered an outstanding performance in Q2. Its adjusted earnings per share were as high as $6.22, far exceeding market expectations. In this quarter, PBF not only significantly reduced net debt by more than $1.4 billion—an action that can also save the company approximately $60 million in operating costs each year. Meanwhile, the company’s ROE is also clearly above the industry’s median.
Analysts are very optimistic about this stock. Over the past 90 days, full-year earnings forecasts have been raised 10 times in succession, with no downgrades recorded. In terms of quant-based ratings such as earnings revisions, growth, and momentum, the stock has shown strong momentum. Compared with the broader energy sector, the stock’s current price offers substantial valuation discount potential. In addition, its forward dividend yield is 1.51%, and with ample cash reserves, the safety margin for dividend payments is very high.
If you’d like to become an SA member, feel free to use the links below to get a 20% discount exclusive offer:
Seeking Alpha Premium:https://link.seekingalpha.com/4CMF46B/4G6SHH/
Seeking Alpha Alpha Picks:https://link.seekingalpha.com/4CMF46B/4HKP84/
318
·
--
Partly True
The current 10-year U.S. Treasury yield has already touched the 4.8% mark. This development reminds me of a forecast made by Larry Fink, the head of BlackRock, earlier this year in January. He noted at the time that if the 10-year U.S. Treasury yield were to break above 5%, it would trigger an extremely bad scenario—not only directly hitting the entire stock market, but also forcing the market to undergo a comprehensive repricing of all types of equity assets.
The current 10-year U.S. Treasury yield has already touched the 4.8% mark. This development reminds me of a forecast made by Larry Fink, the head of BlackRock, earlier this year in January. He noted at the time that if the 10-year U.S. Treasury yield were to break above 5%, it would trigger an extremely bad scenario—not only directly hitting the entire stock market, but also forcing the market to undergo a comprehensive repricing of all types of equity assets.
2k
·
--
As the market began pricing in expectations for Tesla’s “Cybercab” event on September 3 ahead of time, the company’s stock showed signs of上涨 last night. Regarding this highly anticipated event, I personally outlined two core lines of logic that are well worth paying attention to.
The first focus is its highly imaginative business vision—specifically, when ordinary consumers will be able to buy this vehicle at a cost below 30,000 u, and have it operate fully autonomously to take on orders and generate profits on the road. Referencing the current real-world operating status of Austin’s robotaxi, I ran an initial estimate. Assuming Tesla extracts only a 30% commission, if the vehicle is deployed full-time, it could recoup the cost in about one year. If instead it’s used for daily personal commuting plus occasional “spare time” order-taking, the payback period would be between two and three years. Once this profitability model for the Cybercab is validated as feasible, Tesla’s operating model could quickly shift from official company-owned direct operations to broad public franchising. Based on current annual production capacity of 125,000 vehicles, if Tesla invests and operates it entirely in-house, this revenue would account for only about 4% of total sales—an impact that is negligible. However, if purchase access is opened to the public and capacity jumps to 1 million vehicles per year, it would be truly disruptive—becoming a massive engine for boosting the company’s market value. At that point, the detailed data and timetable that Mr. Musk has disclosed are likely to put significant competitive pressure on Uber.
The second focus is whether the Optimus robot will unexpectedly make a stage appearance at the event. Given that the two products previously had a compelling synergy at the last event, this possibility is entirely real. It’s clear that Mr. Musk is currently brewing a major move. Although the V3 version has already officially entered production, the company has not released any video or imagery so far. Combined with the days-ago praise from Jason for the product, external expectations have reached a peak. Everyone is eagerly hoping this event will deliver extraordinary surprises.
As the market began pricing in expectations for Tesla’s “Cybercab” event on September 3 ahead of time, the company’s stock showed signs of上涨 last night. Regarding this highly anticipated event, I personally outlined two core lines of logic that are well worth paying attention to.
The first focus is its highly imaginative business vision—specifically, when ordinary consumers will be able to buy this vehicle at a cost below 30,000 u, and have it operate fully autonomously to take on orders and generate profits on the road. Referencing the current real-world operating status of Austin’s robotaxi, I ran an initial estimate. Assuming Tesla extracts only a 30% commission, if the vehicle is deployed full-time, it could recoup the cost in about one year. If instead it’s used for daily personal commuting plus occasional “spare time” order-taking, the payback period would be between two and three years. Once this profitability model for the Cybercab is validated as feasible, Tesla’s operating model could quickly shift from official company-owned direct operations to broad public franchising. Based on current annual production capacity of 125,000 vehicles, if Tesla invests and operates it entirely in-house, this revenue would account for only about 4% of total sales—an impact that is negligible. However, if purchase access is opened to the public and capacity jumps to 1 million vehicles per year, it would be truly disruptive—becoming a massive engine for boosting the company’s market value. At that point, the detailed data and timetable that Mr. Musk has disclosed are likely to put significant competitive pressure on Uber.
The second focus is whether the Optimus robot will unexpectedly make a stage appearance at the event. Given that the two products previously had a compelling synergy at the last event, this possibility is entirely real. It’s clear that Mr. Musk is currently brewing a major move. Although the V3 version has already officially entered production, the company has not released any video or imagery so far. Combined with the days-ago praise from Jason for the product, external expectations have reached a peak. Everyone is eagerly hoping this event will deliver extraordinary surprises.
The first focus is its highly imaginative business vision—specifically, when ordinary consumers will be able to buy this vehicle at a cost below 30,000 u, and have it operate fully autonomously to take on orders and generate profits on the road. Referencing the current real-world operating status of Austin’s robotaxi, I ran an initial estimate. Assuming Tesla extracts only a 30% commission, if the vehicle is deployed full-time, it could recoup the cost in about one year. If instead it’s used for daily personal commuting plus occasional “spare time” order-taking, the payback period would be between two and three years. Once this profitability model for the Cybercab is validated as feasible, Tesla’s operating model could quickly shift from official company-owned direct operations to broad public franchising. Based on current annual production capacity of 125,000 vehicles, if Tesla invests and operates it entirely in-house, this revenue would account for only about 4% of total sales—an impact that is negligible. However, if purchase access is opened to the public and capacity jumps to 1 million vehicles per year, it would be truly disruptive—becoming a massive engine for boosting the company’s market value. At that point, the detailed data and timetable that Mr. Musk has disclosed are likely to put significant competitive pressure on Uber.
The second focus is whether the Optimus robot will unexpectedly make a stage appearance at the event. Given that the two products previously had a compelling synergy at the last event, this possibility is entirely real. It’s clear that Mr. Musk is currently brewing a major move. Although the V3 version has already officially entered production, the company has not released any video or imagery so far. Combined with the days-ago praise from Jason for the product, external expectations have reached a peak. Everyone is eagerly hoping this event will deliver extraordinary surprises.
1
155
·
--
Let’s take a moment to review ten U.S. large-cap, broad-market, index ETFs that outperformed $VOO this year. These funds give investors diverse perspectives on market coverage and investment strategies.
In tenth place is the S&P total U.S. stock market ETF, $ITOT, which delivered a gain of 13.0% this year. As a low-cost “U.S. stock basket” product, it broadly covers large-, mid-, and small-cap stocks, holding about 2,440 stocks in total. Right behind it in ninth place is the U.S. total market ETF, $SCHB, up 13.2%. The logic behind this fund is very simple and straightforward: it buys the entire U.S. market, including stocks from large-, mid-, and small-cap companies as well, with a holdings count of roughly 2,380.
Eighth place goes to the total market index ETF $VTI, which rose 13.5%. It’s widely considered the investment vehicle closest to directly buying the entire U.S. stock market. With a massive portfolio of more than 3,500 stocks, its coverage far exceeds that of $VOO. Seventh place is the U.S. total stock market ETF $DFAC, recording a 15.3% return. The fund’s key feature is that it uses factor-enhanced processing on a core U.S. asset allocation.
Sixth place belongs to the high-dividend index ETF $VYM, up 15.8%. This fund includes 600+ U.S. stocks with high-dividend characteristics, and its weighting is relatively diversified. Fifth place is the relatively standout equal-weighted index ETF $RSP, which gained 16.8% this year. As a noteworthy “anti-giant” concept ETF, it adopts an equal-weight strategy like the S&P 500, giving the 500 companies included a basically equal treatment—fairly splitting the difference across the board.
Fourth and third both focus on value investing. Fourth is the U.S. large-cap value ETF $SCHV, posting a 19.0% gain. Its holdings tilt more toward traditional value sectors such as financials, energy, and industrials. Third is the value stock index ETF $VTV, delivering a 19.9% result this year. As a representative large-cap value fund, it also assigns relatively higher weight proportions to traditional sectors including financials, industrials, and energy.
Even more impressive is second place: the Russell 1000 value index ETF $IWD, which raked in a 23.7% return. It offers investors a basket of U.S. large-cap value stocks, and compared with $VTV, its investment distribution is more diversified. Finally, the best-performing—and #1—for sheer strength and consistency this year is the U.S. dividend stock ETF $SCHD, delivering a remarkable 30.5% surge. This fund carefully selects about 100 very high-quality high-dividend companies, making it the undisputed leader of the year.
Let’s take a moment to review ten U.S. large-cap, broad-market, index ETFs that outperformed $VOO this year. These funds give investors diverse perspectives on market coverage and investment strategies.
In tenth place is the S&P total U.S. stock market ETF, $ITOT, which delivered a gain of 13.0% this year. As a low-cost “U.S. stock basket” product, it broadly covers large-, mid-, and small-cap stocks, holding about 2,440 stocks in total. Right behind it in ninth place is the U.S. total market ETF, $SCHB, up 13.2%. The logic behind this fund is very simple and straightforward: it buys the entire U.S. market, including stocks from large-, mid-, and small-cap companies as well, with a holdings count of roughly 2,380.
Eighth place goes to the total market index ETF $VTI, which rose 13.5%. It’s widely considered the investment vehicle closest to directly buying the entire U.S. stock market. With a massive portfolio of more than 3,500 stocks, its coverage far exceeds that of $VOO. Seventh place is the U.S. total stock market ETF $DFAC, recording a 15.3% return. The fund’s key feature is that it uses factor-enhanced processing on a core U.S. asset allocation.
Sixth place belongs to the high-dividend index ETF $VYM, up 15.8%. This fund includes 600+ U.S. stocks with high-dividend characteristics, and its weighting is relatively diversified. Fifth place is the relatively standout equal-weighted index ETF $RSP, which gained 16.8% this year. As a noteworthy “anti-giant” concept ETF, it adopts an equal-weight strategy like the S&P 500, giving the 500 companies included a basically equal treatment—fairly splitting the difference across the board.
Fourth and third both focus on value investing. Fourth is the U.S. large-cap value ETF $SCHV, posting a 19.0% gain. Its holdings tilt more toward traditional value sectors such as financials, energy, and industrials. Third is the value stock index ETF $VTV, delivering a 19.9% result this year. As a representative large-cap value fund, it also assigns relatively higher weight proportions to traditional sectors including financials, industrials, and energy.
Even more impressive is second place: the Russell 1000 value index ETF $IWD, which raked in a 23.7% return. It offers investors a basket of U.S. large-cap value stocks, and compared with $VTV, its investment distribution is more diversified. Finally, the best-performing—and #1—for sheer strength and consistency this year is the U.S. dividend stock ETF $SCHD, delivering a remarkable 30.5% surge. This fund carefully selects about 100 very high-quality high-dividend companies, making it the undisputed leader of the year.
In tenth place is the S&P total U.S. stock market ETF, $ITOT, which delivered a gain of 13.0% this year. As a low-cost “U.S. stock basket” product, it broadly covers large-, mid-, and small-cap stocks, holding about 2,440 stocks in total. Right behind it in ninth place is the U.S. total market ETF, $SCHB, up 13.2%. The logic behind this fund is very simple and straightforward: it buys the entire U.S. market, including stocks from large-, mid-, and small-cap companies as well, with a holdings count of roughly 2,380.
Eighth place goes to the total market index ETF $VTI, which rose 13.5%. It’s widely considered the investment vehicle closest to directly buying the entire U.S. stock market. With a massive portfolio of more than 3,500 stocks, its coverage far exceeds that of $VOO. Seventh place is the U.S. total stock market ETF $DFAC, recording a 15.3% return. The fund’s key feature is that it uses factor-enhanced processing on a core U.S. asset allocation.
Sixth place belongs to the high-dividend index ETF $VYM, up 15.8%. This fund includes 600+ U.S. stocks with high-dividend characteristics, and its weighting is relatively diversified. Fifth place is the relatively standout equal-weighted index ETF $RSP, which gained 16.8% this year. As a noteworthy “anti-giant” concept ETF, it adopts an equal-weight strategy like the S&P 500, giving the 500 companies included a basically equal treatment—fairly splitting the difference across the board.
Fourth and third both focus on value investing. Fourth is the U.S. large-cap value ETF $SCHV, posting a 19.0% gain. Its holdings tilt more toward traditional value sectors such as financials, energy, and industrials. Third is the value stock index ETF $VTV, delivering a 19.9% result this year. As a representative large-cap value fund, it also assigns relatively higher weight proportions to traditional sectors including financials, industrials, and energy.
Even more impressive is second place: the Russell 1000 value index ETF $IWD, which raked in a 23.7% return. It offers investors a basket of U.S. large-cap value stocks, and compared with $VTV, its investment distribution is more diversified. Finally, the best-performing—and #1—for sheer strength and consistency this year is the U.S. dividend stock ETF $SCHD, delivering a remarkable 30.5% surge. This fund carefully selects about 100 very high-quality high-dividend companies, making it the undisputed leader of the year.
209
·
--
This year, which large-cap broad-based ETF has managed to outperform the S&P 500 index ETF $VOO in terms of returns? Let’s walk you through these ten standout products. To help you get a more intuitive understanding, we will introduce them one by one starting with the top performer with the highest gains.
In this list, the strongest performer and the overall leader is the U.S. dividend equity ETF $SCHD. It delivered an astonishing 30.5% return this year. By selecting roughly 100 high-quality, high-dividend companies, it successfully captured the most momentum this year.
Next up are two fund products centered on large-cap value stocks. Ranked second is the Russell 1000 Value Index ETF $IWD, which rose 23.7% overall this year. The fund holds a basket of U.S. large-cap value stocks, and in terms of portfolio composition it appears more diversified than $VTV. Coming in third is $VTV, a typical representative of large-cap value stocks—the value index ETF. It achieved a 19.9% gain. Its portfolio allocations are relatively heavier in traditional sectors such as financials, industrials, and energy.
Fourth place goes to the U.S. large-cap value ETF $SCHV, which increased 19.0% this year. Its portfolio characteristics are also quite distinct, clearly tilted toward traditional value sectors like financials, energy, and industrials.
In fifth place is a highly watched anti-giant product: the equally weighted index ETF $RSP, which returned 16.8%. The fund strictly follows an equal-weight strategy, such as that used by the S&P 500. It essentially gives companies in the 500 constituents a fair share, making this balanced allocation approach well worth attention.
Sixth place is the high-dividend index ETF $VYM. This year, its yield rose 15.8%. Its portfolio broadly covers more than 600 U.S. stocks with high-dividend characteristics, and it maintains a relatively diversified style in weight allocation.
Seventh place is the U.S. total-market stock ETF $DFAC, which made the list with a 15.3% gain. This ETF mainly holds U.S. core assets featuring factor-enhancing characteristics.
Next are three broad-based ETFs dedicated to covering the U.S. overall market in a comprehensive way. Eighth place is the total market index ETF $VTI, which rose 13.5% this year. This fund holds more than 3,500 stocks—far beyond the coverage of $VOO—and is widely regarded in the industry as the investment tool closest to buying the entire U.S. stock market.
Ninth place is the U.S. total market ETF $SCHB, delivering a 13.2% return. It offers a simple and effective way to buy the U.S. market broadly, covering large-, mid-, and small-cap stocks. The total number of holdings is about 2,380.
Finally, in tenth place is the S&P U.S. Broad Market ETF $ITOT, up 13.0%. As a low-cost “all-in-one” U.S. market product, it also provides broad coverage across large-, mid-, and small-cap stocks, with roughly 2,440 holdings.
That’s the roundup of the ten large-cap broad-based ETFs that outperformed $VOO this year. Hopefully, this will serve as a useful reference for helping you better understand the market and plan your future investments.
This year, which large-cap broad-based ETF has managed to outperform the S&P 500 index ETF $VOO in terms of returns? Let’s walk you through these ten standout products. To help you get a more intuitive understanding, we will introduce them one by one starting with the top performer with the highest gains.
In this list, the strongest performer and the overall leader is the U.S. dividend equity ETF $SCHD. It delivered an astonishing 30.5% return this year. By selecting roughly 100 high-quality, high-dividend companies, it successfully captured the most momentum this year.
Next up are two fund products centered on large-cap value stocks. Ranked second is the Russell 1000 Value Index ETF $IWD, which rose 23.7% overall this year. The fund holds a basket of U.S. large-cap value stocks, and in terms of portfolio composition it appears more diversified than $VTV. Coming in third is $VTV, a typical representative of large-cap value stocks—the value index ETF. It achieved a 19.9% gain. Its portfolio allocations are relatively heavier in traditional sectors such as financials, industrials, and energy.
Fourth place goes to the U.S. large-cap value ETF $SCHV, which increased 19.0% this year. Its portfolio characteristics are also quite distinct, clearly tilted toward traditional value sectors like financials, energy, and industrials.
In fifth place is a highly watched anti-giant product: the equally weighted index ETF $RSP, which returned 16.8%. The fund strictly follows an equal-weight strategy, such as that used by the S&P 500. It essentially gives companies in the 500 constituents a fair share, making this balanced allocation approach well worth attention.
Sixth place is the high-dividend index ETF $VYM. This year, its yield rose 15.8%. Its portfolio broadly covers more than 600 U.S. stocks with high-dividend characteristics, and it maintains a relatively diversified style in weight allocation.
Seventh place is the U.S. total-market stock ETF $DFAC, which made the list with a 15.3% gain. This ETF mainly holds U.S. core assets featuring factor-enhancing characteristics.
Next are three broad-based ETFs dedicated to covering the U.S. overall market in a comprehensive way. Eighth place is the total market index ETF $VTI, which rose 13.5% this year. This fund holds more than 3,500 stocks—far beyond the coverage of $VOO—and is widely regarded in the industry as the investment tool closest to buying the entire U.S. stock market.
Ninth place is the U.S. total market ETF $SCHB, delivering a 13.2% return. It offers a simple and effective way to buy the U.S. market broadly, covering large-, mid-, and small-cap stocks. The total number of holdings is about 2,380.
Finally, in tenth place is the S&P U.S. Broad Market ETF $ITOT, up 13.0%. As a low-cost “all-in-one” U.S. market product, it also provides broad coverage across large-, mid-, and small-cap stocks, with roughly 2,440 holdings.
That’s the roundup of the ten large-cap broad-based ETFs that outperformed $VOO this year. Hopefully, this will serve as a useful reference for helping you better understand the market and plan your future investments.
In this list, the strongest performer and the overall leader is the U.S. dividend equity ETF $SCHD. It delivered an astonishing 30.5% return this year. By selecting roughly 100 high-quality, high-dividend companies, it successfully captured the most momentum this year.
Next up are two fund products centered on large-cap value stocks. Ranked second is the Russell 1000 Value Index ETF $IWD, which rose 23.7% overall this year. The fund holds a basket of U.S. large-cap value stocks, and in terms of portfolio composition it appears more diversified than $VTV. Coming in third is $VTV, a typical representative of large-cap value stocks—the value index ETF. It achieved a 19.9% gain. Its portfolio allocations are relatively heavier in traditional sectors such as financials, industrials, and energy.
Fourth place goes to the U.S. large-cap value ETF $SCHV, which increased 19.0% this year. Its portfolio characteristics are also quite distinct, clearly tilted toward traditional value sectors like financials, energy, and industrials.
In fifth place is a highly watched anti-giant product: the equally weighted index ETF $RSP, which returned 16.8%. The fund strictly follows an equal-weight strategy, such as that used by the S&P 500. It essentially gives companies in the 500 constituents a fair share, making this balanced allocation approach well worth attention.
Sixth place is the high-dividend index ETF $VYM. This year, its yield rose 15.8%. Its portfolio broadly covers more than 600 U.S. stocks with high-dividend characteristics, and it maintains a relatively diversified style in weight allocation.
Seventh place is the U.S. total-market stock ETF $DFAC, which made the list with a 15.3% gain. This ETF mainly holds U.S. core assets featuring factor-enhancing characteristics.
Next are three broad-based ETFs dedicated to covering the U.S. overall market in a comprehensive way. Eighth place is the total market index ETF $VTI, which rose 13.5% this year. This fund holds more than 3,500 stocks—far beyond the coverage of $VOO—and is widely regarded in the industry as the investment tool closest to buying the entire U.S. stock market.
Ninth place is the U.S. total market ETF $SCHB, delivering a 13.2% return. It offers a simple and effective way to buy the U.S. market broadly, covering large-, mid-, and small-cap stocks. The total number of holdings is about 2,380.
Finally, in tenth place is the S&P U.S. Broad Market ETF $ITOT, up 13.0%. As a low-cost “all-in-one” U.S. market product, it also provides broad coverage across large-, mid-, and small-cap stocks, with roughly 2,440 holdings.
That’s the roundup of the ten large-cap broad-based ETFs that outperformed $VOO this year. Hopefully, this will serve as a useful reference for helping you better understand the market and plan your future investments.
134
·
--
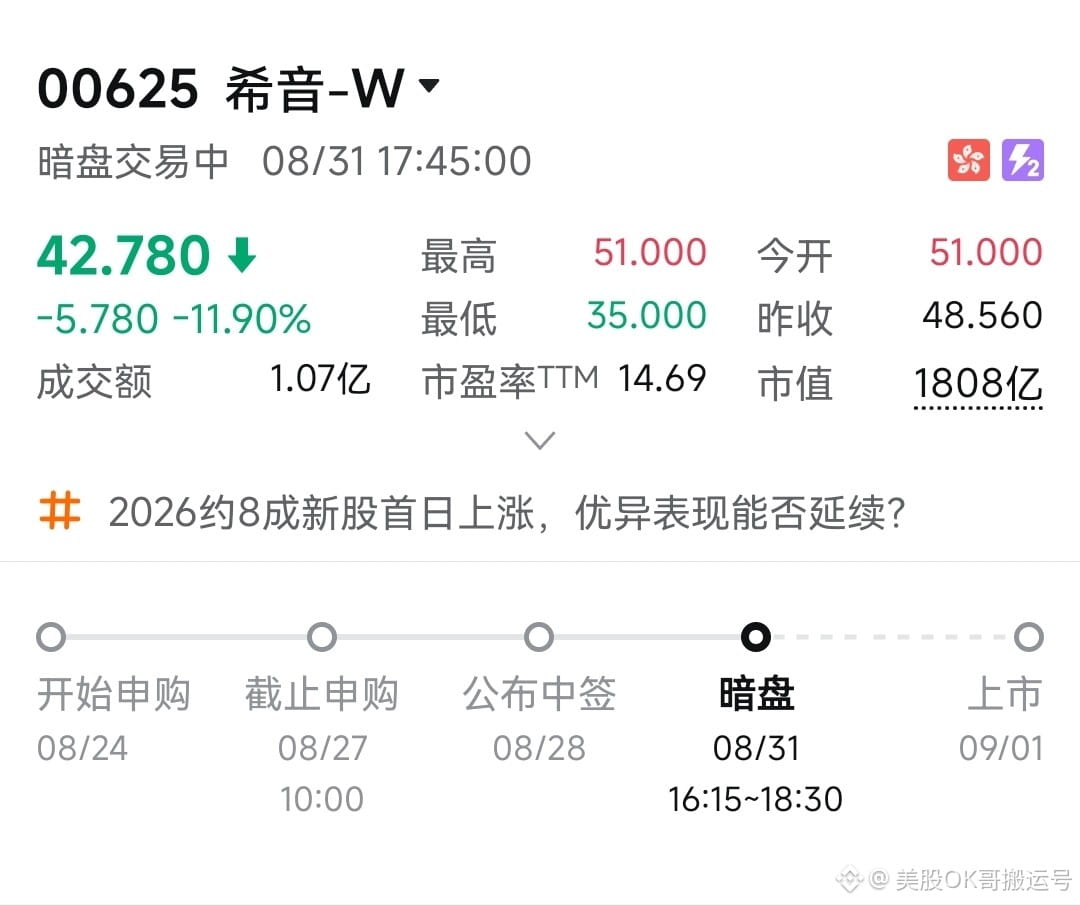
Recently, the new stock subscription market in Hong Kong stocks has indeed appeared especially quiet, with the overall atmosphere very lackluster. Under such circumstances, even Shein, a star company that the market used to strongly favor, is now facing the situation of falling below its offering price as well.
Recently, the new stock subscription market in Hong Kong stocks has indeed appeared especially quiet, with the overall atmosphere very lackluster. Under such circumstances, even Shein, a star company that the market used to strongly favor, is now facing the situation of falling below its offering price as well.
369
·
--
September’s most closely watched core focus in the U.S. stock market is undoubtedly the listing of Anthropic. According to currently circulating reports, the company’s prospectus is expected to be officially made public after September 7.
It is somewhat regrettable, however, that there are no large language model companies in the U.S. stock market that directly serve as close comparables. If similar companies existed, the market could fully follow the classic logic of how RKLB once closely tracked SPCX’s momentum and rose accordingly. Looking at the Hong Kong stock market instead, although it has related targets such as minimax and Zhipu, whether they will seize this opportunity to trigger a linked trading trend remains unknown to this day.
Given the situation above, if investors want to position themselves around the related concepts of Anthropic, for now they can only take a step down and patiently look for opportunities in companies that hold its equity and in related funds.
From a trading perspective, there are three key market catalyst phases in the future that are worth closely monitoring. The first is when the prospectus is officially disclosed to the public; the second occurs during the stage when the company holds roadshows and provides a specific price range; the third is the three days before the final issue price is confirmed.
During this period, everyone might as well wait and see whether Anthropic will release some unexpected surprises and favorable developments. At the same time, it’s important to remain rational, because once the company completes its listing, the short-term speculative value of those shadow stocks will basically come to an end.
After reviewing the situation, it can be seen that currently there are three companies that hold shares of Anthropic and whose stake represents a relatively high proportion of their own total market capitalization. They are $CRM, $SKM, and $ZM, respectively.
September’s most closely watched core focus in the U.S. stock market is undoubtedly the listing of Anthropic. According to currently circulating reports, the company’s prospectus is expected to be officially made public after September 7.
It is somewhat regrettable, however, that there are no large language model companies in the U.S. stock market that directly serve as close comparables. If similar companies existed, the market could fully follow the classic logic of how RKLB once closely tracked SPCX’s momentum and rose accordingly. Looking at the Hong Kong stock market instead, although it has related targets such as minimax and Zhipu, whether they will seize this opportunity to trigger a linked trading trend remains unknown to this day.
Given the situation above, if investors want to position themselves around the related concepts of Anthropic, for now they can only take a step down and patiently look for opportunities in companies that hold its equity and in related funds.
From a trading perspective, there are three key market catalyst phases in the future that are worth closely monitoring. The first is when the prospectus is officially disclosed to the public; the second occurs during the stage when the company holds roadshows and provides a specific price range; the third is the three days before the final issue price is confirmed.
During this period, everyone might as well wait and see whether Anthropic will release some unexpected surprises and favorable developments. At the same time, it’s important to remain rational, because once the company completes its listing, the short-term speculative value of those shadow stocks will basically come to an end.
After reviewing the situation, it can be seen that currently there are three companies that hold shares of Anthropic and whose stake represents a relatively high proportion of their own total market capitalization. They are $CRM, $SKM, and $ZM, respectively.
It is somewhat regrettable, however, that there are no large language model companies in the U.S. stock market that directly serve as close comparables. If similar companies existed, the market could fully follow the classic logic of how RKLB once closely tracked SPCX’s momentum and rose accordingly. Looking at the Hong Kong stock market instead, although it has related targets such as minimax and Zhipu, whether they will seize this opportunity to trigger a linked trading trend remains unknown to this day.
Given the situation above, if investors want to position themselves around the related concepts of Anthropic, for now they can only take a step down and patiently look for opportunities in companies that hold its equity and in related funds.
From a trading perspective, there are three key market catalyst phases in the future that are worth closely monitoring. The first is when the prospectus is officially disclosed to the public; the second occurs during the stage when the company holds roadshows and provides a specific price range; the third is the three days before the final issue price is confirmed.
During this period, everyone might as well wait and see whether Anthropic will release some unexpected surprises and favorable developments. At the same time, it’s important to remain rational, because once the company completes its listing, the short-term speculative value of those shadow stocks will basically come to an end.
After reviewing the situation, it can be seen that currently there are three companies that hold shares of Anthropic and whose stake represents a relatively high proportion of their own total market capitalization. They are $CRM, $SKM, and $ZM, respectively.
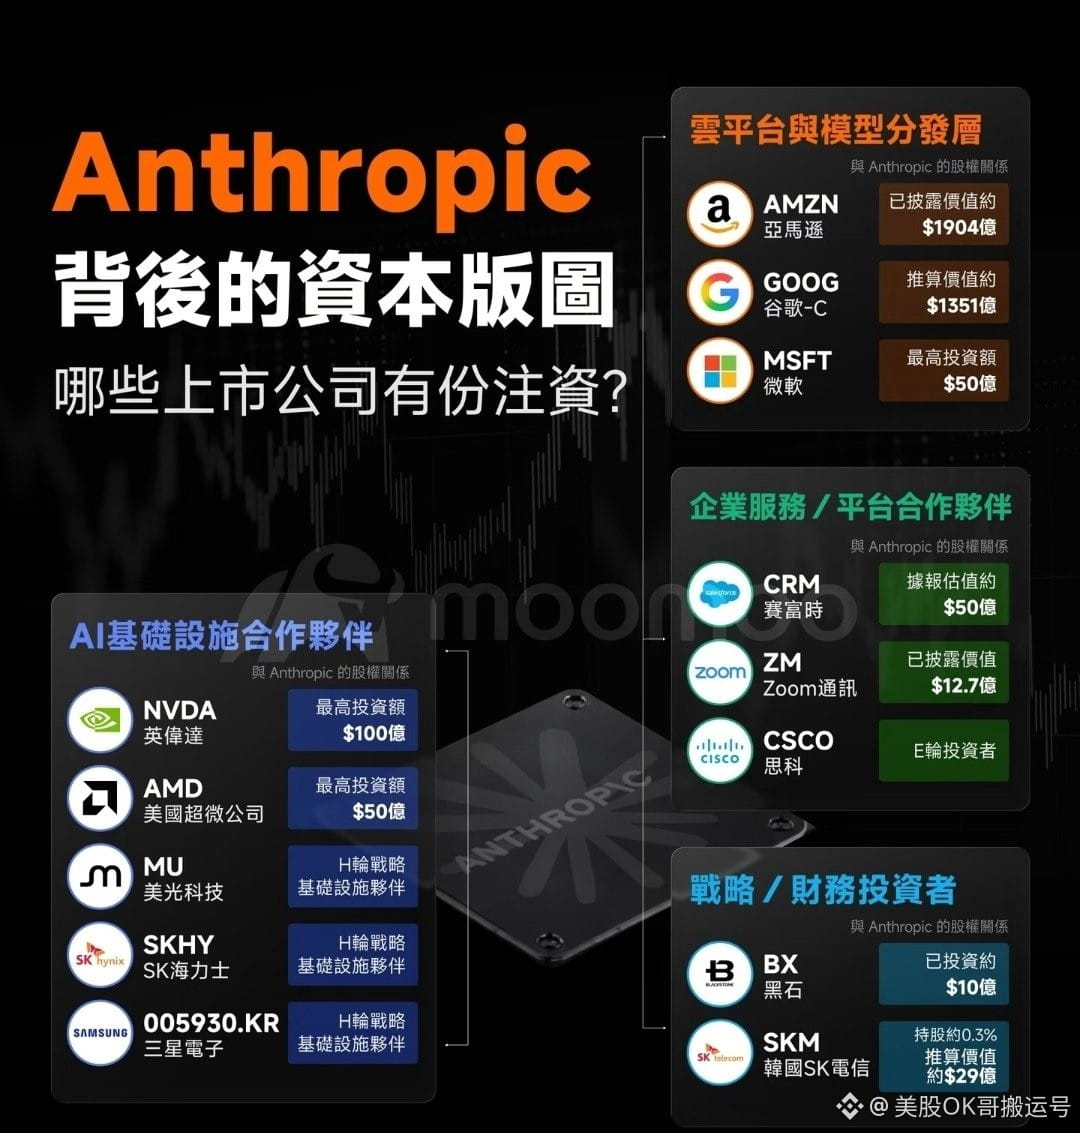
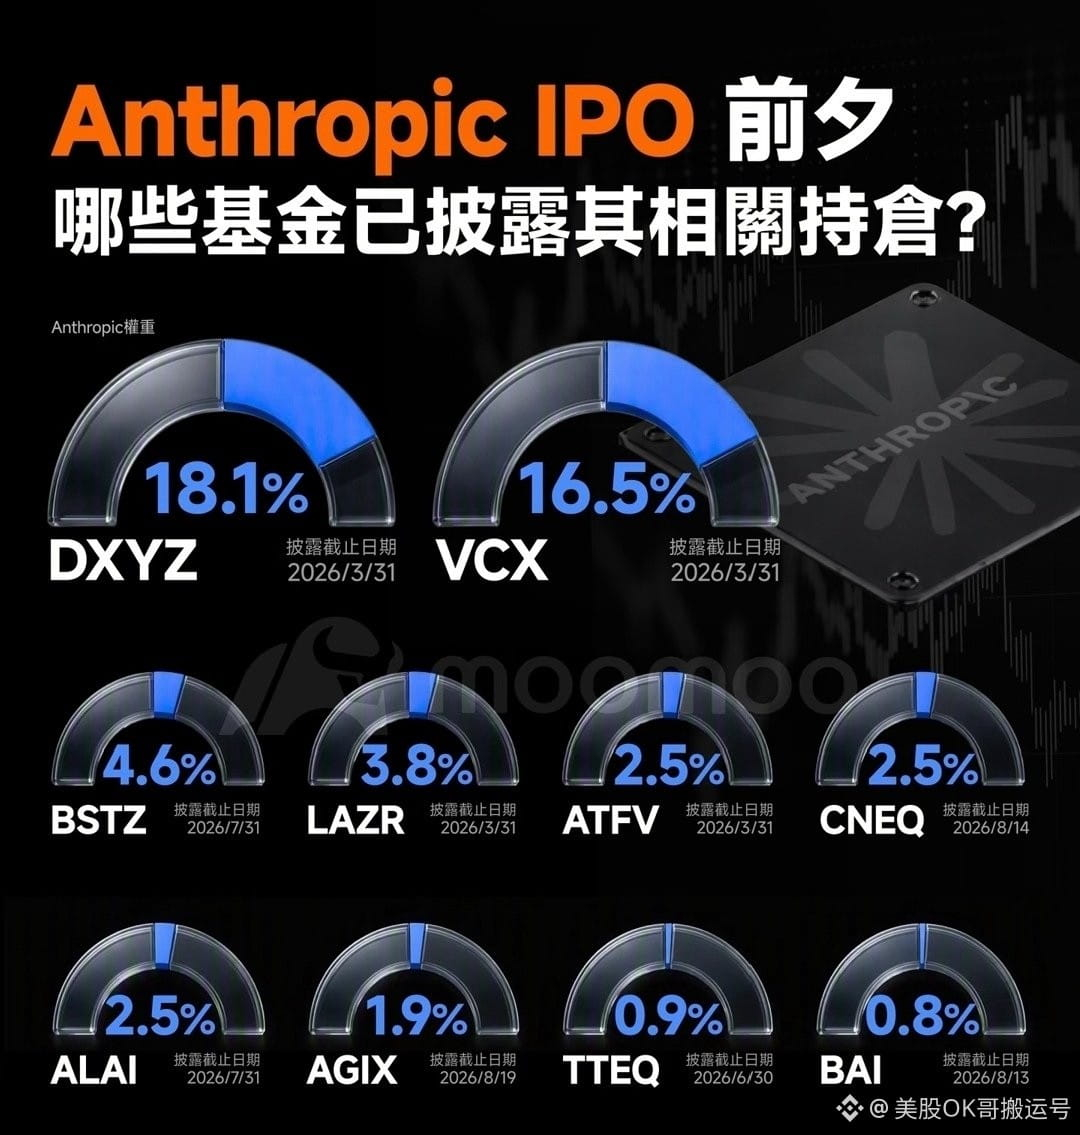
482
·
--
It wasn’t until today that I learned that Leopold, the much-discussed U.S. stock market focal figure, actually hadn’t fully liquidated everything in his earlier sell-off actions. He still retained two investment holdings in his hands: $SHAZ and $CORZ.
It wasn’t until today that I learned that Leopold, the much-discussed U.S. stock market focal figure, actually hadn’t fully liquidated everything in his earlier sell-off actions. He still retained two investment holdings in his hands: $SHAZ and $CORZ.
260
Log in to explore more content
Join global crypto users on Binance Square
⚡️ Get latest and useful information about crypto.
💬 Trusted by the world’s largest crypto exchange.
👍 Discover real insights from verified creators.
Email / Phone number
Trending Topics
USAugustPPIRisesLessThanExpected
22,095 views
507 Discussing
🚨 US AUG PPI: Rises LESS Than Expected! Bullish for Crypto? 🚀
PPI +0.4% MoM as expected, but CORE PPI only +0.2% vs +0.3% expected - cooling!
What it means:
• Wholesale inflation softer than feared
• Fed rate hike chance now 62% - but dovish signals coming
• Core PCE revisions expected downward - bullish
• BTC usually pumps on softer PPI
Fed meeting Sep 15-16 - Market now expects pause, not hike?
Is this the green light for Q4 rally?
#Bitcoin #PPI #Fed #CryptoNews #BTC#usaugustppiriseslessthanexpected
True News
·1 Likes
·1.2k views
SECApprovesNasdaqTexasCommodityTrustRule
15,365 views
424 Discussing
ECBRaisesRatesSecondTimeTo2.5%
12,193 views
303 Discussing