
我是X先生
834 Posts

我是X先生
Report
Block User
尊重趋势,技术永赚
12 Following
222 Followers
306 Liked
Posts
All
Quotes
PINNED
·
--
$BTC “Cutting a boat to seek a sword”—once, how should Bitcoin’s long positions be handled?
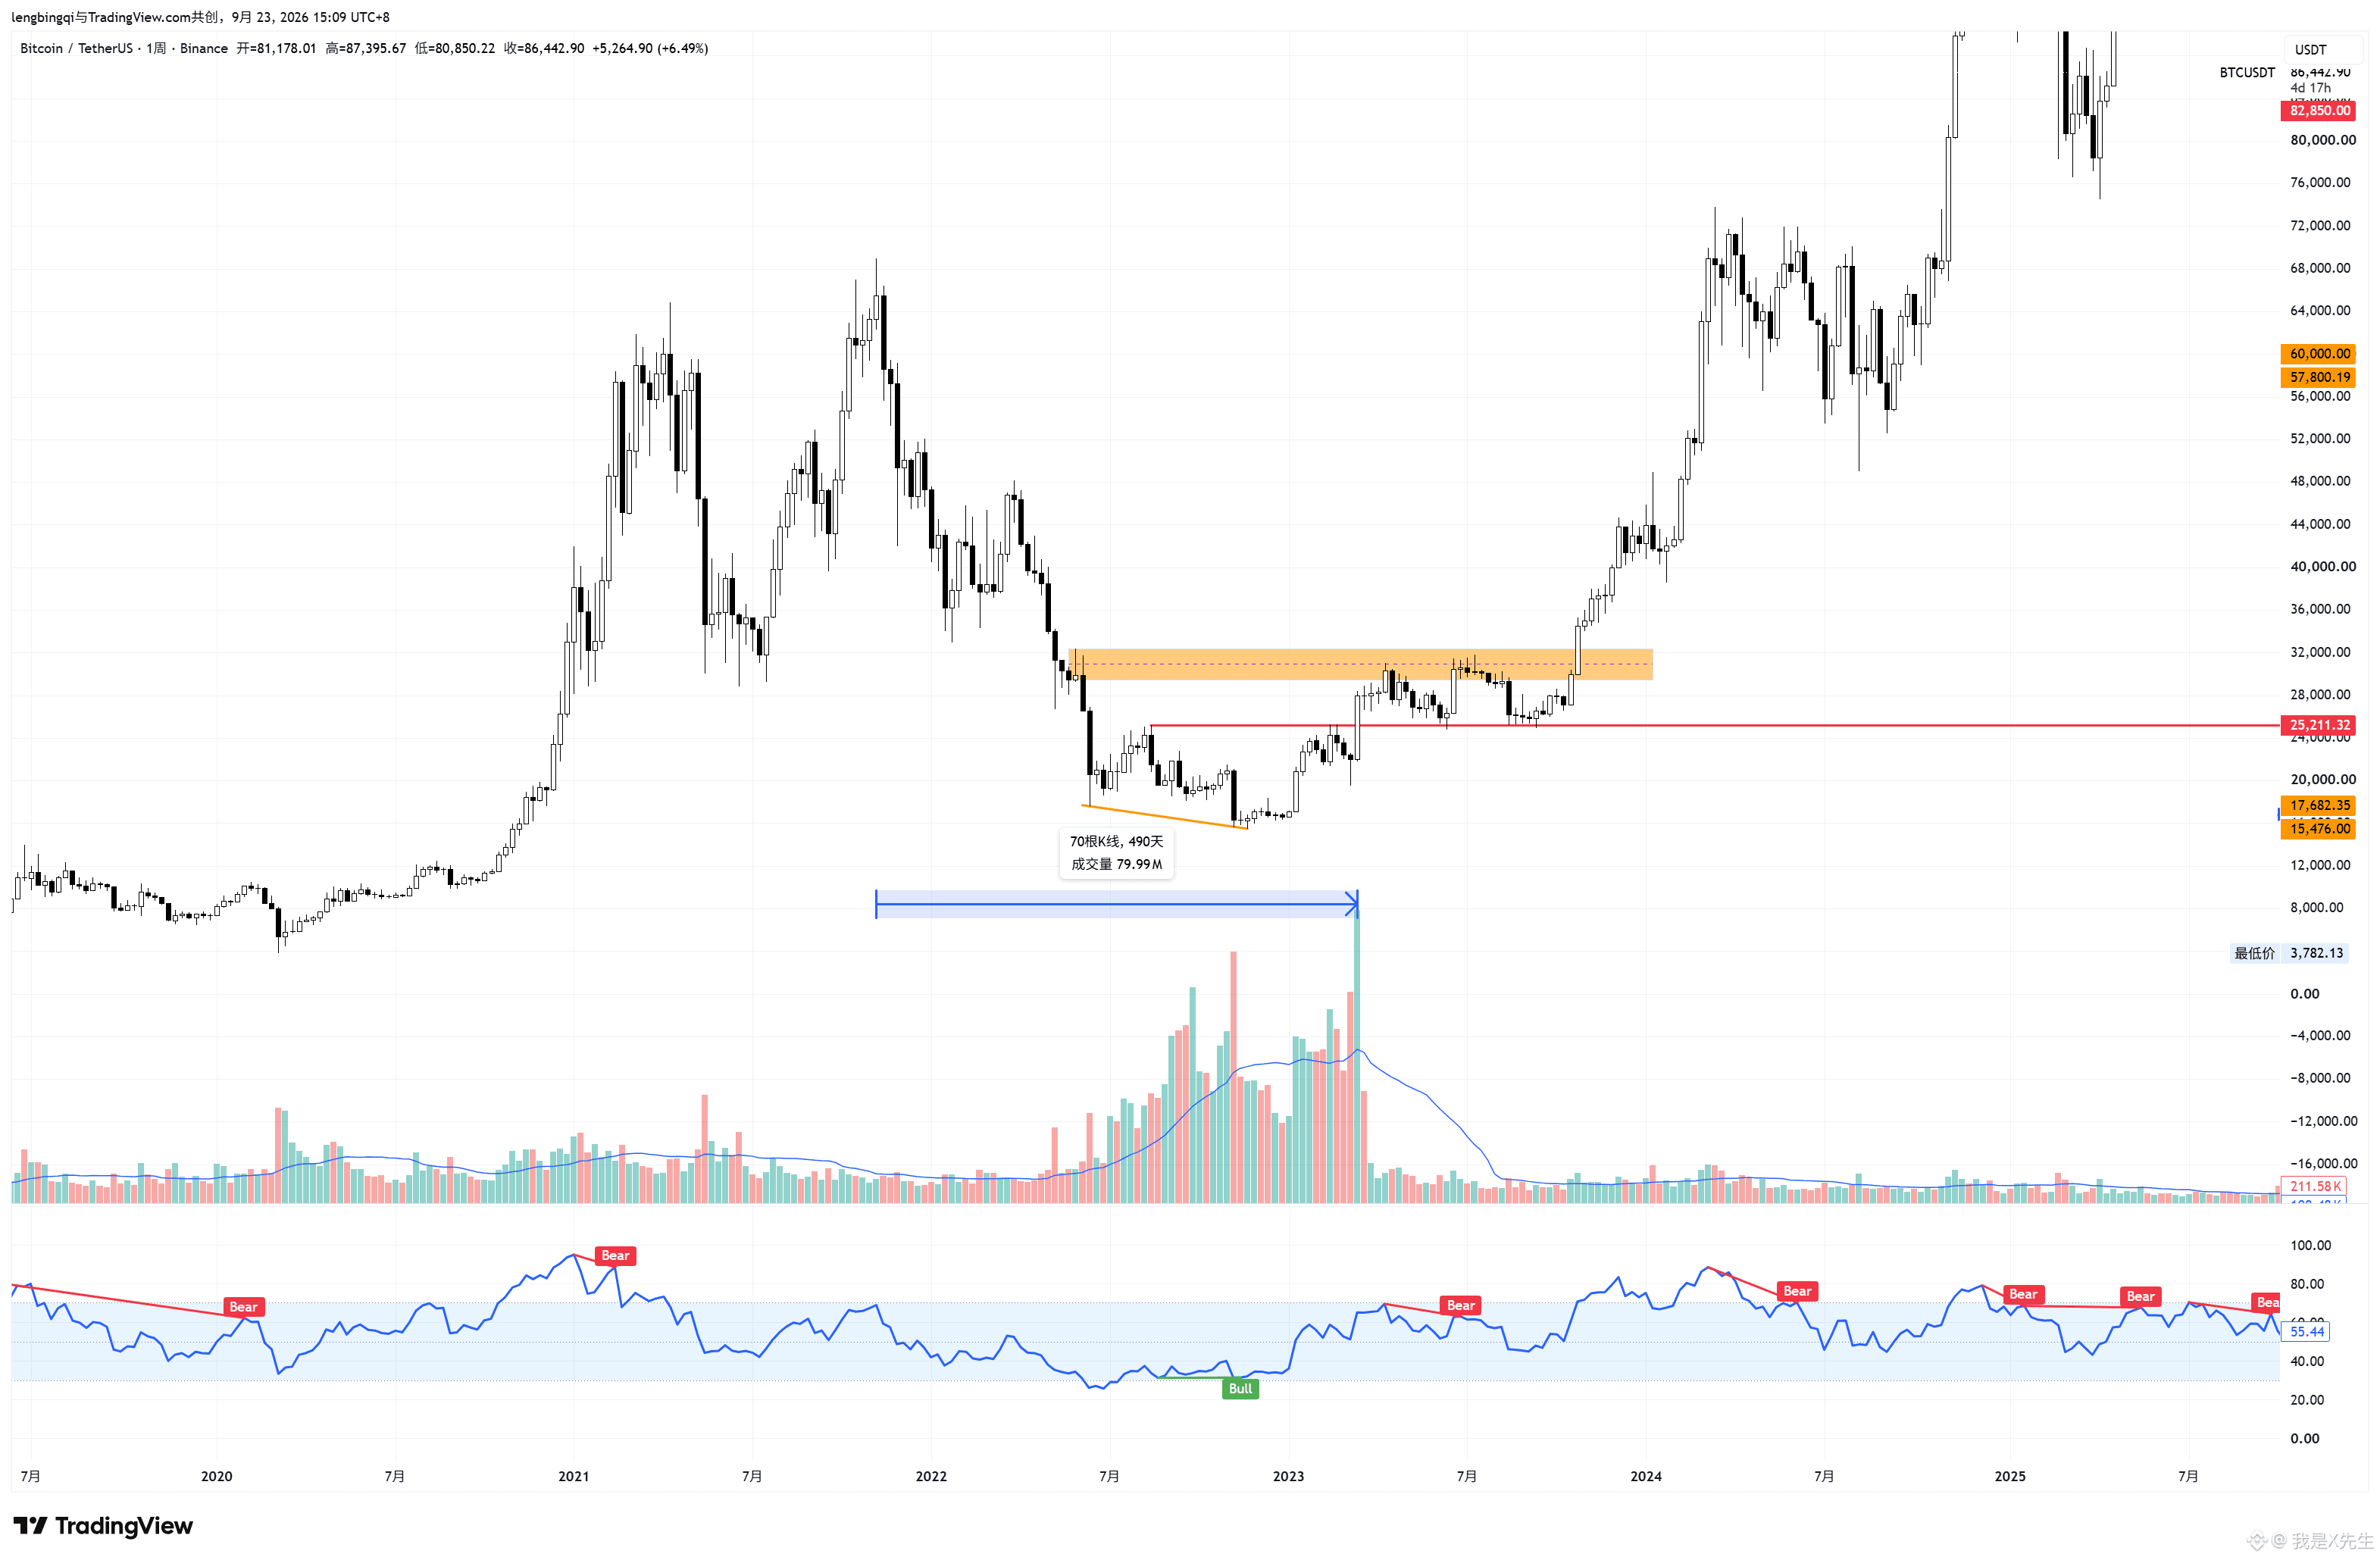
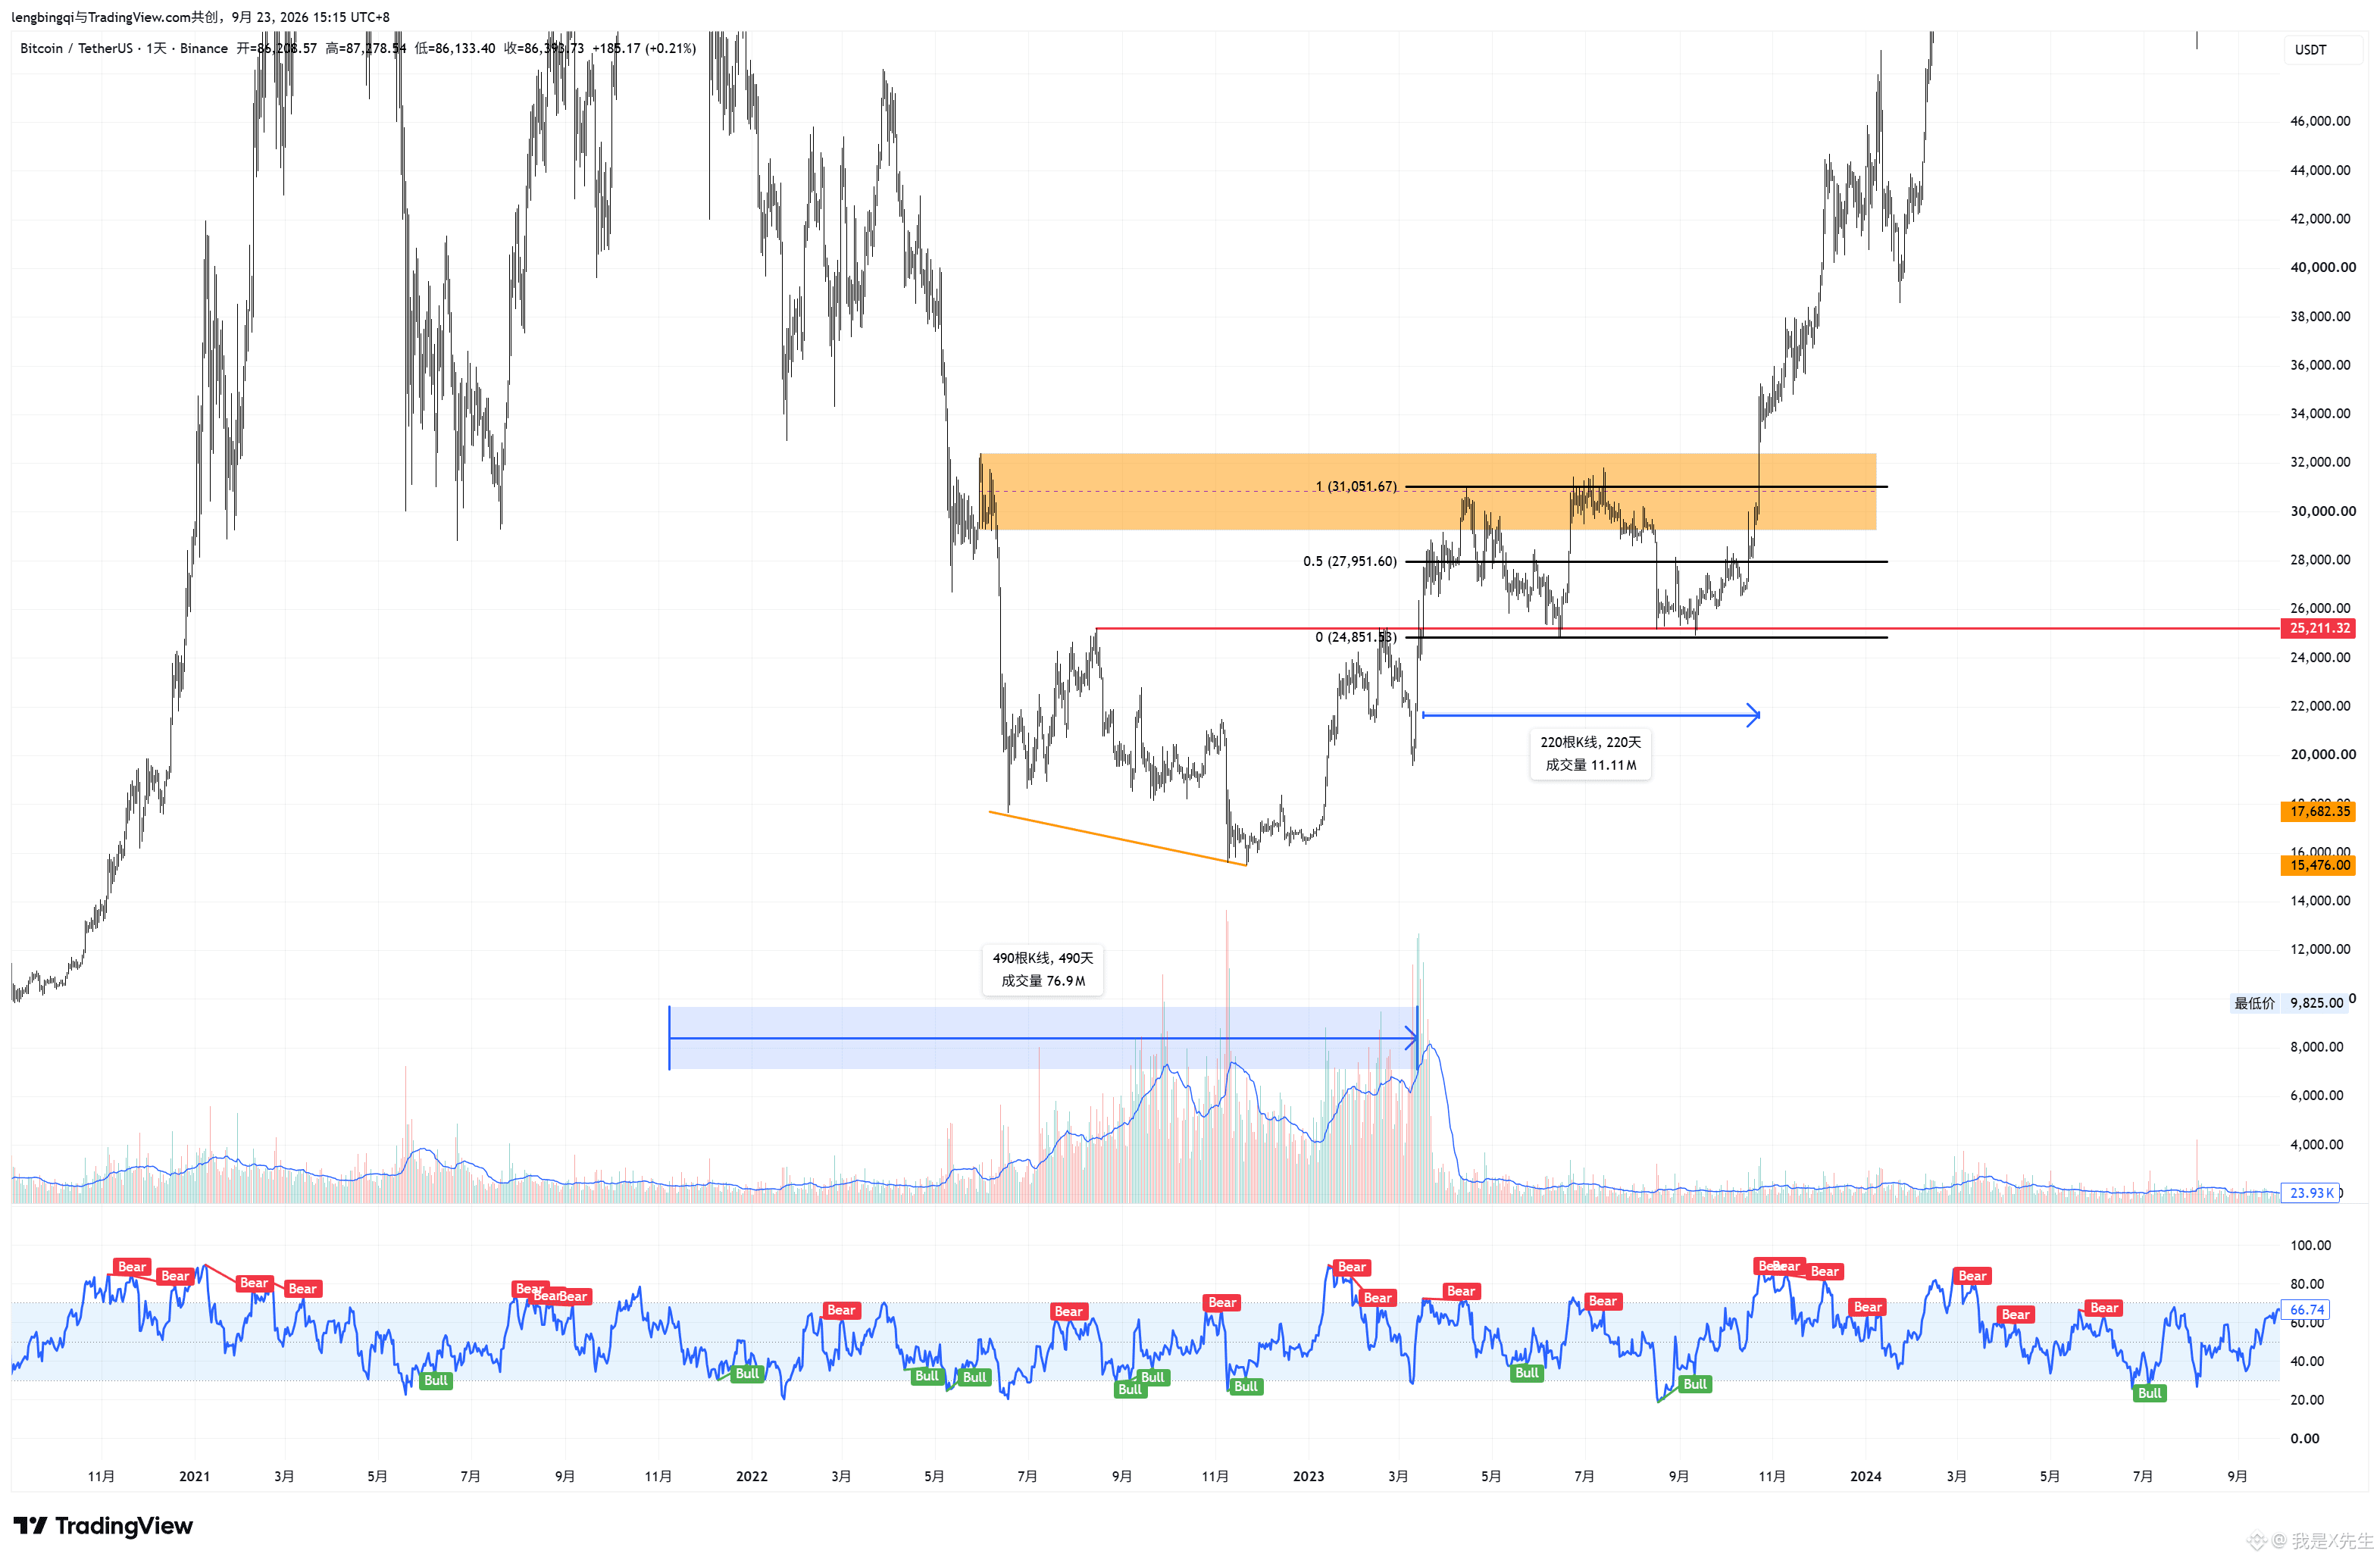
In the 2022 bear market, if counted from the highest point to the time Bitcoin bottomed and broke the bear-to-bull (bull/bear) conversion line, the weekly-level MSB took roughly 450 days (Fig. 1). After breaking 25211, during the period 25211—weekly OB, a horizontal box-like range was formed for about 22 days (Fig. 2). It then retested the area around 25211 twice to test overhead supply and wash out the market, followed by a breakout above the top of the range, starting a main uptrend that “never looks back.”
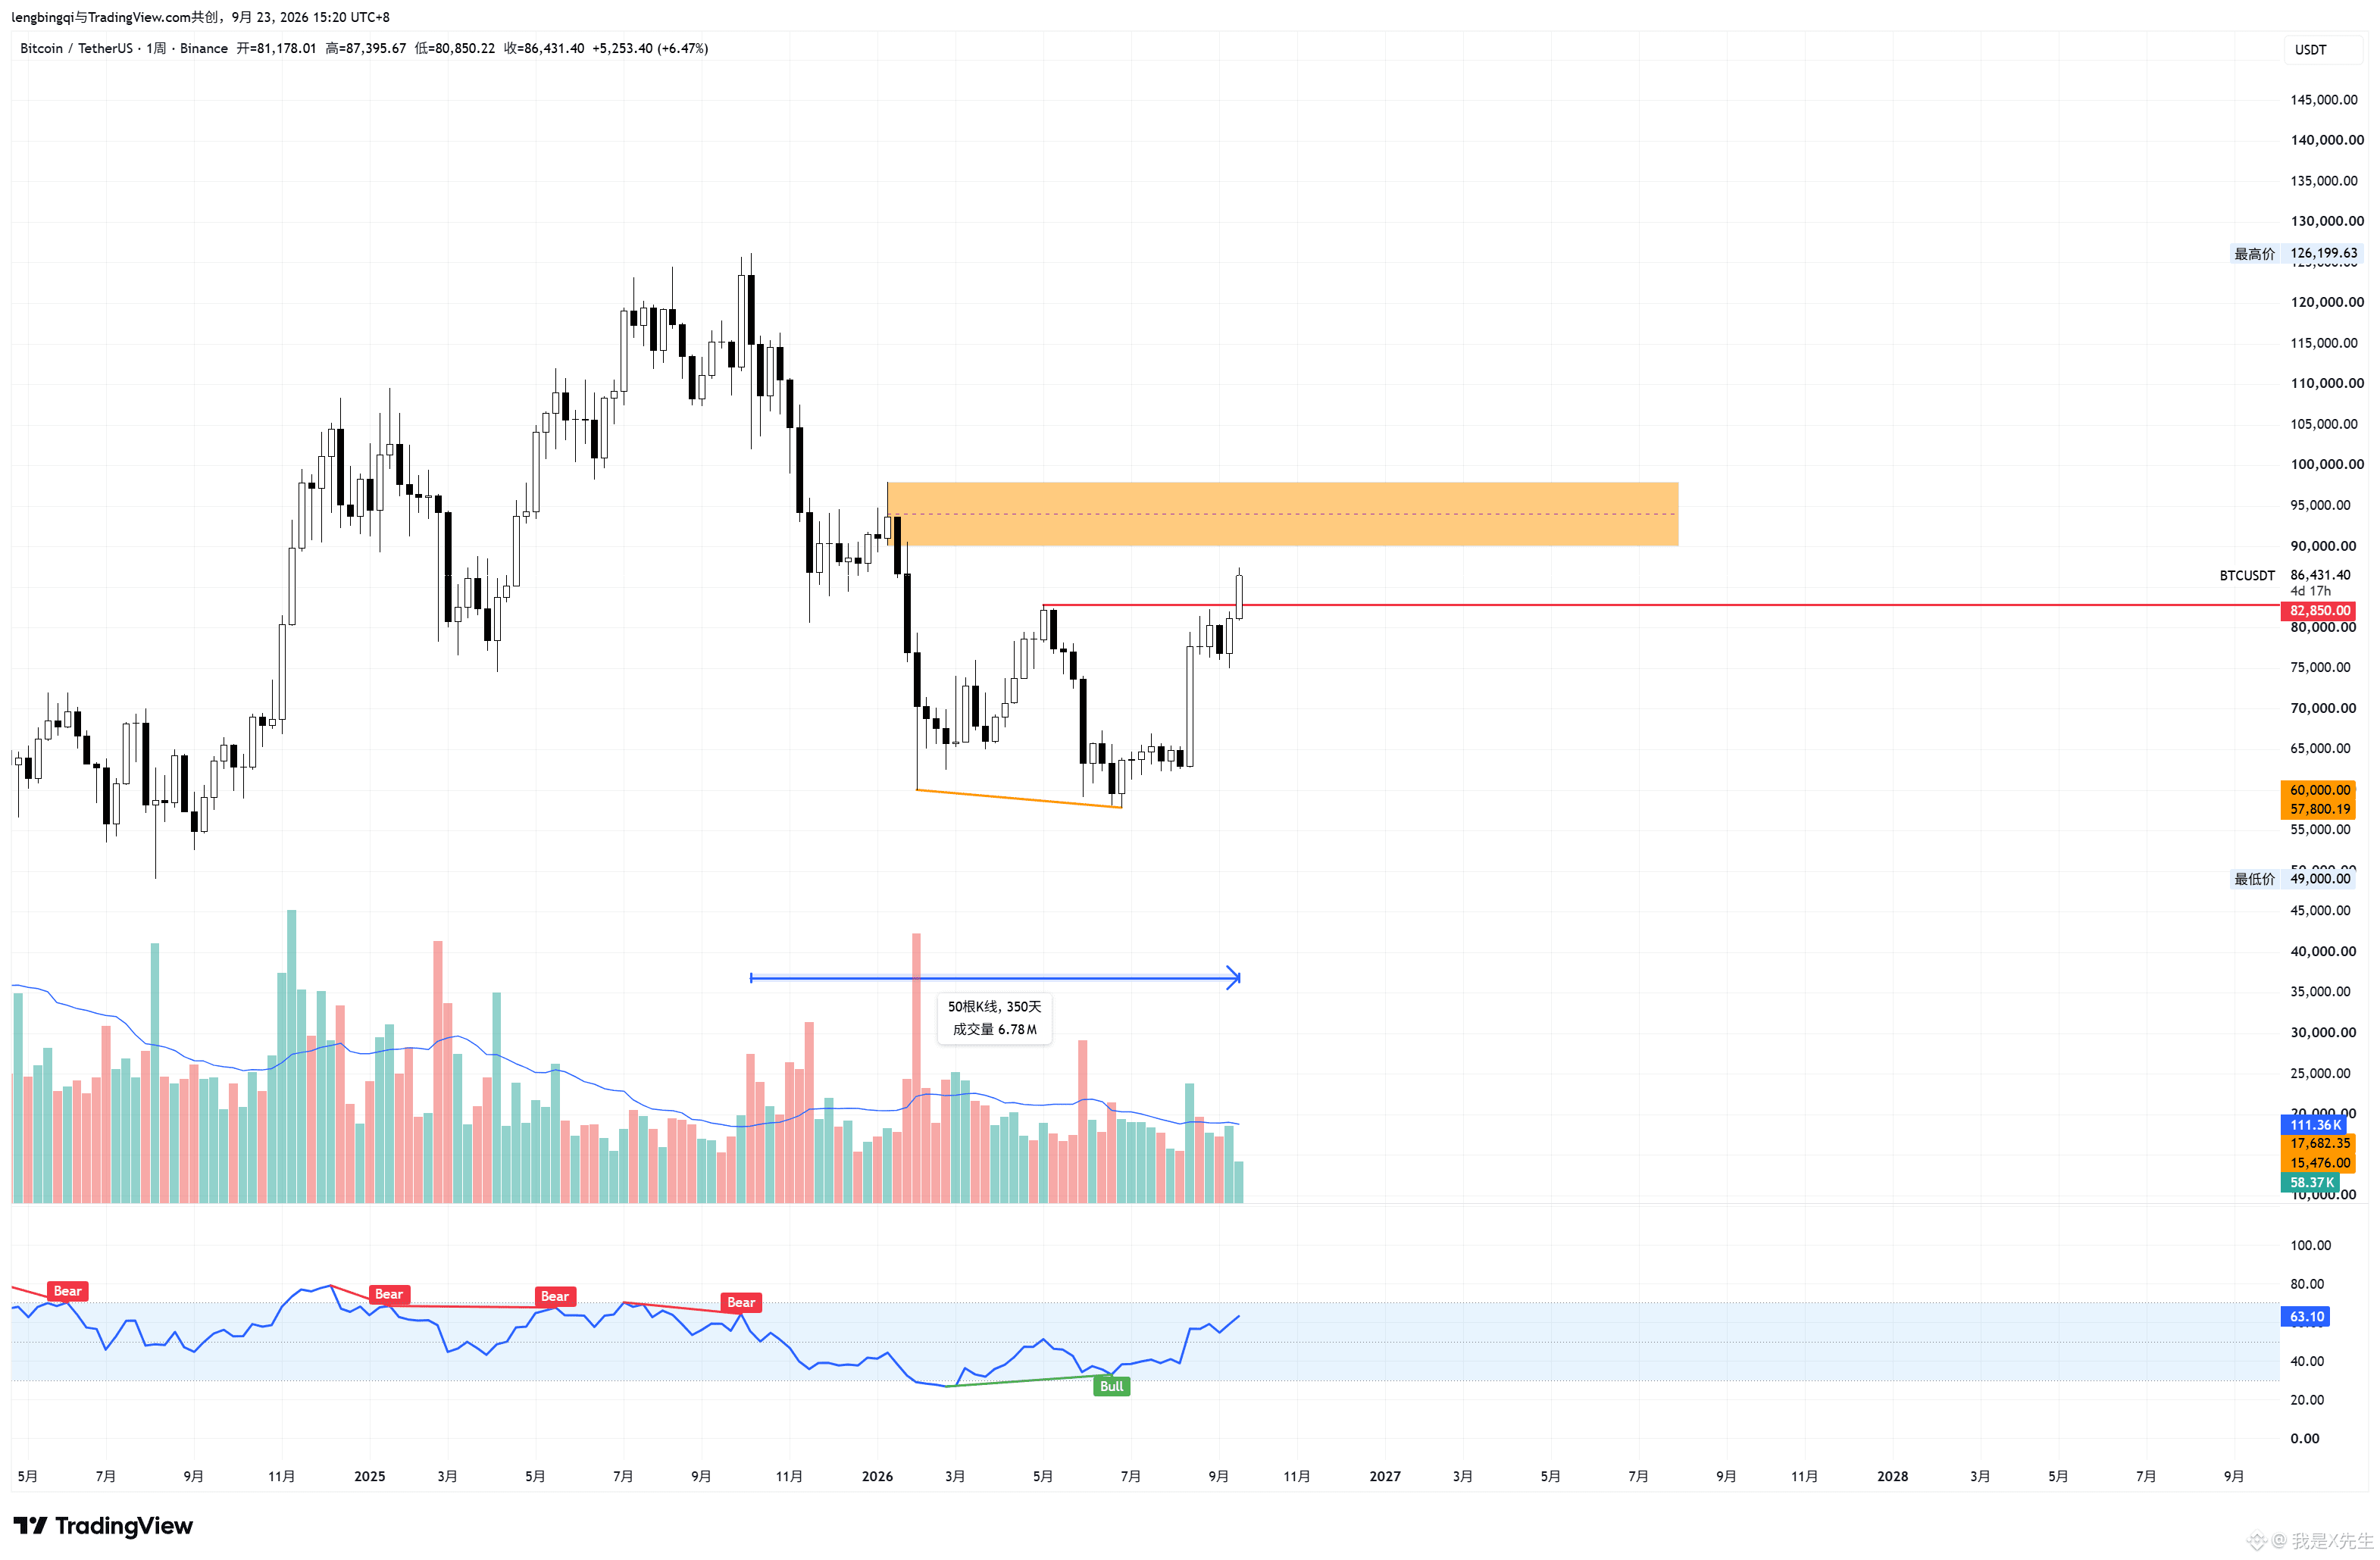
As for the current bear-to-bull conversion, it has only taken 350 days to complete the structure (Fig. 3), which is 100 days less than the previous cycle. The main players may be a bit impatient, but that also suggests the market’s consensus is currently fairly good: major institutions are “accumulating,” and at the very least this leaves room for imagination regarding the next leg up.
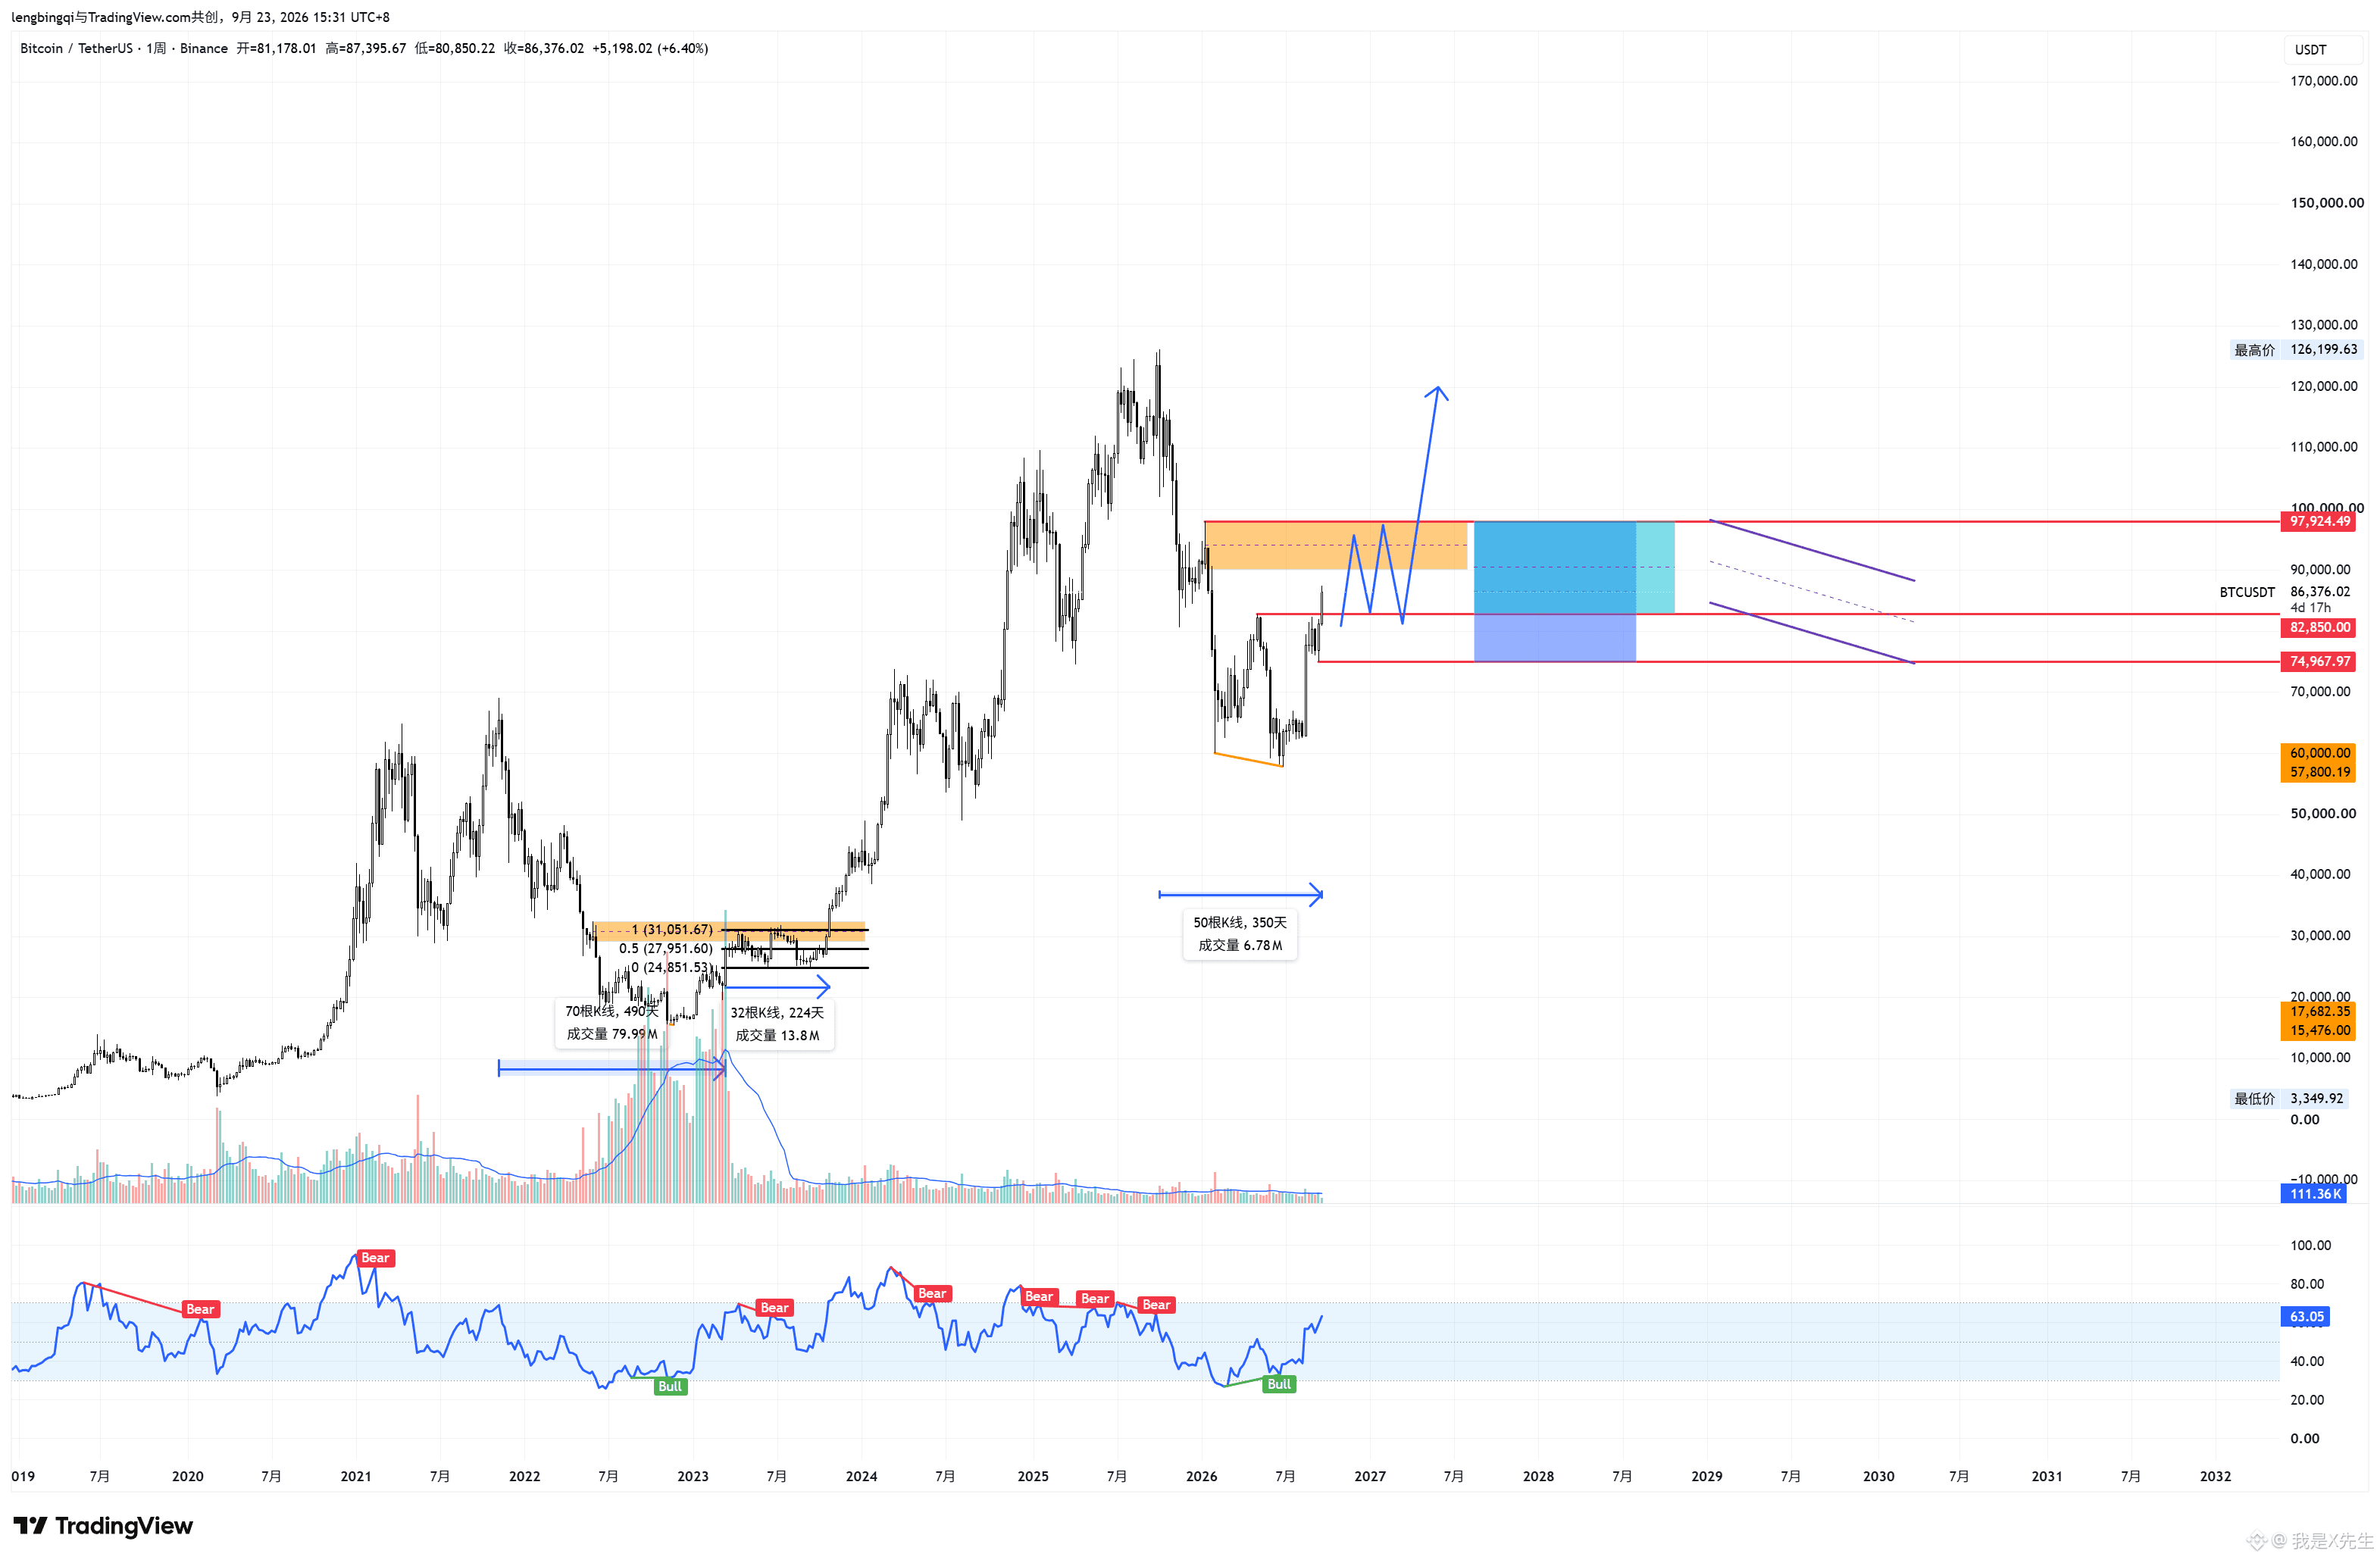
What might happen next? There is no price action that rises without pullbacks. If it goes up too much, it must come down—that’s inevitable. It’s only the depth of the pullback that’s unknown. If, going forward, capital continues to flow in strongly and overhead supply remains relatively small, it could form a range-bound consolidation between 75–98, or even 85–929. Of course, it could also form other consolidation patterns—like a bull flag. All of these are normal. Therefore, long-term longs shouldn’t be in a hurry: wait until a structure and pattern are clearly formed, then enter. One reason is to look for the lower point of the pullback; the other is to look for the breakout point. Those two long-term entry locations must be grasped.
Since there is no completely consistent price trajectory, the “cutting a boat to seek a sword” here is about copying the main players’ operational mindset.
(Of course, if the pullback breaks below 75, that would be even better—but will the main players really give an opportunity to pick up cheap chips? Who knows.)
$BTC “Cutting a boat to seek a sword”—once, how should Bitcoin’s long positions be handled?
In the 2022 bear market, if counted from the highest point to the time Bitcoin bottomed and broke the bear-to-bull (bull/bear) conversion line, the weekly-level MSB took roughly 450 days (Fig. 1). After breaking 25211, during the period 25211—weekly OB, a horizontal box-like range was formed for about 22 days (Fig. 2). It then retested the area around 25211 twice to test overhead supply and wash out the market, followed by a breakout above the top of the range, starting a main uptrend that “never looks back.”
As for the current bear-to-bull conversion, it has only taken 350 days to complete the structure (Fig. 3), which is 100 days less than the previous cycle. The main players may be a bit impatient, but that also suggests the market’s consensus is currently fairly good: major institutions are “accumulating,” and at the very least this leaves room for imagination regarding the next leg up.
What might happen next? There is no price action that rises without pullbacks. If it goes up too much, it must come down—that’s inevitable. It’s only the depth of the pullback that’s unknown. If, going forward, capital continues to flow in strongly and overhead supply remains relatively small, it could form a range-bound consolidation between 75–98, or even 85–929. Of course, it could also form other consolidation patterns—like a bull flag. All of these are normal. Therefore, long-term longs shouldn’t be in a hurry: wait until a structure and pattern are clearly formed, then enter. One reason is to look for the lower point of the pullback; the other is to look for the breakout point. Those two long-term entry locations must be grasped.
Since there is no completely consistent price trajectory, the “cutting a boat to seek a sword” here is about copying the main players’ operational mindset.
(Of course, if the pullback breaks below 75, that would be even better—but will the main players really give an opportunity to pick up cheap chips? Who knows.)
In the 2022 bear market, if counted from the highest point to the time Bitcoin bottomed and broke the bear-to-bull (bull/bear) conversion line, the weekly-level MSB took roughly 450 days (Fig. 1). After breaking 25211, during the period 25211—weekly OB, a horizontal box-like range was formed for about 22 days (Fig. 2). It then retested the area around 25211 twice to test overhead supply and wash out the market, followed by a breakout above the top of the range, starting a main uptrend that “never looks back.”
As for the current bear-to-bull conversion, it has only taken 350 days to complete the structure (Fig. 3), which is 100 days less than the previous cycle. The main players may be a bit impatient, but that also suggests the market’s consensus is currently fairly good: major institutions are “accumulating,” and at the very least this leaves room for imagination regarding the next leg up.
What might happen next? There is no price action that rises without pullbacks. If it goes up too much, it must come down—that’s inevitable. It’s only the depth of the pullback that’s unknown. If, going forward, capital continues to flow in strongly and overhead supply remains relatively small, it could form a range-bound consolidation between 75–98, or even 85–929. Of course, it could also form other consolidation patterns—like a bull flag. All of these are normal. Therefore, long-term longs shouldn’t be in a hurry: wait until a structure and pattern are clearly formed, then enter. One reason is to look for the lower point of the pullback; the other is to look for the breakout point. Those two long-term entry locations must be grasped.
Since there is no completely consistent price trajectory, the “cutting a boat to seek a sword” here is about copying the main players’ operational mindset.
(Of course, if the pullback breaks below 75, that would be even better—but will the main players really give an opportunity to pick up cheap chips? Who knows.)
1
4
259
PINNED
·
--
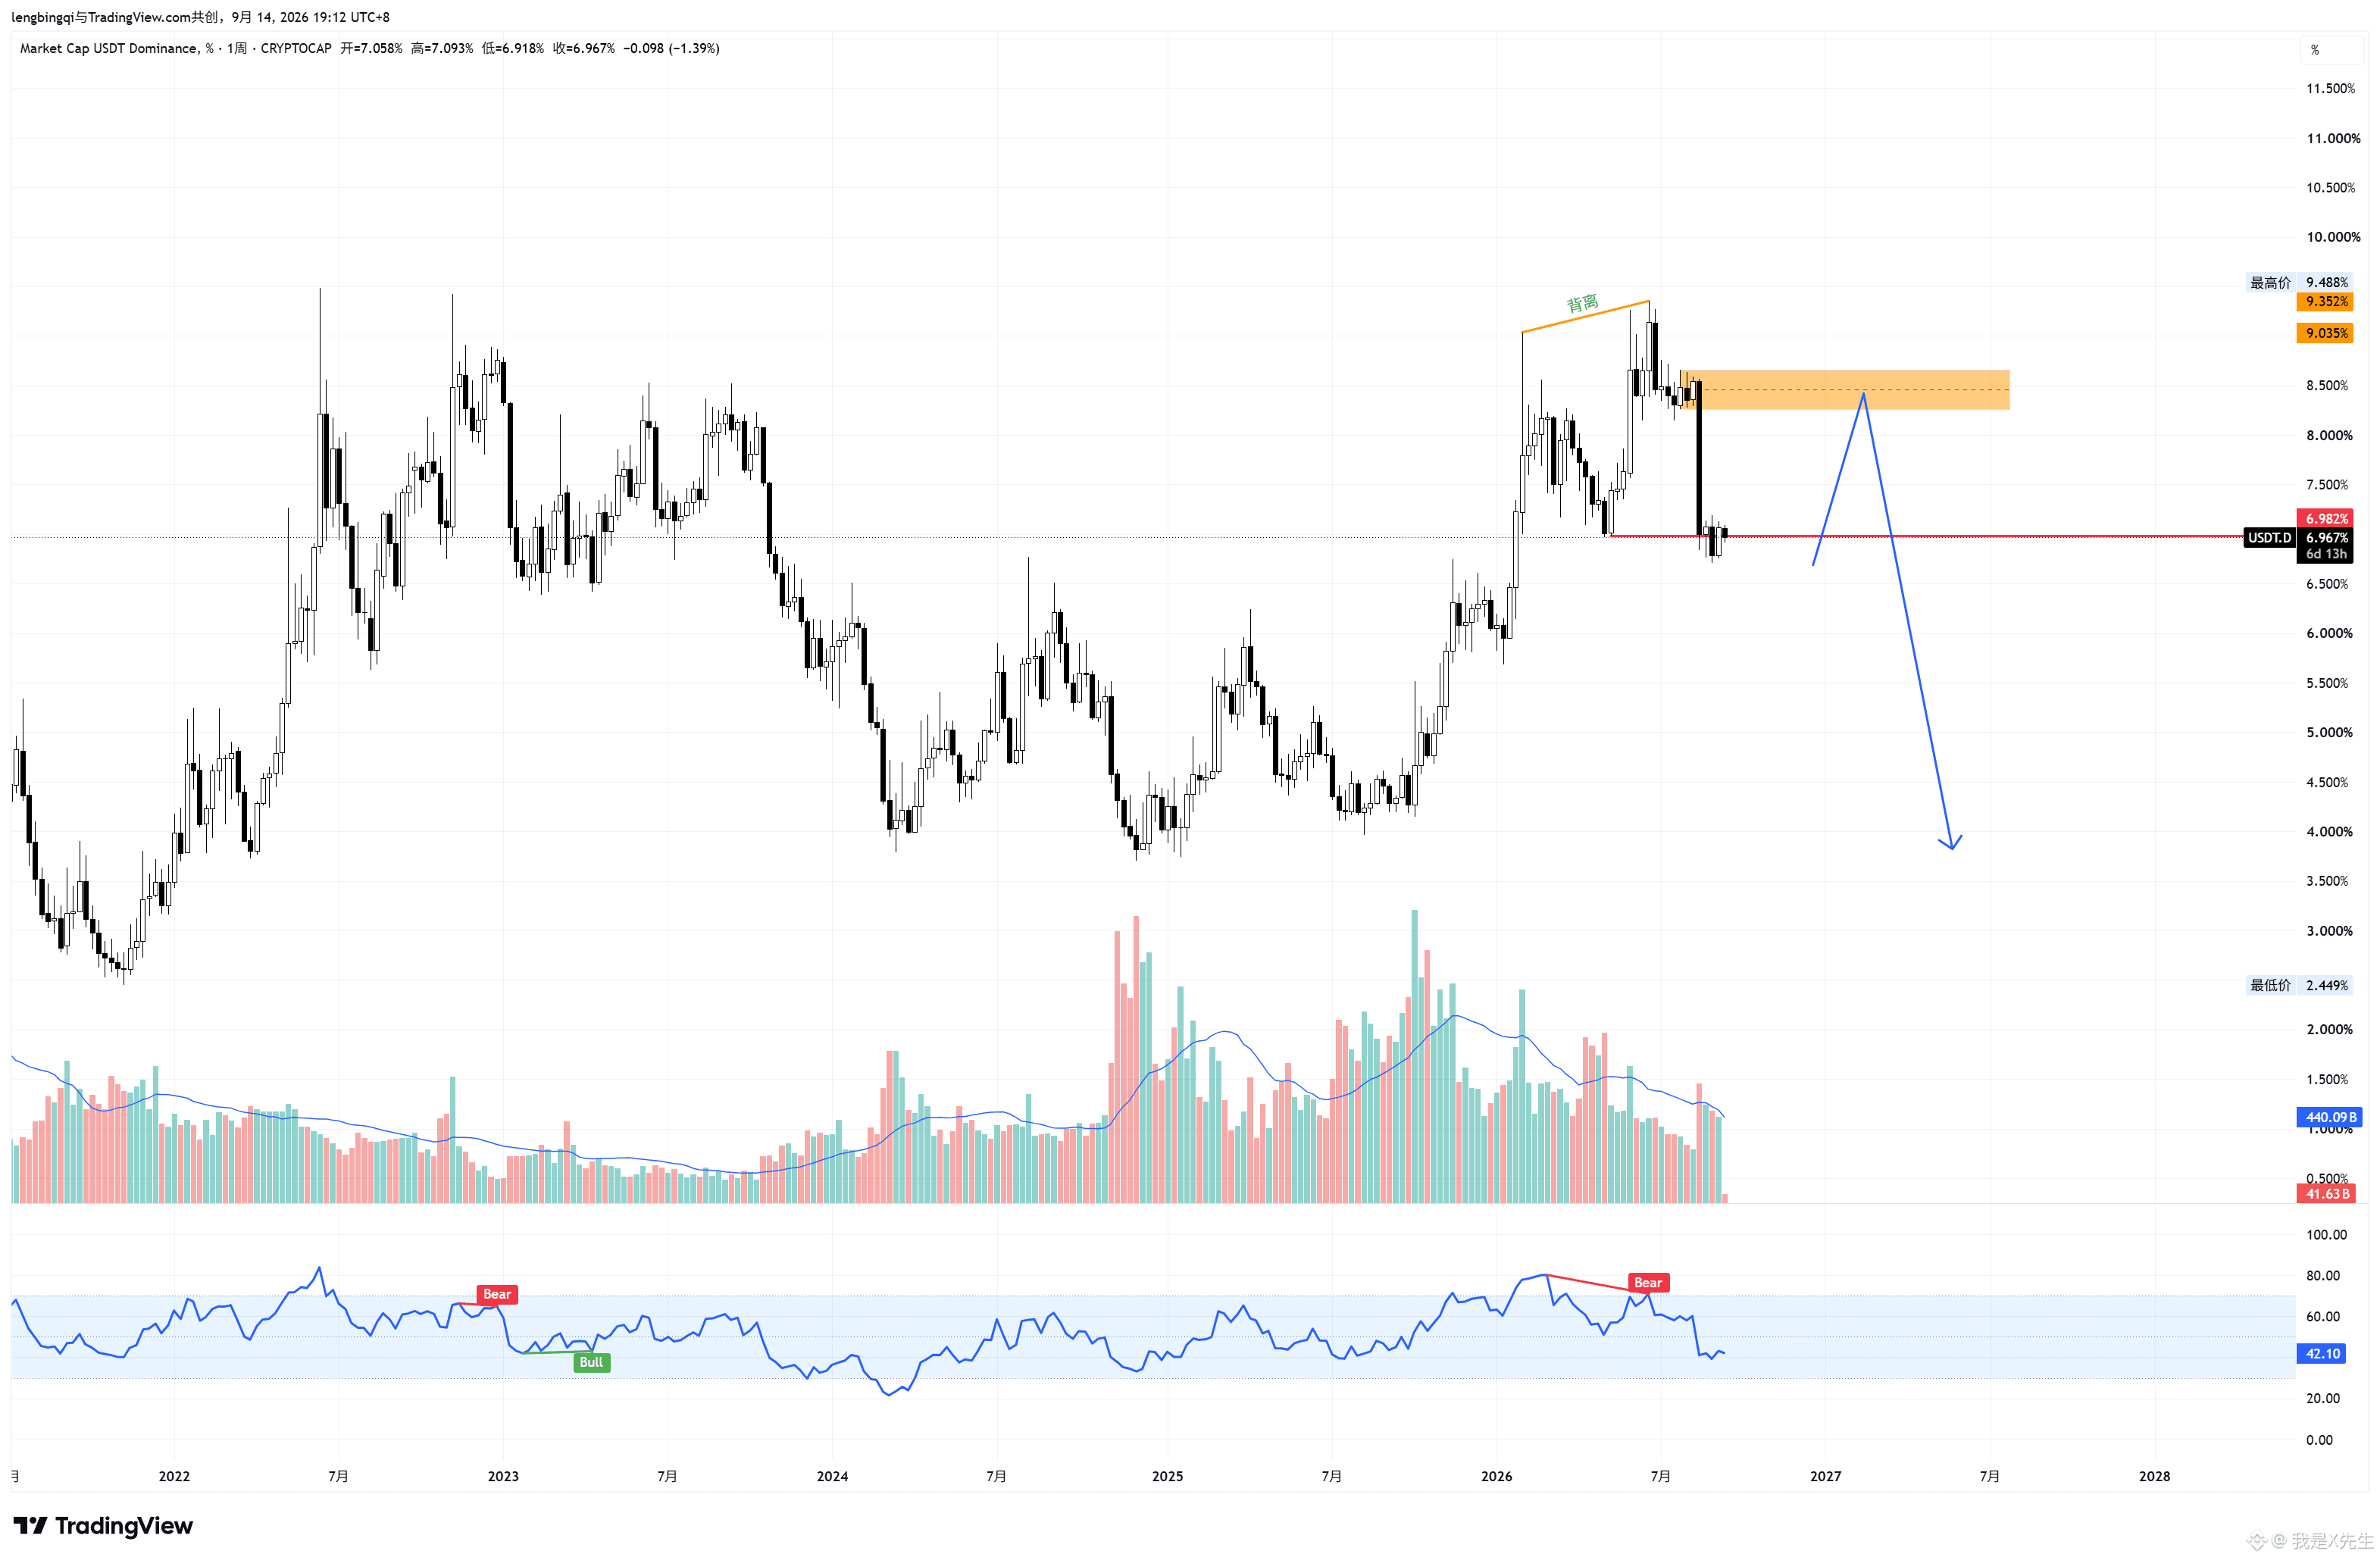
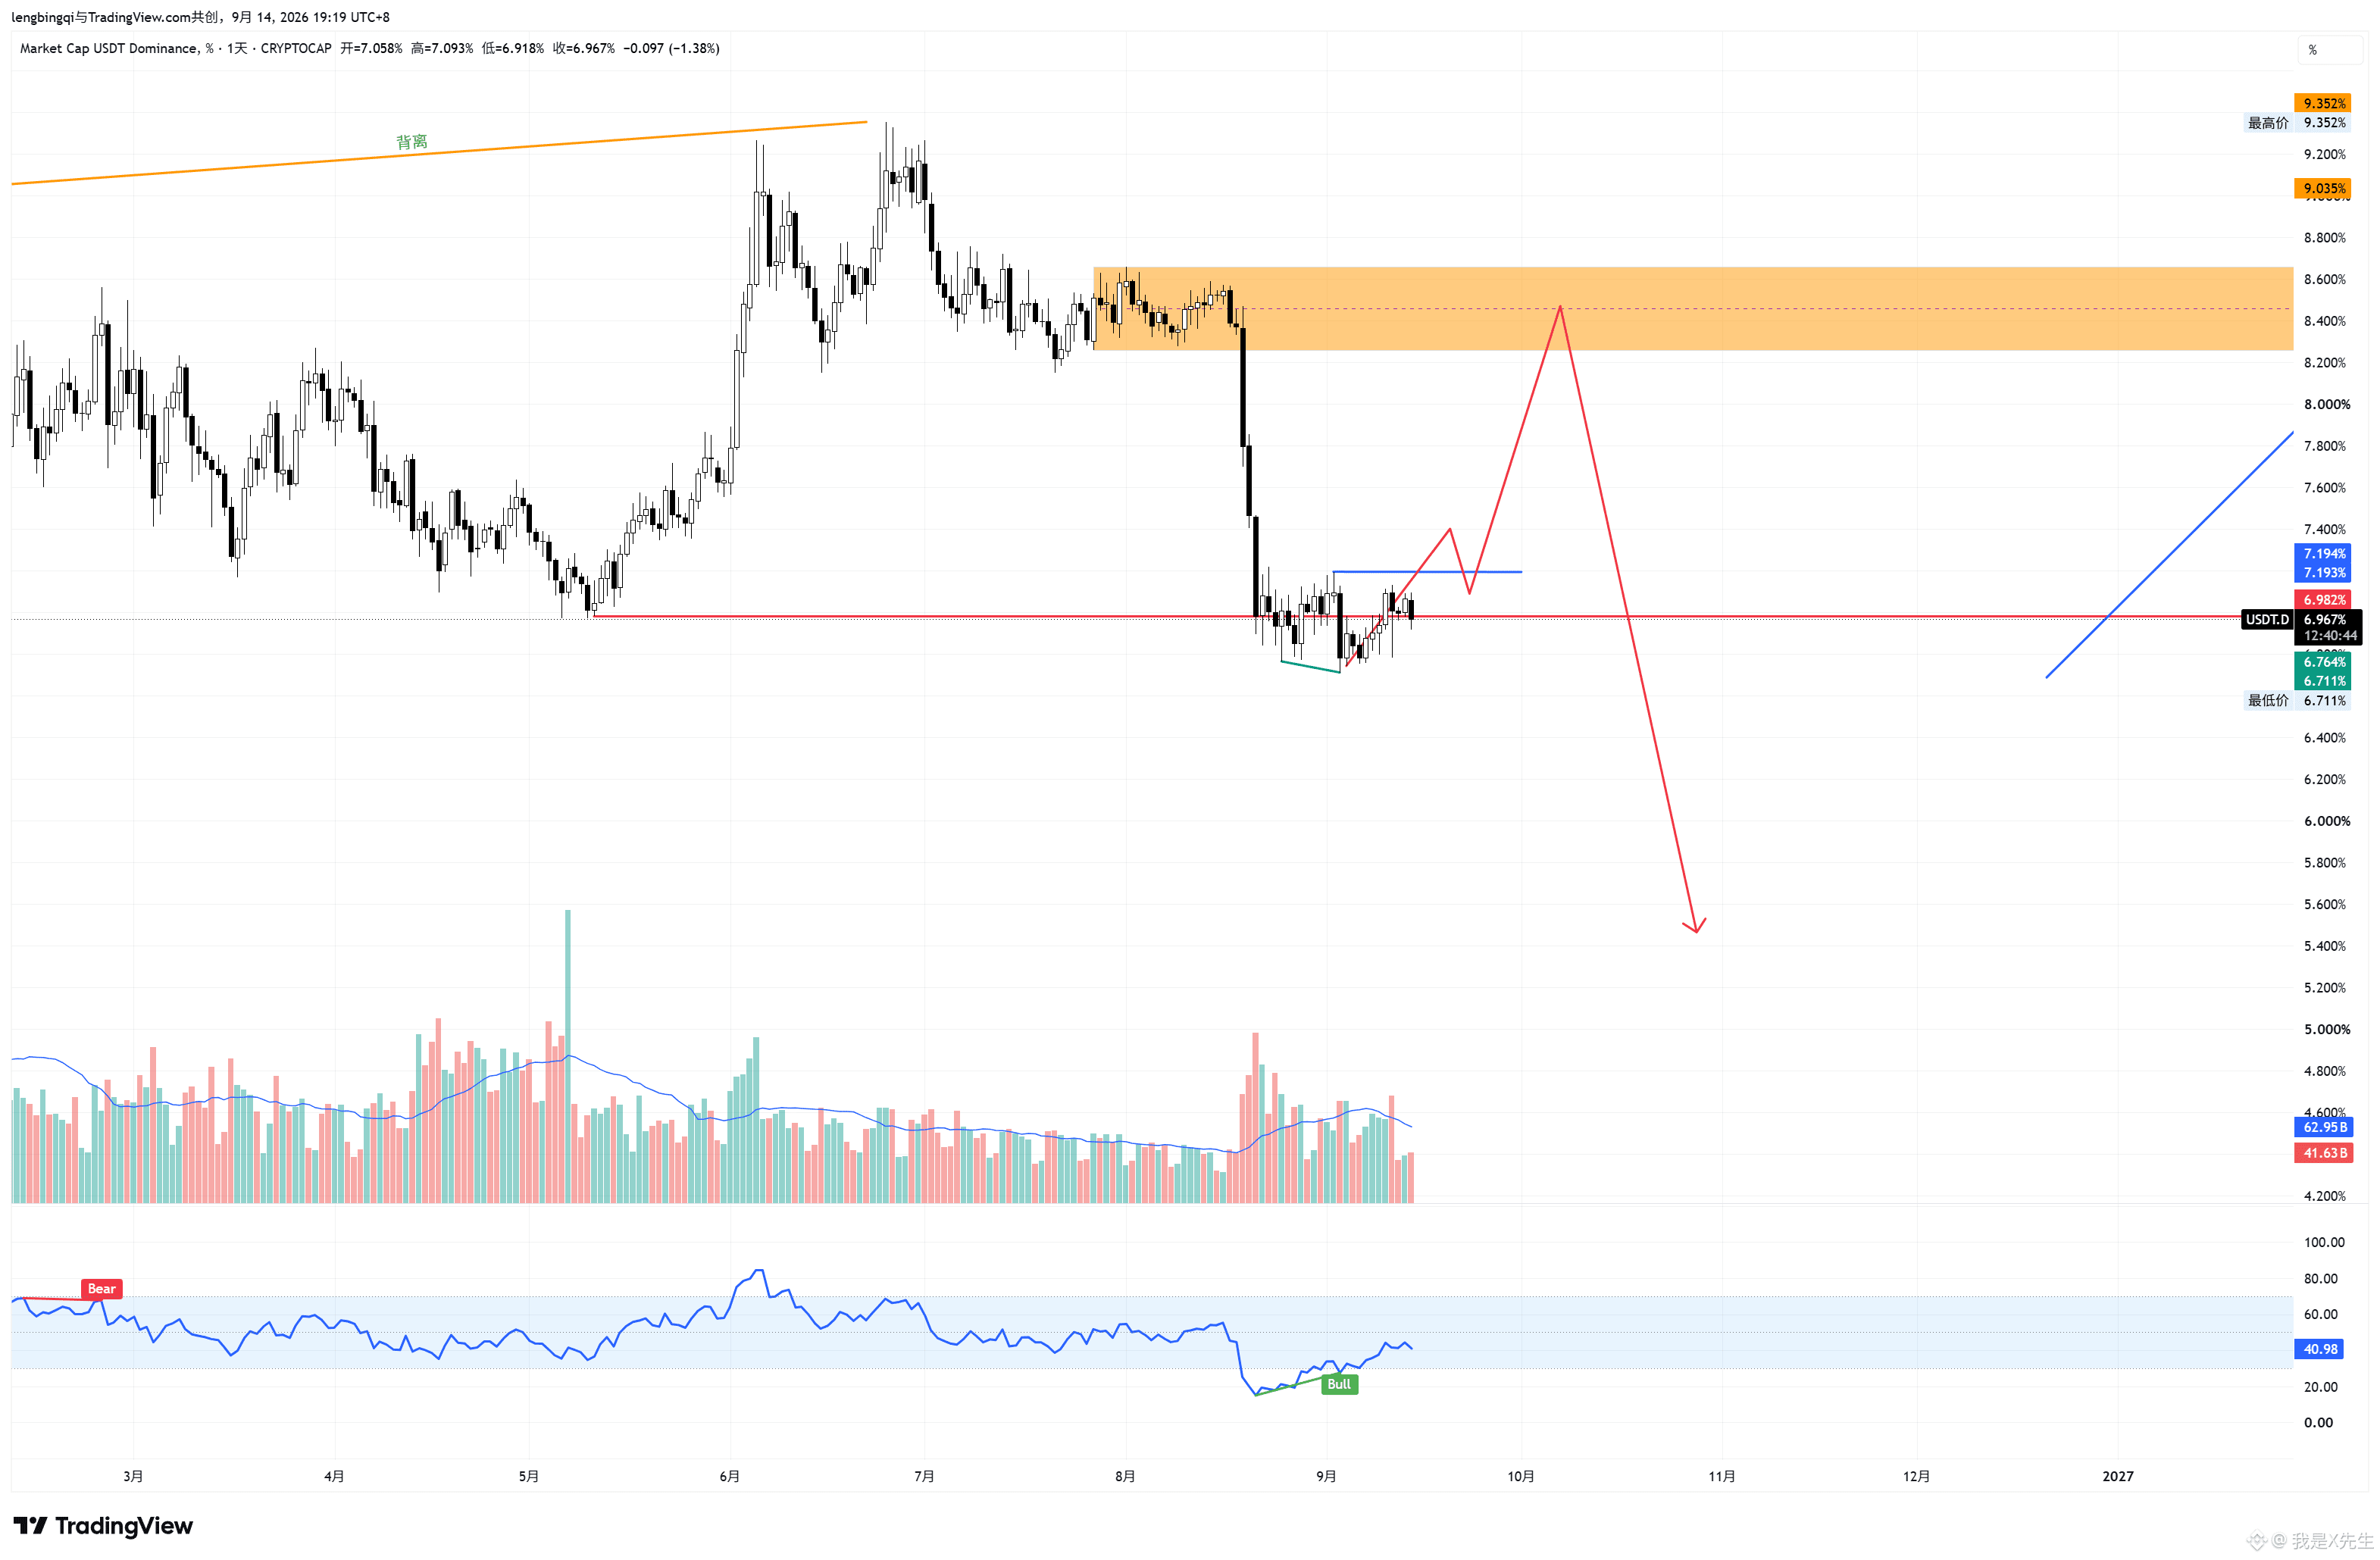
#USDT.D From USDT.P: Assessing the likelihood that the bear market is over
Figure 1: Weekly chart. Two swing highs formed near the previous high, creating a bearish divergence. Structurally, it also shows a weekly-level MSB. This can be interpreted as: the bear market has effectively ended! Of course, the end of the bear market does not mean Bitcoin won’t make new lows, but it is clear that from the current 82 level—or any new high this week (if there is one)—a further drop would be a correction, not a brand-new downturn. The difference lies in the depth of the correction.
Spot traders: your last opportunity to enter spot is about to come. Once the correction ends, BTC will rise quickly to around 90 and will not drop back below 82 again. You can refer to the earlier accumulation post: Bitcoin is currently in the “last sell-off” phase of the accumulation cycle, with panic selling already beginning to be absorbed.
Figure 2: Daily chart. A bullish divergence forms at the bottom. Break above the blue line confirms the formation of the bottom. Traders on the right side can wait for a retest and then short BTC.
#USDT.D From USDT.P: Assessing the likelihood that the bear market is over
Figure 1: Weekly chart. Two swing highs formed near the previous high, creating a bearish divergence. Structurally, it also shows a weekly-level MSB. This can be interpreted as: the bear market has effectively ended! Of course, the end of the bear market does not mean Bitcoin won’t make new lows, but it is clear that from the current 82 level—or any new high this week (if there is one)—a further drop would be a correction, not a brand-new downturn. The difference lies in the depth of the correction.
Spot traders: your last opportunity to enter spot is about to come. Once the correction ends, BTC will rise quickly to around 90 and will not drop back below 82 again. You can refer to the earlier accumulation post: Bitcoin is currently in the “last sell-off” phase of the accumulation cycle, with panic selling already beginning to be absorbed.
Figure 2: Daily chart. A bullish divergence forms at the bottom. Break above the blue line confirms the formation of the bottom. Traders on the right side can wait for a retest and then short BTC.
Figure 1: Weekly chart. Two swing highs formed near the previous high, creating a bearish divergence. Structurally, it also shows a weekly-level MSB. This can be interpreted as: the bear market has effectively ended! Of course, the end of the bear market does not mean Bitcoin won’t make new lows, but it is clear that from the current 82 level—or any new high this week (if there is one)—a further drop would be a correction, not a brand-new downturn. The difference lies in the depth of the correction.
Spot traders: your last opportunity to enter spot is about to come. Once the correction ends, BTC will rise quickly to around 90 and will not drop back below 82 again. You can refer to the earlier accumulation post: Bitcoin is currently in the “last sell-off” phase of the accumulation cycle, with panic selling already beginning to be absorbed.
Figure 2: Daily chart. A bullish divergence forms at the bottom. Break above the blue line confirms the formation of the bottom. Traders on the right side can wait for a retest and then short BTC.
1
229
·
--
Spot buying has started; let's see how 75-755 looks here.
Spot buying has started; let's see how 75-755 looks here.
我是X先生
·
--
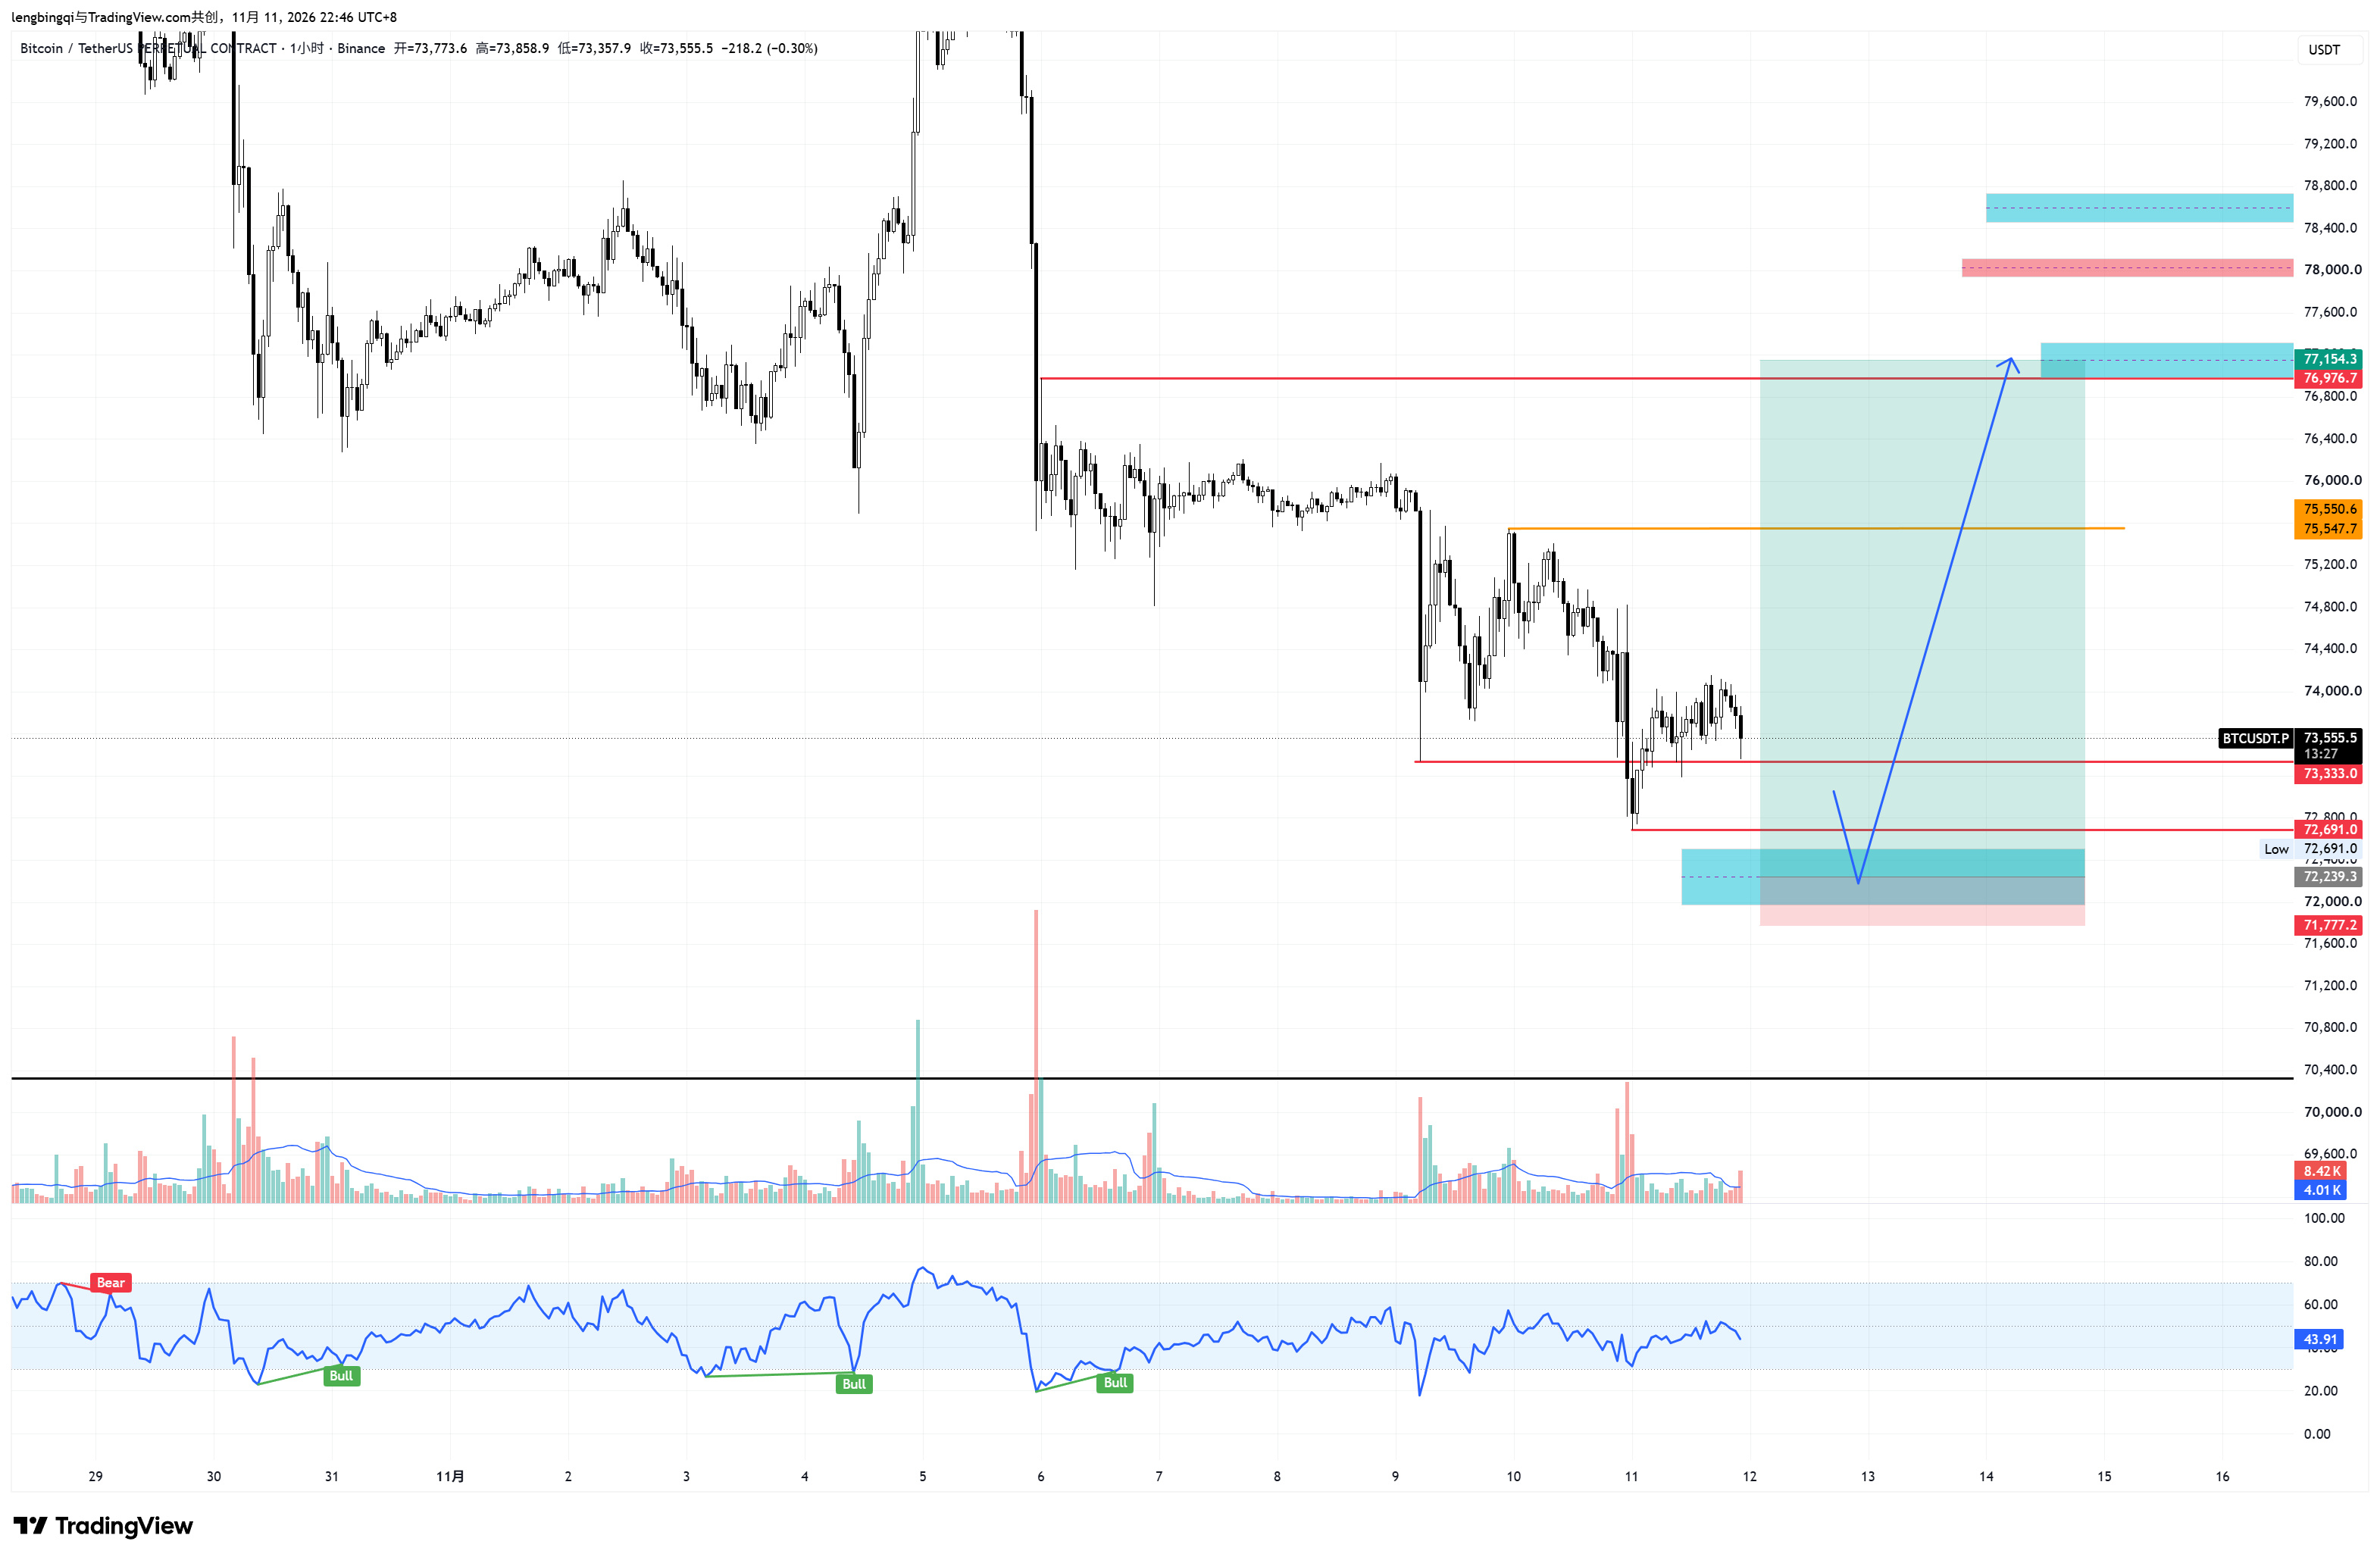
$BTC If it comes down here, add to the position. Look for a rebound to around 772 above; unchanged.
1
99
·
--
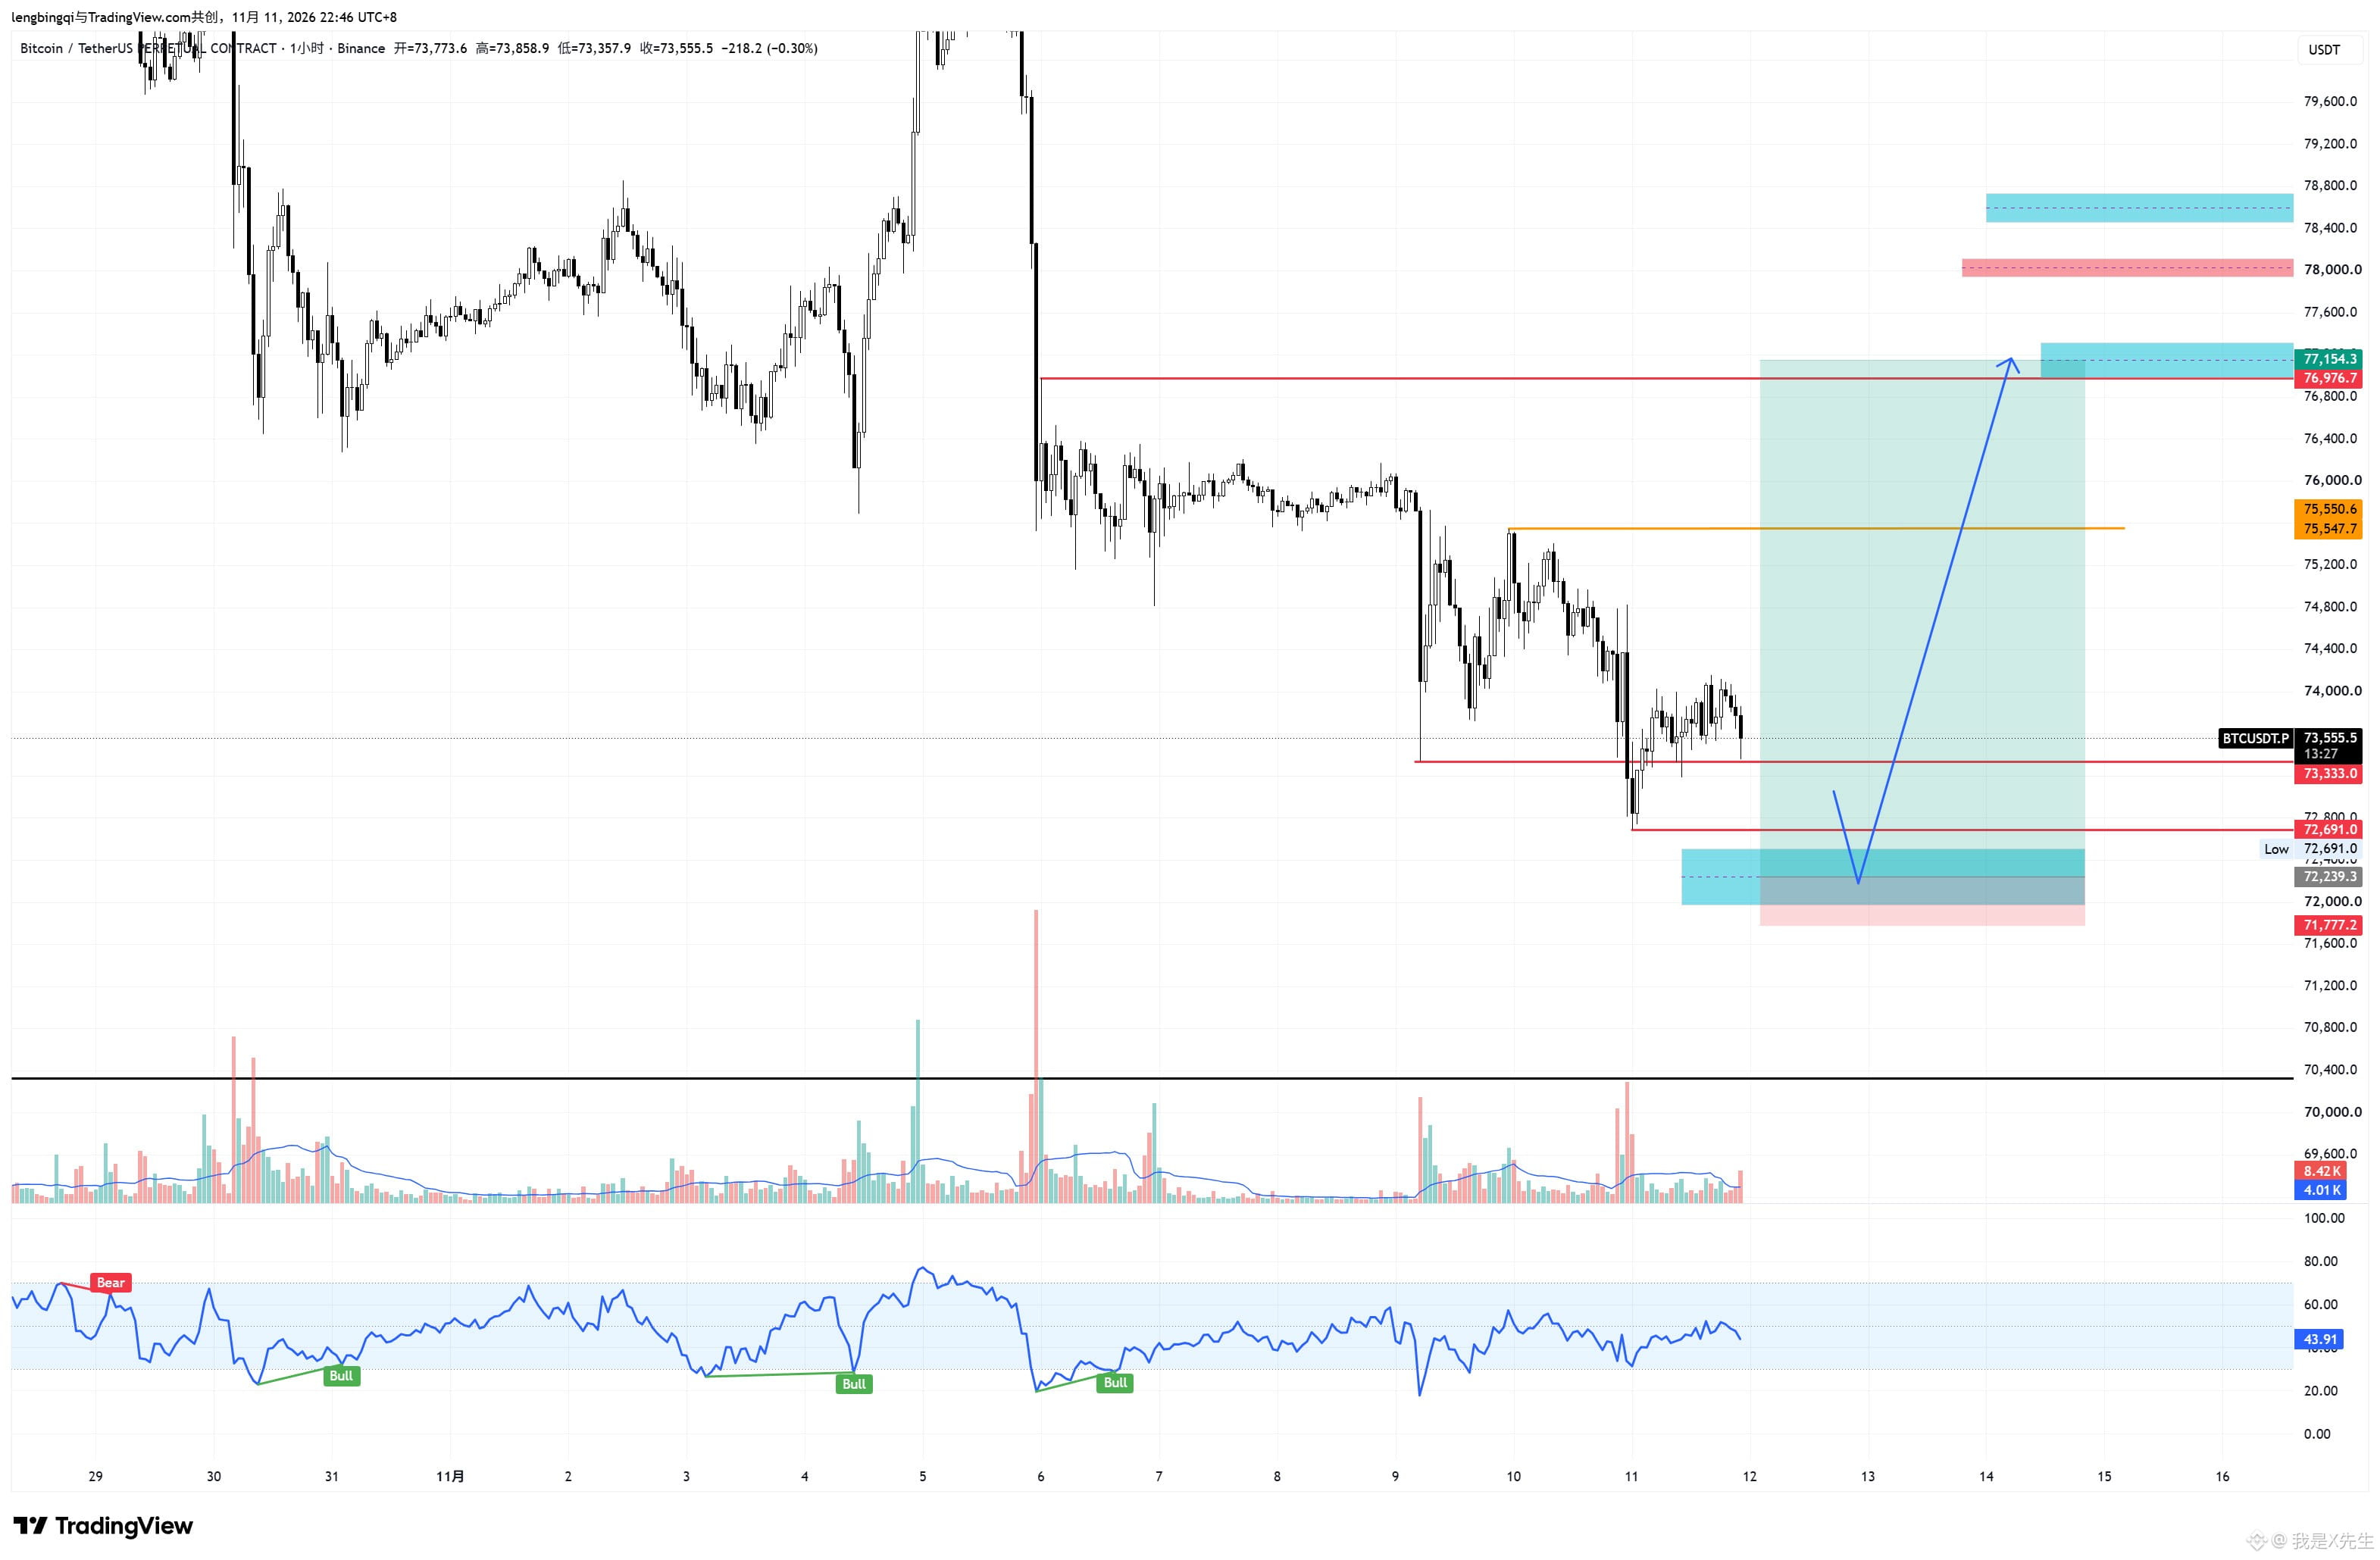
$BTC If it comes down here, add to the position. Look for a rebound to around 772 above; unchanged.
$BTC If it comes down here, add to the position. Look for a rebound to around 772 above; unchanged.
5
1
2
523
·
--
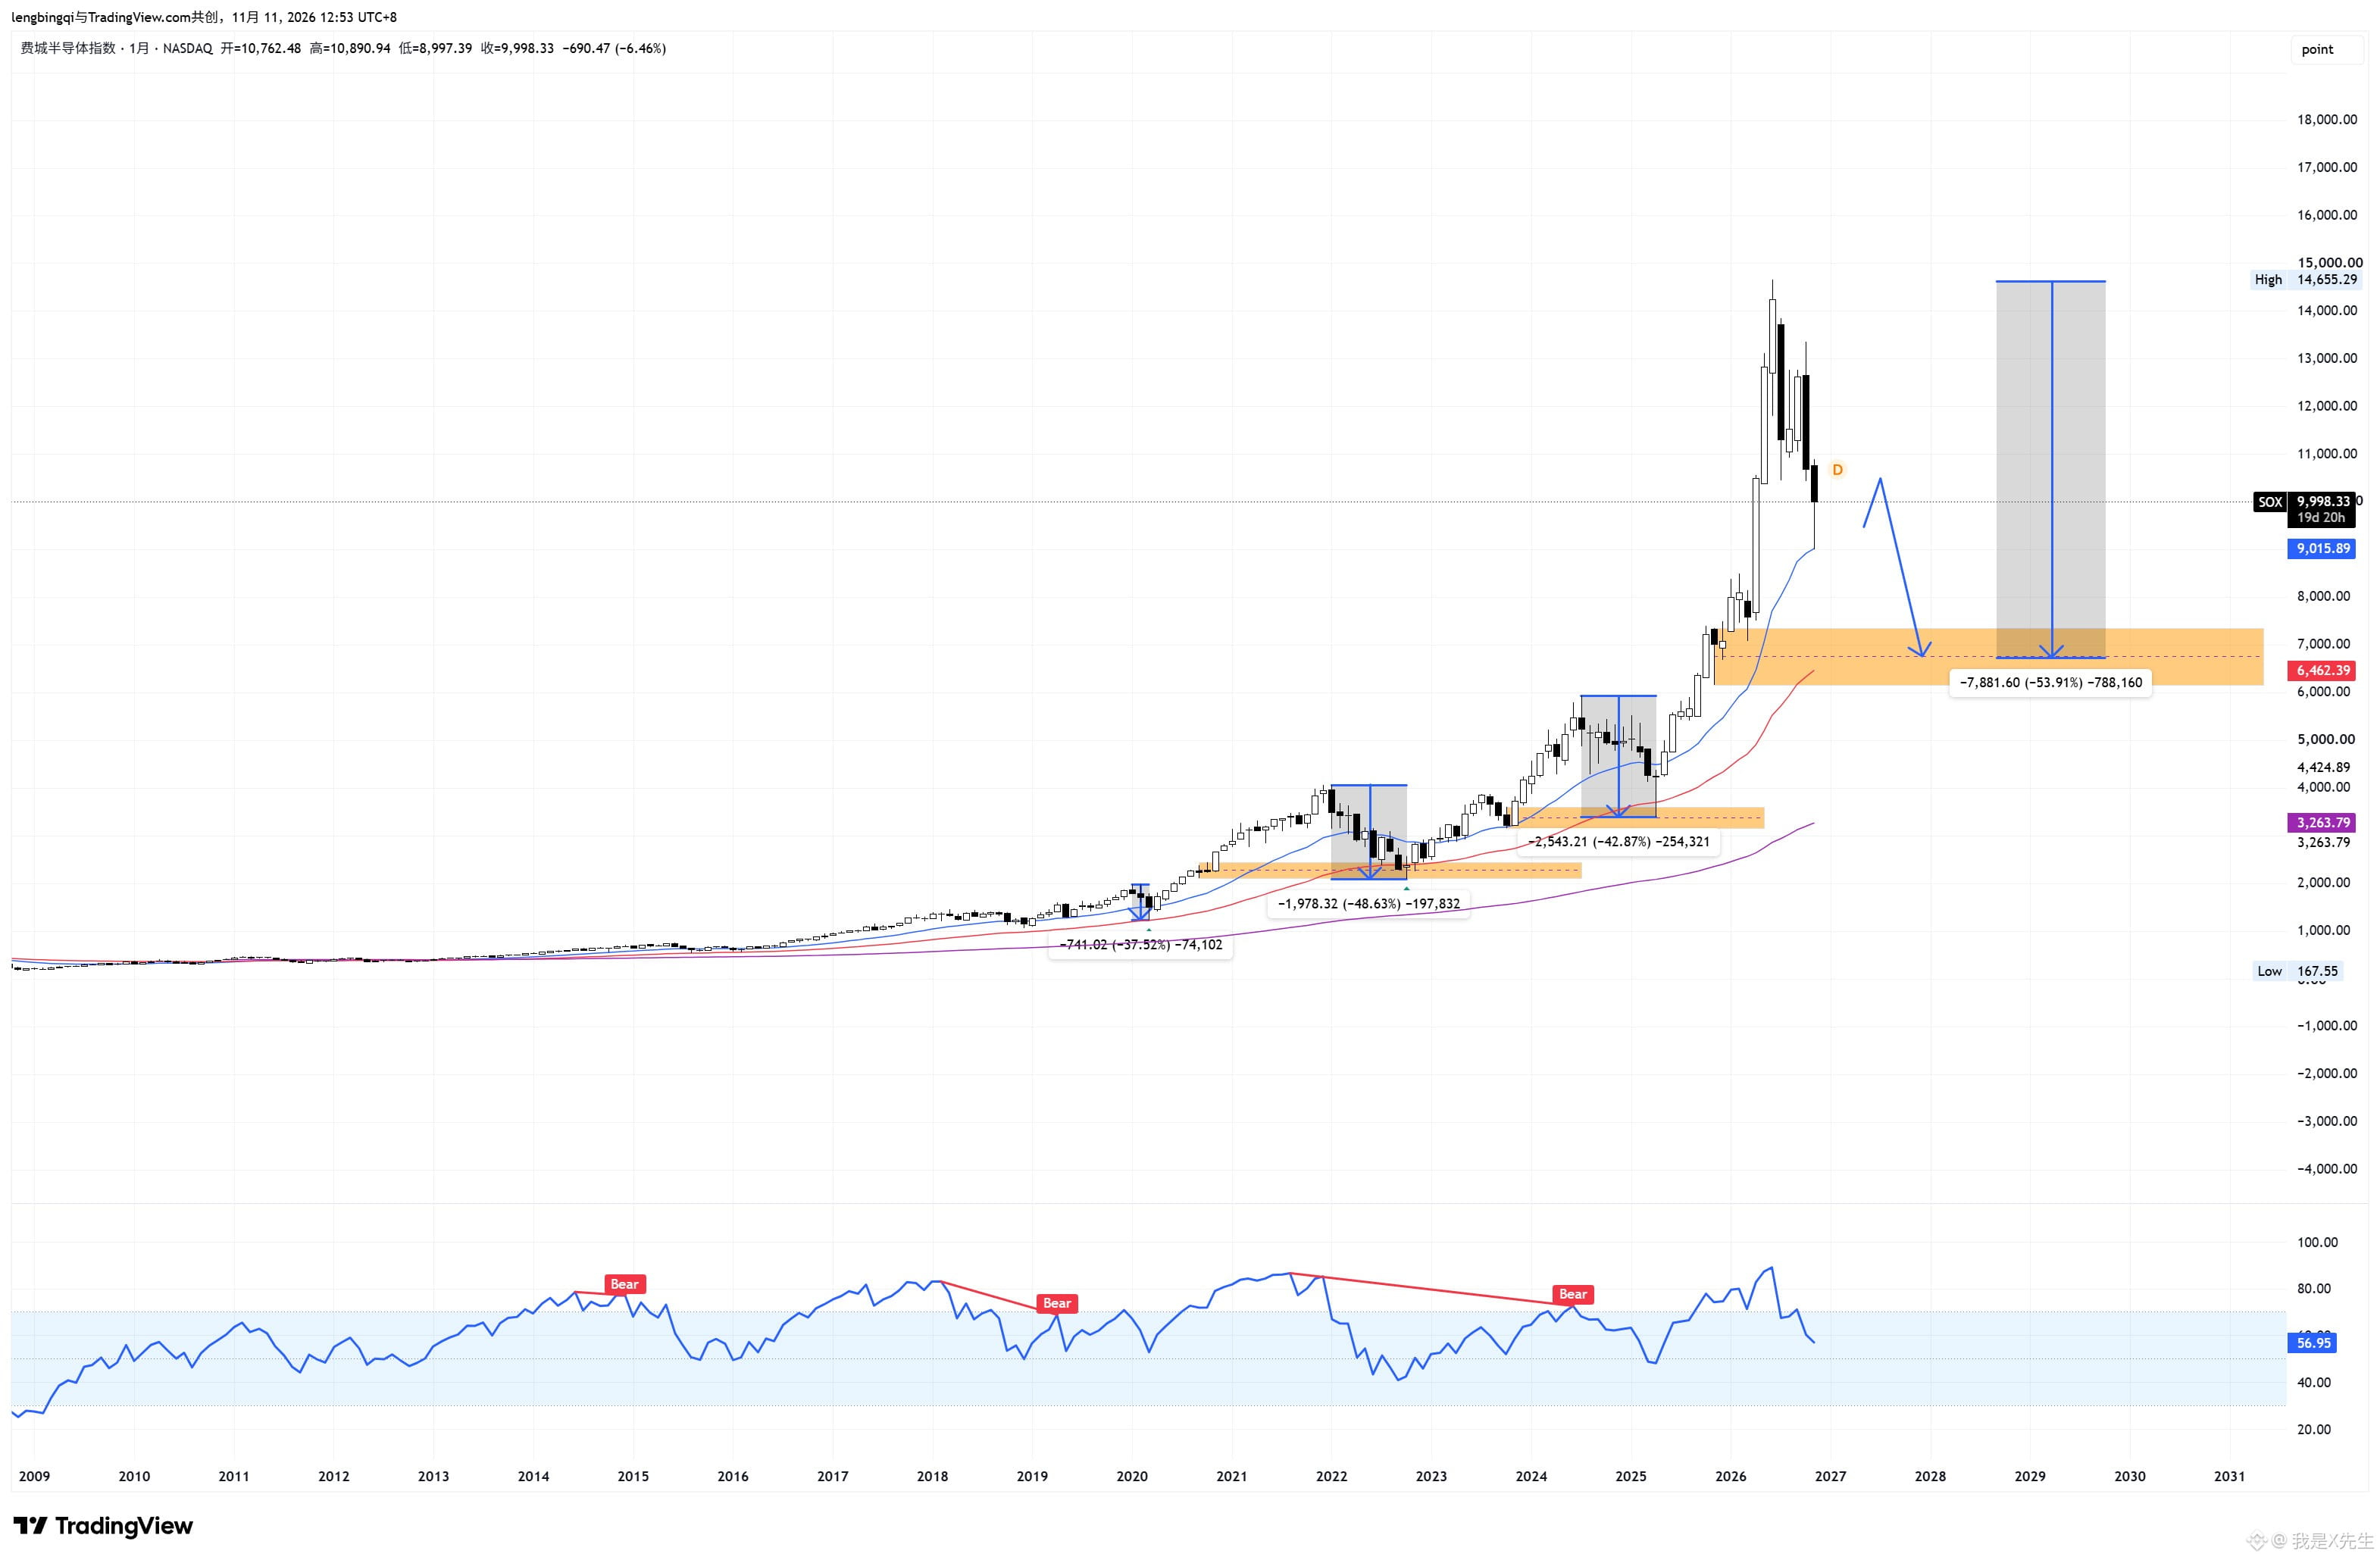
The SOX index has retested the EMA21 moving average during every previous monthly-level pullback. If it does so again this time, there’s still room to fall, and the decline could be greater than before.
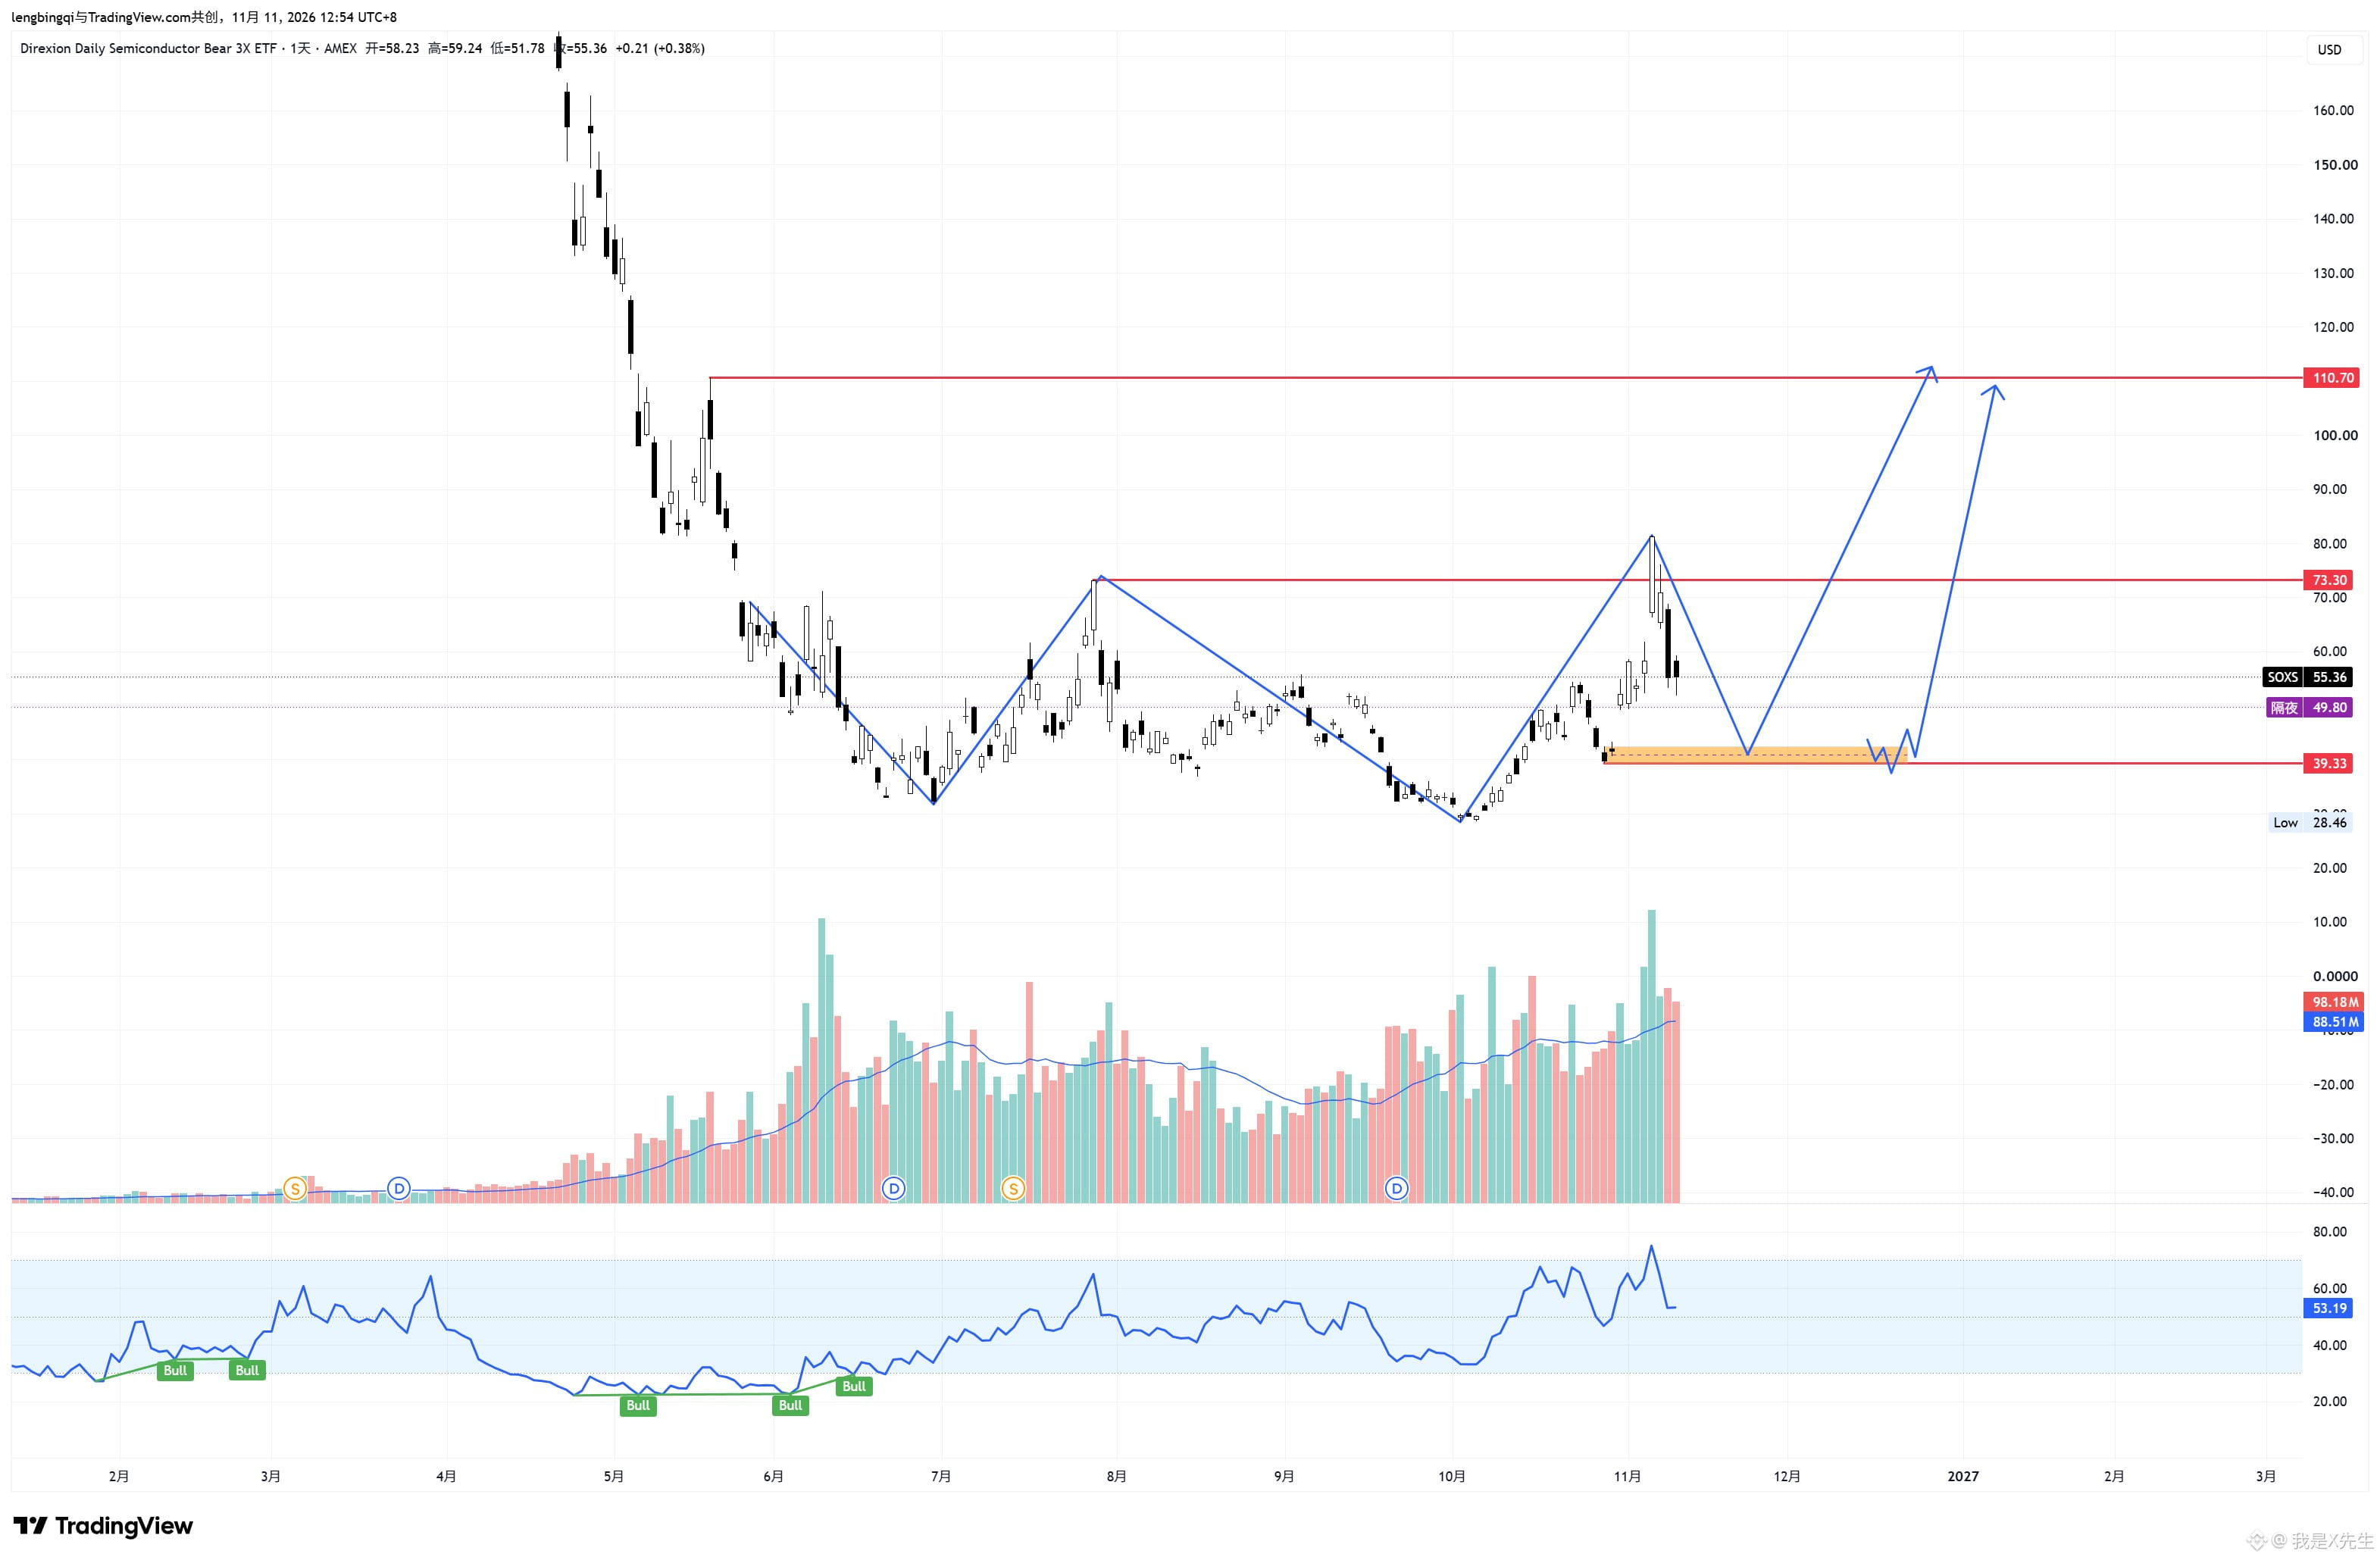
$SOXS I hope it finds support around 40. If SOX really drops sharply, there’s still quite a lot of room to the upside.
I don’t know much about U.S. stocks; this is just an idea for reference, not a basis for making trades.
The SOX index has retested the EMA21 moving average during every previous monthly-level pullback. If it does so again this time, there’s still room to fall, and the decline could be greater than before.
$SOXS I hope it finds support around 40. If SOX really drops sharply, there’s still quite a lot of room to the upside.
I don’t know much about U.S. stocks; this is just an idea for reference, not a basis for making trades.
$SOXS I hope it finds support around 40. If SOX really drops sharply, there’s still quite a lot of room to the upside.
I don’t know much about U.S. stocks; this is just an idea for reference, not a basis for making trades.
2
1.8k
·
--
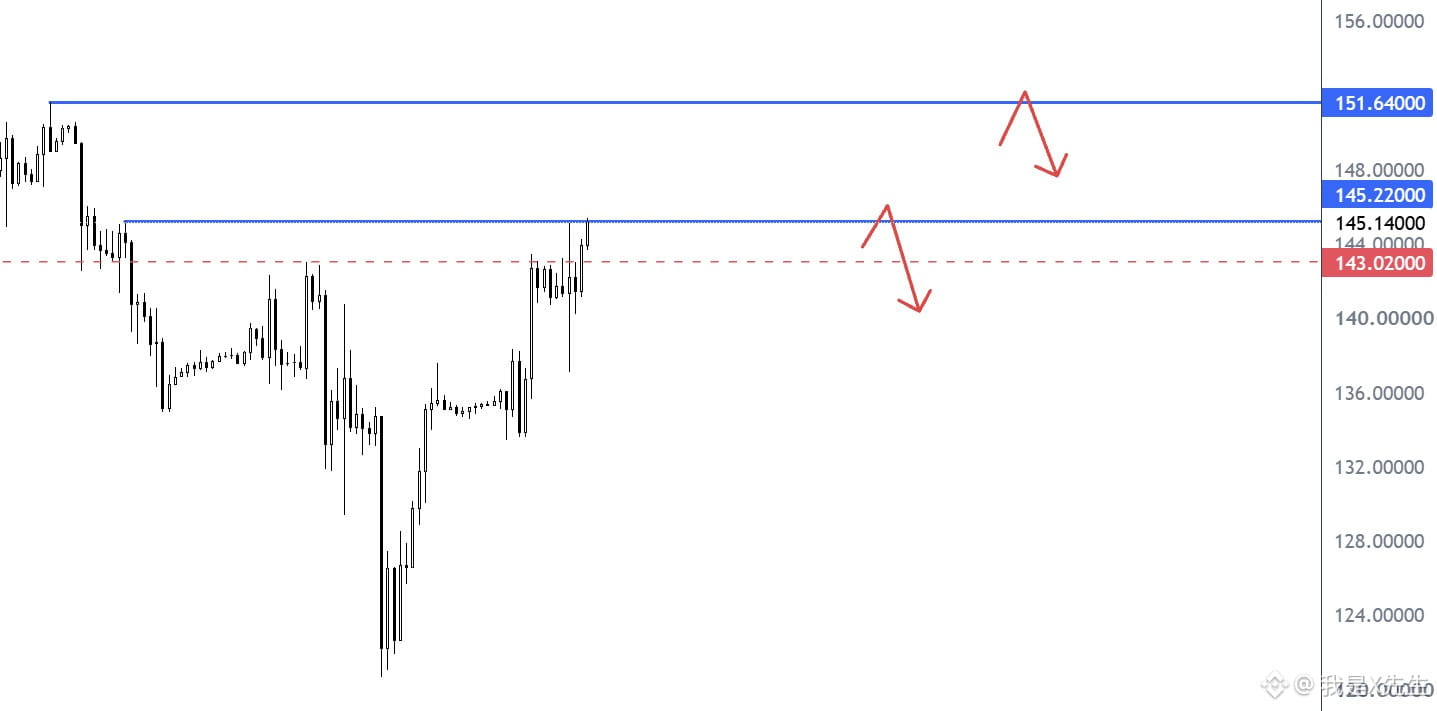
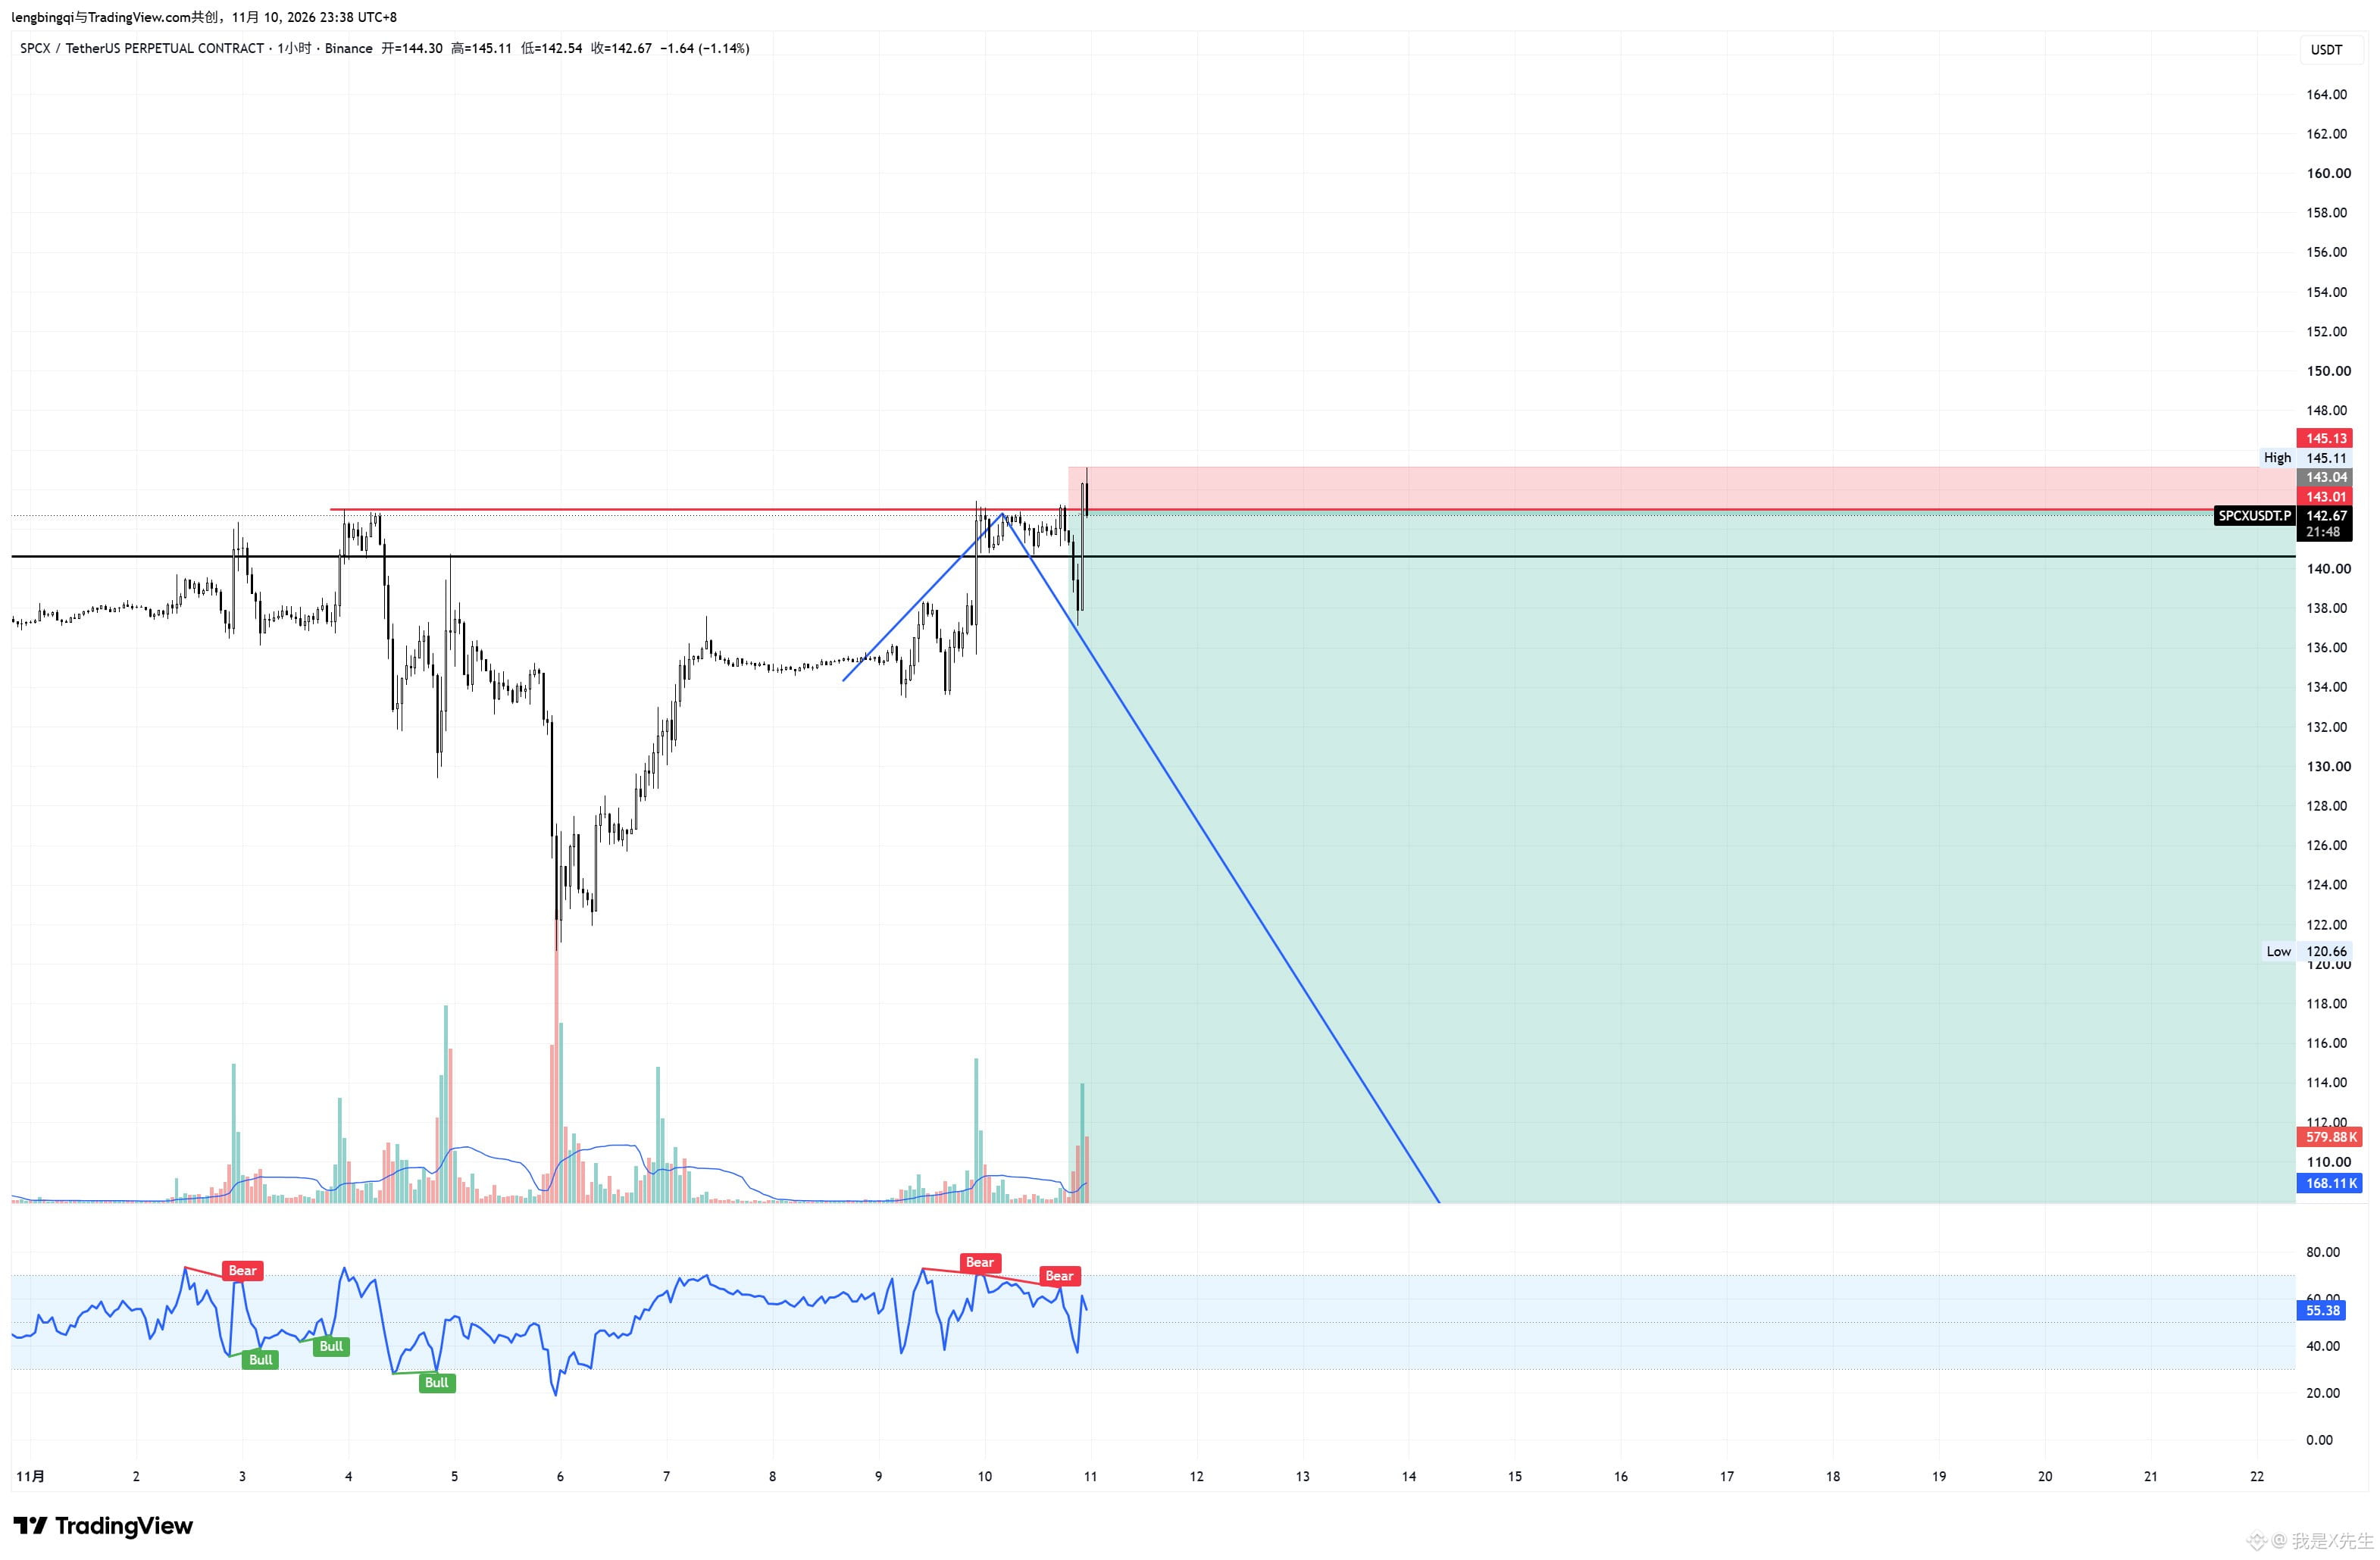
$SPCX The entry was still too hasty; I went short after just one glance.
$SPCX The entry was still too hasty; I went short after just one glance.
我是X先生
·
--
$SPCX is just 0.02 short…
267
·
--
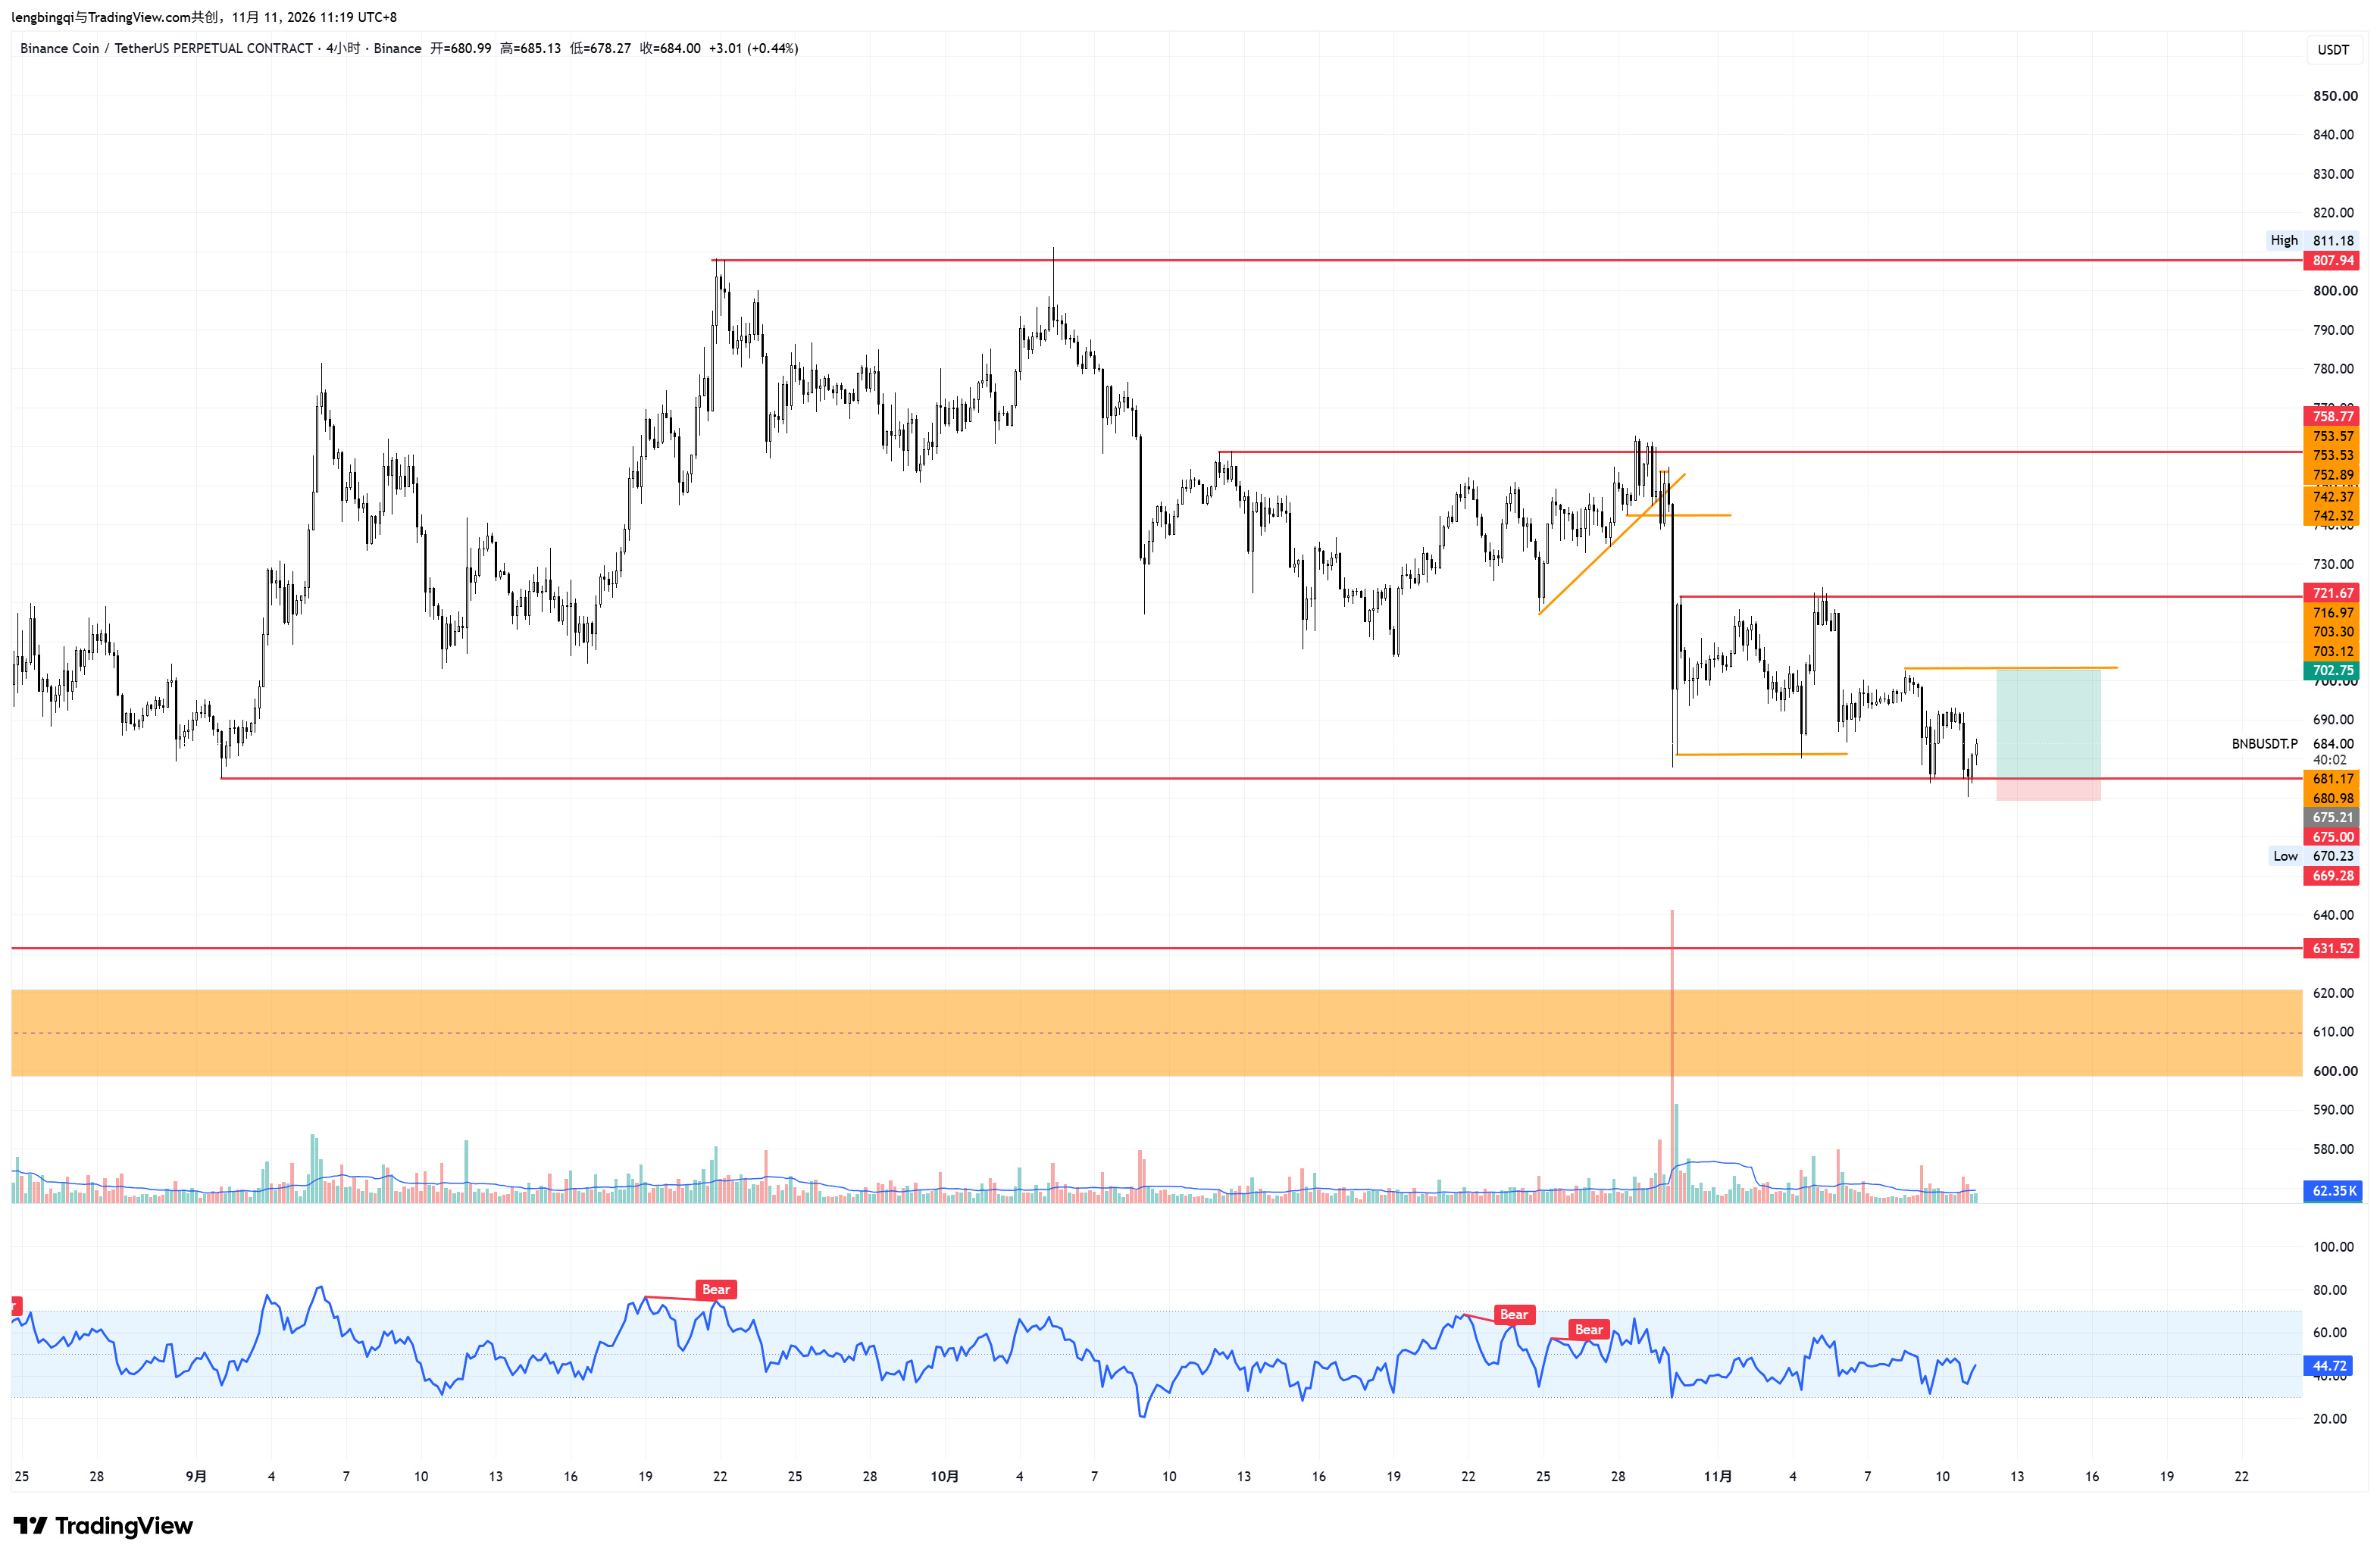
$BNB Although I don't really like BNB dragging its feet, it is indeed well-organized.
$BNB Although I don't really like BNB dragging its feet, it is indeed well-organized.
436
·
--
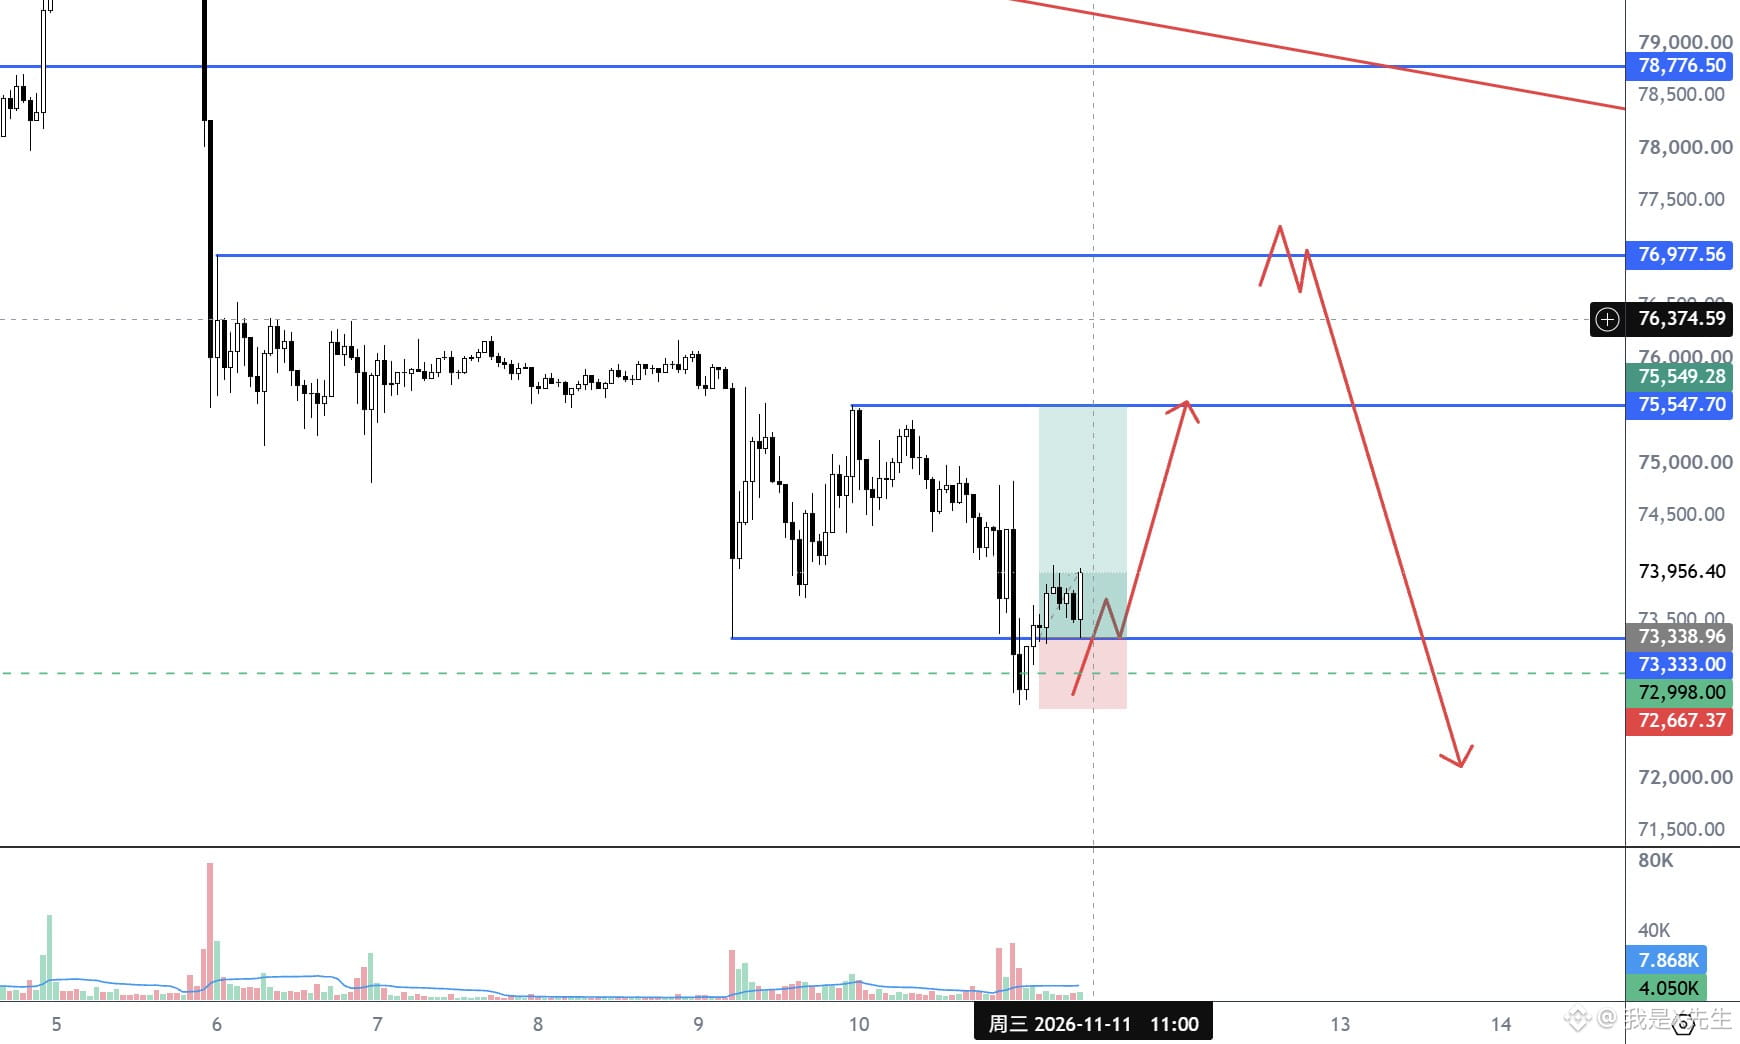
$BTC Bitcoin moved as expected and should be profitable. $SPCX rose after hours, so I moved my stop-loss up; I think it’ll probably get hit. I didn’t trade altcoins—fortunately, since Bitcoin’s trend is clearer.
$BTC Bitcoin moved as expected and should be profitable. $SPCX rose after hours, so I moved my stop-loss up; I think it’ll probably get hit. I didn’t trade altcoins—fortunately, since Bitcoin’s trend is clearer.
1
549
·
--
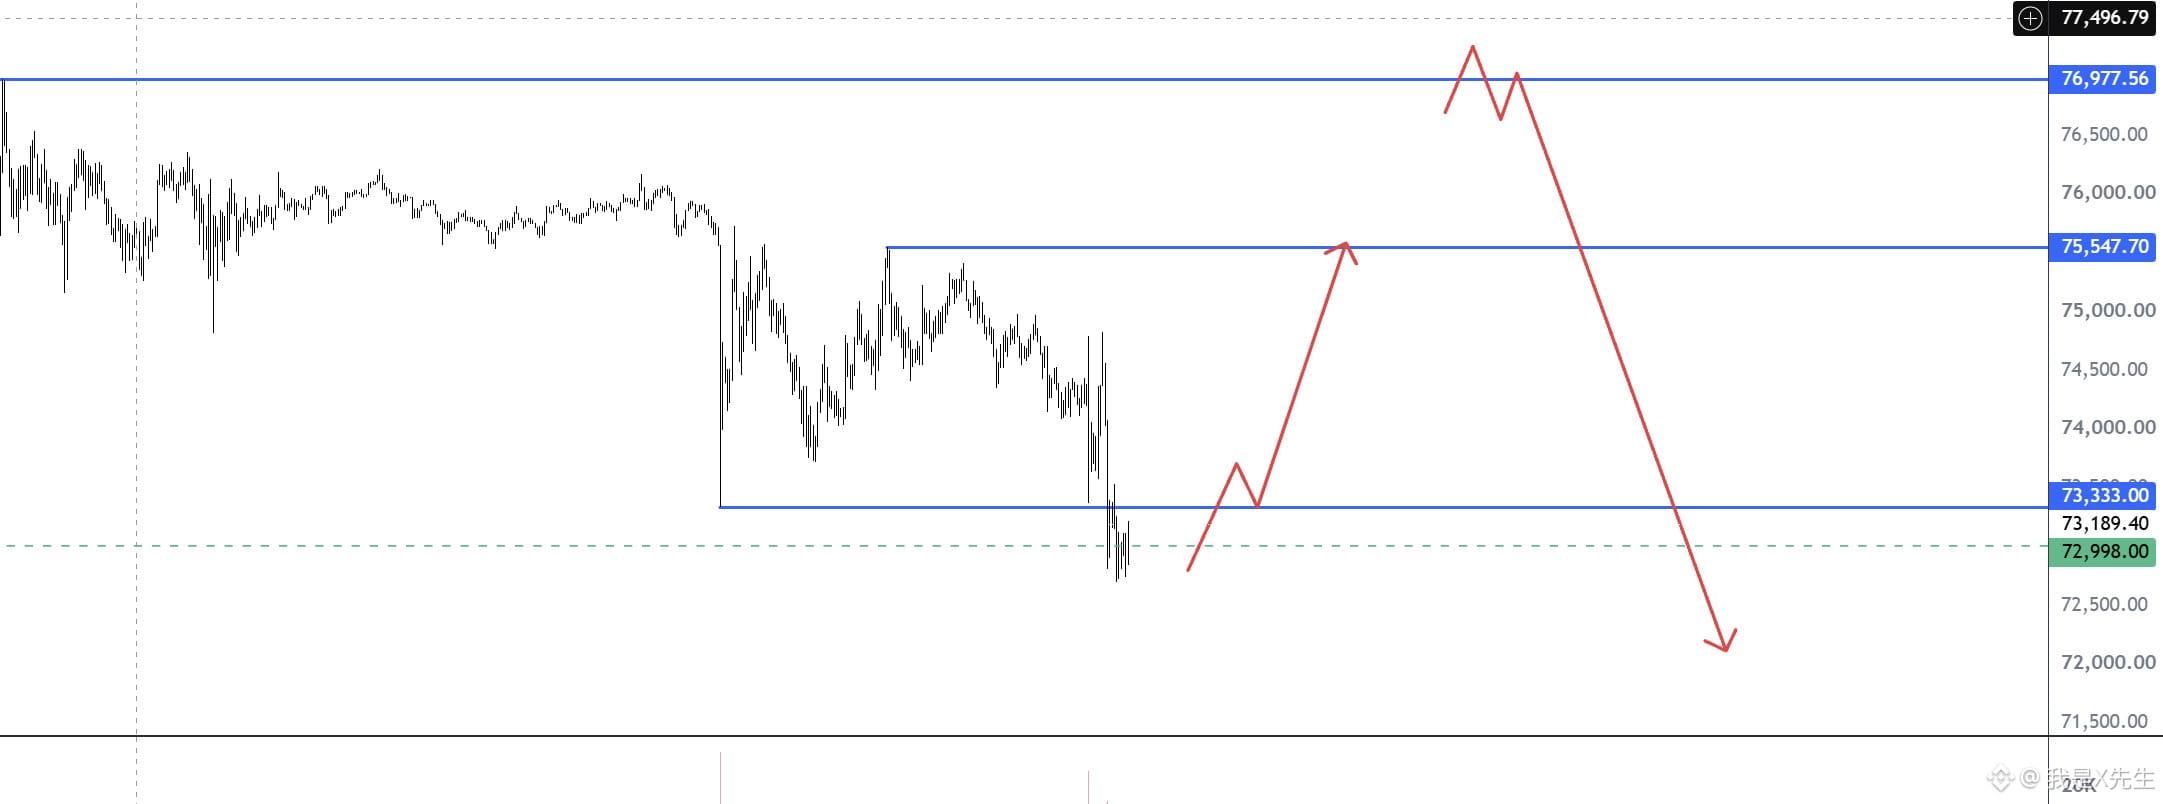
$BTC For the very short term, 733 is key. If it breaks through and holds on the retest, it’ll probably form a PO3. The next target above is around 755, then we’ll try to take out the liquidity at 772. If there’s distribution, I’ll reverse and go short.
If it can’t break through 733, that won’t be good.
$BTC For the very short term, 733 is key. If it breaks through and holds on the retest, it’ll probably form a PO3. The next target above is around 755, then we’ll try to take out the liquidity at 772. If there’s distribution, I’ll reverse and go short.
If it can’t break through 733, that won’t be good.
If it can’t break through 733, that won’t be good.
3
1
833
·
--
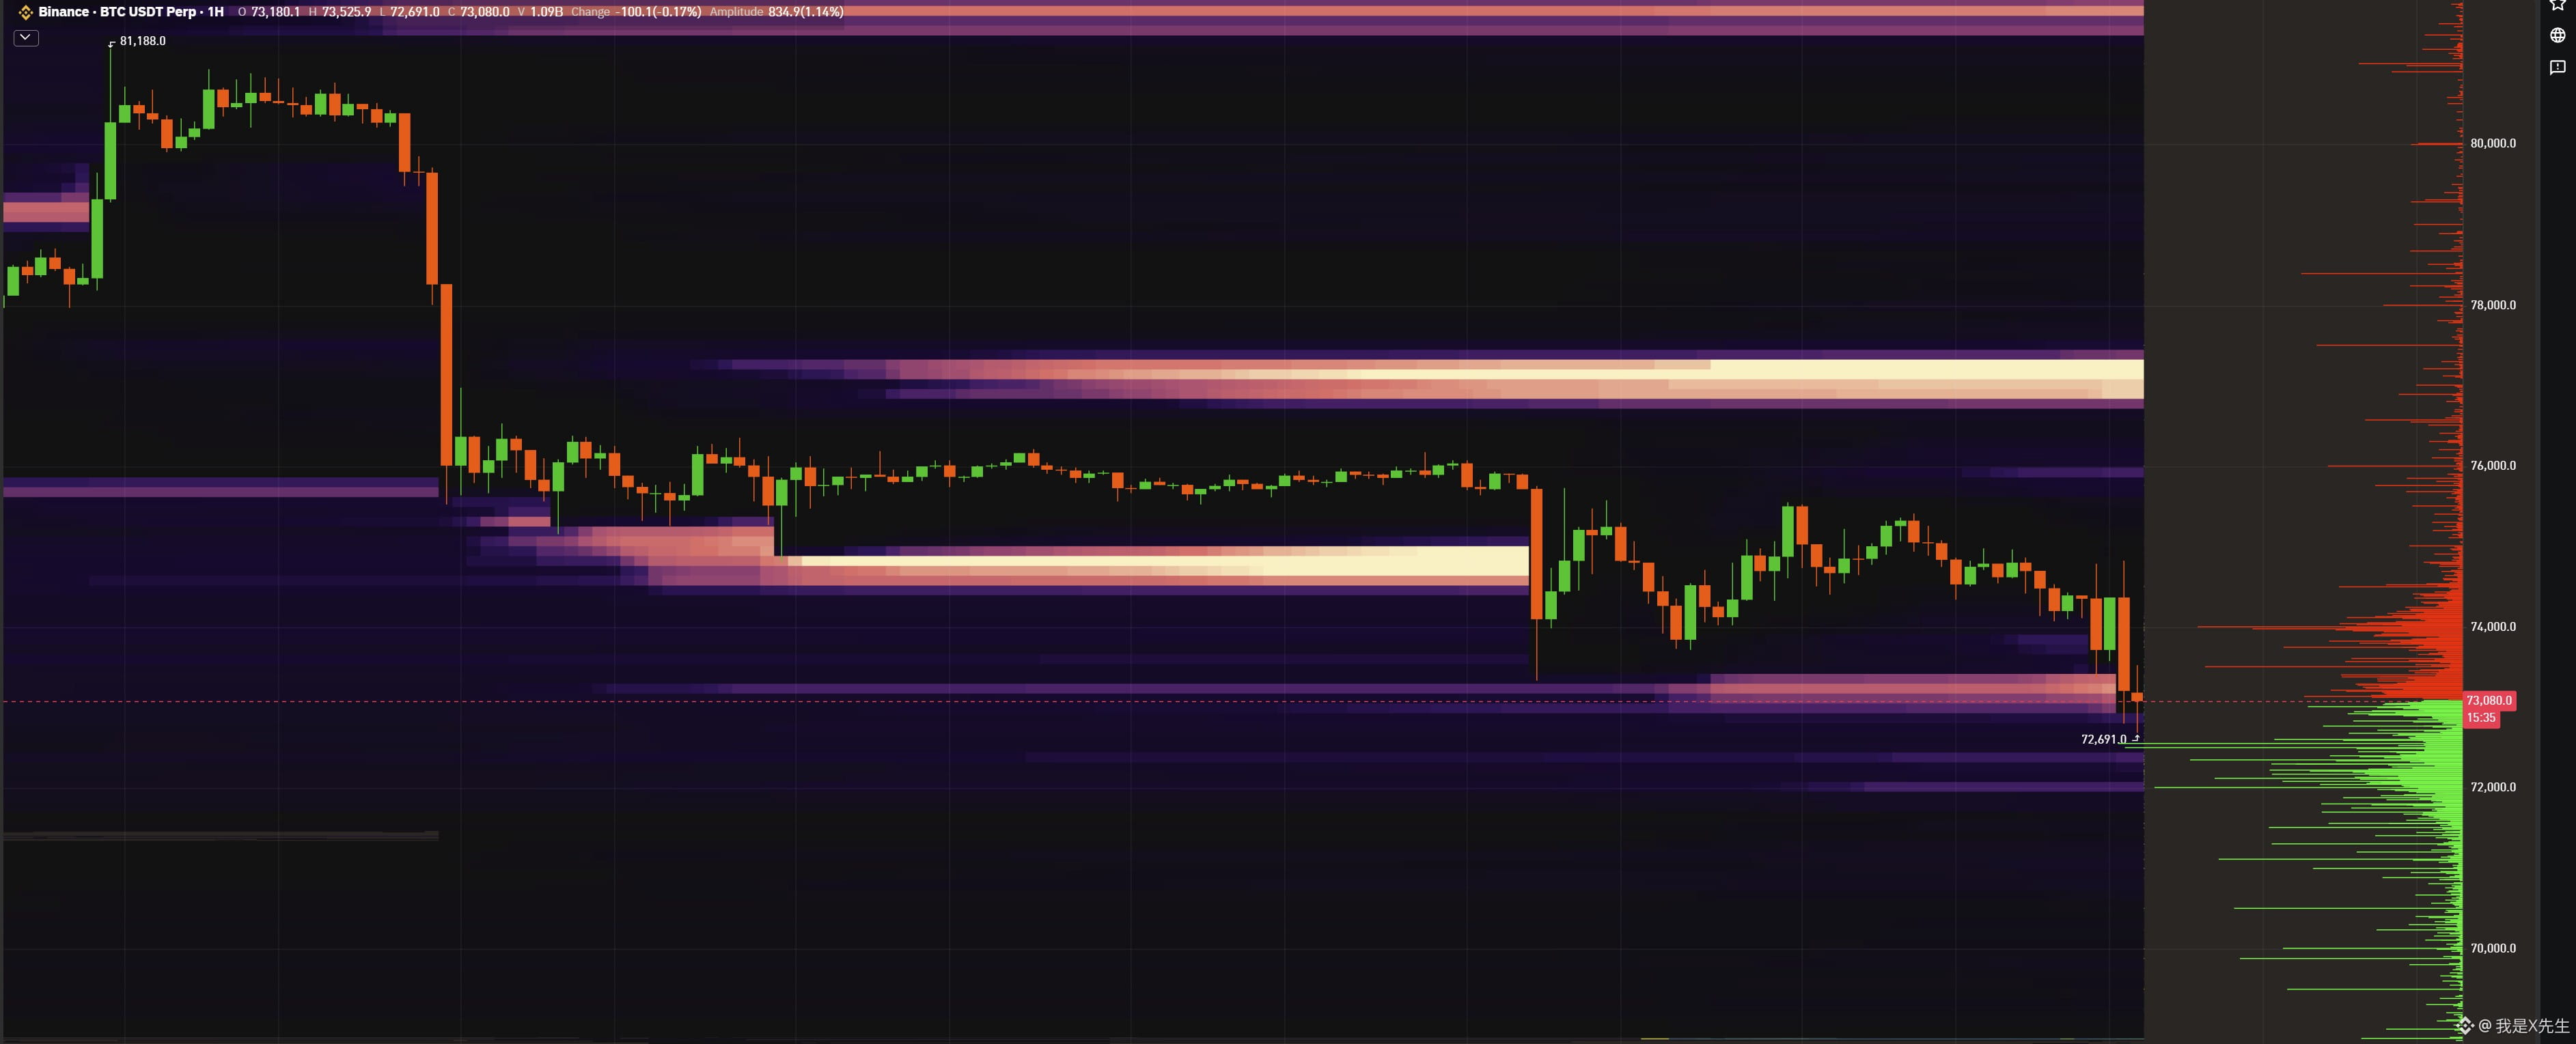
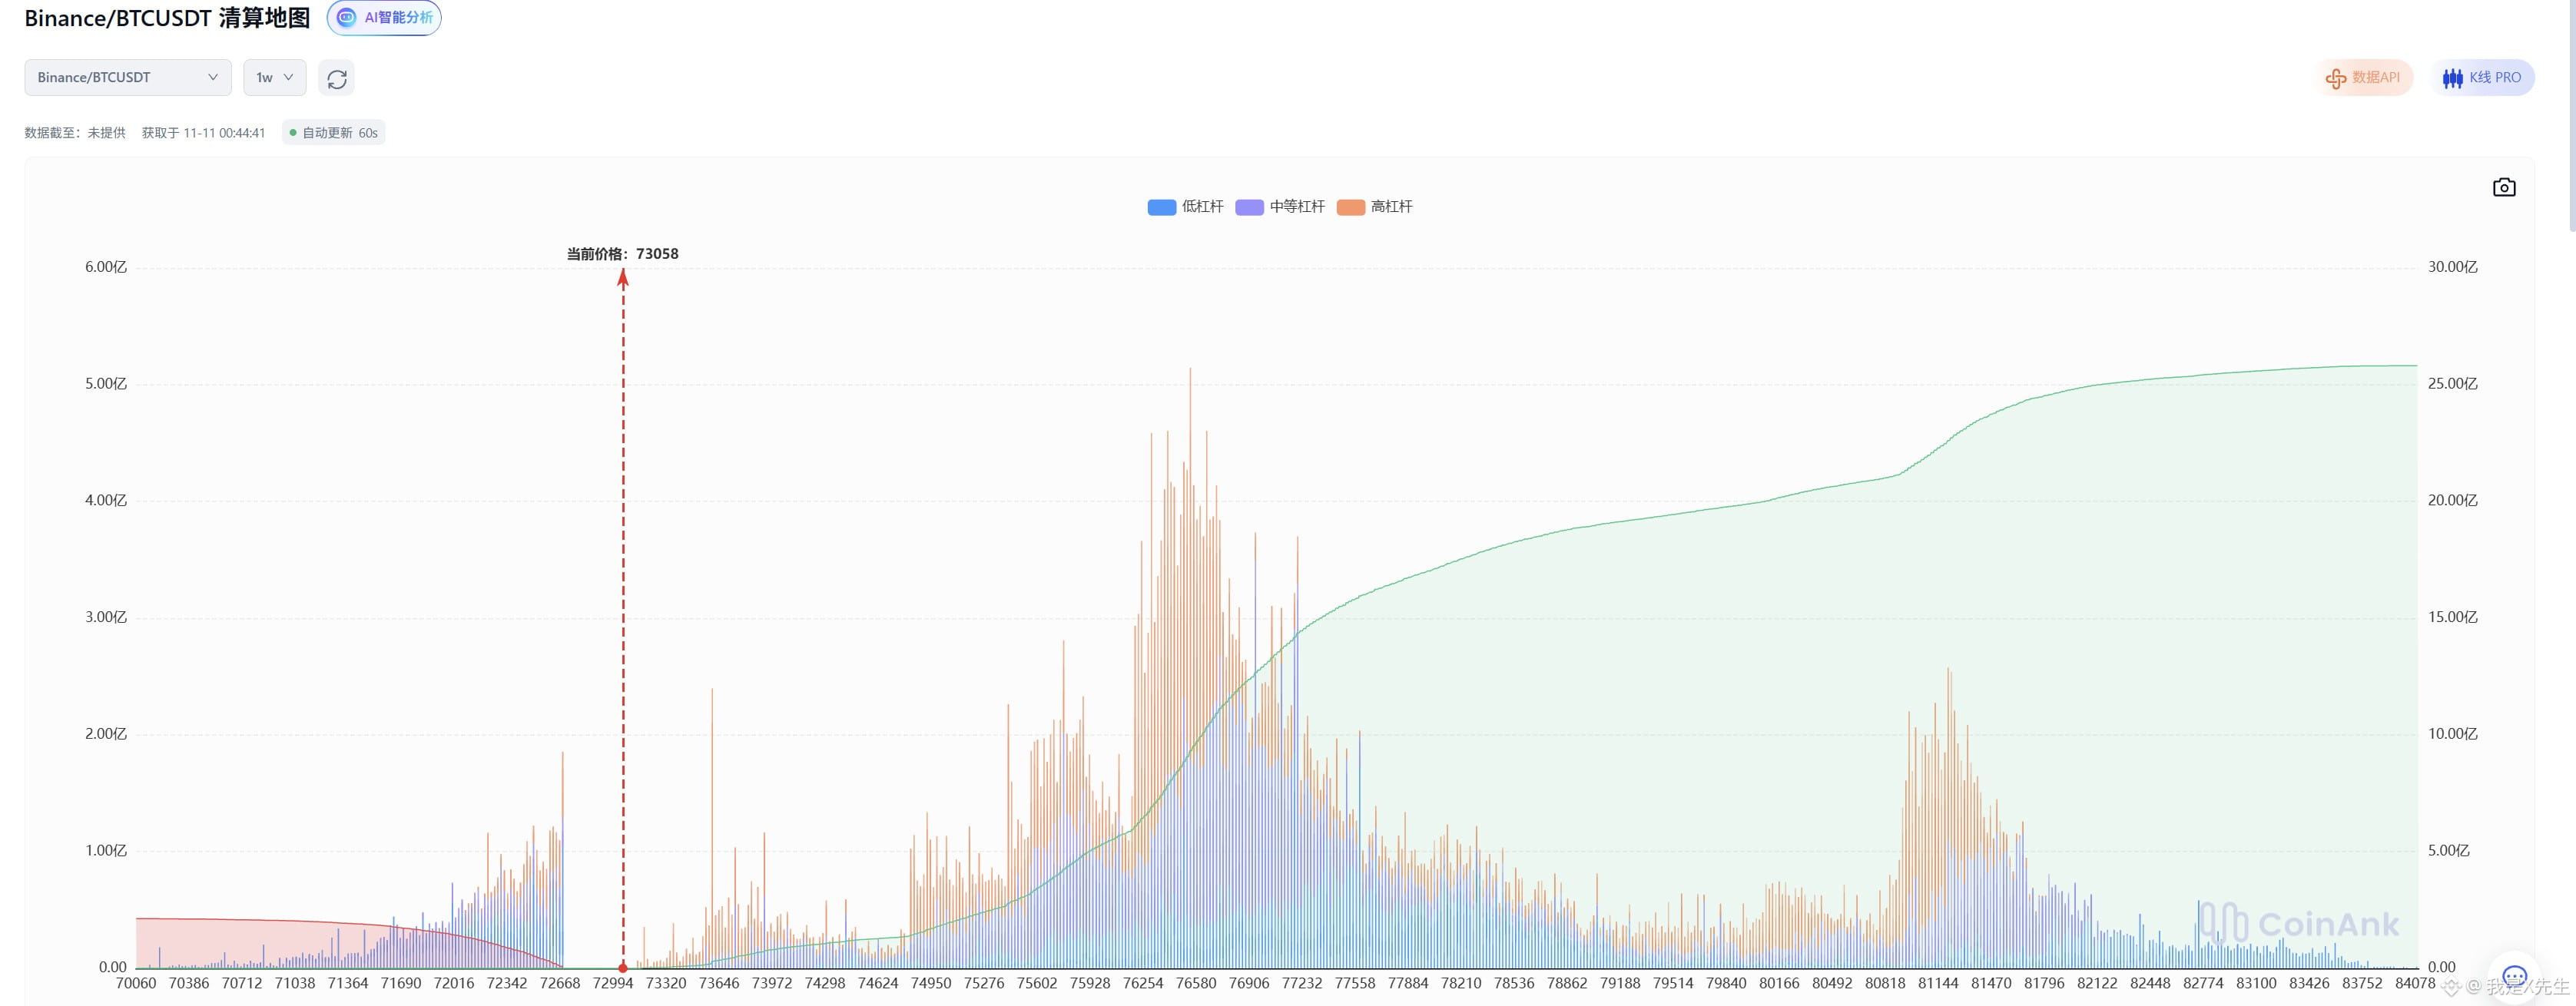
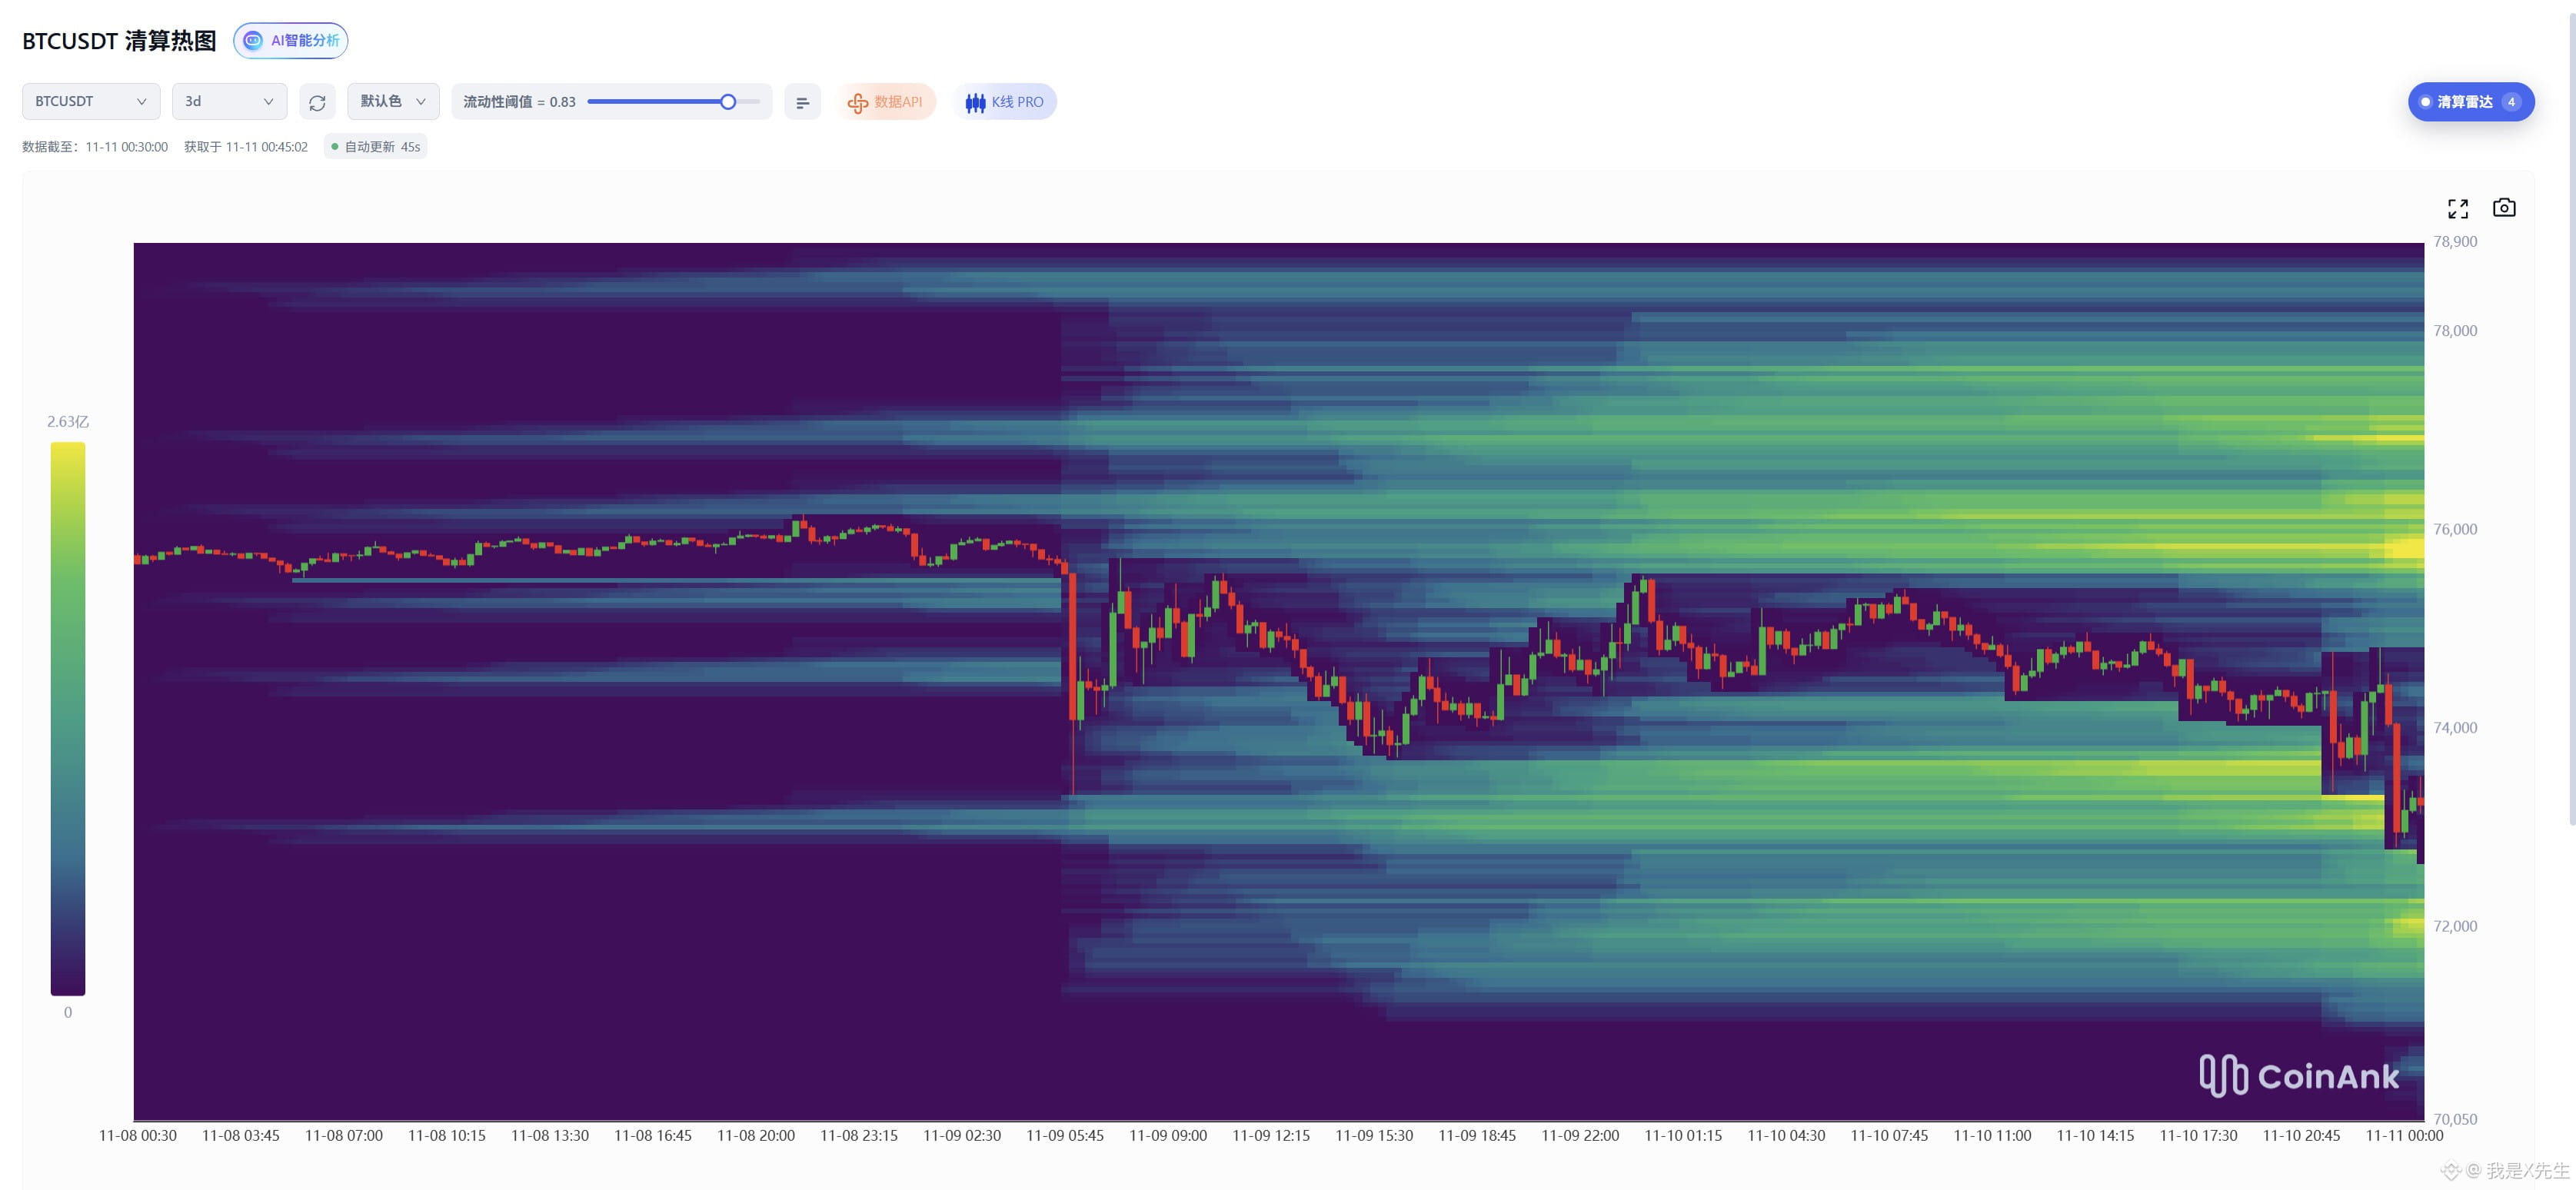
$BTC stuck in so deeply, and cleaned so thoroughly; by rights it should have rebounded, but there was no buying pressure, which is really frustrating. As expected, trading against the trend is not easy.
$BTC stuck in so deeply, and cleaned so thoroughly; by rights it should have rebounded, but there was no buying pressure, which is really frustrating. As expected, trading against the trend is not easy.
4
1
901
·
--
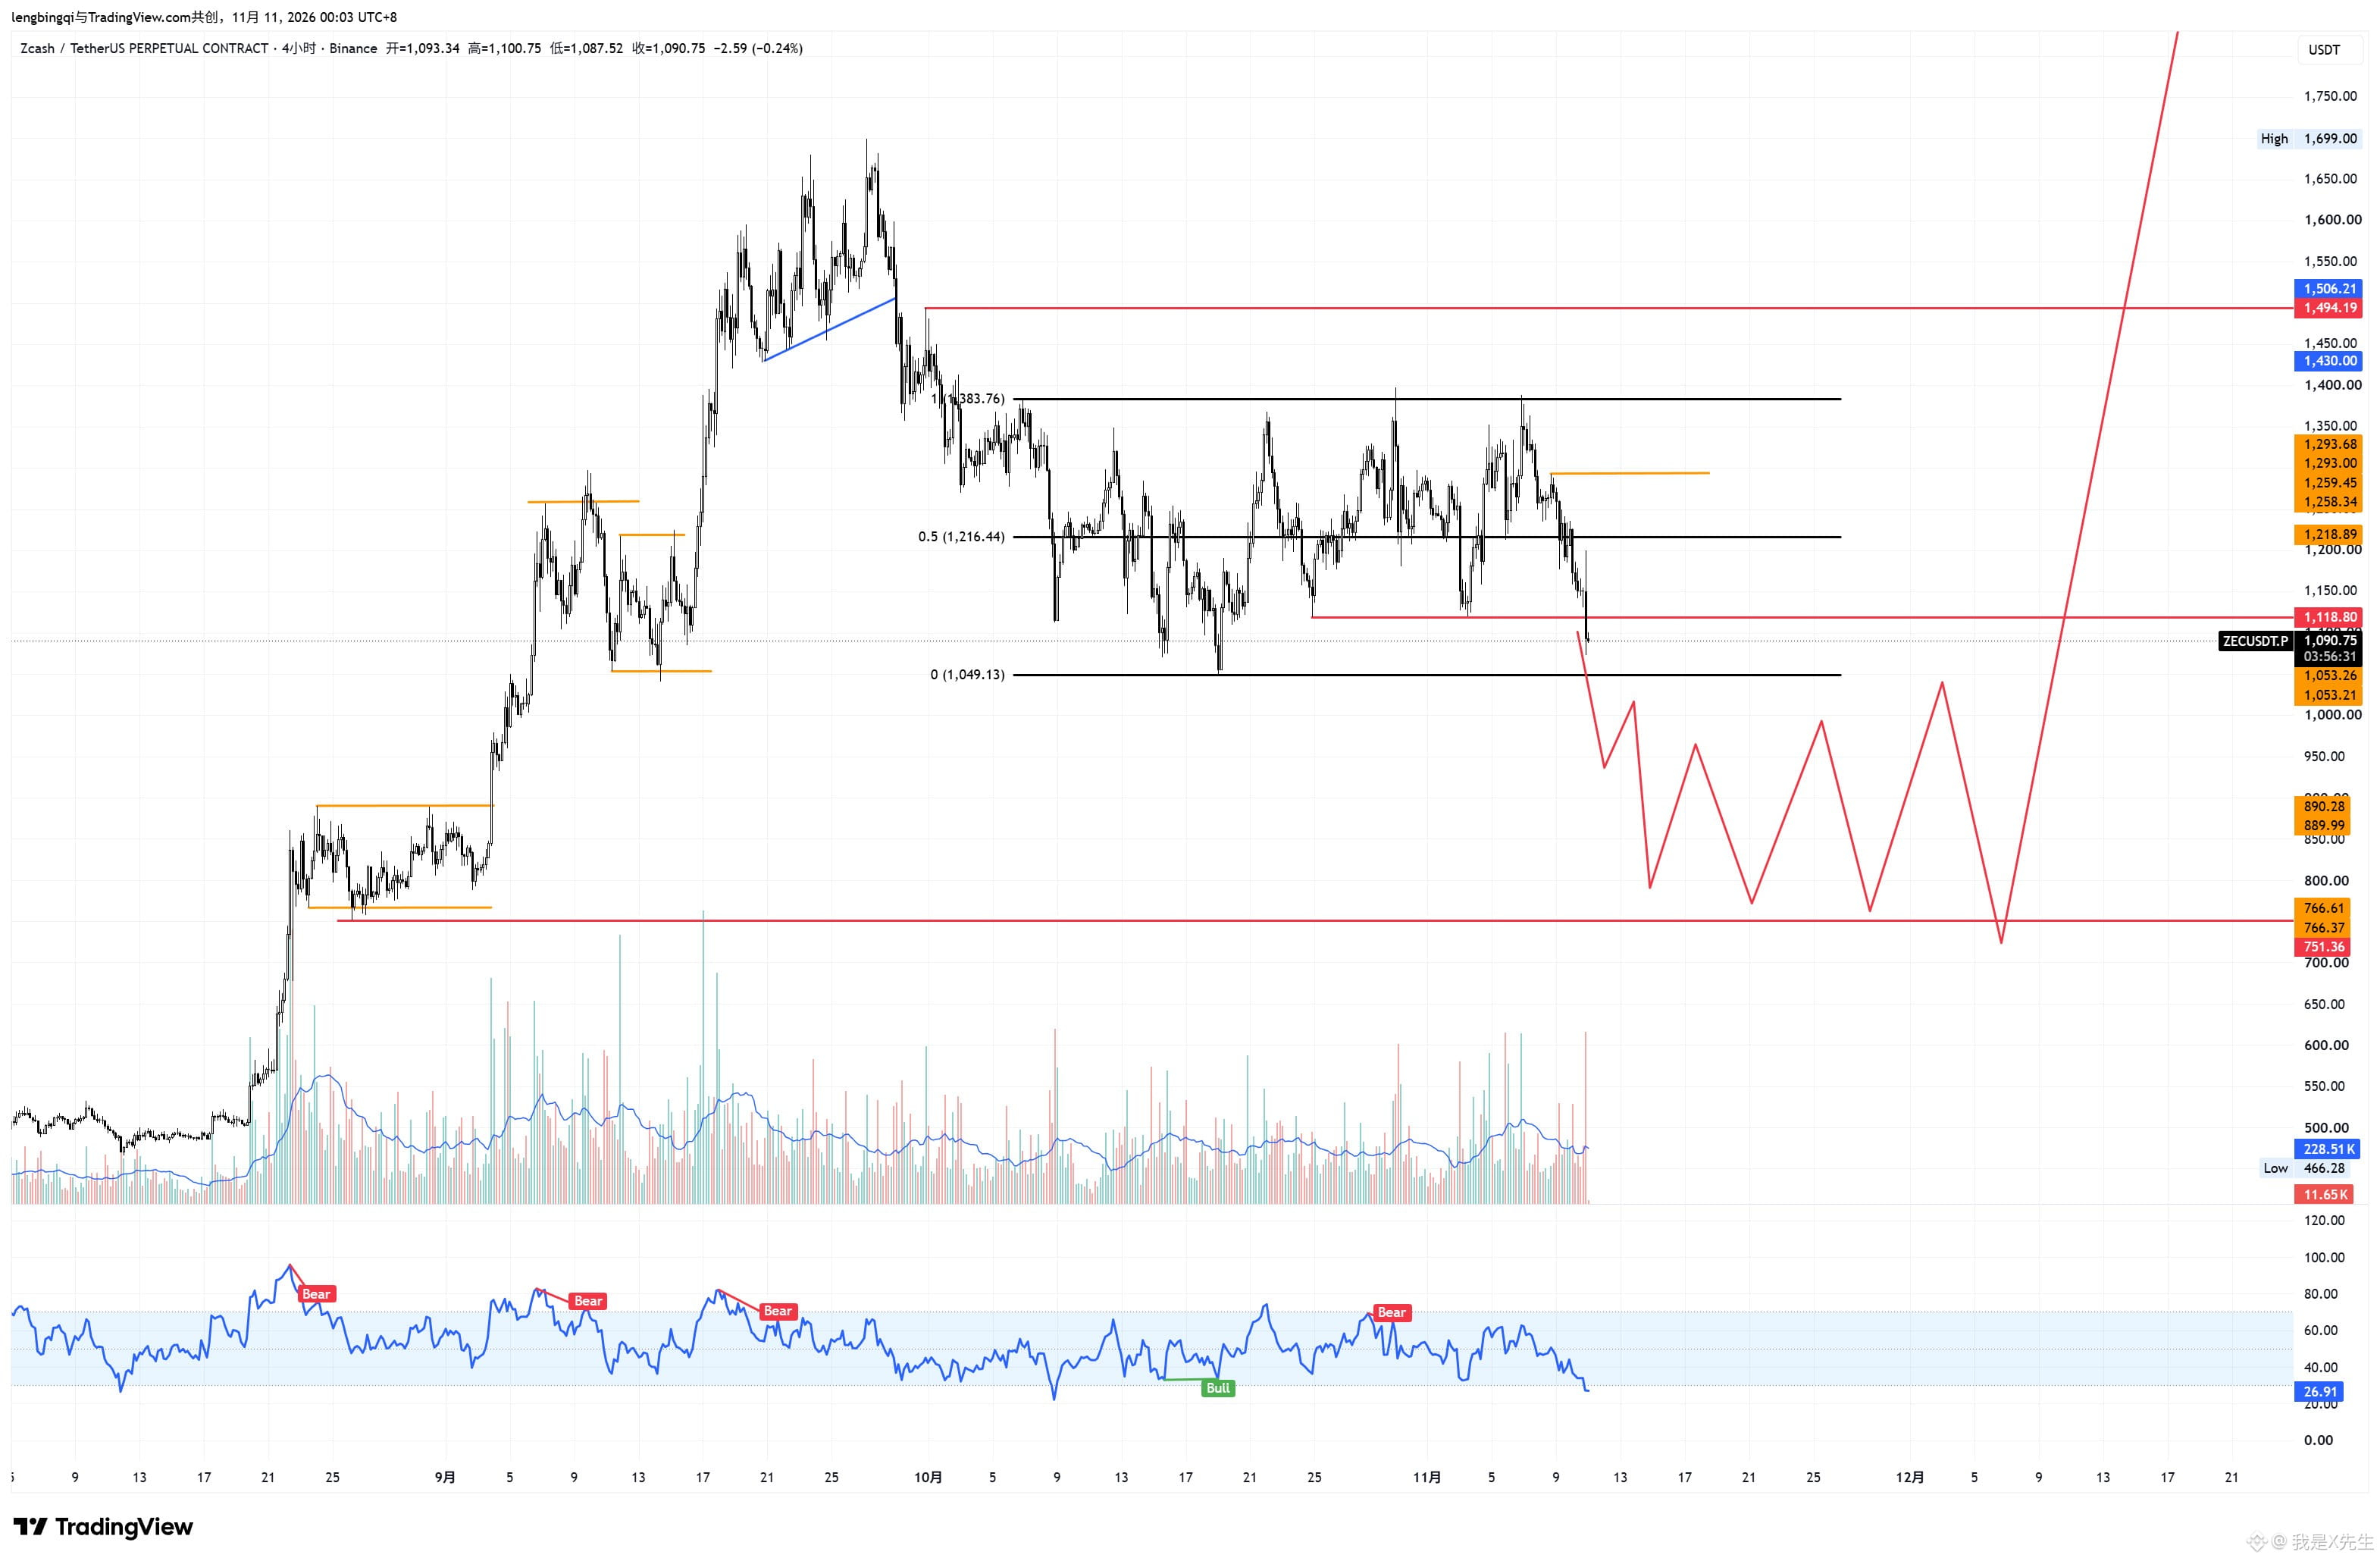
$ZEC breaks below the candle body; the bottom of the next range is around 751. This phase hasn’t played out smoothly, so let’s look to sell high and buy low in the next phase.
$ZEC breaks below the candle body; the bottom of the next range is around 751. This phase hasn’t played out smoothly, so let’s look to sell high and buy low in the next phase.
8
2
1.4k
·
--
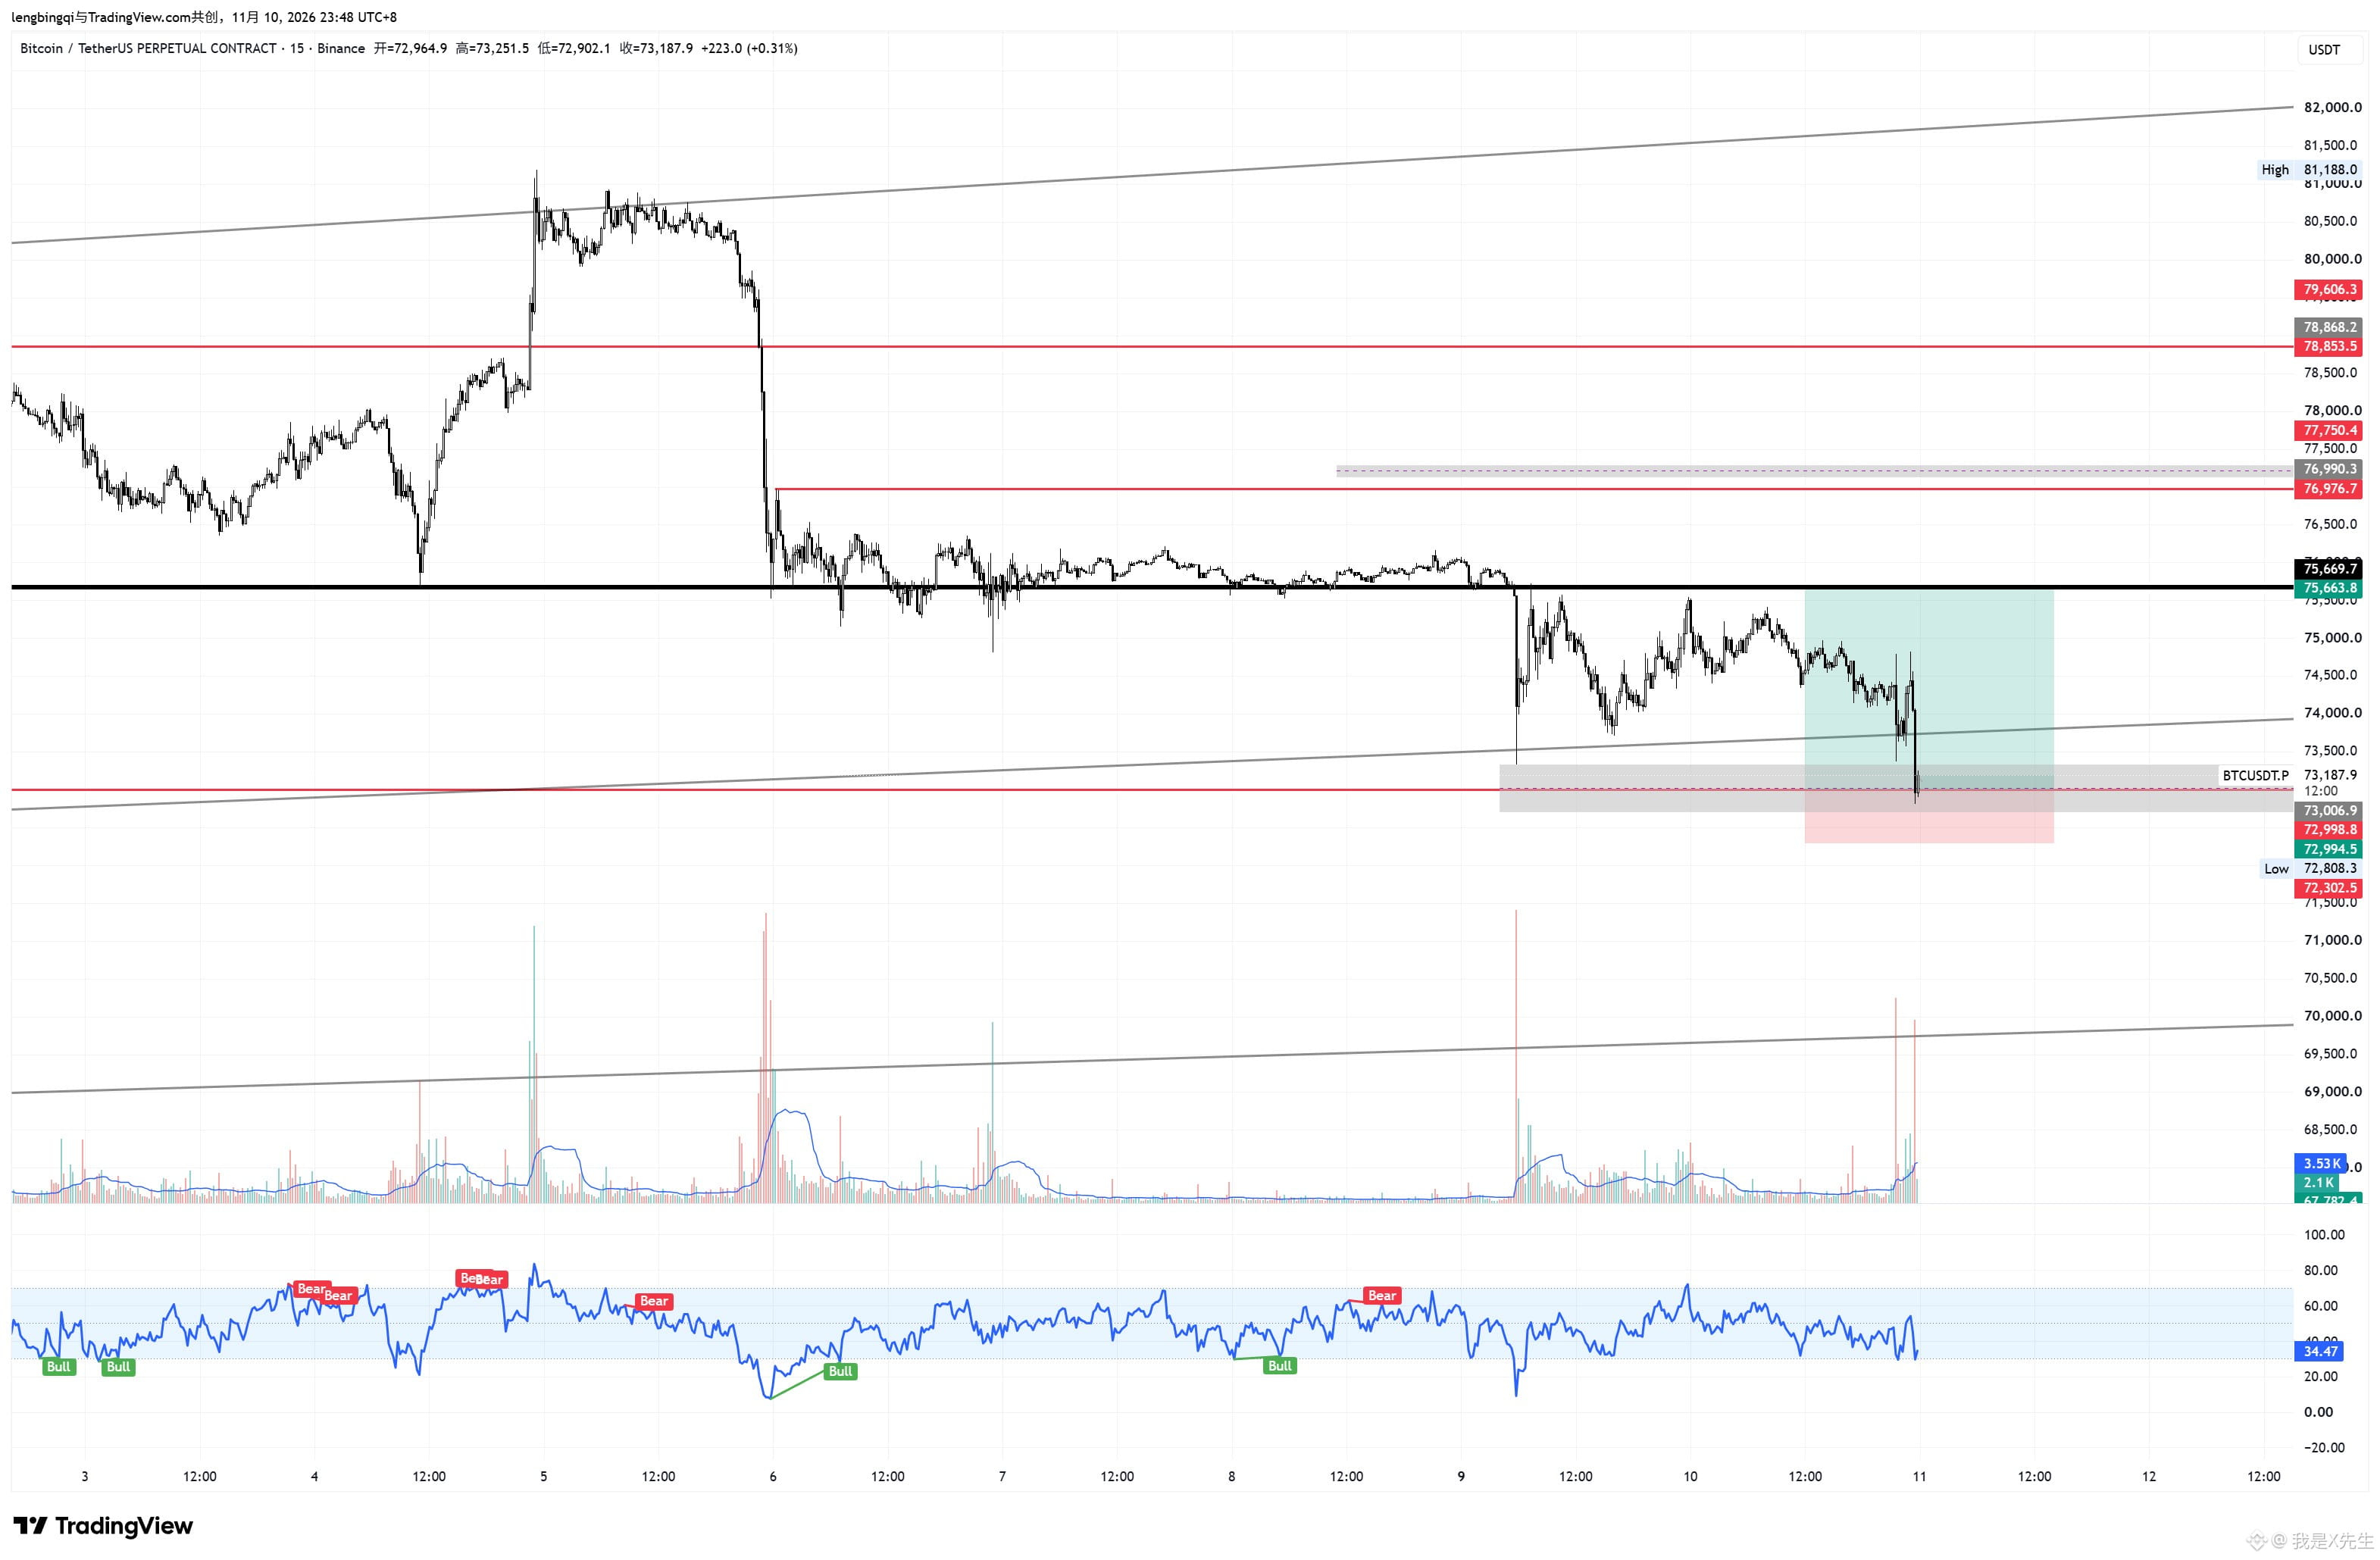
$BTC If it holds here, look at 755 above first. If it breaks through, 772 is the highest target—the liquidity is here. I squeezed in two trades during a break; let’s see how they go. I’ve been too busy lately to keep an eye on things.
$BTC If it holds here, look at 755 above first. If it breaks through, 772 is the highest target—the liquidity is here. I squeezed in two trades during a break; let’s see how they go. I’ve been too busy lately to keep an eye on things.
5
2
3k
·
--
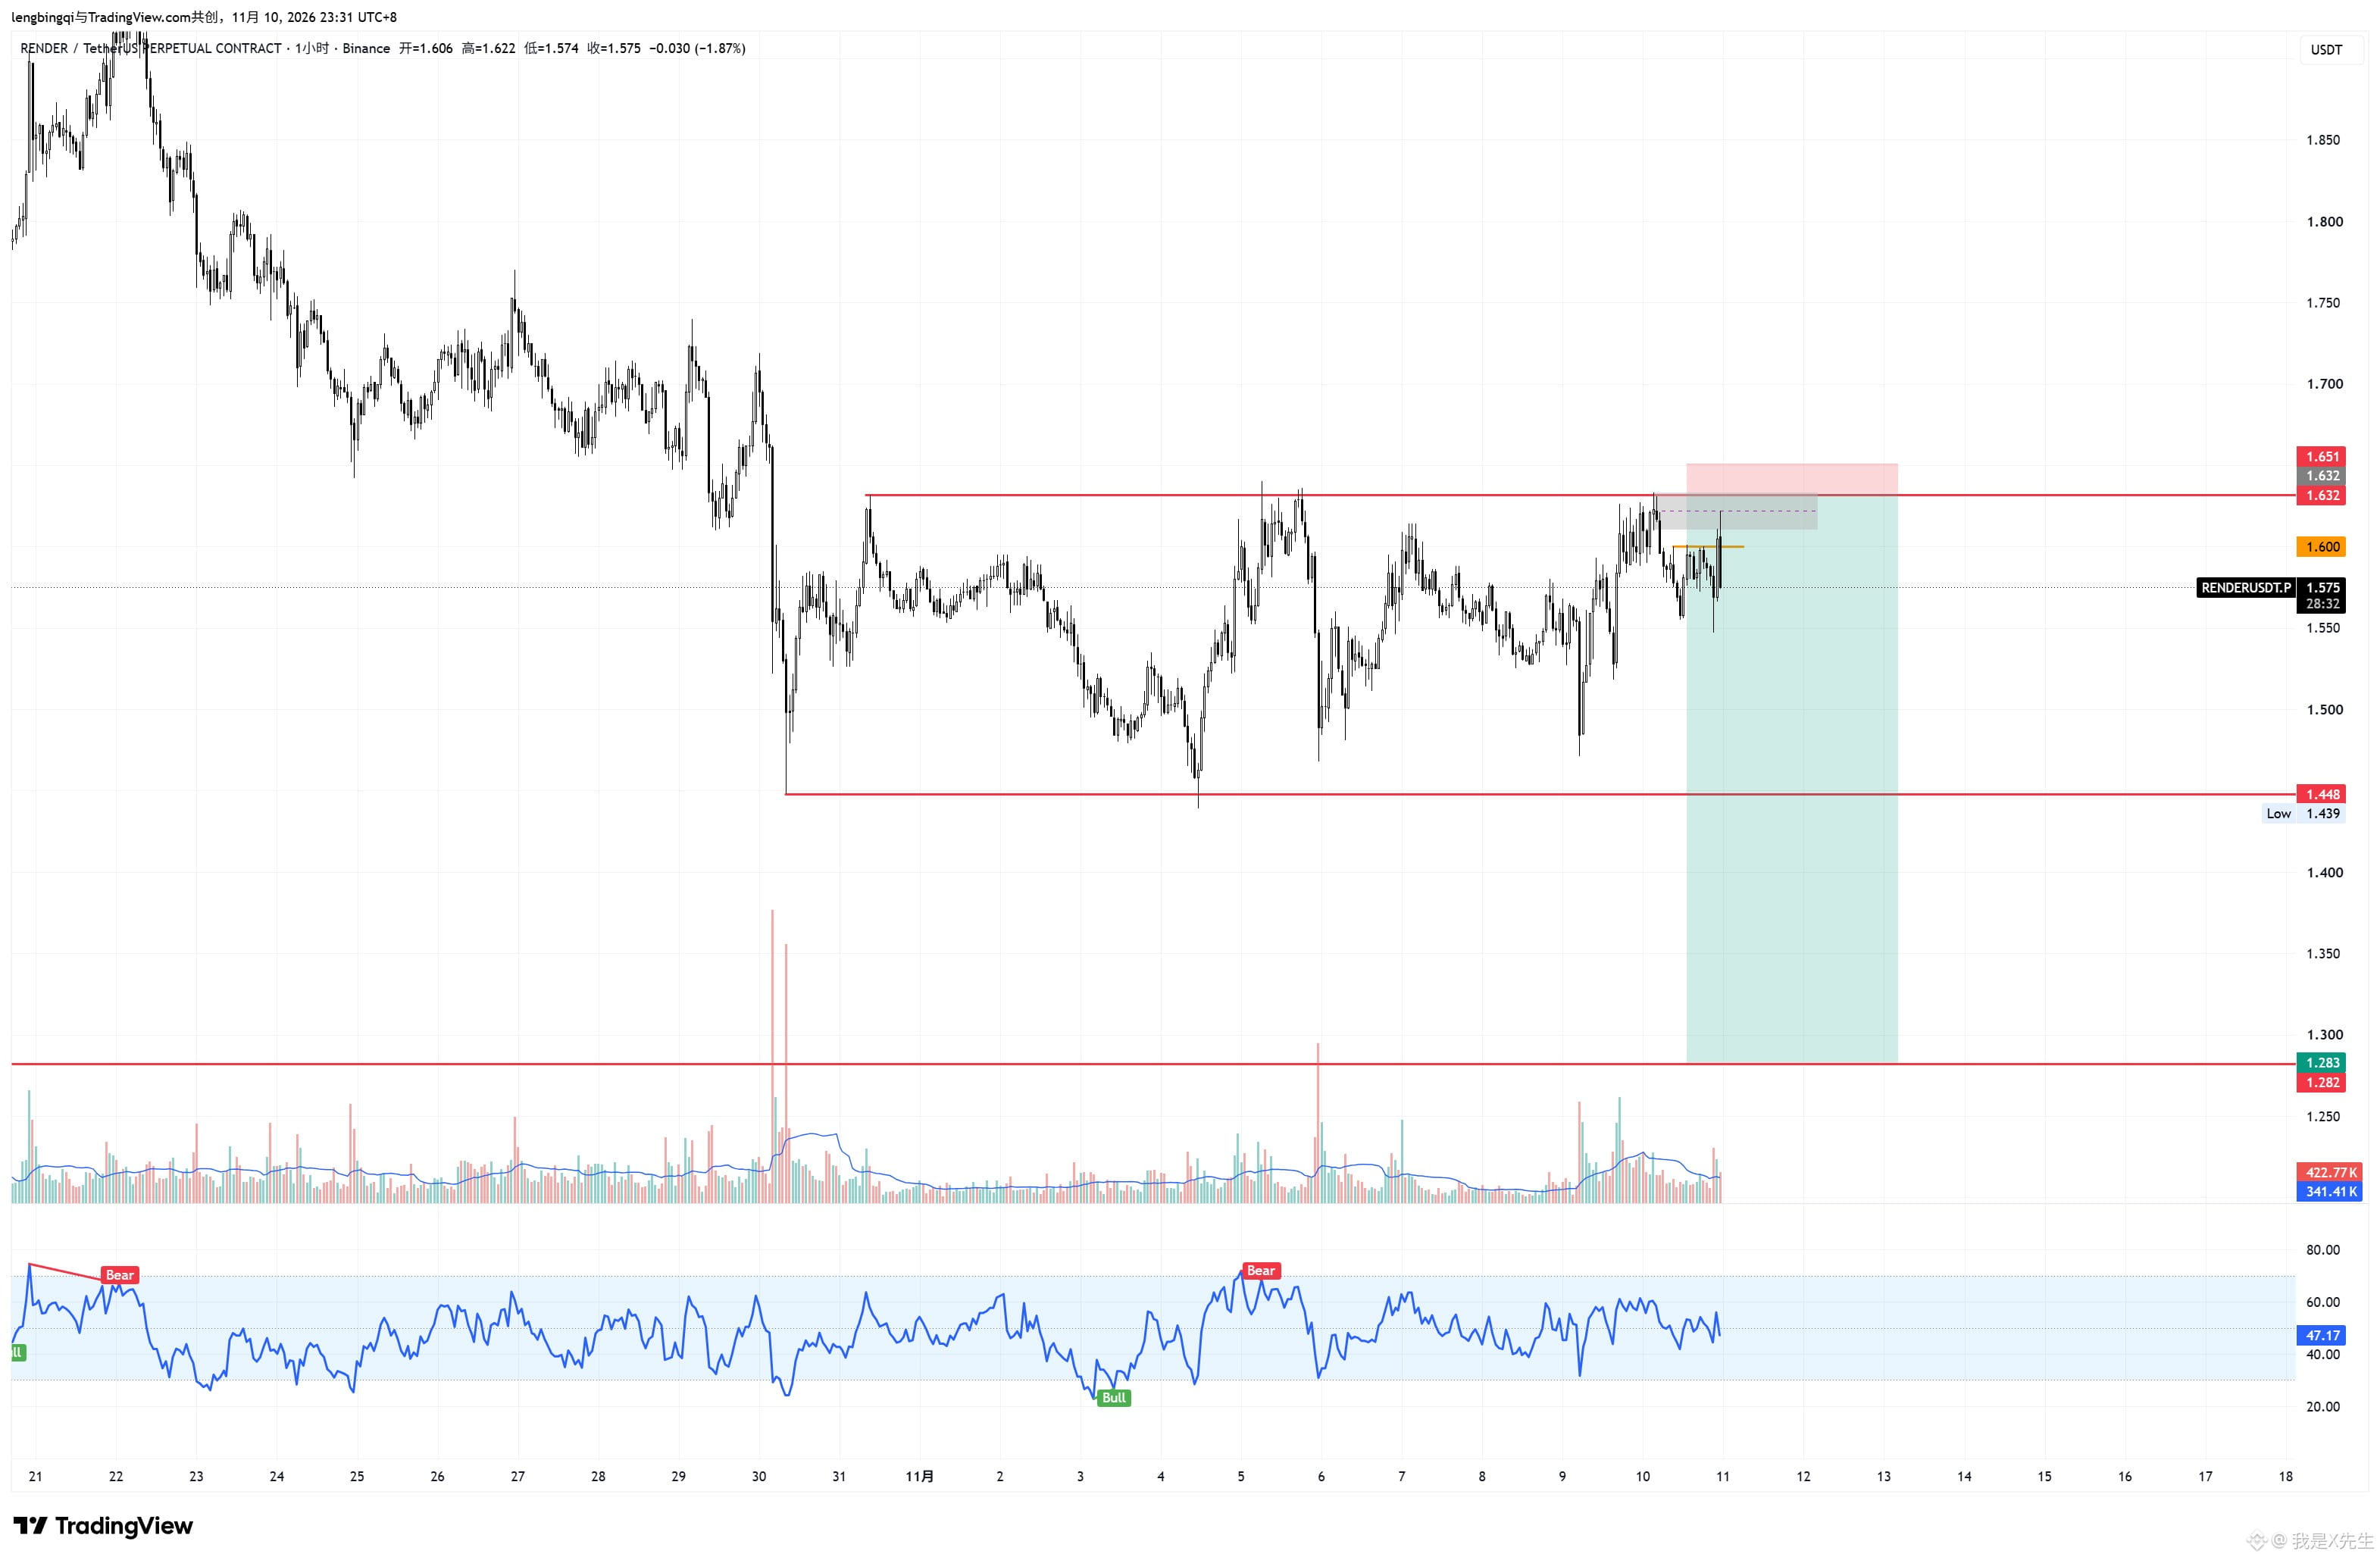
$RENDER I should’ve just done it myself. I overestimated you.
$RENDER I should’ve just done it myself. I overestimated you.
335
·
--
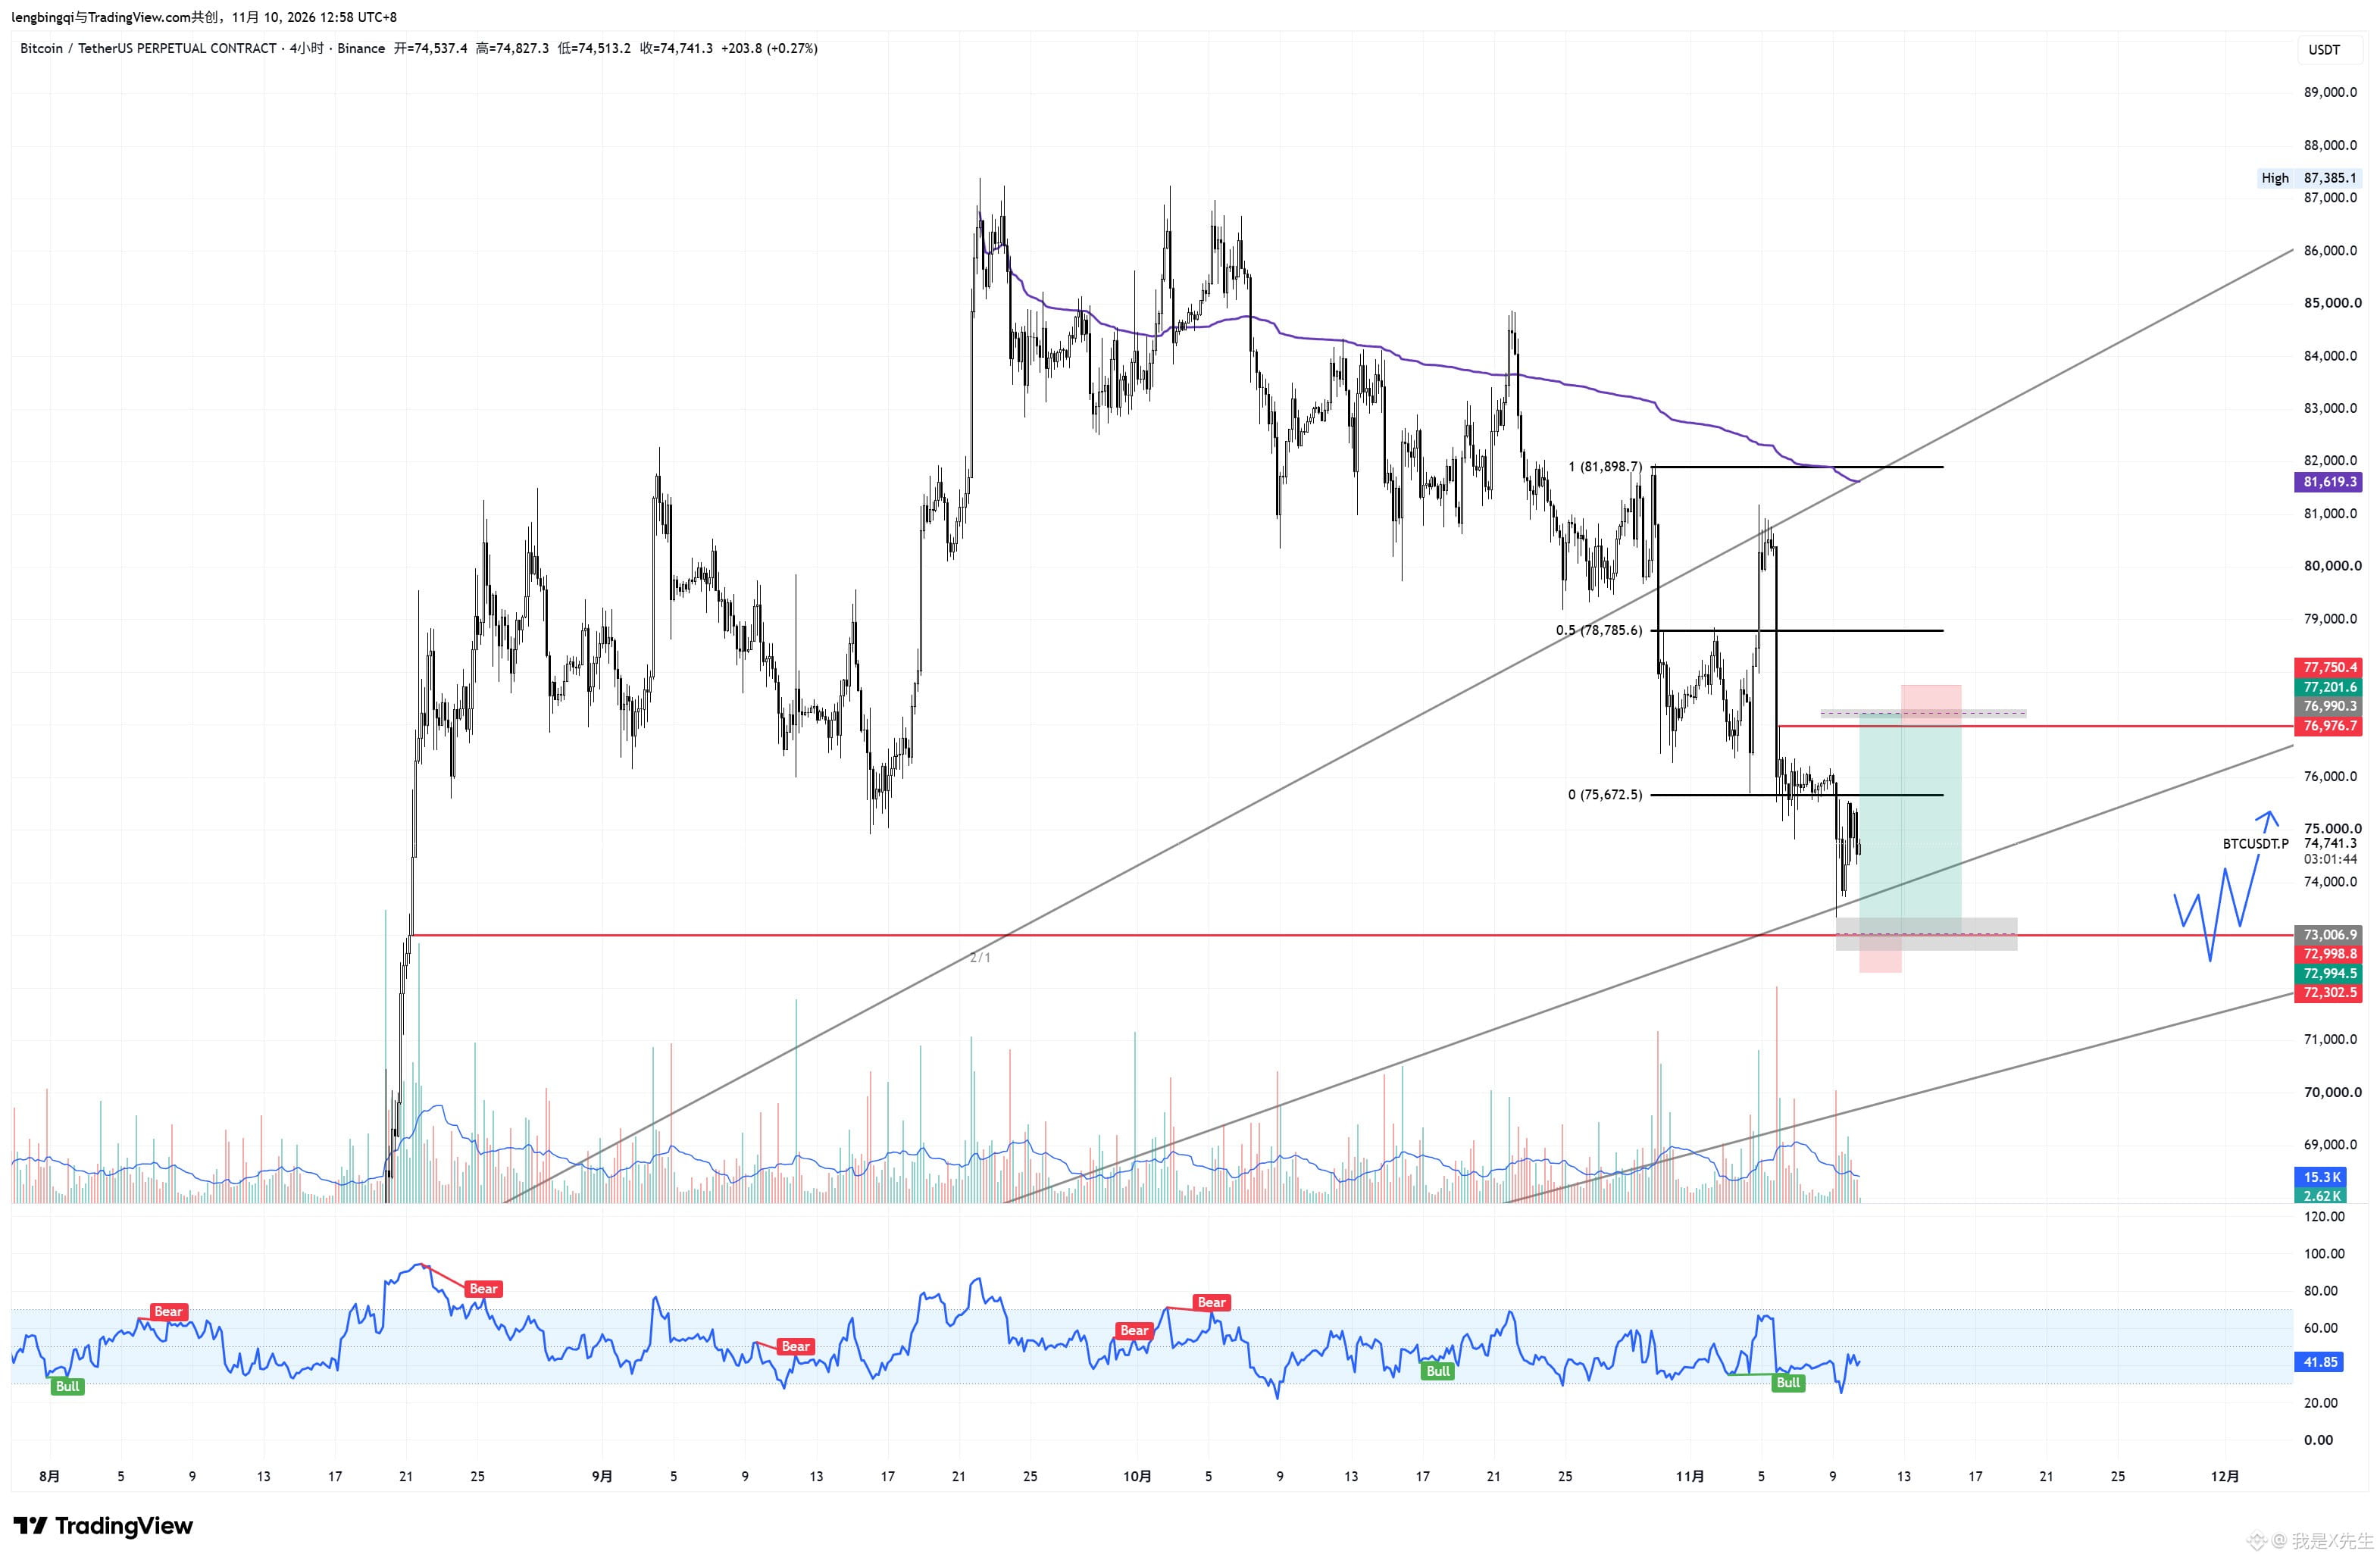
$BTC place both short and long orders, take a gamble
$BTC place both short and long orders, take a gamble
1
193
·
--
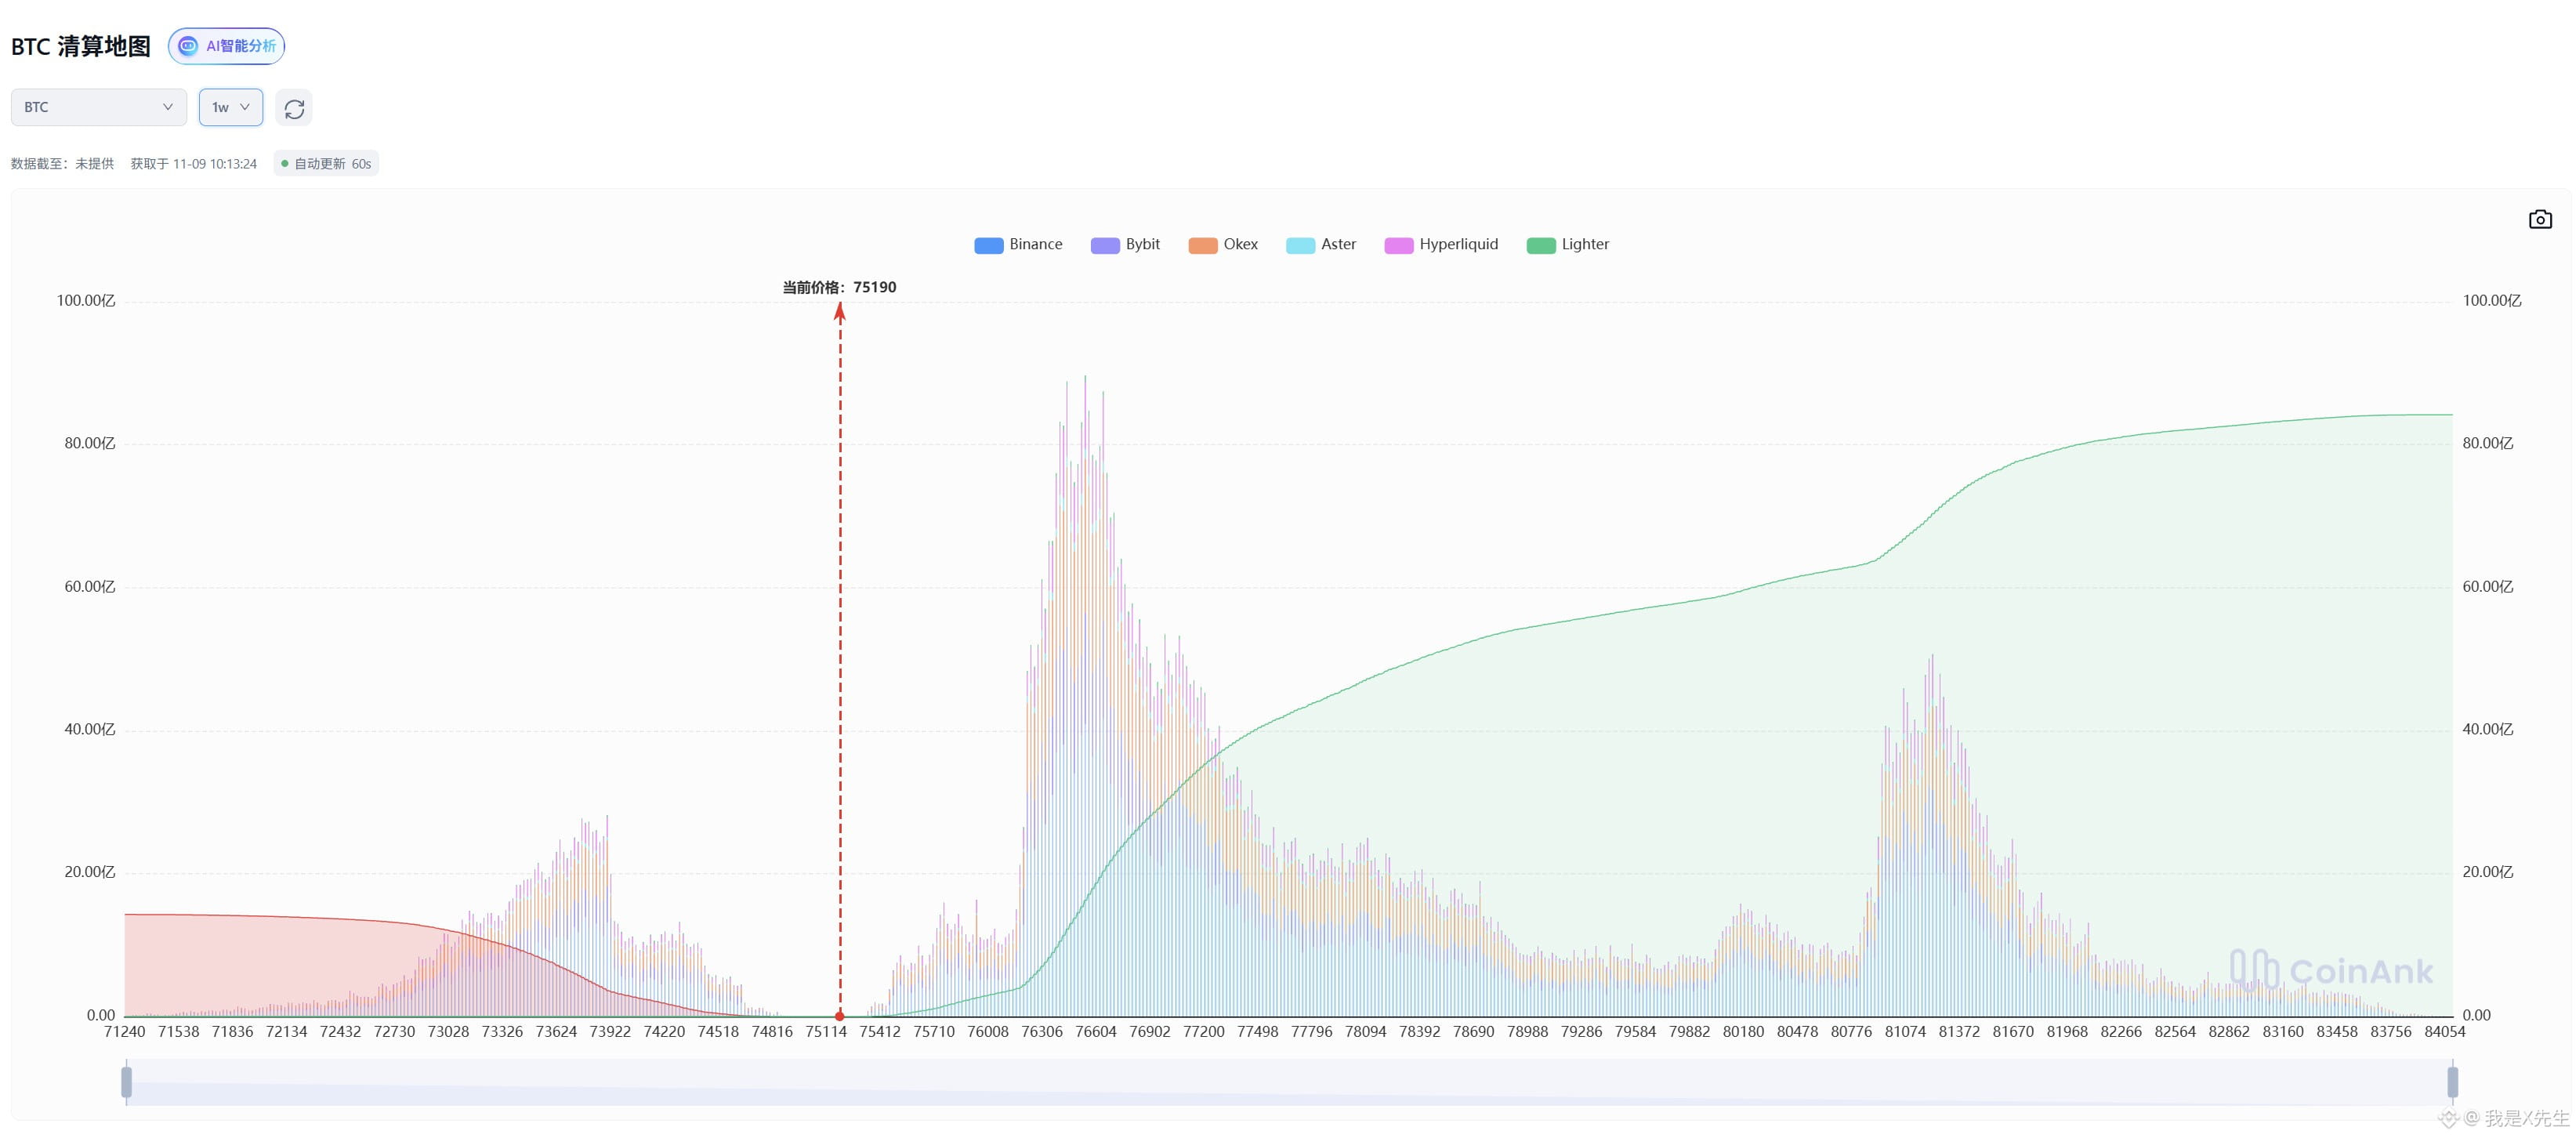
$BTC In the short term, it should trade within a range around 73–772. There’s a buy wall at 73, and so far it seems to be providing decent support. A lot of liquidity has built up at 772, so it’ll probably get swept.
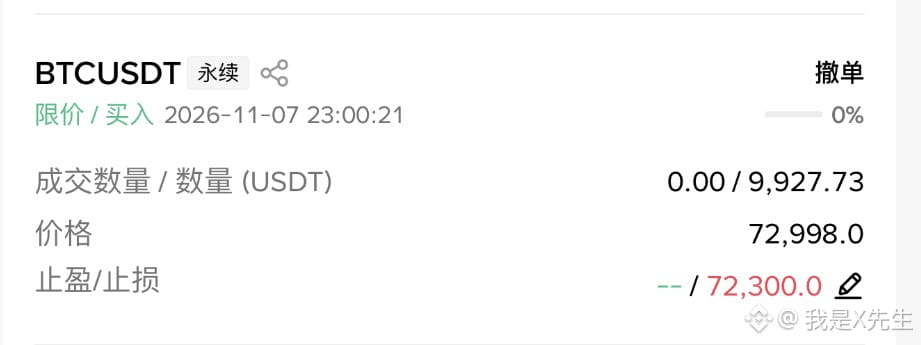
I placed two limit orders over the past few days. I canceled the one at 74 yesterday, and the one at 73 didn’t fill. Looks like I won’t catch the wick—I'll wait for a clear direction before doing anything.
$BTC In the short term, it should trade within a range around 73–772. There’s a buy wall at 73, and so far it seems to be providing decent support. A lot of liquidity has built up at 772, so it’ll probably get swept.
I placed two limit orders over the past few days. I canceled the one at 74 yesterday, and the one at 73 didn’t fill. Looks like I won’t catch the wick—I'll wait for a clear direction before doing anything.
I placed two limit orders over the past few days. I canceled the one at 74 yesterday, and the one at 73 didn’t fill. Looks like I won’t catch the wick—I'll wait for a clear direction before doing anything.
256
·
--
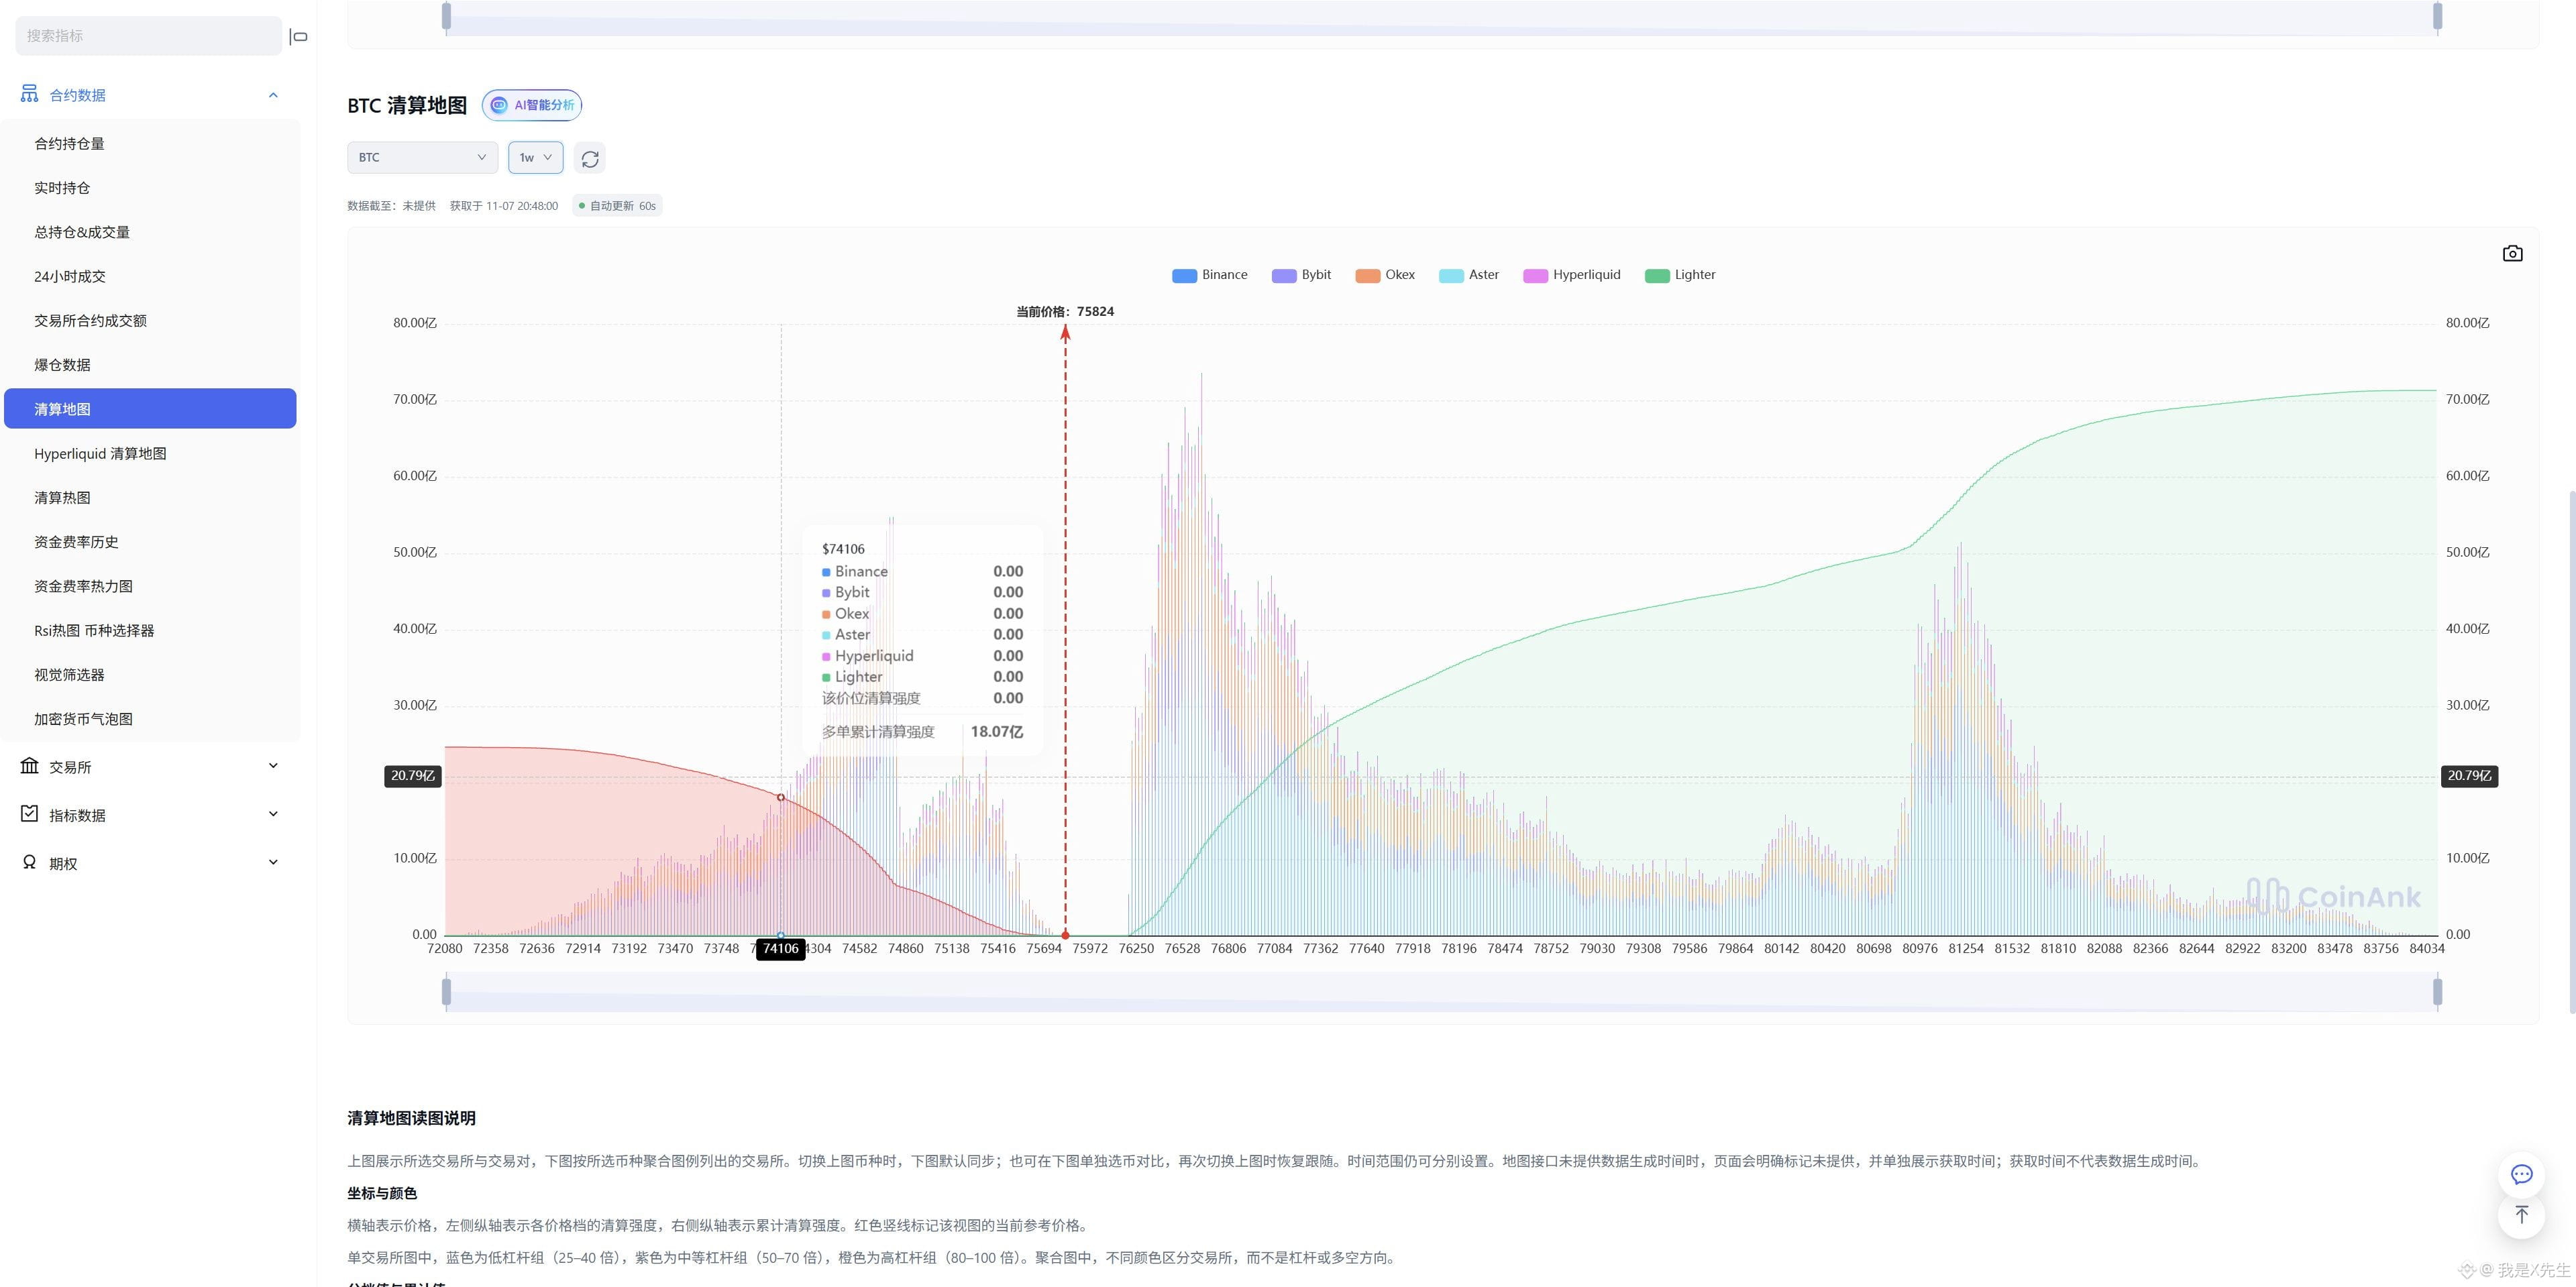
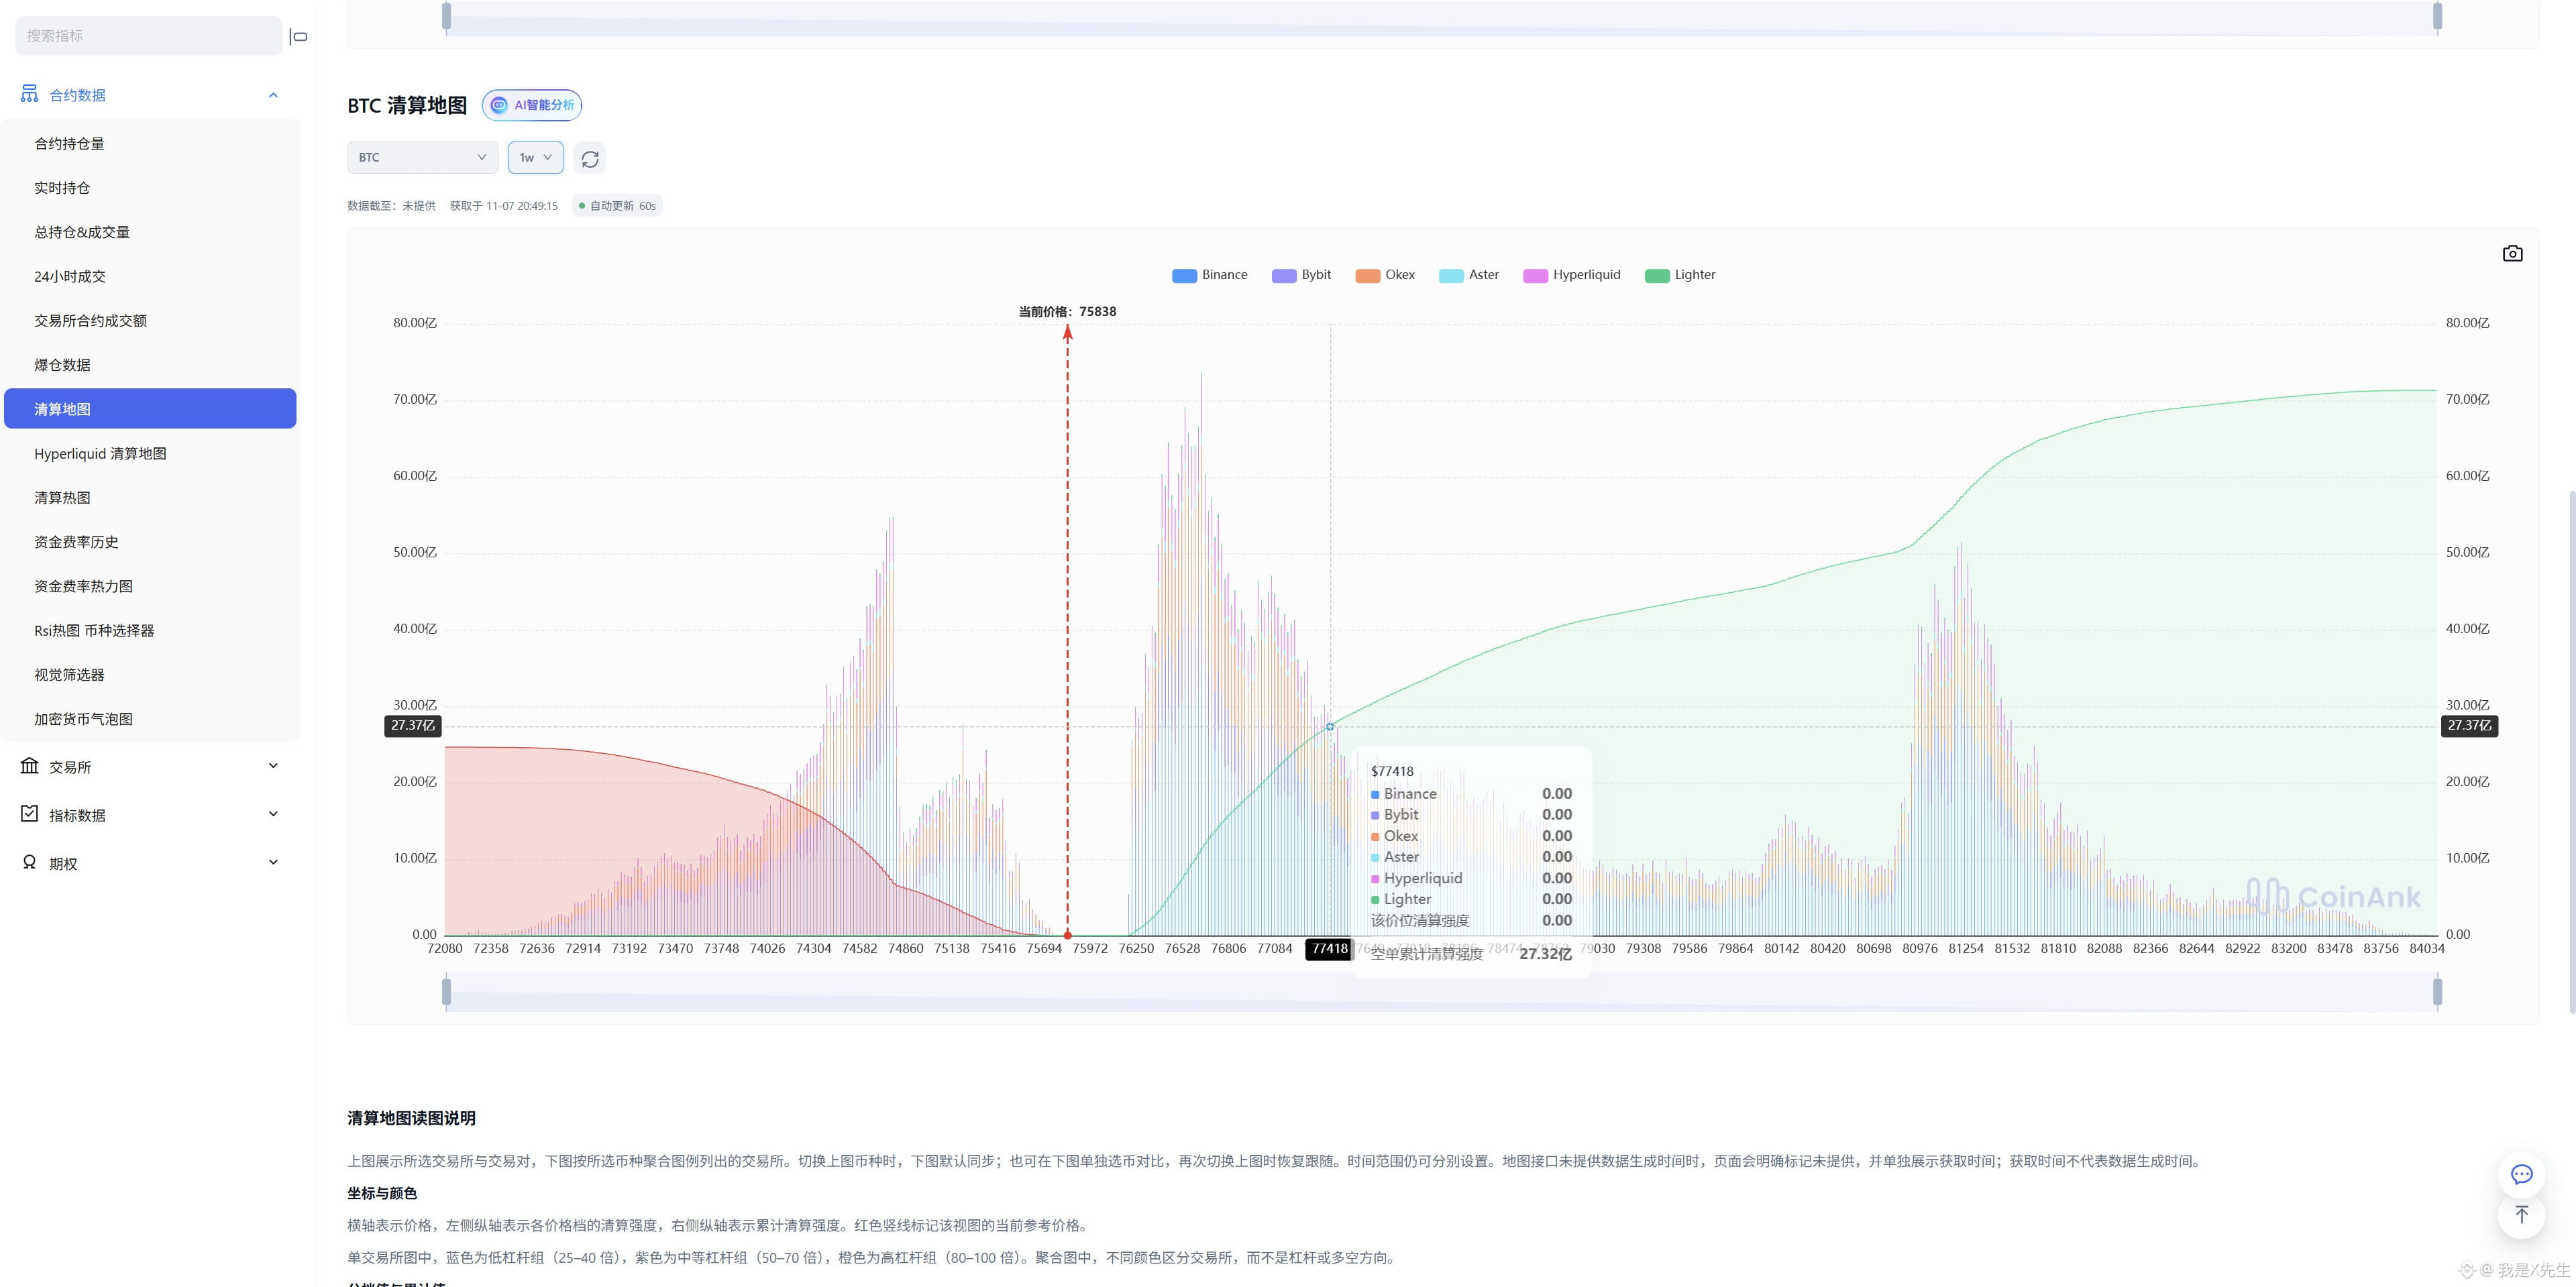
$BTC You can never catch every bottom; 1.7 billion below, 2.7 billion above.
$BTC You can never catch every bottom; 1.7 billion below, 2.7 billion above.
1.6k
·
--
Spot is accumulating and building liquidity. If you're going long, it's best to set your stop loss around 74.
Spot is accumulating and building liquidity. If you're going long, it's best to set your stop loss around 74.
我是X先生
·
--
$BTC Bitcoin's long wick was a liquidity grab, but there was no spot buying. ETH and SOL, on the other hand, have kept selling since bouncing. Tonight could bring a new low. ZEC, though, still isn't being sold despite reaching a major resistance level. If it comes down to the order-block area, selling remains light, and buying starts again, you could enter a long position and wait for a Bitcoin rebound that might break through.
4
1
349
·
--
$BTC Bitcoin's long wick was a liquidity grab, but there was no spot buying. ETH and SOL, on the other hand, have kept selling since bouncing. Tonight could bring a new low. ZEC, though, still isn't being sold despite reaching a major resistance level. If it comes down to the order-block area, selling remains light, and buying starts again, you could enter a long position and wait for a Bitcoin rebound that might break through.
$BTC Bitcoin's long wick was a liquidity grab, but there was no spot buying. ETH and SOL, on the other hand, have kept selling since bouncing. Tonight could bring a new low. ZEC, though, still isn't being sold despite reaching a major resistance level. If it comes down to the order-block area, selling remains light, and buying starts again, you could enter a long position and wait for a Bitcoin rebound that might break through.
3
1
2
1.4k
Log in to explore more content
Join global crypto users on Binance Square
⚡️ Get latest and useful information about crypto.
💬 Trusted by the world’s largest crypto exchange.
👍 Discover real insights from verified creators.
Email / Phone number
Trending Topics
HotCPIDecemberHikePriced
325,844 views
3,230 Discussing
CPI Market Watch | US CPI Rises 0.4% in October, Hotter Than 0.3% Forecast
Binance News
·34 Likes
·48.7k views
ZcashFallsBelow$1000ForFirstTimeSinceSeptember
9,595 views
59 Discussing
StrategyFaces$2.8BSelloffRiskFromMSCIRemoval
20,584 views
139 Discussing