
Squad Crypto Master
49 Posts
Squad Crypto Master
Report
Block User
Crypto News | Market Updates | Trading Insights Daily updates from the world of Binance & blockchain.Stay informed.Trade smart.🚀
0 Following
10 Followers
47 Liked
Posts
All
Videos
📊 BITCOIN KEY LEVELS: BREAKOUT OR BREAKDOWN?
Bitcoin is approaching an important technical zone!
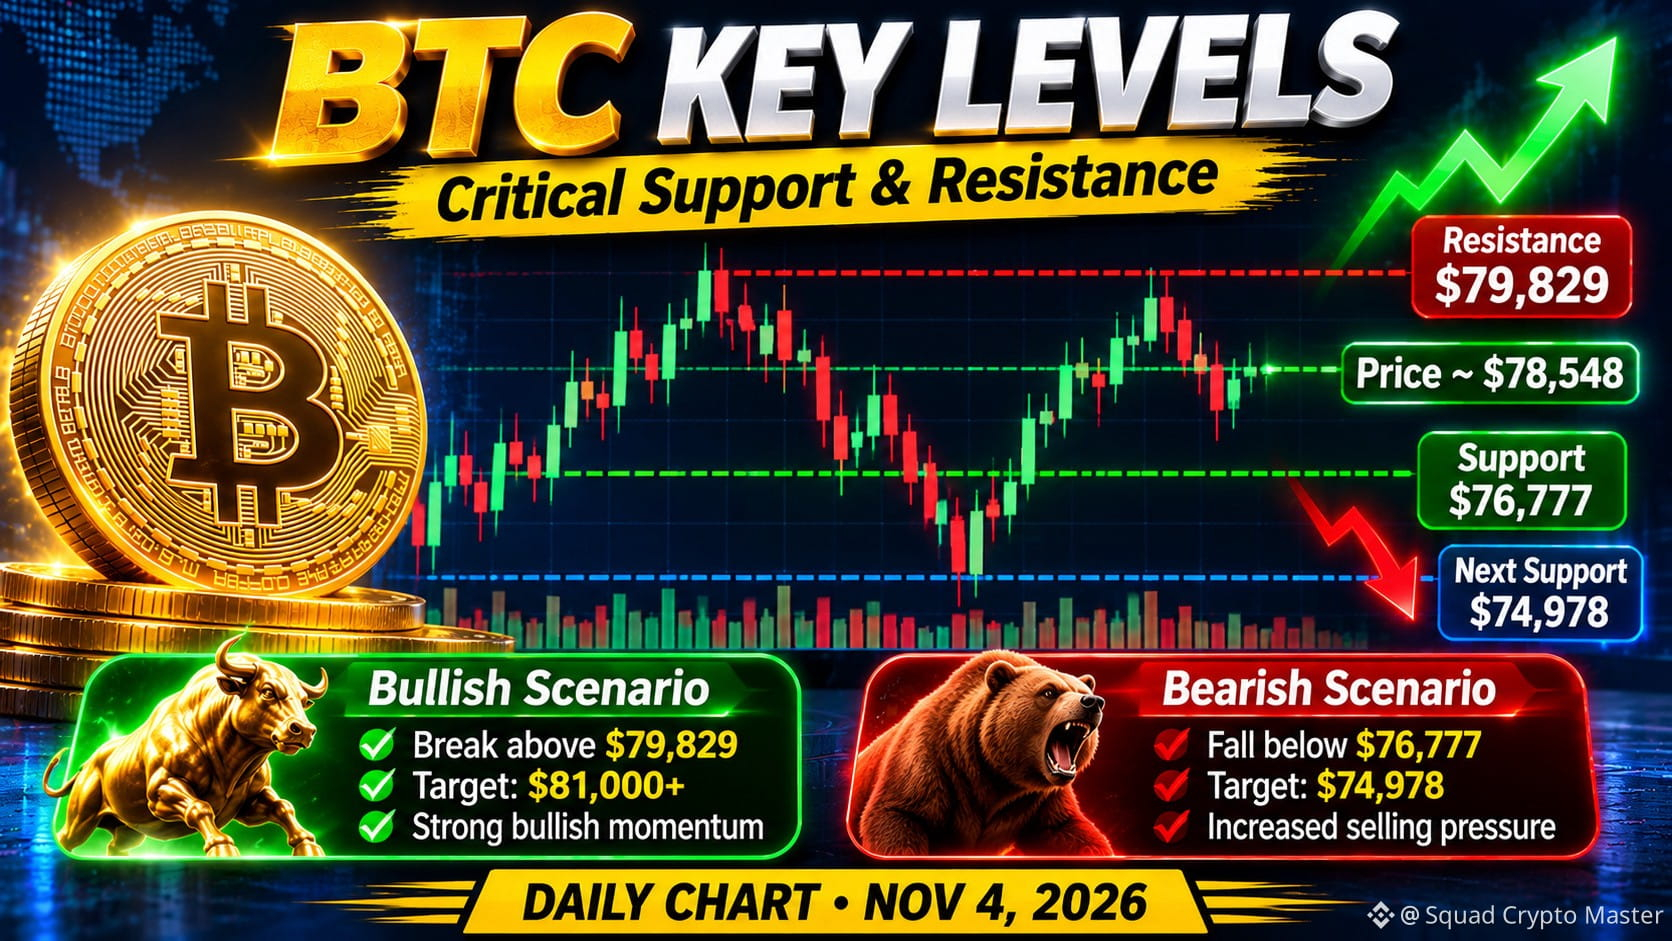
Traders are watching two critical levels: $79,829 resistance and $76,777 support.
🔥 $BTC MARKET ANALYSIS
Reference Price: $78,548
🔴 Resistance Levels:
R1: $79,829
R2: $81,802
R3: $84,665
🟢 Support Levels:
S1: $76,777
S2: $74,978
S3: $72,115
🐂 BULLISH SCENARIO
If BTC breaks above $79,829 and confirms with a strong daily candle close, the next resistance to watch is $81,802.
🐻 BEARISH SCENARIO
If BTC loses $76,777 with strong selling pressure, the next support zone could be around $74,978.
🎯 MY TRADING WATCHLIST
Monitor BTC trading volume.
Watch the $79,829 resistance.
Check whether $76,777 support holds.
Wait for candle-close confirmation.
⚠️ Don't chase breakouts without confirmation. Fakeouts can happen in volatile markets.
💬 YOUR OPINION MATTERS!
Which direction will Bitcoin move next?
🟢 BREAKOUT ABOVE $80K
🔴 DROP TOWARD $75K
Disclaimer: Educational content only. Not financial advice. Levels are reference zones, not guaranteed price targets.
Share your prediction below! 👇
#Bitcoin #BTC #BTCUSDT #CryptoAnalysis #CryptoMarket
📊 BITCOIN KEY LEVELS: BREAKOUT OR BREAKDOWN?
Bitcoin is approaching an important technical zone!
Traders are watching two critical levels: $79,829 resistance and $76,777 support.
🔥 $BTC MARKET ANALYSIS
Reference Price: $78,548
🔴 Resistance Levels:
R1: $79,829
R2: $81,802
R3: $84,665
🟢 Support Levels:
S1: $76,777
S2: $74,978
S3: $72,115
🐂 BULLISH SCENARIO
If BTC breaks above $79,829 and confirms with a strong daily candle close, the next resistance to watch is $81,802.
🐻 BEARISH SCENARIO
If BTC loses $76,777 with strong selling pressure, the next support zone could be around $74,978.
🎯 MY TRADING WATCHLIST
Monitor BTC trading volume.
Watch the $79,829 resistance.
Check whether $76,777 support holds.
Wait for candle-close confirmation.
⚠️ Don't chase breakouts without confirmation. Fakeouts can happen in volatile markets.
💬 YOUR OPINION MATTERS!
Which direction will Bitcoin move next?
🟢 BREAKOUT ABOVE $80K
🔴 DROP TOWARD $75K
Disclaimer: Educational content only. Not financial advice. Levels are reference zones, not guaranteed price targets.
Share your prediction below! 👇
#Bitcoin #BTC #BTCUSDT #CryptoAnalysis #CryptoMarket
Bitcoin is approaching an important technical zone!
Traders are watching two critical levels: $79,829 resistance and $76,777 support.
🔥 $BTC MARKET ANALYSIS
Reference Price: $78,548
🔴 Resistance Levels:
R1: $79,829
R2: $81,802
R3: $84,665
🟢 Support Levels:
S1: $76,777
S2: $74,978
S3: $72,115
🐂 BULLISH SCENARIO
If BTC breaks above $79,829 and confirms with a strong daily candle close, the next resistance to watch is $81,802.
🐻 BEARISH SCENARIO
If BTC loses $76,777 with strong selling pressure, the next support zone could be around $74,978.
🎯 MY TRADING WATCHLIST
Monitor BTC trading volume.
Watch the $79,829 resistance.
Check whether $76,777 support holds.
Wait for candle-close confirmation.
⚠️ Don't chase breakouts without confirmation. Fakeouts can happen in volatile markets.
💬 YOUR OPINION MATTERS!
Which direction will Bitcoin move next?
🟢 BREAKOUT ABOVE $80K
🔴 DROP TOWARD $75K
Disclaimer: Educational content only. Not financial advice. Levels are reference zones, not guaranteed price targets.
Share your prediction below! 👇
#Bitcoin #BTC #BTCUSDT #CryptoAnalysis #CryptoMarket
25
🚀 ALTSEASON 2026: IS THE BIG ALTCOIN RALLY COMING?
Crypto traders are watching the altcoin market closely!
But are we really entering Altseason?
📊 Current Market Signals
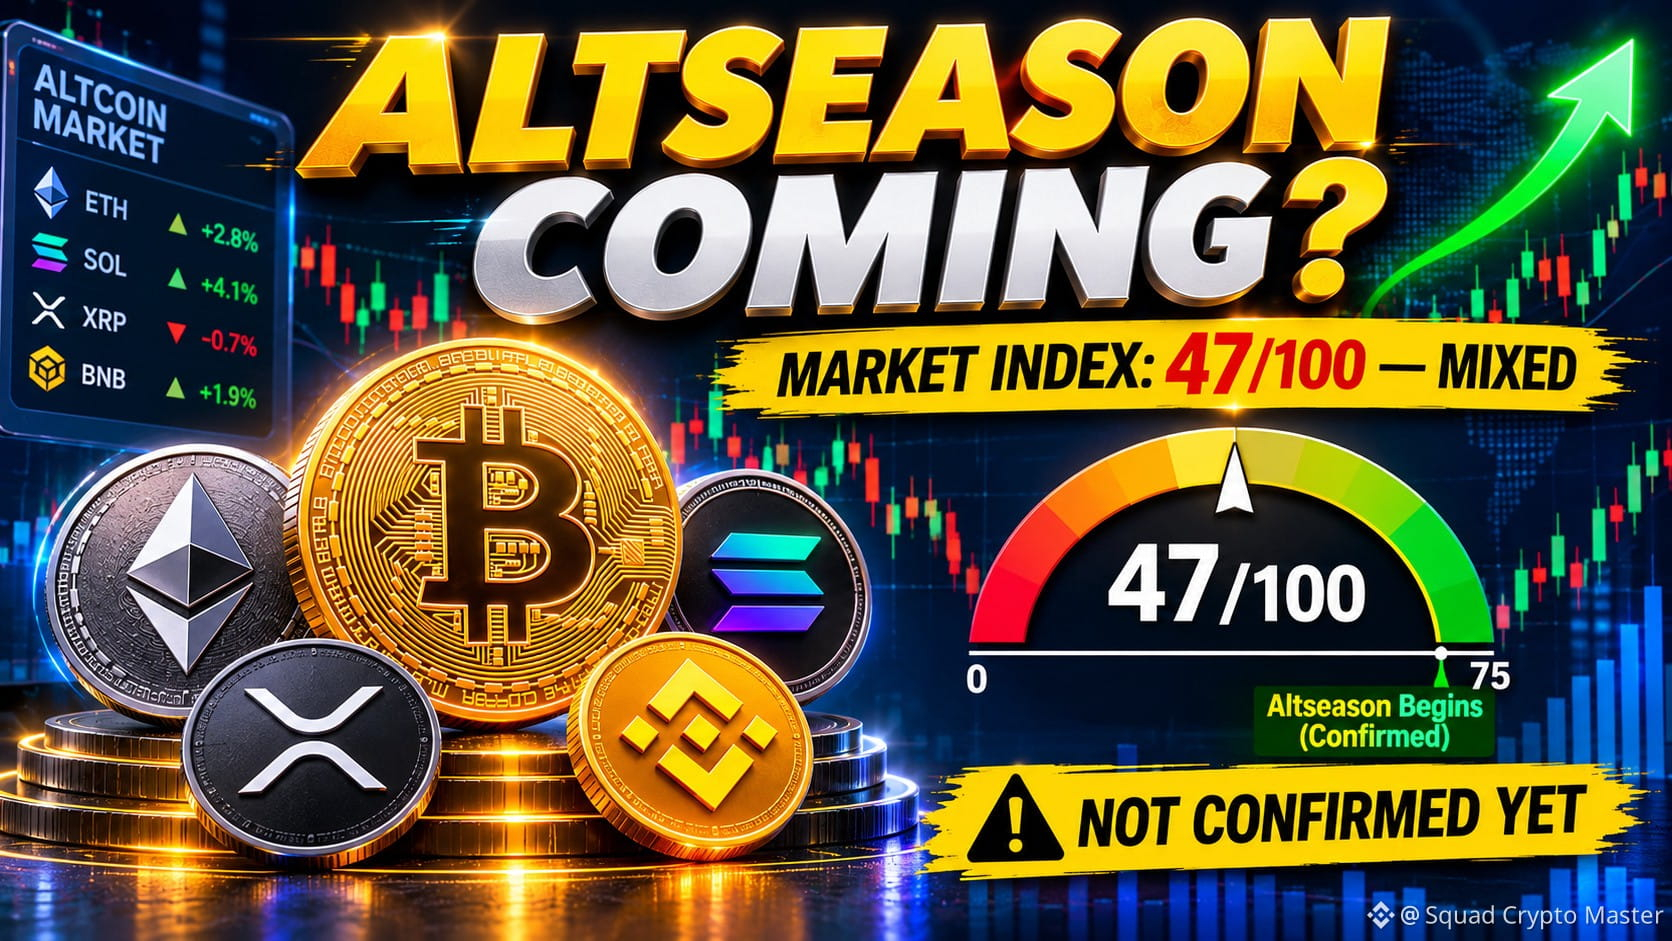
🔥 Altcoin Season Index: 47/100
📈 17 out of 36 tracked altcoins outperformed Bitcoin over 90 days.
Coins to Watch:
🟣 ETH – Ethereum
🟢 SOL – Solana
🔵 XRP – XRP
🟡 BNB – BNB
🔗 LINK – Chainlink
🐂 Bullish Scenario:
Bitcoin dominance starts declining.
ETH/BTC shows sustained strength.
More altcoins outperform Bitcoin.
Trading volume increases across altcoin markets.
🐻 Bearish Scenario:
Bitcoin dominance continues rising.
Altcoin trading volume weakens.
Major altcoins lose key support levels.
🎯 My Market View:
The market currently shows mixed conditions. The Altcoin Season Index is still below 75, so a confirmed broad altseason has not arrived.
I'm watching Bitcoin dominance, ETH/BTC, and altcoin volume before calling the next major rotation.
💬 QUESTION FOR THE COMMUNITY:
Which altcoin do you think could lead the next rally?
1️⃣ $ETH
2️⃣ $SOL
3️⃣ XRP
4️⃣ BNB
5️⃣ LINK
$BTC
Drop your pick below! 👇
#Altseason #Altcoins #CryptoMarket #BinanceSquare #CryptoAnalysis
🚀 ALTSEASON 2026: IS THE BIG ALTCOIN RALLY COMING?
Crypto traders are watching the altcoin market closely!
But are we really entering Altseason?
📊 Current Market Signals
🔥 Altcoin Season Index: 47/100
📈 17 out of 36 tracked altcoins outperformed Bitcoin over 90 days.
Coins to Watch:
🟣 ETH – Ethereum
🟢 SOL – Solana
🔵 XRP – XRP
🟡 BNB – BNB
🔗 LINK – Chainlink
🐂 Bullish Scenario:
Bitcoin dominance starts declining.
ETH/BTC shows sustained strength.
More altcoins outperform Bitcoin.
Trading volume increases across altcoin markets.
🐻 Bearish Scenario:
Bitcoin dominance continues rising.
Altcoin trading volume weakens.
Major altcoins lose key support levels.
🎯 My Market View:
The market currently shows mixed conditions. The Altcoin Season Index is still below 75, so a confirmed broad altseason has not arrived.
I'm watching Bitcoin dominance, ETH/BTC, and altcoin volume before calling the next major rotation.
💬 QUESTION FOR THE COMMUNITY:
Which altcoin do you think could lead the next rally?
1️⃣ $ETH
2️⃣ $SOL
3️⃣ XRP
4️⃣ BNB
5️⃣ LINK
$BTC
Drop your pick below! 👇
#Altseason #Altcoins #CryptoMarket #BinanceSquare #CryptoAnalysis
Crypto traders are watching the altcoin market closely!
But are we really entering Altseason?
📊 Current Market Signals
🔥 Altcoin Season Index: 47/100
📈 17 out of 36 tracked altcoins outperformed Bitcoin over 90 days.
Coins to Watch:
🟣 ETH – Ethereum
🟢 SOL – Solana
🔵 XRP – XRP
🟡 BNB – BNB
🔗 LINK – Chainlink
🐂 Bullish Scenario:
Bitcoin dominance starts declining.
ETH/BTC shows sustained strength.
More altcoins outperform Bitcoin.
Trading volume increases across altcoin markets.
🐻 Bearish Scenario:
Bitcoin dominance continues rising.
Altcoin trading volume weakens.
Major altcoins lose key support levels.
🎯 My Market View:
The market currently shows mixed conditions. The Altcoin Season Index is still below 75, so a confirmed broad altseason has not arrived.
I'm watching Bitcoin dominance, ETH/BTC, and altcoin volume before calling the next major rotation.
💬 QUESTION FOR THE COMMUNITY:
Which altcoin do you think could lead the next rally?
1️⃣ $ETH
2️⃣ $SOL
3️⃣ XRP
4️⃣ BNB
5️⃣ LINK
$BTC
Drop your pick below! 👇
#Altseason #Altcoins #CryptoMarket #BinanceSquare #CryptoAnalysis
39
🔥 ETHEREUM vs BITCOIN: WHICH CRYPTO IS STRONGER TODAY?
The battle between ETH and BTC is heating up! 🚀
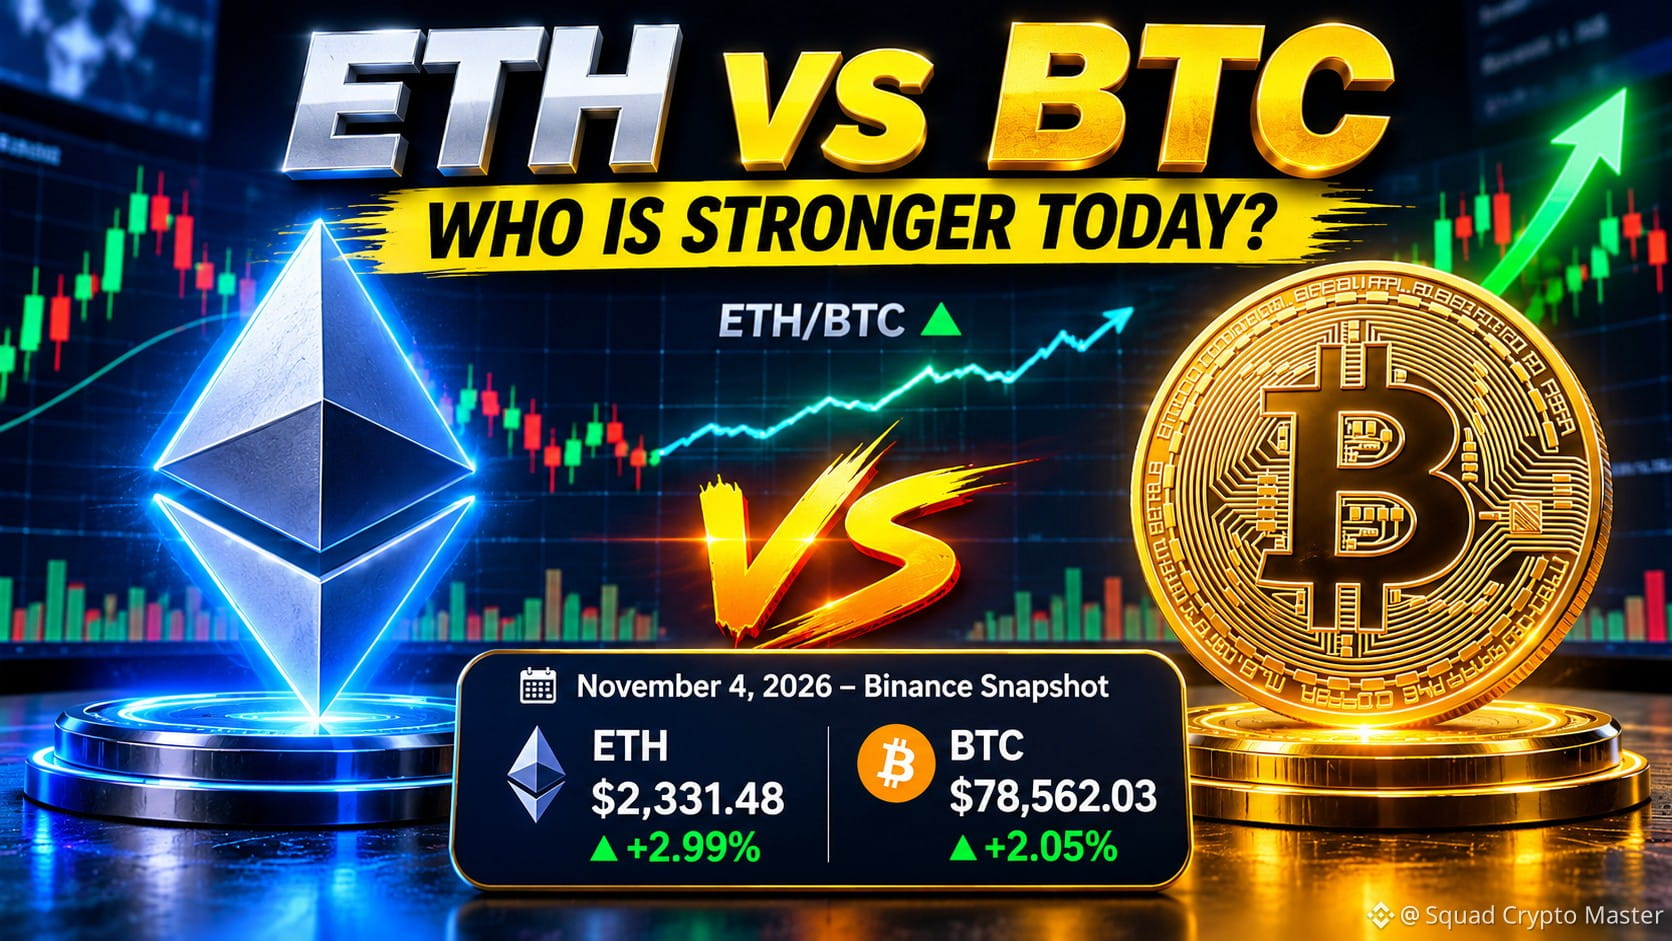
Today's Binance market snapshot shows:
🟣 Ethereum (ETH): $2,331.48 (+2.99%)
🟠 Bitcoin (BTC): $78,562.03 (+2.05%)
📊 What Does the Market Tell Us?
1. Ethereum Bullish Signal 🟢
ETH is outperforming BTC in today's 24-hour snapshot. Buyers are showing stronger short-term momentum.
2. Bitcoin Market Strength 🟠
BTC remains the dominant cryptocurrency, but ETH is currently showing slightly better percentage performance.
3. ETH/BTC Ratio
The ratio is around 0.02959. A sustained rise in this ratio could indicate improving Ethereum strength relative to Bitcoin.
🎯 My Market Outlook
Bullish ETH: $ETH / $BTC ratio continues rising.
Bullish BTC: Bitcoin maintains its market leadership.
Confirmation: Watch trading volume and daily candle closes.
💬 Let's Discuss!
Which cryptocurrency would you choose right now?
🟣 ETHEREUM or 🟠 BITCOIN?
Drop your choice in the comments! 👇
#Ethereum #Bitcoin #ETH #CryptoAnalysis #CryptoTrading
🔥 ETHEREUM vs BITCOIN: WHICH CRYPTO IS STRONGER TODAY?
The battle between ETH and BTC is heating up! 🚀
Today's Binance market snapshot shows:
🟣 Ethereum (ETH): $2,331.48 (+2.99%)
🟠 Bitcoin (BTC): $78,562.03 (+2.05%)
📊 What Does the Market Tell Us?
1. Ethereum Bullish Signal 🟢
ETH is outperforming BTC in today's 24-hour snapshot. Buyers are showing stronger short-term momentum.
2. Bitcoin Market Strength 🟠
BTC remains the dominant cryptocurrency, but ETH is currently showing slightly better percentage performance.
3. ETH/BTC Ratio
The ratio is around 0.02959. A sustained rise in this ratio could indicate improving Ethereum strength relative to Bitcoin.
🎯 My Market Outlook
Bullish ETH: $ETH / $BTC ratio continues rising.
Bullish BTC: Bitcoin maintains its market leadership.
Confirmation: Watch trading volume and daily candle closes.
💬 Let's Discuss!
Which cryptocurrency would you choose right now?
🟣 ETHEREUM or 🟠 BITCOIN?
Drop your choice in the comments! 👇
#Ethereum #Bitcoin #ETH #CryptoAnalysis #CryptoTrading
The battle between ETH and BTC is heating up! 🚀
Today's Binance market snapshot shows:
🟣 Ethereum (ETH): $2,331.48 (+2.99%)
🟠 Bitcoin (BTC): $78,562.03 (+2.05%)
📊 What Does the Market Tell Us?
1. Ethereum Bullish Signal 🟢
ETH is outperforming BTC in today's 24-hour snapshot. Buyers are showing stronger short-term momentum.
2. Bitcoin Market Strength 🟠
BTC remains the dominant cryptocurrency, but ETH is currently showing slightly better percentage performance.
3. ETH/BTC Ratio
The ratio is around 0.02959. A sustained rise in this ratio could indicate improving Ethereum strength relative to Bitcoin.
🎯 My Market Outlook
Bullish ETH: $ETH / $BTC ratio continues rising.
Bullish BTC: Bitcoin maintains its market leadership.
Confirmation: Watch trading volume and daily candle closes.
💬 Let's Discuss!
Which cryptocurrency would you choose right now?
🟣 ETHEREUM or 🟠 BITCOIN?
Drop your choice in the comments! 👇
#Ethereum #Bitcoin #ETH #CryptoAnalysis #CryptoTrading
30
🚀 BITCOIN RECOVERY: IS BTC READY FOR ANOTHER RALLY?
Bitcoin is showing signs of recovery! 📈
$BTC is trading around $78,538, gaining approximately 2.14% in the last 24 hours.
But is this the beginning of a new bullish move, or just a temporary bounce?
📊 Key Technical Levels
🟢 Support Zone: $76,777
🔴 Resistance Zone: $79,829
🎯 Next Resistance: $81,802
Bullish Scenario 🐂
If BTC breaks above $79,829 and maintains momentum, the next level to watch is $81,802.
Bearish Scenario 🐻
If BTC loses the $76,777 support level, selling pressure could increase, with $74,978 as the next support to watch.
My Market View:
Bitcoin's recovery looks encouraging, but confirmation is still needed. Watch volume, price action, and daily candle closes before making any trading decisions.
💬 What do you think?
Will BTC break $80K this week, or will bears take control again?
👇 Share your analysis in the comments!
#Bitcoin #BTC #CryptoMarket #BinanceSquare #CryptoCommunity
🚀 BITCOIN RECOVERY: IS BTC READY FOR ANOTHER RALLY?
Bitcoin is showing signs of recovery! 📈
$BTC is trading around $78,538, gaining approximately 2.14% in the last 24 hours.
But is this the beginning of a new bullish move, or just a temporary bounce?
📊 Key Technical Levels
🟢 Support Zone: $76,777
🔴 Resistance Zone: $79,829
🎯 Next Resistance: $81,802
Bullish Scenario 🐂
If BTC breaks above $79,829 and maintains momentum, the next level to watch is $81,802.
Bearish Scenario 🐻
If BTC loses the $76,777 support level, selling pressure could increase, with $74,978 as the next support to watch.
My Market View:
Bitcoin's recovery looks encouraging, but confirmation is still needed. Watch volume, price action, and daily candle closes before making any trading decisions.
💬 What do you think?
Will BTC break $80K this week, or will bears take control again?
👇 Share your analysis in the comments!
#Bitcoin #BTC #CryptoMarket #BinanceSquare #CryptoCommunity
Bitcoin is showing signs of recovery! 📈
$BTC is trading around $78,538, gaining approximately 2.14% in the last 24 hours.
But is this the beginning of a new bullish move, or just a temporary bounce?
📊 Key Technical Levels
🟢 Support Zone: $76,777
🔴 Resistance Zone: $79,829
🎯 Next Resistance: $81,802
Bullish Scenario 🐂
If BTC breaks above $79,829 and maintains momentum, the next level to watch is $81,802.
Bearish Scenario 🐻
If BTC loses the $76,777 support level, selling pressure could increase, with $74,978 as the next support to watch.
My Market View:
Bitcoin's recovery looks encouraging, but confirmation is still needed. Watch volume, price action, and daily candle closes before making any trading decisions.
💬 What do you think?
Will BTC break $80K this week, or will bears take control again?
👇 Share your analysis in the comments!
#Bitcoin #BTC #CryptoMarket #BinanceSquare #CryptoCommunity

1
💎 SUCCESS IN CRYPTO TAKES PATIENCE!
The crypto market moves up and down. Smart investors focus on knowledge, discipline, and long-term goals instead of following every hype.
Remember:
📚 Learn before you invest.
🧠 Control your emotions.
📊 Do your own research.
💰 Never invest more than you can afford to lose.
🔥 What's your biggest lesson from crypto?
Share your thoughts below! 👇
#CryptoMotivation #Bitcoin #CryptoTrading #BinanceSquare #DYOR
$BTC $ETH $BNB
💎 SUCCESS IN CRYPTO TAKES PATIENCE!
The crypto market moves up and down. Smart investors focus on knowledge, discipline, and long-term goals instead of following every hype.
Remember:
📚 Learn before you invest.
🧠 Control your emotions.
📊 Do your own research.
💰 Never invest more than you can afford to lose.
🔥 What's your biggest lesson from crypto?
Share your thoughts below! 👇
#CryptoMotivation #Bitcoin #CryptoTrading #BinanceSquare #DYOR
$BTC $ETH $BNB
The crypto market moves up and down. Smart investors focus on knowledge, discipline, and long-term goals instead of following every hype.
Remember:
📚 Learn before you invest.
🧠 Control your emotions.
📊 Do your own research.
💰 Never invest more than you can afford to lose.
🔥 What's your biggest lesson from crypto?
Share your thoughts below! 👇
#CryptoMotivation #Bitcoin #CryptoTrading #BinanceSquare #DYOR
$BTC $ETH $BNB

38
🔥 BITCOIN vs ETHEREUM!
Two crypto giants. Two different visions. One big question!
₿ Bitcoin (BTC) – Digital Gold
💎 Ethereum (ETH) – Smart Contract Powerhouse
If you could invest in only ONE for the next 5 years, which would you choose?
🟠 $BTC or 🔵 $ETH
Drop your answer in the comments! 👇
#Ethereum #BTC #ETH #CryptoCommunity #BinanceSquare
🔥 BITCOIN vs ETHEREUM!
Two crypto giants. Two different visions. One big question!
₿ Bitcoin (BTC) – Digital Gold
💎 Ethereum (ETH) – Smart Contract Powerhouse
If you could invest in only ONE for the next 5 years, which would you choose?
🟠 $BTC or 🔵 $ETH
Drop your answer in the comments! 👇
#Ethereum #BTC #ETH #CryptoCommunity #BinanceSquare
Two crypto giants. Two different visions. One big question!
₿ Bitcoin (BTC) – Digital Gold
💎 Ethereum (ETH) – Smart Contract Powerhouse
If you could invest in only ONE for the next 5 years, which would you choose?
🟠 $BTC or 🔵 $ETH
Drop your answer in the comments! 👇
#Ethereum #BTC #ETH #CryptoCommunity #BinanceSquare

52
🚀 THE NEXT CRYPTO BULL RUN!
Are we preparing for another massive crypto bull run?
Bitcoin, Ethereum, and altcoins could bring exciting opportunities, but remember that crypto markets are unpredictable.
📈 What do you think?
🔥 BULL RUN
🐻 BEAR MARKET
Drop your prediction in the comments! 👇
#Bitcoin #BullRun #CryptoMarket #BTC #BinanceSquare
$BTC $ETH $BNB
🚀 THE NEXT CRYPTO BULL RUN!
Are we preparing for another massive crypto bull run?
Bitcoin, Ethereum, and altcoins could bring exciting opportunities, but remember that crypto markets are unpredictable.
📈 What do you think?
🔥 BULL RUN
🐻 BEAR MARKET
Drop your prediction in the comments! 👇
#Bitcoin #BullRun #CryptoMarket #BTC #BinanceSquare
$BTC $ETH $BNB
Are we preparing for another massive crypto bull run?
Bitcoin, Ethereum, and altcoins could bring exciting opportunities, but remember that crypto markets are unpredictable.
📈 What do you think?
🔥 BULL RUN
🐻 BEAR MARKET
Drop your prediction in the comments! 👇
#Bitcoin #BullRun #CryptoMarket #BTC #BinanceSquare
$BTC $ETH $BNB

68
🔥 CRYPTO QUIZ TIME!
Which cryptocurrency was created first?
₿ A) Bitcoin $BTC
Ξ B) Ethereum $ETH
💬 Comment your answer below!
Let's see how many crypto experts are here! 🚀
#CryptoQuiz #Bitcoin #Ethereum #BTC #ETH
🔥 CRYPTO QUIZ TIME!
Which cryptocurrency was created first?
₿ A) Bitcoin $BTC
Ξ B) Ethereum $ETH
💬 Comment your answer below!
Let's see how many crypto experts are here! 🚀
#CryptoQuiz #Bitcoin #Ethereum #BTC #ETH
Which cryptocurrency was created first?
₿ A) Bitcoin $BTC
Ξ B) Ethereum $ETH
💬 Comment your answer below!
Let's see how many crypto experts are here! 🚀
#CryptoQuiz #Bitcoin #Ethereum #BTC #ETH

57
🚀 Bitcoin: What's Coming Next?
Bitcoin is always full of surprises! Will $BTC reach a new all-time high, or will we see another correction?
Let's hear your prediction! 👇
🎯 What will Bitcoin's price be in the next 30 days?
#Bitcoin #BTC #CryptoPrediction #BinanceSquare #CryptoCommunity
🚀 Bitcoin: What's Coming Next?
Bitcoin is always full of surprises! Will $BTC reach a new all-time high, or will we see another correction?
Let's hear your prediction! 👇
🎯 What will Bitcoin's price be in the next 30 days?
#Bitcoin #BTC #CryptoPrediction #BinanceSquare #CryptoCommunity
Bitcoin is always full of surprises! Will $BTC reach a new all-time high, or will we see another correction?
Let's hear your prediction! 👇
🎯 What will Bitcoin's price be in the next 30 days?
#Bitcoin #BTC #CryptoPrediction #BinanceSquare #CryptoCommunity

85
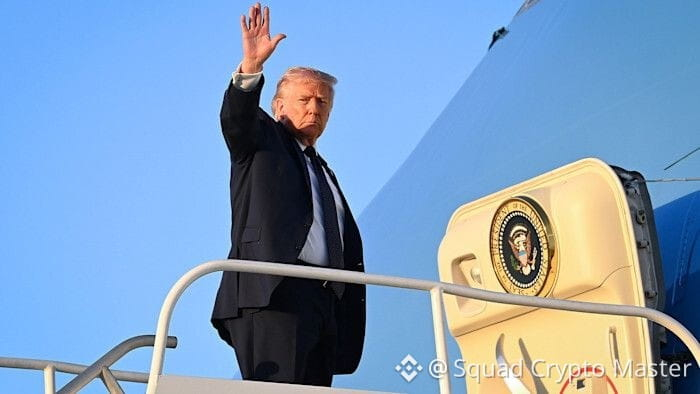
#TRUMP CALLS US WAR ON IRAN A ‘LITTLE EXCURSION’ AS CRYPTO SURGES $60B AND #BTC RECLAIMS $70K AMID #PEACE HOPES
The crypto market just saw a $60 billion liquidity injection, lifting total market cap to $2.32T.
Analysts say if the peace deal is confirmed, a relief rally could sustain through the week, supported by pro-innovation regulatory signals from CFTC Chair Michael Selig.
$BTC
#TRUMP CALLS US WAR ON IRAN A ‘LITTLE EXCURSION’ AS CRYPTO SURGES $60B AND #BTC RECLAIMS $70K AMID #PEACE HOPES
The crypto market just saw a $60 billion liquidity injection, lifting total market cap to $2.32T.
Analysts say if the peace deal is confirmed, a relief rally could sustain through the week, supported by pro-innovation regulatory signals from CFTC Chair Michael Selig.
$BTC
The crypto market just saw a $60 billion liquidity injection, lifting total market cap to $2.32T.
Analysts say if the peace deal is confirmed, a relief rally could sustain through the week, supported by pro-innovation regulatory signals from CFTC Chair Michael Selig.
$BTC
1
6
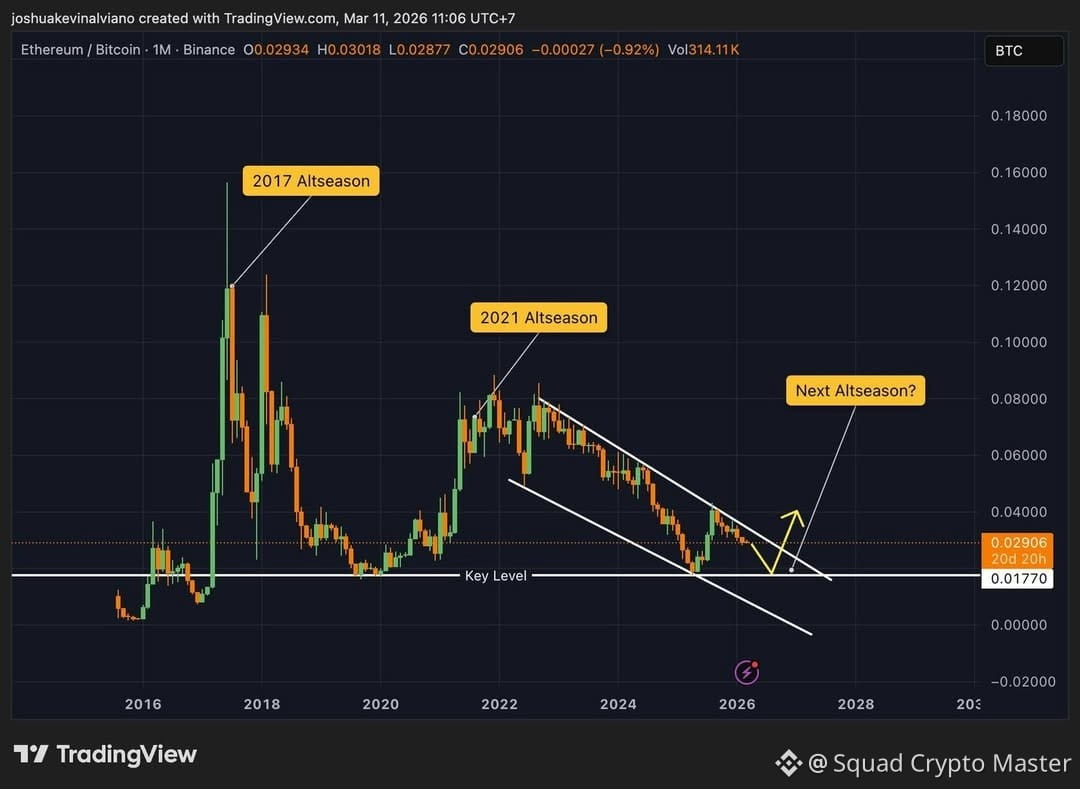
Been watching the ETH/BTC ratio closely and the chart is setting up nicely.
Price is getting squeezed into that key level around 0.0177 — the same floor that's held since 2016.
Once we get a confirmed bounce and break out of this falling wedge, I think altseason starts cooking.
We've seen this before. 2017. Then 2021. History doesn't repeat but it sure does rhyme.
#crypto #Ethereum #Bitcoin #ETHBTC #Altseason
$BTC $ETH
Been watching the ETH/BTC ratio closely and the chart is setting up nicely.
Price is getting squeezed into that key level around 0.0177 — the same floor that's held since 2016.
Once we get a confirmed bounce and break out of this falling wedge, I think altseason starts cooking.
We've seen this before. 2017. Then 2021. History doesn't repeat but it sure does rhyme.
#crypto #Ethereum #Bitcoin #ETHBTC #Altseason
$BTC $ETH
Price is getting squeezed into that key level around 0.0177 — the same floor that's held since 2016.
Once we get a confirmed bounce and break out of this falling wedge, I think altseason starts cooking.
We've seen this before. 2017. Then 2021. History doesn't repeat but it sure does rhyme.
#crypto #Ethereum #Bitcoin #ETHBTC #Altseason
$BTC $ETH
8
Wait For End 🤣
$BTC $ETH $SOL
Wait For End 🤣
$BTC $ETH $SOL
$BTC $ETH $SOL
16
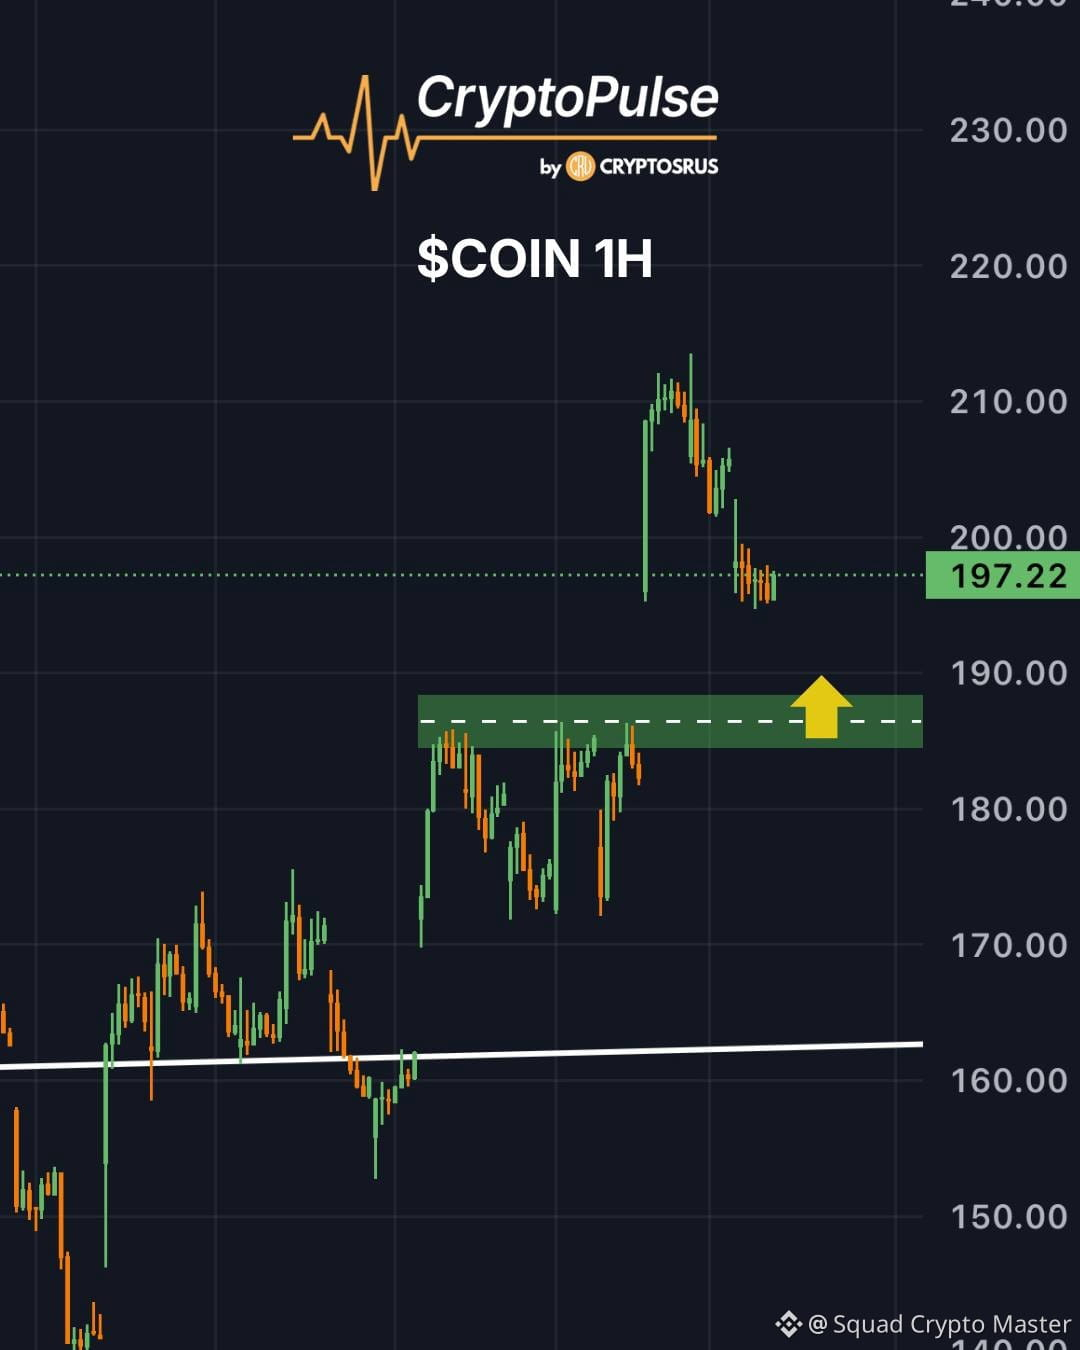
$COIN Eyeing Support Retest 👀
Price is gradually moving toward the $185–$190 S/R flip zone on the 1H.
If buyers step in and defend the level, the next leg up could target $225 resistance. Will the retest hold? 👇
$COIN Eyeing Support Retest 👀
Price is gradually moving toward the $185–$190 S/R flip zone on the 1H.
If buyers step in and defend the level, the next leg up could target $225 resistance. Will the retest hold? 👇
Price is gradually moving toward the $185–$190 S/R flip zone on the 1H.
If buyers step in and defend the level, the next leg up could target $225 resistance. Will the retest hold? 👇
13
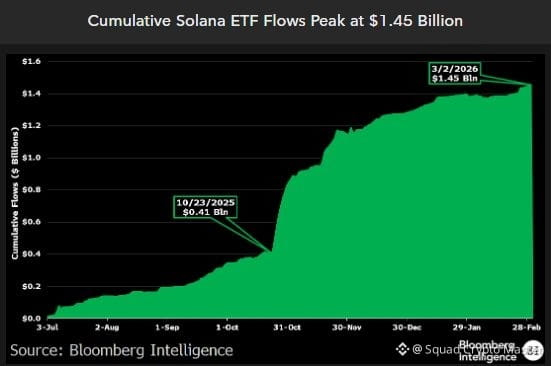
BLOOMBERG: SOLANA ETF FLOWS ARE QUIETLY MASSIVE
According to Bloomberg ETF analyst Eric Balchunas, $SOL has dropped about 57% since spot ETFs launched in July -- arguably some of the worst timing any ETF launch could have.
Yet the funds have still attracted roughly $1.45B in cumulative inflows, and most of that capital has stayed in the products.
Another notable detail: about 50% of the assets come from 13F filers, meaning institutional investors are making up a large share of the investor base.
Balchunas also points out something many are overlooking. If you adjust the flows for Solana’s smaller market cap relative to Bitcoin, the demand is roughly equivalent to about $54B in Bitcoin ETF flows at the same stage.
At that point in its ETF cycle, #bitcoin had roughly half that amount -- and $BTC was rallying, not down nearly 60%.
Despite brutal price action, the institutional appetite behind #solana ETFs appears stronger than many expected. 🤯
BLOOMBERG: SOLANA ETF FLOWS ARE QUIETLY MASSIVE
According to Bloomberg ETF analyst Eric Balchunas, $SOL has dropped about 57% since spot ETFs launched in July -- arguably some of the worst timing any ETF launch could have.
Yet the funds have still attracted roughly $1.45B in cumulative inflows, and most of that capital has stayed in the products.
Another notable detail: about 50% of the assets come from 13F filers, meaning institutional investors are making up a large share of the investor base.
Balchunas also points out something many are overlooking. If you adjust the flows for Solana’s smaller market cap relative to Bitcoin, the demand is roughly equivalent to about $54B in Bitcoin ETF flows at the same stage.
At that point in its ETF cycle, #bitcoin had roughly half that amount -- and $BTC was rallying, not down nearly 60%.
Despite brutal price action, the institutional appetite behind #solana ETFs appears stronger than many expected. 🤯
According to Bloomberg ETF analyst Eric Balchunas, $SOL has dropped about 57% since spot ETFs launched in July -- arguably some of the worst timing any ETF launch could have.
Yet the funds have still attracted roughly $1.45B in cumulative inflows, and most of that capital has stayed in the products.
Another notable detail: about 50% of the assets come from 13F filers, meaning institutional investors are making up a large share of the investor base.
Balchunas also points out something many are overlooking. If you adjust the flows for Solana’s smaller market cap relative to Bitcoin, the demand is roughly equivalent to about $54B in Bitcoin ETF flows at the same stage.
At that point in its ETF cycle, #bitcoin had roughly half that amount -- and $BTC was rallying, not down nearly 60%.
Despite brutal price action, the institutional appetite behind #solana ETFs appears stronger than many expected. 🤯
9
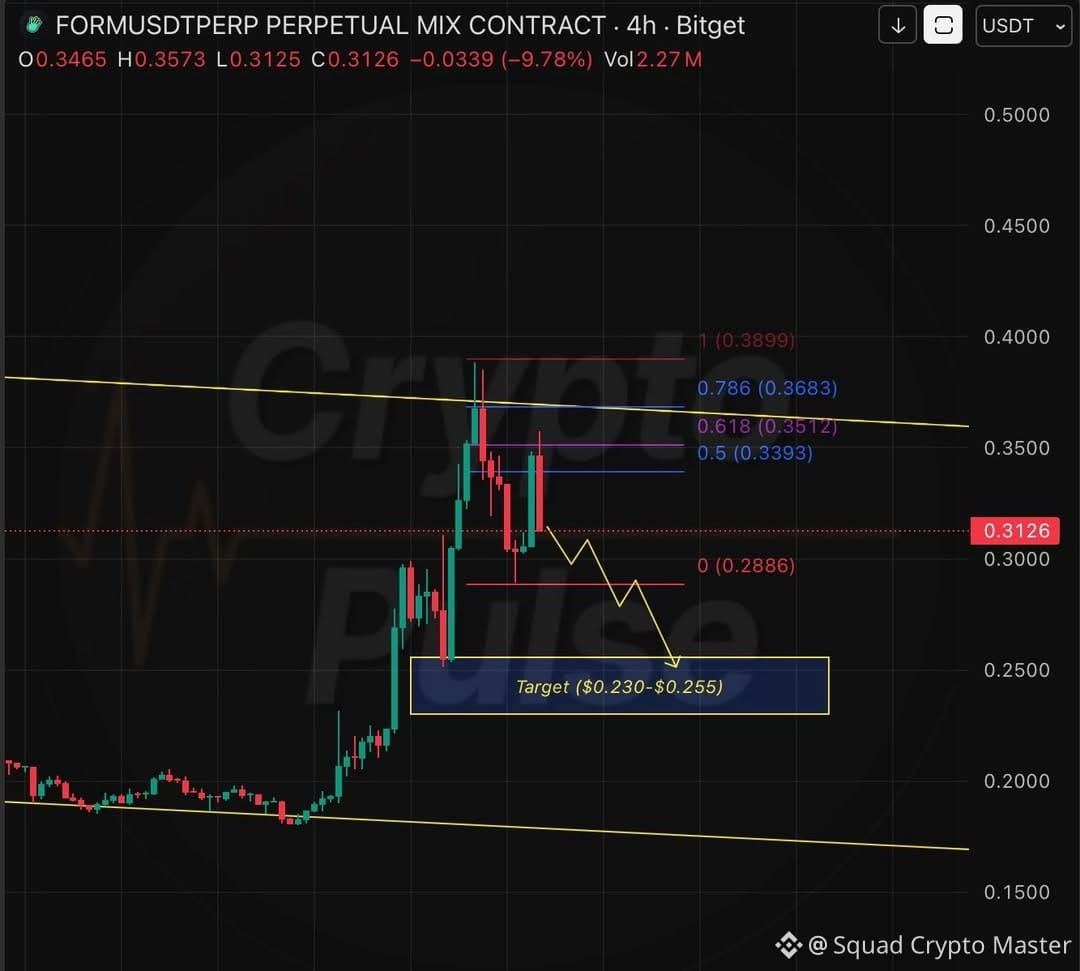
#FORM – Failed to break daily resistance ❌
On H4, $FORM just got rejected from its daily resistance. After a retrace forming a higher low, price rejected right at the 0.618 Fibonacci golden zone, followed by a solid red candle. Structurally this looks like a trend shift to the downside.
Nearest target around $0.230 📉
{spot}(FORMUSDT)
#FORM – Failed to break daily resistance ❌
On H4, $FORM just got rejected from its daily resistance. After a retrace forming a higher low, price rejected right at the 0.618 Fibonacci golden zone, followed by a solid red candle. Structurally this looks like a trend shift to the downside.
Nearest target around $0.230 📉
On H4, $FORM just got rejected from its daily resistance. After a retrace forming a higher low, price rejected right at the 0.618 Fibonacci golden zone, followed by a solid red candle. Structurally this looks like a trend shift to the downside.
Nearest target around $0.230 📉
143
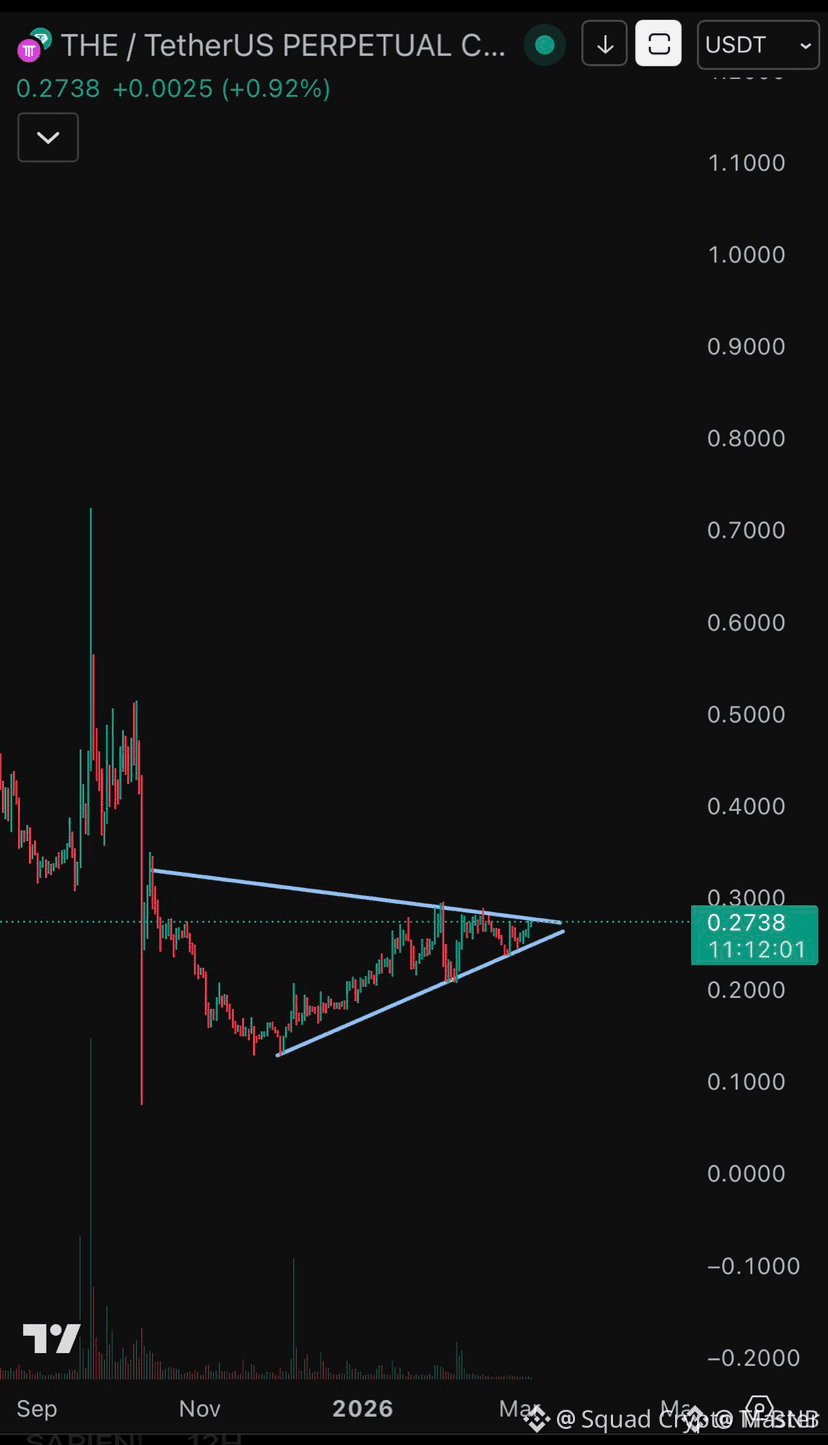
$THE – Bulls Coiling Inside the Triangle: Bracing for a Massive Breakout After Long Consolidation
Long $THE now
Entry: 0.27 – 0.275
SL: 0.225
TP: 0.33 – 0.42 – 0.55
Watching THE squeeze tightly within a symmetrical triangle with rising lows suggests that buyers are steadily absorbing supply and preparing for a move.
The price action is currently hovering at the apex of this long-term structure, making it feel like a high-momentum breakout toward the 0.42 resistance is currently loading.
Trade $THE here 👇
$THE – Bulls Coiling Inside the Triangle: Bracing for a Massive Breakout After Long Consolidation
Long $THE now
Entry: 0.27 – 0.275
SL: 0.225
TP: 0.33 – 0.42 – 0.55
Watching THE squeeze tightly within a symmetrical triangle with rising lows suggests that buyers are steadily absorbing supply and preparing for a move.
The price action is currently hovering at the apex of this long-term structure, making it feel like a high-momentum breakout toward the 0.42 resistance is currently loading.
Trade $THE here 👇
Long $THE now
Entry: 0.27 – 0.275
SL: 0.225
TP: 0.33 – 0.42 – 0.55
Watching THE squeeze tightly within a symmetrical triangle with rising lows suggests that buyers are steadily absorbing supply and preparing for a move.
The price action is currently hovering at the apex of this long-term structure, making it feel like a high-momentum breakout toward the 0.42 resistance is currently loading.
Trade $THE here 👇
8
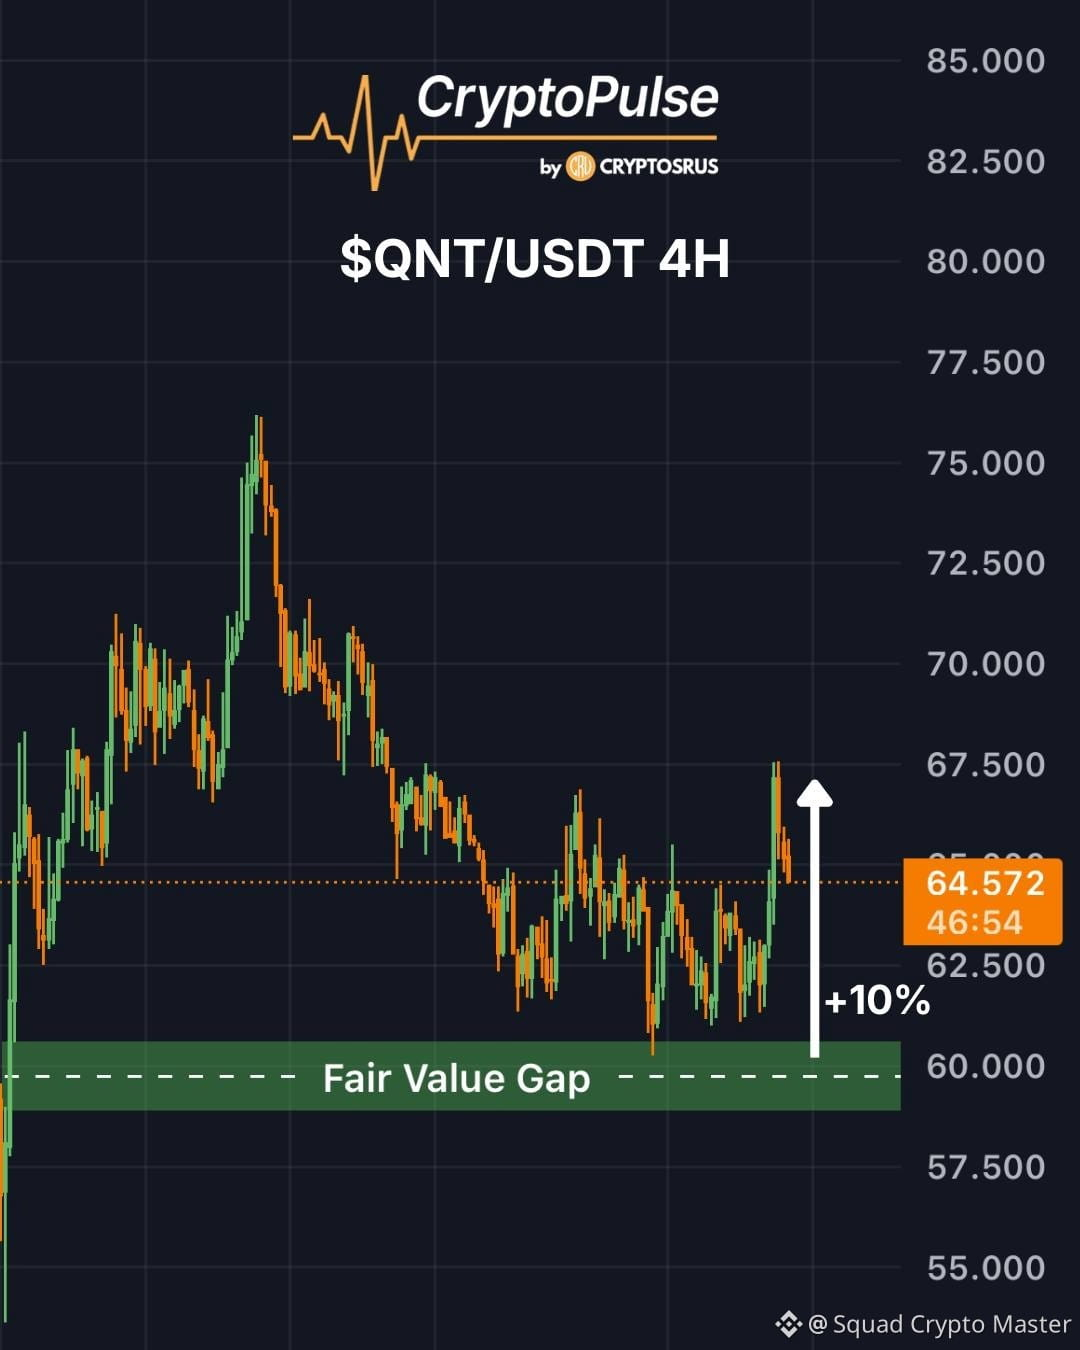
$QNT FVG Bounce Hit Successfully 👀
As outlined a few days ago, we highlighted the $60 FVG as a potential bounce zone if $QNT retraced.
Price tapped the level and reacted perfectly — delivering roughly a +10% move 📈
$QNT FVG Bounce Hit Successfully 👀
As outlined a few days ago, we highlighted the $60 FVG as a potential bounce zone if $QNT retraced.
Price tapped the level and reacted perfectly — delivering roughly a +10% move 📈
As outlined a few days ago, we highlighted the $60 FVG as a potential bounce zone if $QNT retraced.
Price tapped the level and reacted perfectly — delivering roughly a +10% move 📈
25
Log in to explore more content
Join global crypto users on Binance Square
⚡️ Get latest and useful information about crypto.
💬 Trusted by the world’s largest crypto exchange.
👍 Discover real insights from verified creators.
Email / Phone number
Trending Topics
BinanceReopensWithdrawalsForMoreAssets
576,375 views
2,637 Discussing
Security Incident | Recovery Update #8: Withdrawals for More Assets to Reopen (2026-11-05)
Binance Announcement
·64 Likes
·149k views
BTCRebounds80K
101,721 views
1,017 Discussing
Binance98PercentReplenished
55,377 views
739 Discussing