


欧鹏
趋势交易|公众号:欧鹏说|邀请码77VIP|
Frequent Trader
2.7 Years
9 Following
2.6K+ Followers
4.6K+ Liked
Posts
All
Quotes
Videos
Live
Verified
欧鹏
·
--
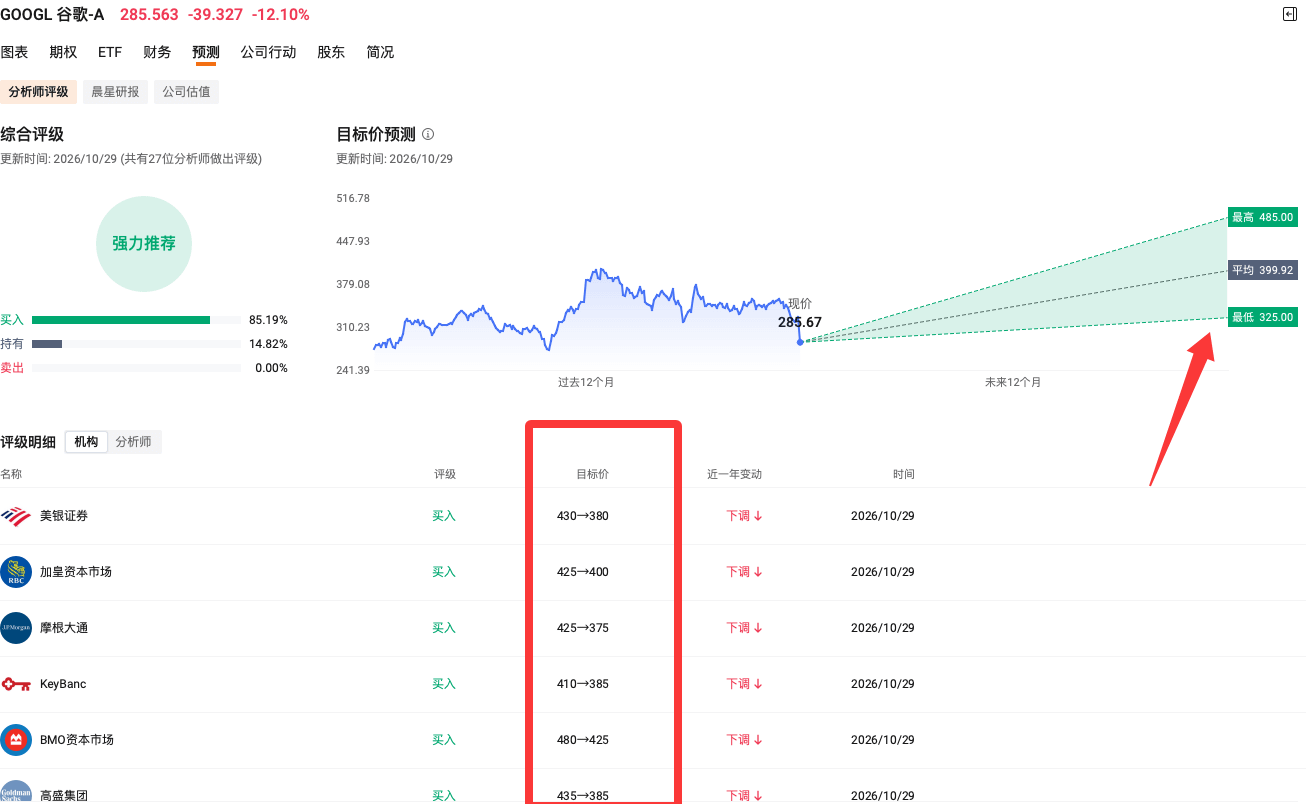
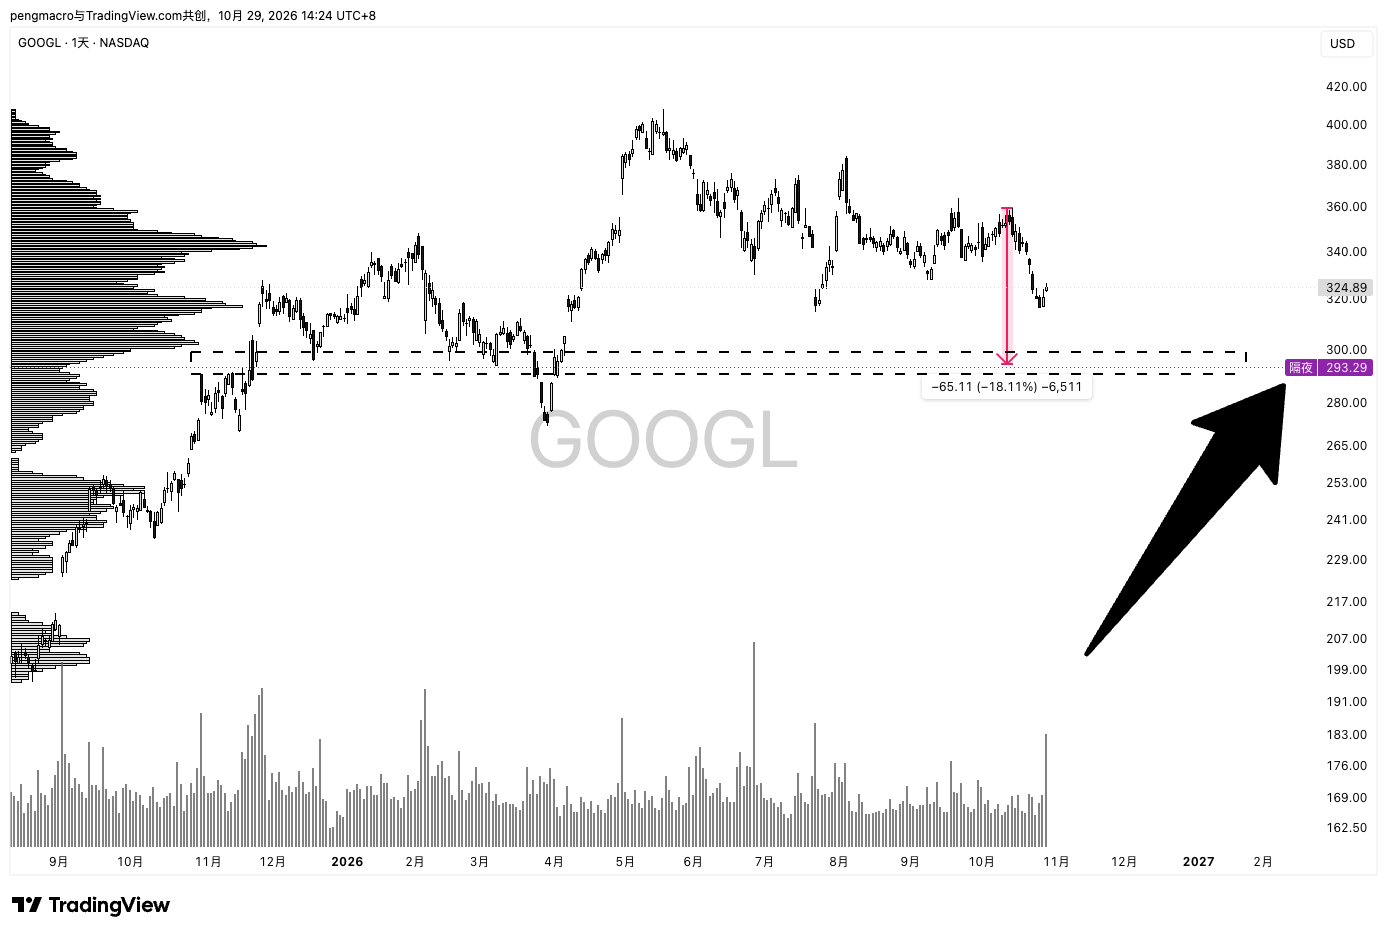
BullishGoogle $GOOGL reported Q3 revenue and profit both below expectations. Its shares fell about 9%–10% after hours, and traded near $293 overnight. Cloud is still growing rapidly (+103%), but slowing search ad growth and AI capital expenditures turning free cash flow negative have made the market cautious.
The chart shows that the stock has fallen about 18% from its October high. Historically, Google has often stabilized after corrections of nearly 20%, so downside risk appears relatively manageable in the current range, while the upside could be greater once momentum turns.
I’m personally inclined to try a small long position and watch to see whether the stock finds support in the $290–$300 range. If it continues to break below that range, exit promptly. The risk is limited, the upside is substantial, and the risk-reward looks attractive.
欧鹏
·
--
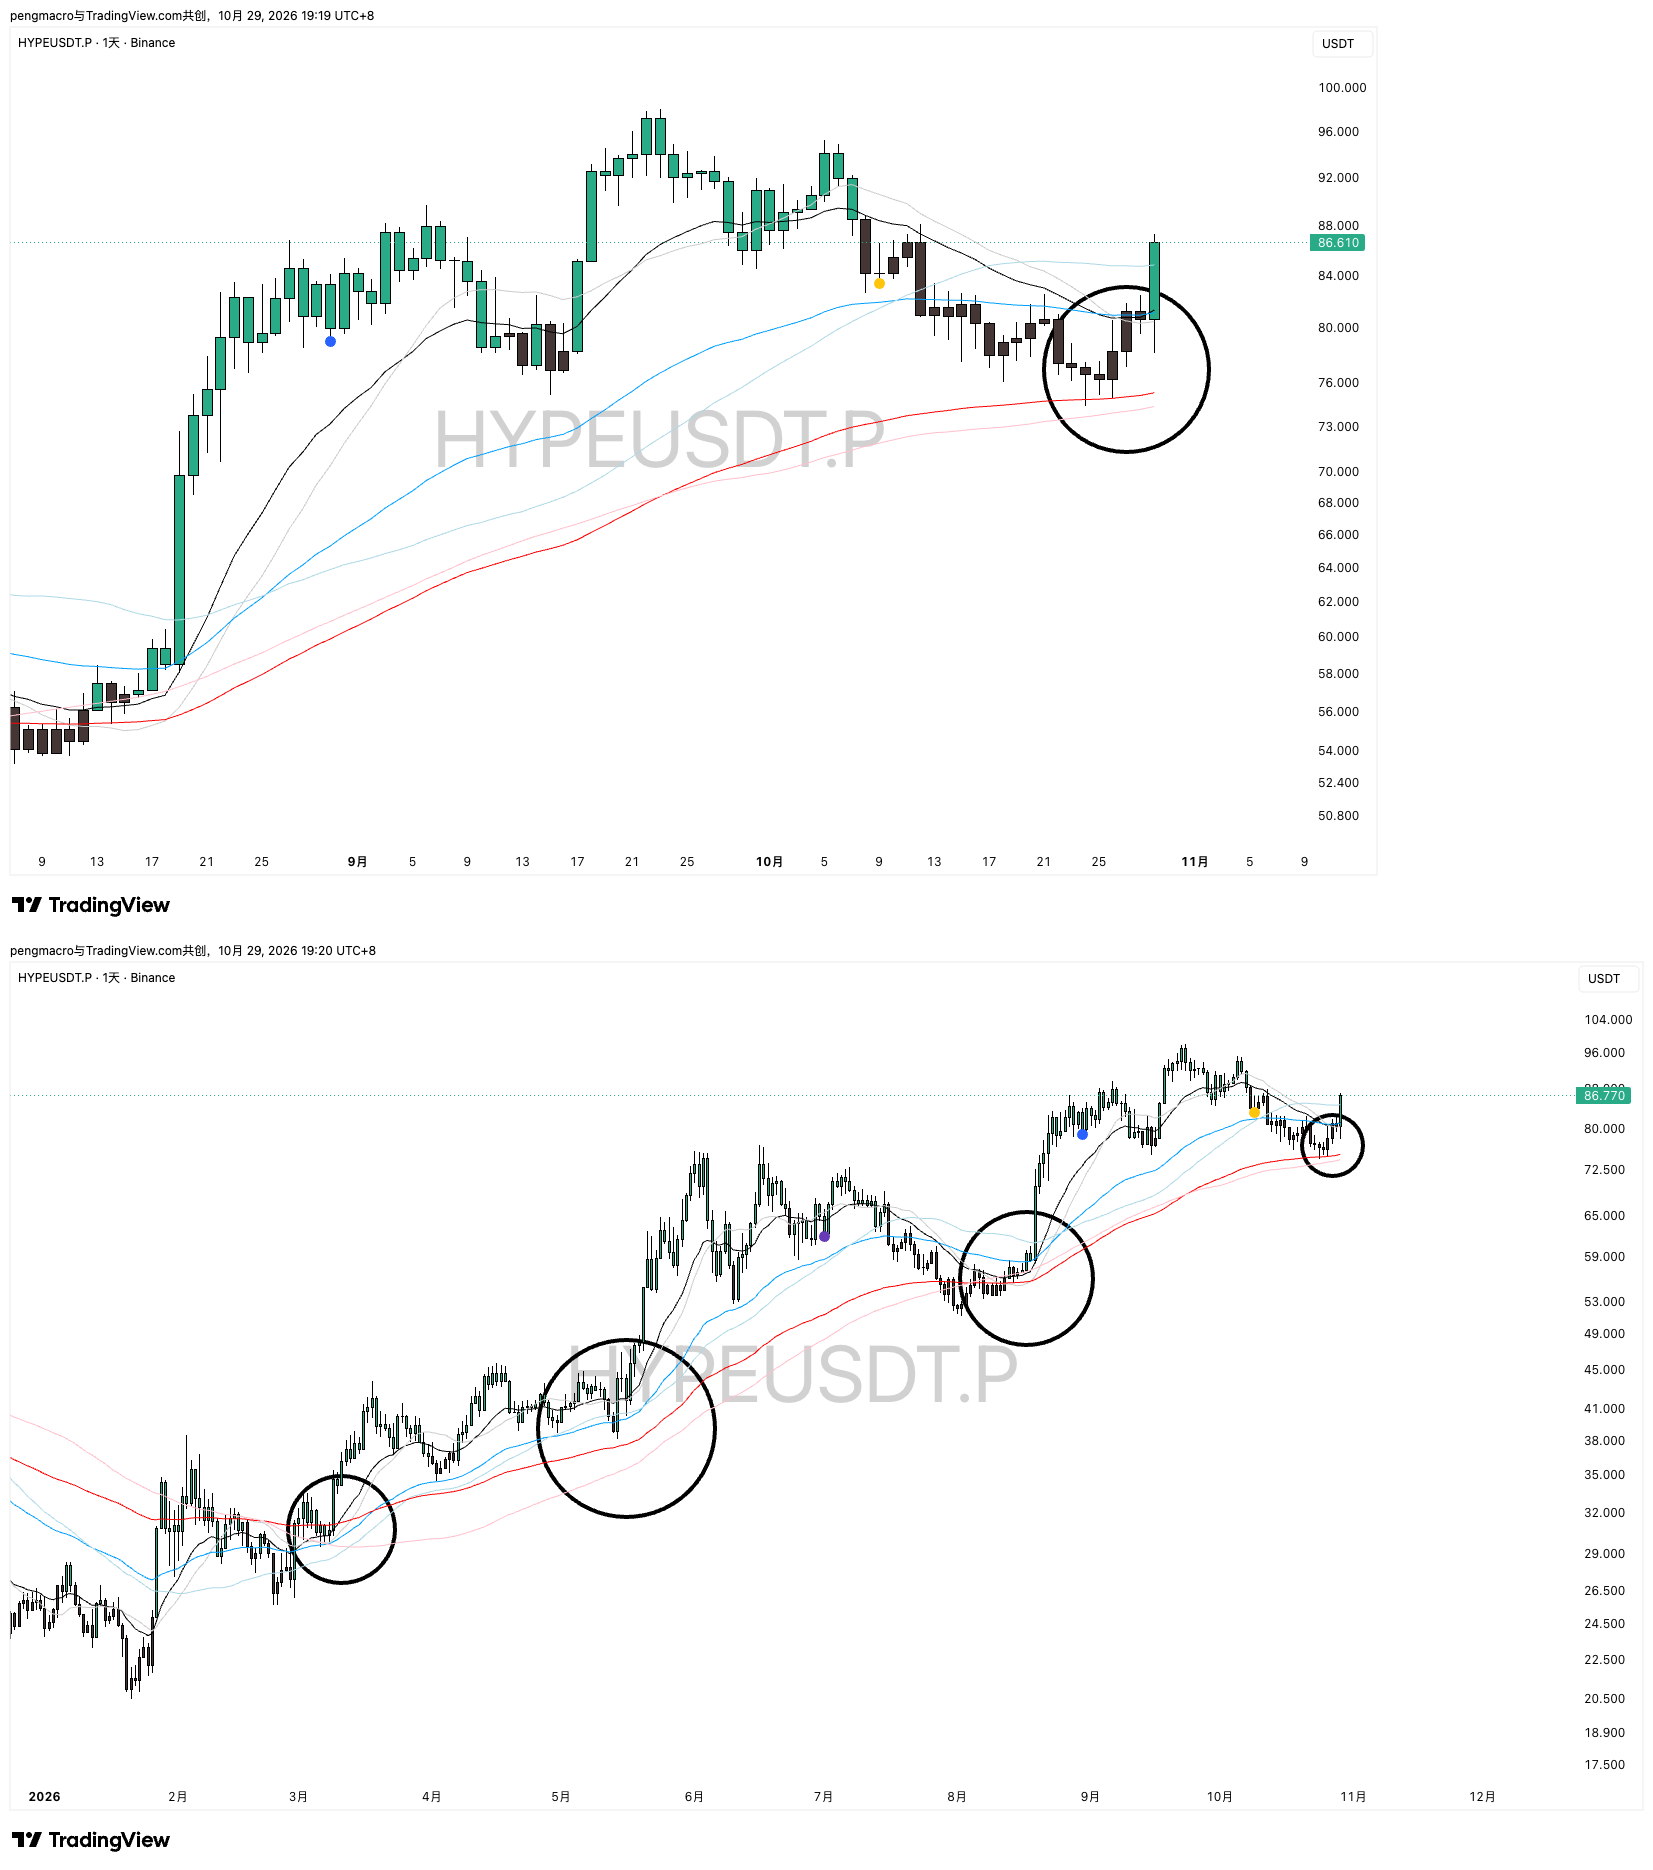
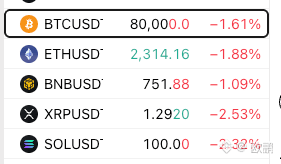
$HYPE has fallen to key support once again.
Can it rebound again this time? Wait for the short-term moving average to turn upward, then go for it.
Can it rebound again this time? Wait for the short-term moving average to turn upward, then go for it.
欧鹏
·
--
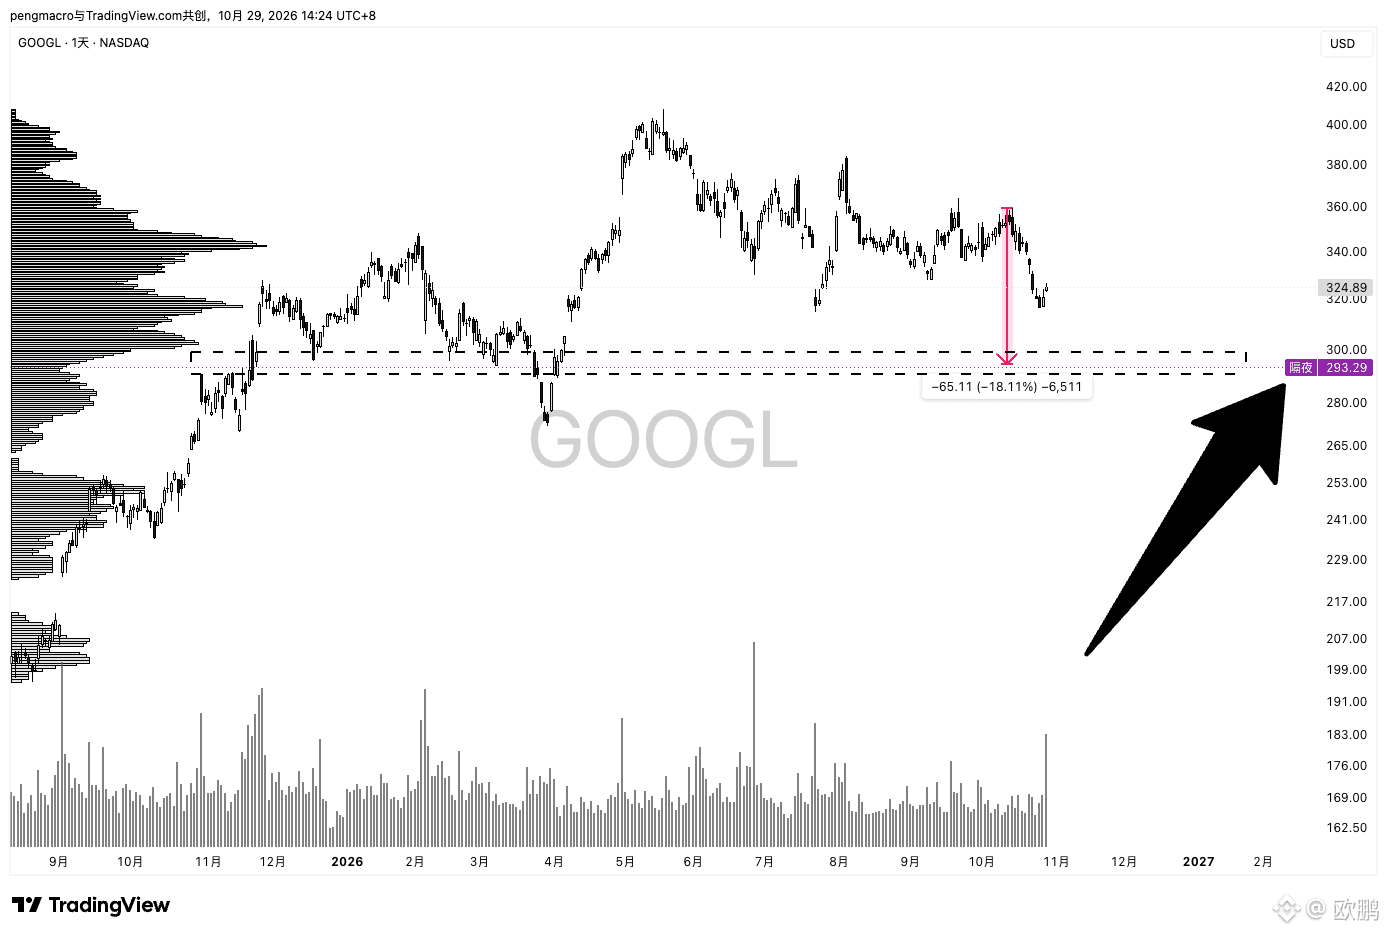
BullishGoogle $GOOGL reported Q3 revenue and profit both below expectations. Its shares fell about 9%–10% after hours, and traded near $293 overnight. Cloud is still growing rapidly (+103%), but slowing search ad growth and AI capital expenditures turning free cash flow negative have made the market cautious.
The chart shows that the stock has fallen about 18% from its October high. Historically, Google has often stabilized after corrections of nearly 20%, so downside risk appears relatively manageable in the current range, while the upside could be greater once momentum turns.
I’m personally inclined to try a small long position and watch to see whether the stock finds support in the $290–$300 range. If it continues to break below that range, exit promptly. The risk is limited, the upside is substantial, and the risk-reward looks attractive.
The chart shows that the stock has fallen about 18% from its October high. Historically, Google has often stabilized after corrections of nearly 20%, so downside risk appears relatively manageable in the current range, while the upside could be greater once momentum turns.
I’m personally inclined to try a small long position and watch to see whether the stock finds support in the $290–$300 range. If it continues to break below that range, exit promptly. The risk is limited, the upside is substantial, and the risk-reward looks attractive.
Verified
欧鹏
·
--
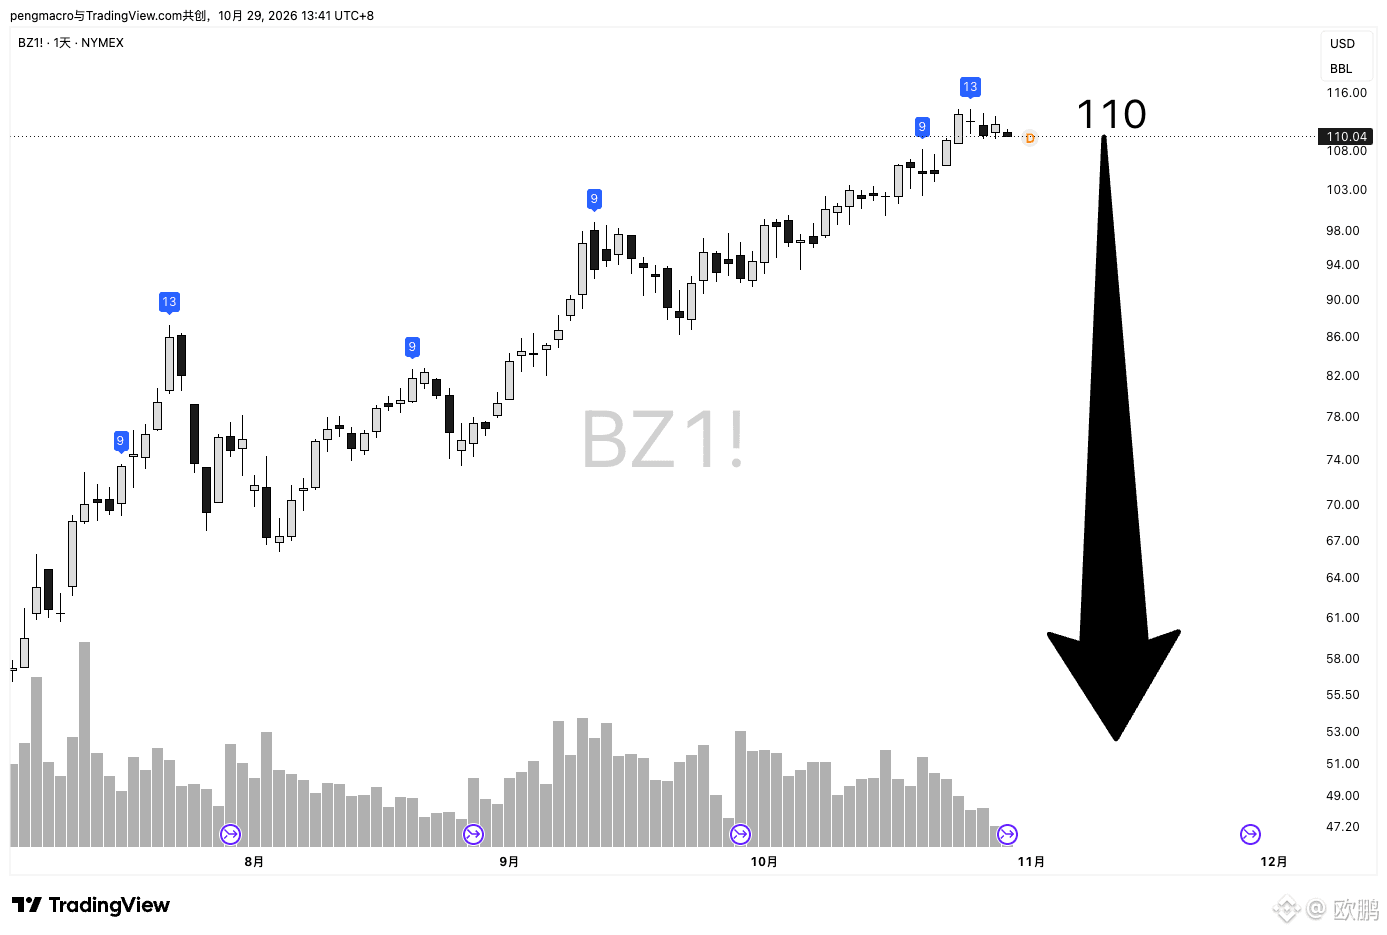
BearishBrent crude oil $BZ has been moving sideways around 110 for several days, unable to break higher, and the price has started to slowly pull back. Meanwhile, the daily chart has flashed a TD13 overbought signal, and short-term momentum has clearly faded.
Structurally, the failure to move higher at these levels, combined with the overbought signal, points to mounting correction pressure. I’m personally leaning bearish in the short term, and with a very tight stop-loss and plenty of upside potential on a short position, the risk-reward still looks pretty good.
The price is now at $110—let’s leave a 👣 and check back at year-end~
欧鹏
·
--
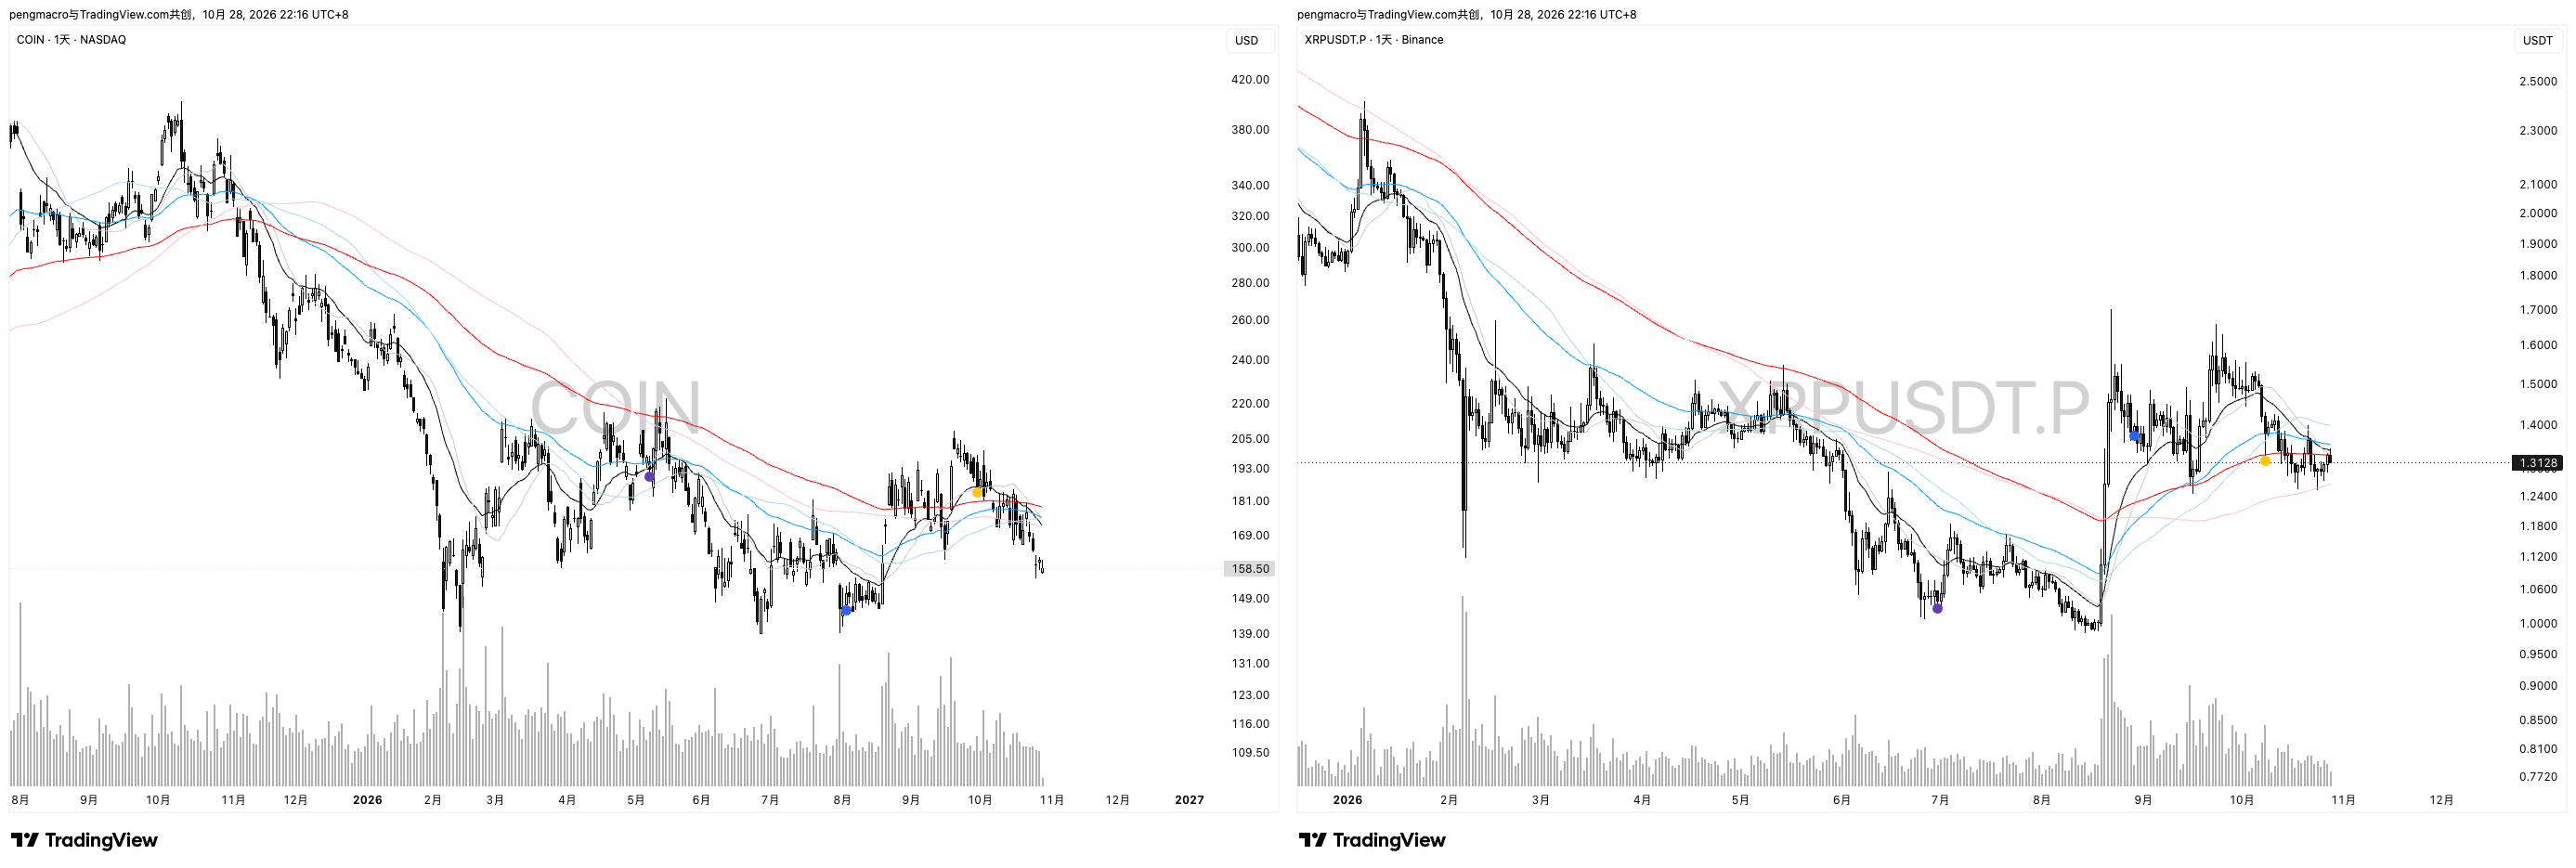
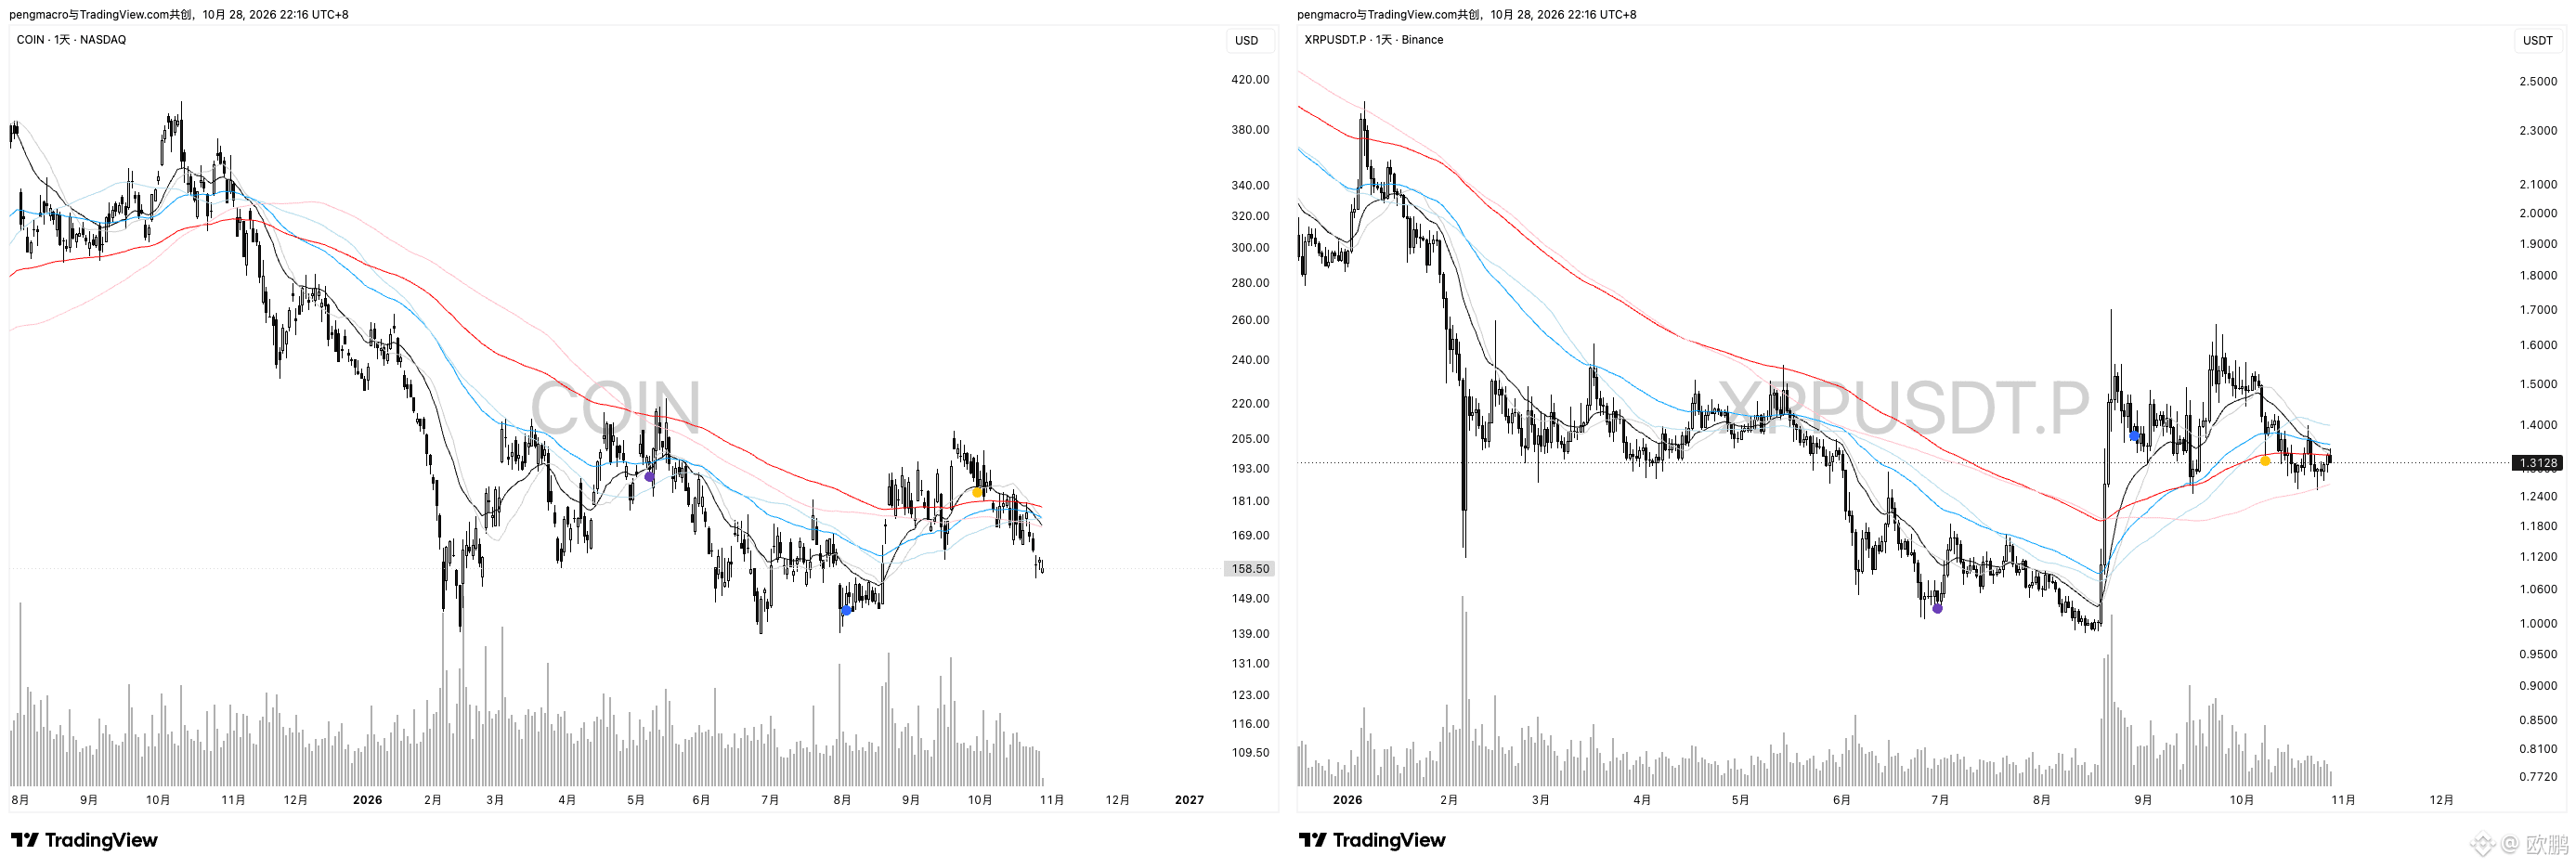
Ripple$XRP partnered with Coinbase $COIN to expand the use of its $RLUSD crypto stablecoin in trading, payments, and institutional finance.
These two are really underperforming. Let’s wait for the FOMC decision in four hours. The current probability that the Fed will keep interest rates unchanged in October is as high as 90.6%—bullish 🚀🚀
These two are really underperforming. Let’s wait for the FOMC decision in four hours. The current probability that the Fed will keep interest rates unchanged in October is as high as 90.6%—bullish 🚀🚀


欧鹏
·
--
Bullish$MSTR edged up slightly in premarket to around 140. According to my trading system, once the price moves back above all the moving averages, they’ll fan out bullishly again, opening up room to move higher.
The chip distribution points to the same conclusion: the last dense chip zone above the current price is the main resistance. If the price breaks through it decisively, chips are relatively sparse above, so the price could surge higher quickly.
MSTR and $BTC are both at key levels. Holding above the moving averages and breaking through the dense chip zone would be the confirmation signals 🚀🚀
欧鹏
·
--
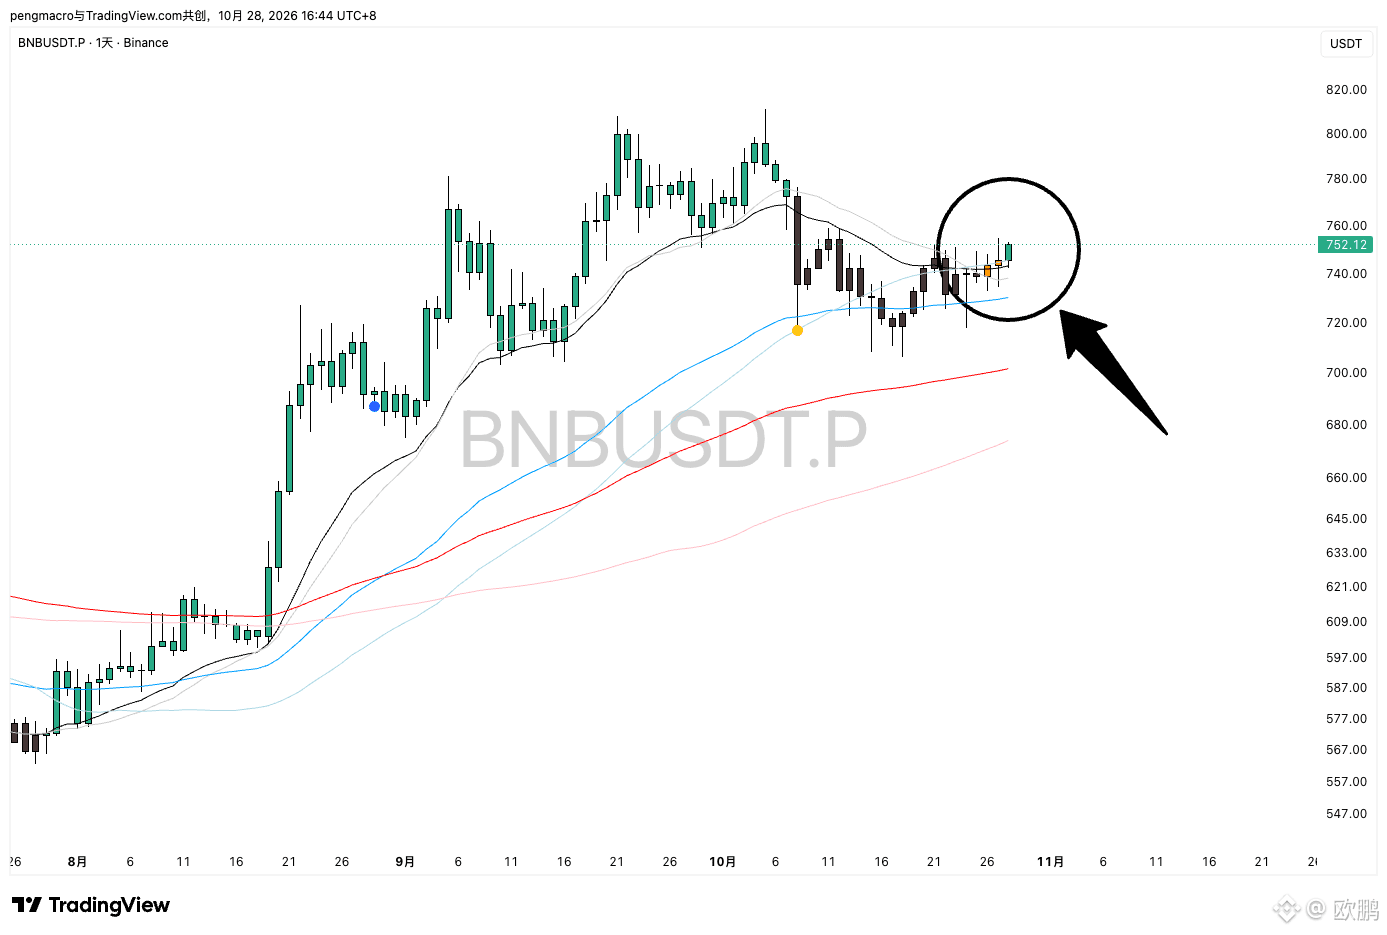
Bullish$BNB BNB price is currently near 745 and is slowly moving back above all moving averages.
From a structural perspective, once it can hold steady around $750, a short-term bullish divergence may form first, and upside room is expected to open up.
From a structural perspective, once it can hold steady around $750, a short-term bullish divergence may form first, and upside room is expected to open up.
Verified
欧鹏
·
--
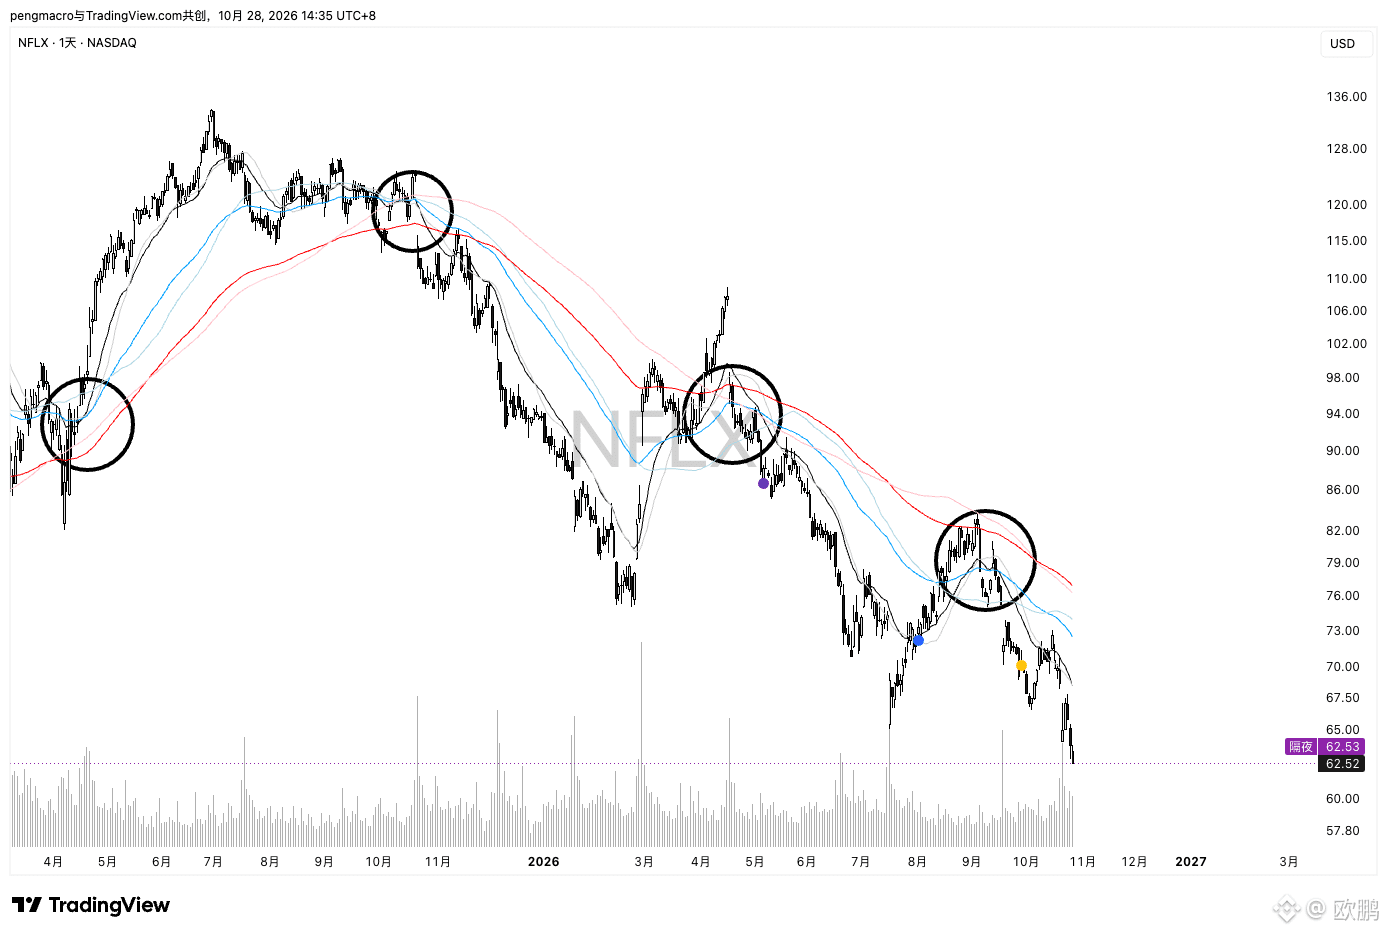
In financial markets, admitting you were wrong is incredibly difficult. It’s not just about money; pride plays a big part too—especially when you have some name recognition and a following.
If you realize you’ve fired all your bullets and can only sit tight and hope the price goes up, that’s the most dangerous position to be in. It means you’ve lost control of the situation. But the assets people usually hope will rise aren’t necessarily destined to keep going up in the long term. Once a stock has fallen 70% from its previous high, the odds of it returning to that high are already very low.
That’s why I advocate investing in assets that are *bound to rise over the long term*, such as the S&P $SPY and the Nasdaq $QQQ .
欧鹏
·
--
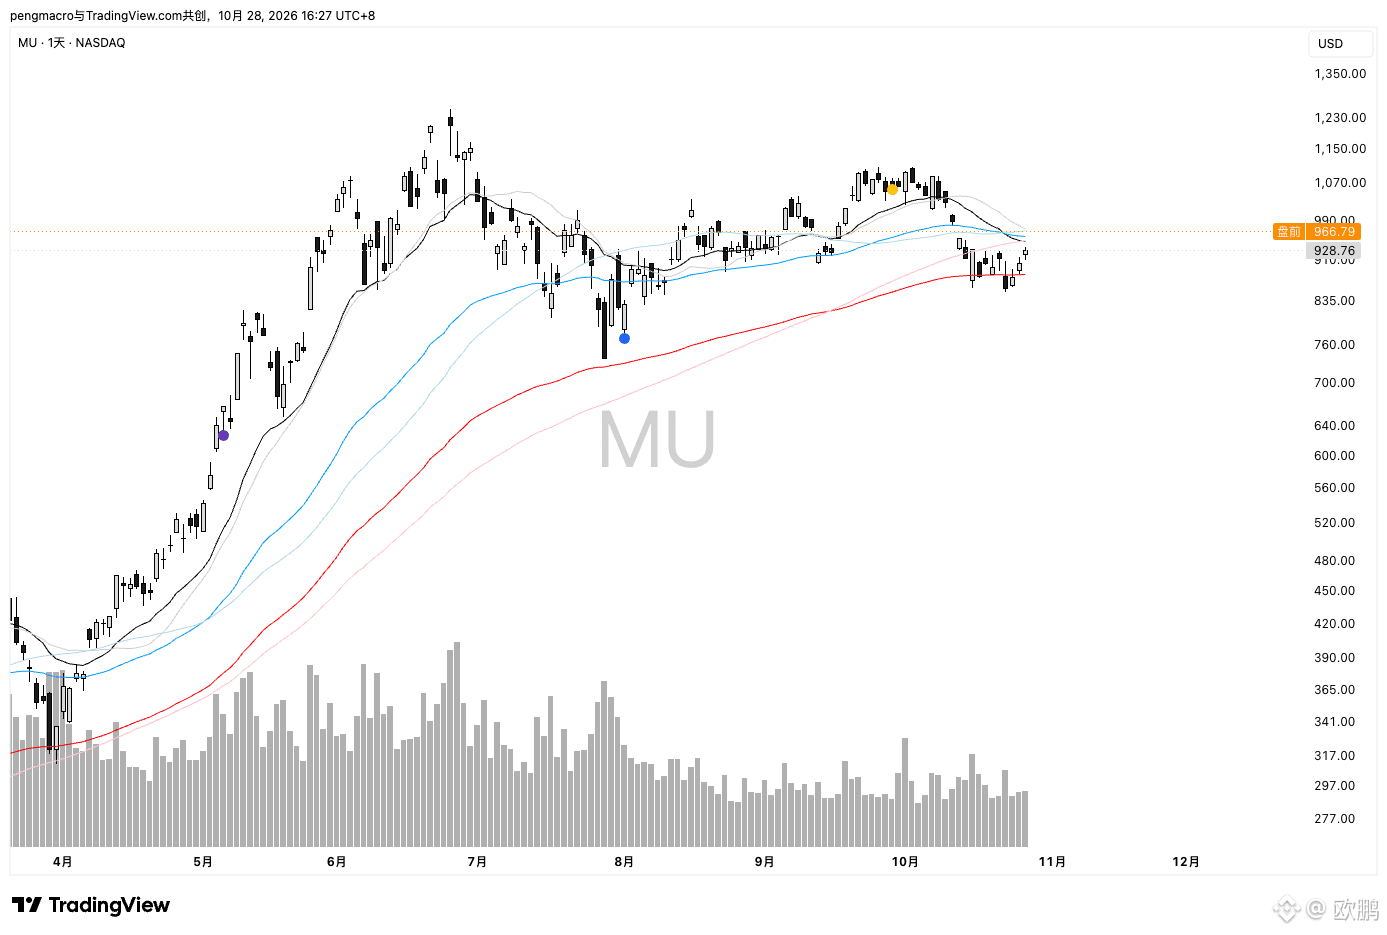
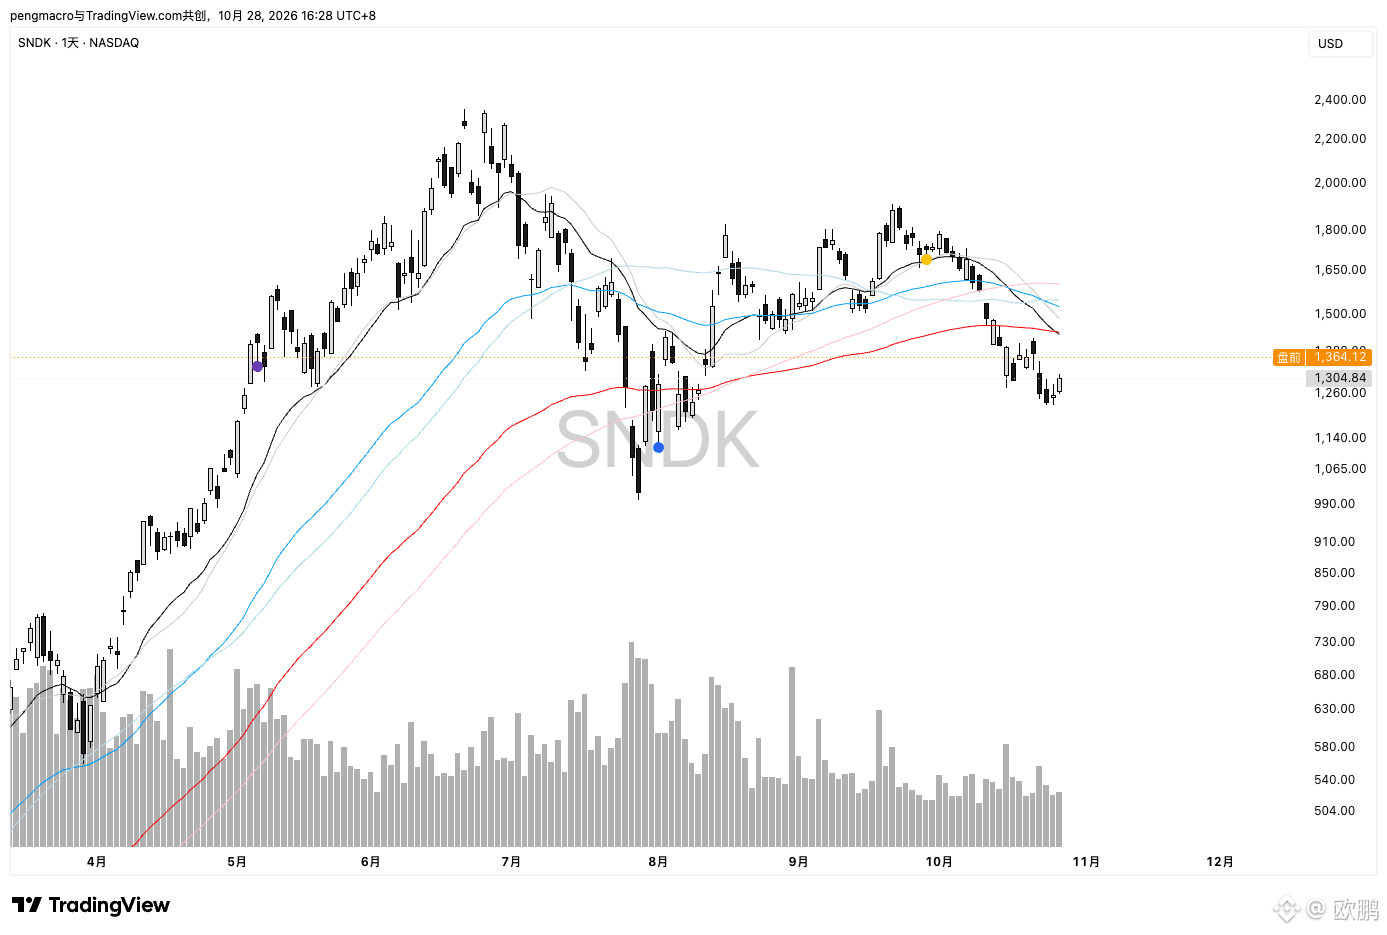
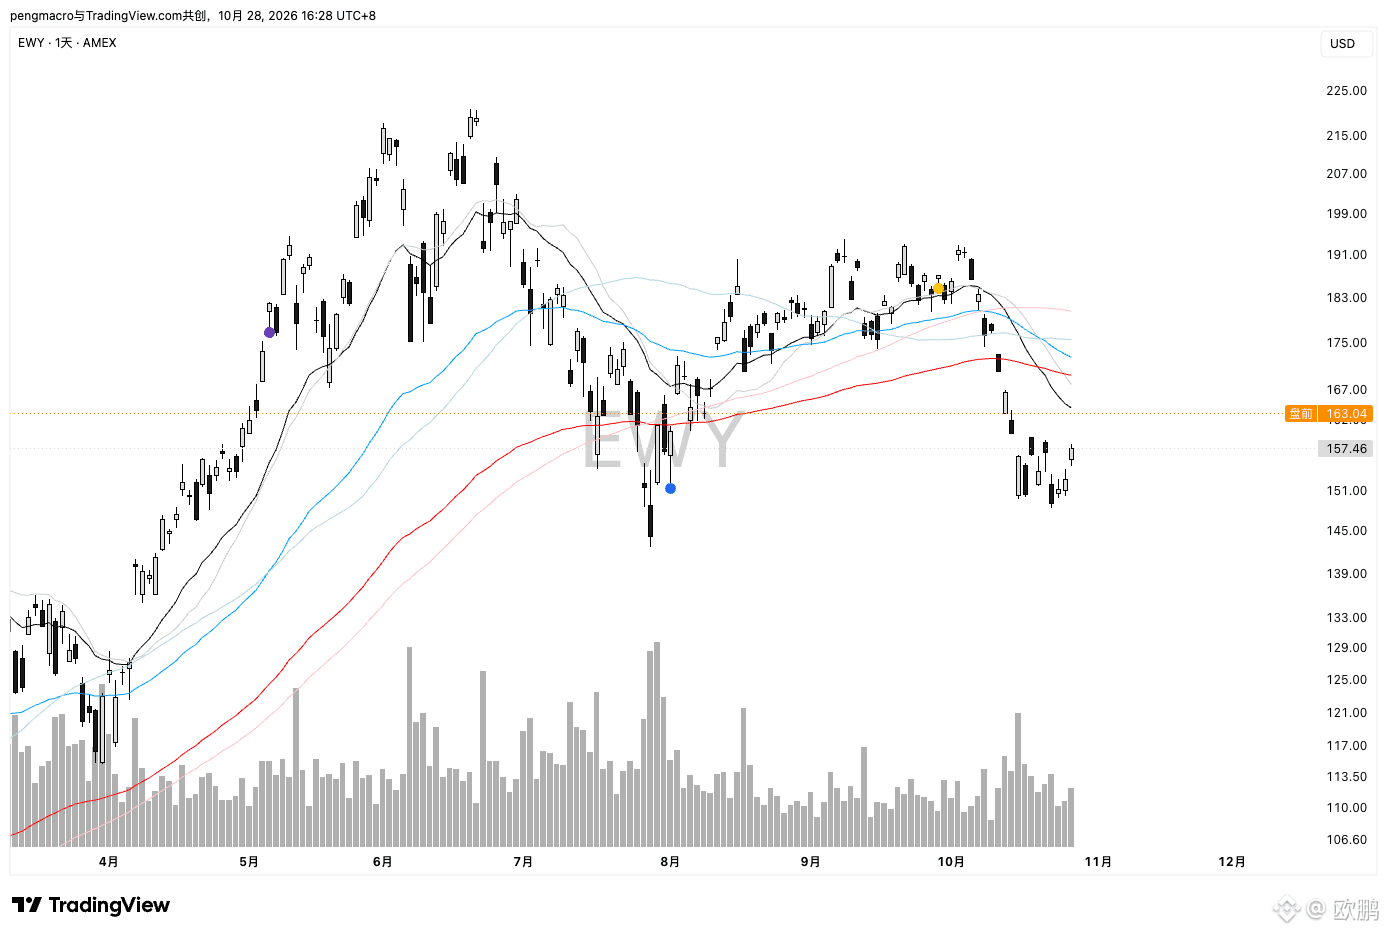
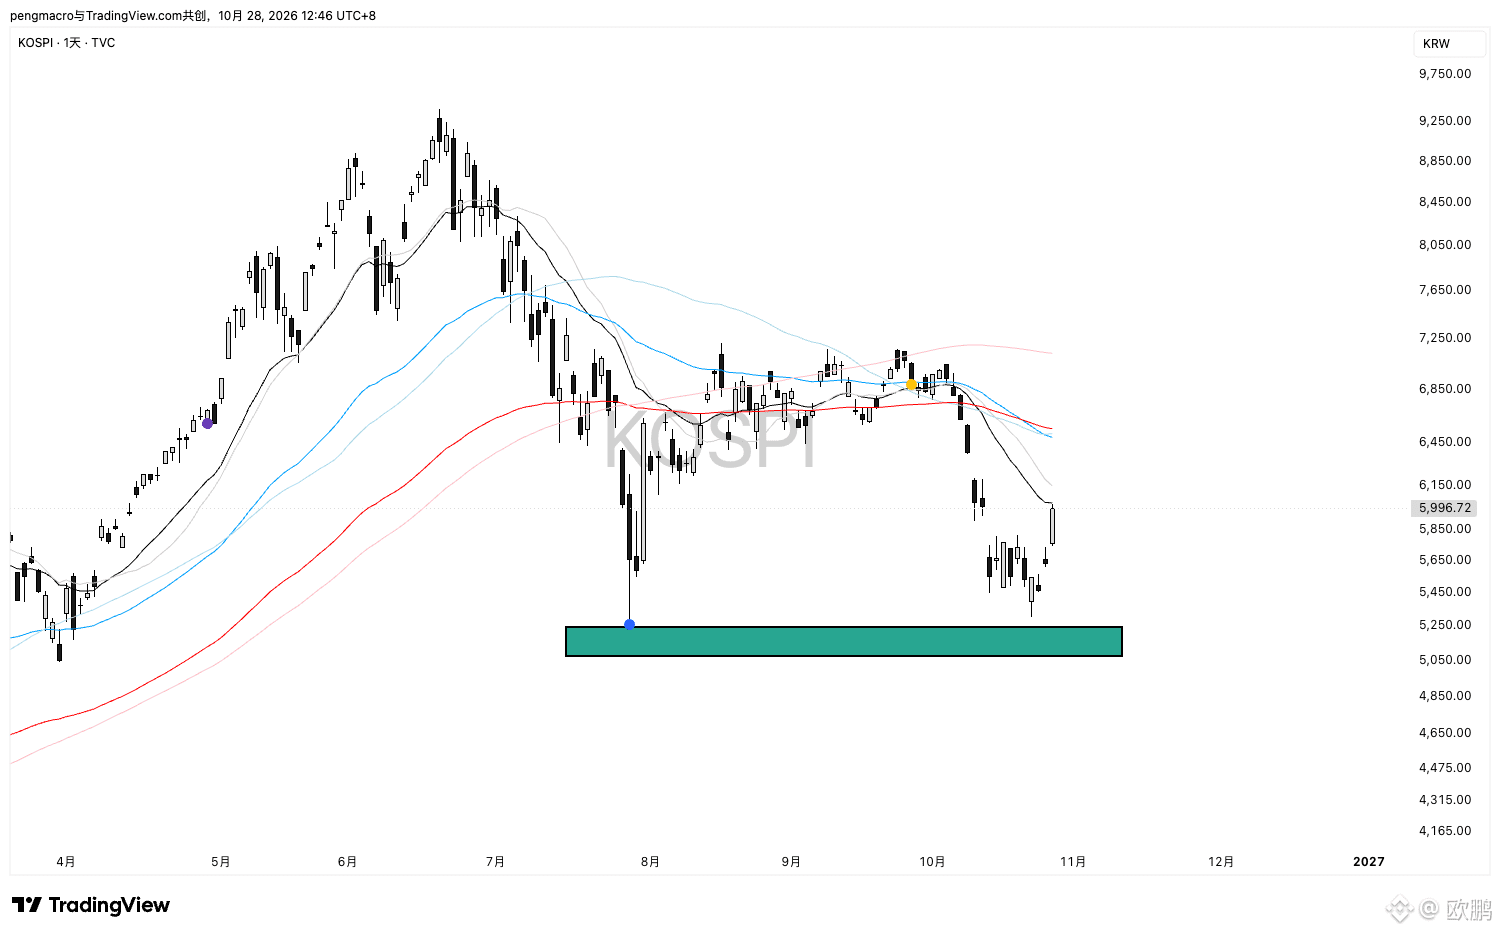
BullishIs a rebound coming? The Korea Exchange halted program buying for 5 minutes as the KOSPI ($EWY ) surged +4.7%. The Korean stock market added over 238 trillion won ($158 billion) 🚀🚀

Log in to explore more content