
NIGHTEYE
7.8k Posts

NIGHTEYE
Report
Block User
average gambler with daily signals and analysis daily market update and analysis @nighteye22 @sakibulefty2
Open Trade

AXIS Holder
Frequent Trader
5.8 Years
21 Following
2.6K+ Followers
4.4K+ Liked
Posts
Portfolio
All
Quotes
Videos
Live
PINNED
·
--
Bullish
Todays Trade result 📊
$AKE Short Tp hit 2 times ✅
$SOXL Long hit 1st Tp ✅
$ICNT short Full Tp ✅
$ZEC short full Tp ✅
failed trade
$ONE - well broke the level and pumped ❌
Running now
$SNDK Long 🟢
#SOXL long 🟢
#KOMA short 🔴
#IDOL potential short 🔴
Overall decent day today will share more if there is enough volume tomorrow 👀
{future}(ICNTUSDT)
{future}(SOXLUSDT)
{future}(AKEUSDT)
Todays Trade result 📊
$AKE Short Tp hit 2 times ✅
$SOXL Long hit 1st Tp ✅
$ICNT short Full Tp ✅
$ZEC short full Tp ✅
failed trade
$ONE - well broke the level and pumped ❌
Running now
$SNDK Long 🟢
#SOXL long 🟢
#KOMA short 🔴
#IDOL potential short 🔴
Overall decent day today will share more if there is enough volume tomorrow 👀
$AKE Short Tp hit 2 times ✅
$SOXL Long hit 1st Tp ✅
$ICNT short Full Tp ✅
$ZEC short full Tp ✅
failed trade
$ONE - well broke the level and pumped ❌
Running now
$SNDK Long 🟢
#SOXL long 🟢
#KOMA short 🔴
#IDOL potential short 🔴
Overall decent day today will share more if there is enough volume tomorrow 👀
1k
PINNED
·
--
Bearish
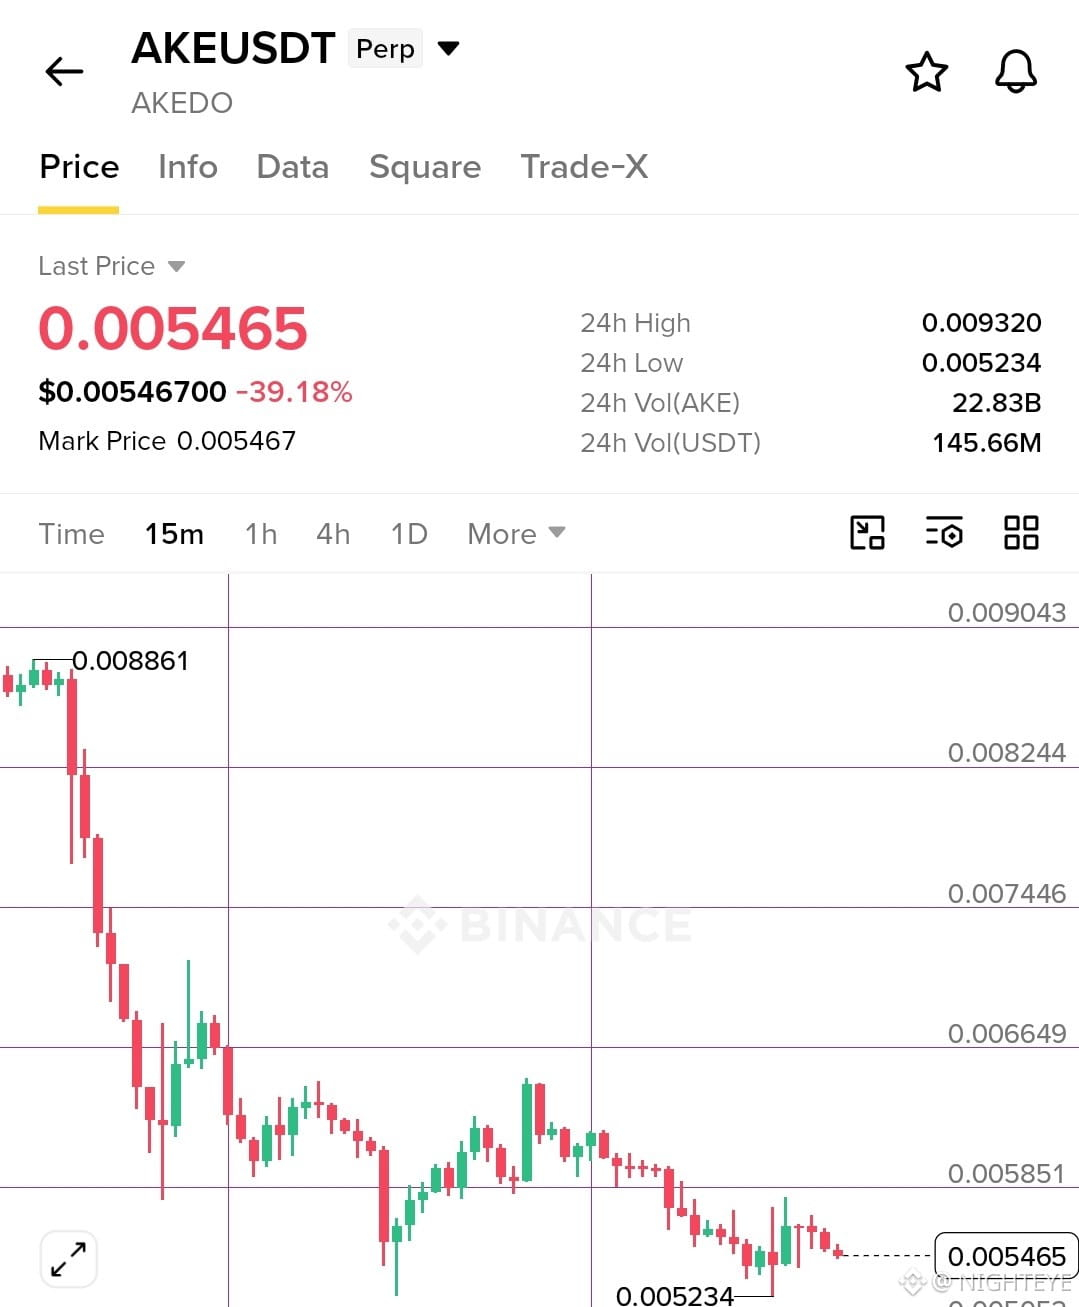
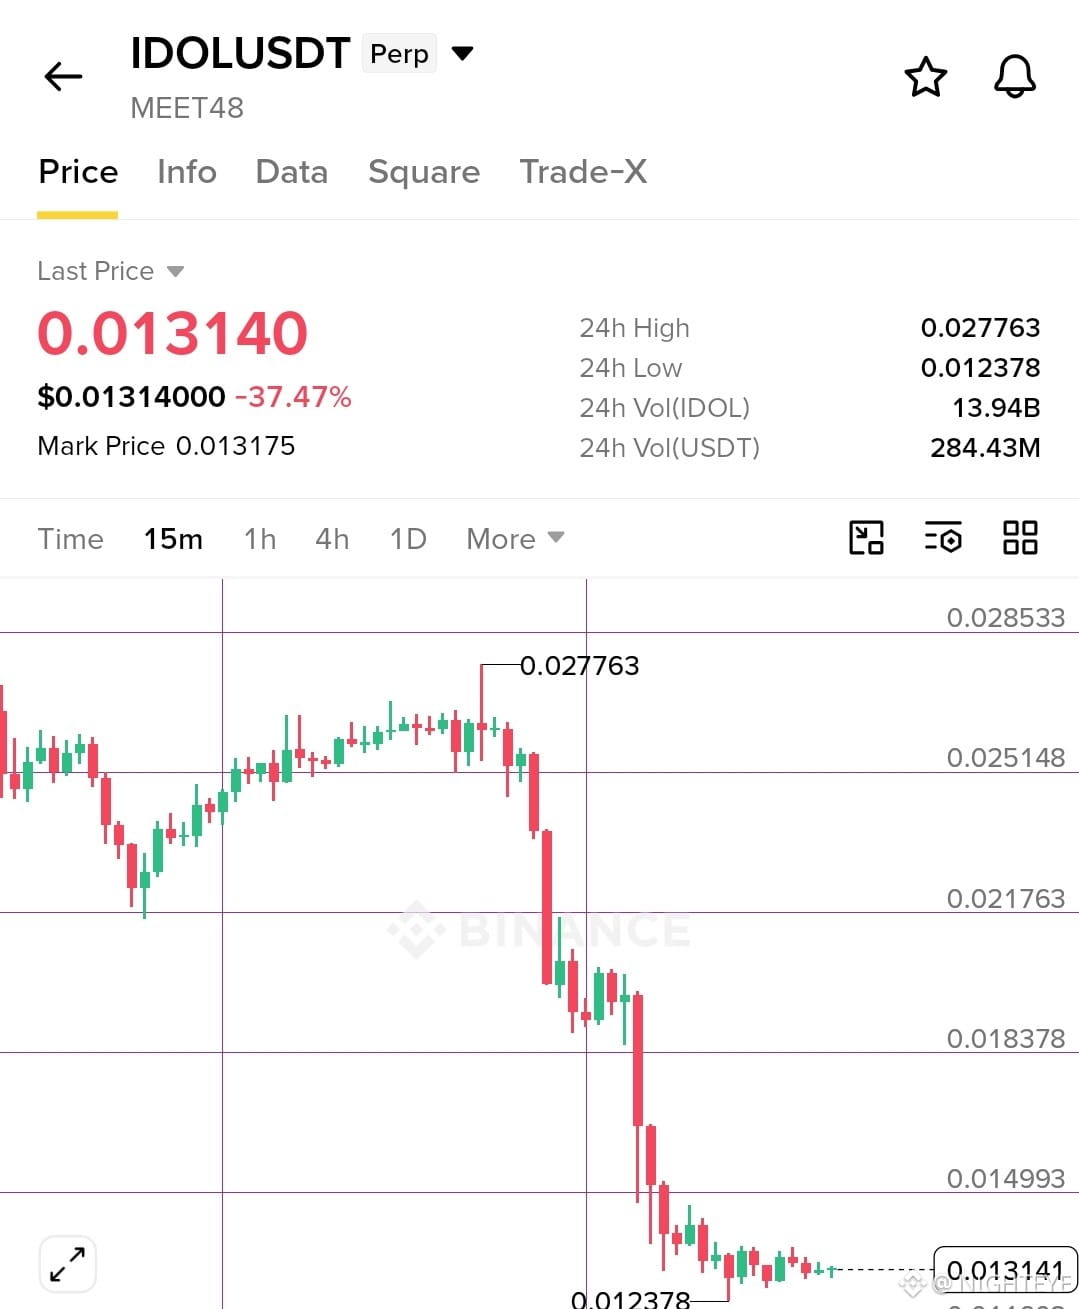
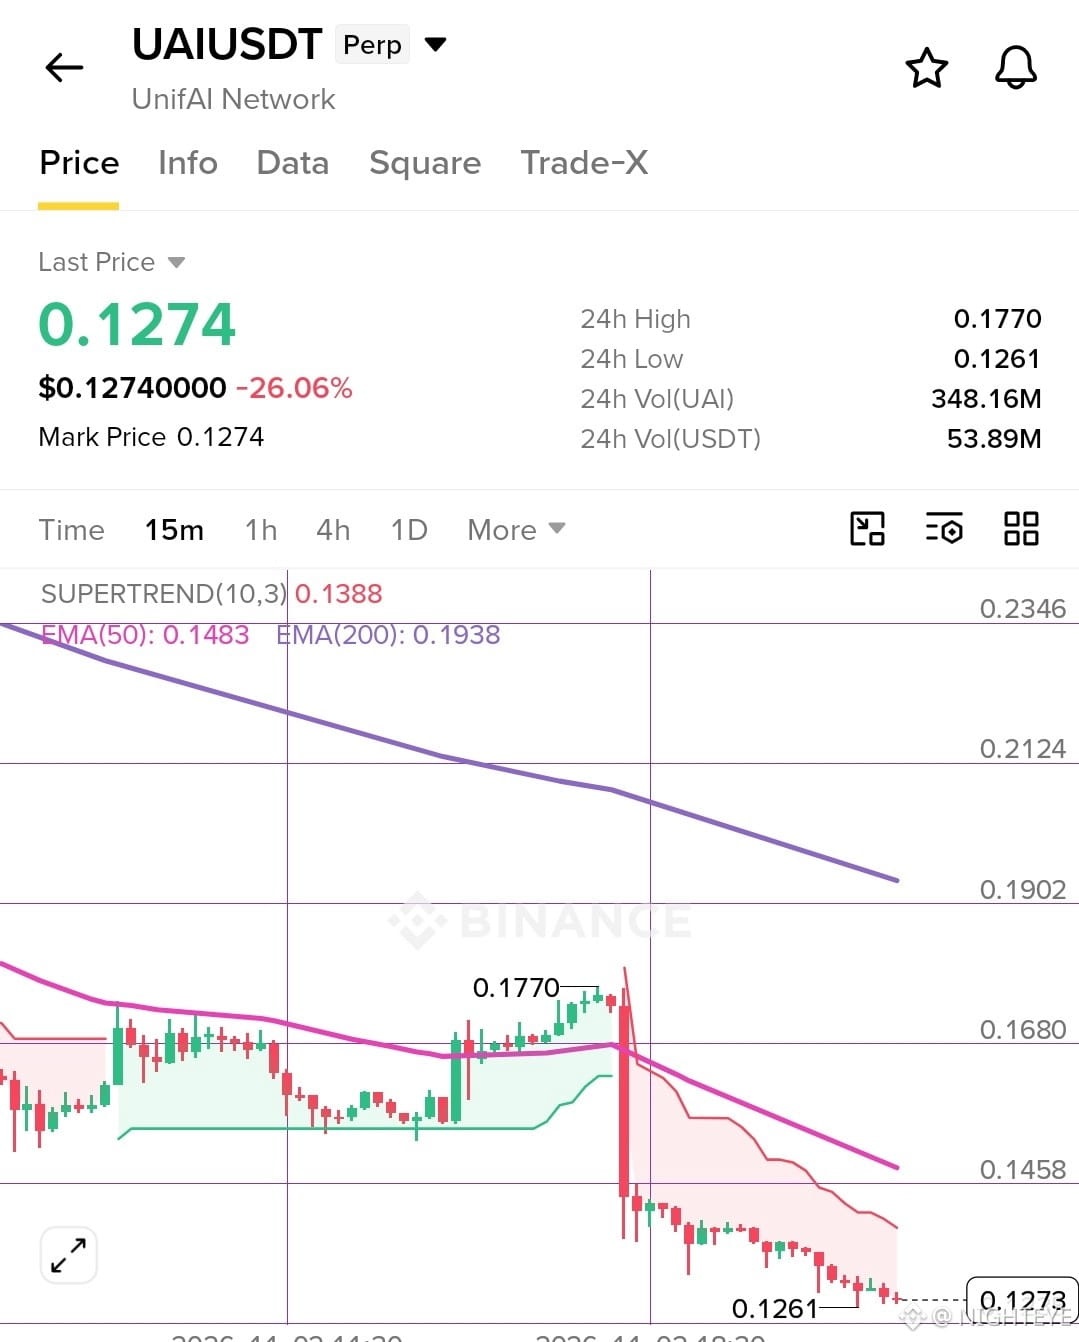
Three of the most manipulated tokens have drop hard in a week and it's not a coincidence that these are dropping in a same week.
Whales that is manipulating these tokens are a single entity who creates 100 accounts to manipulate these tokens. It has been going on for almost few years now. Previously these were just pump and dump in single day now they manipulate these tokens for months then in a single day they drop on retail traders.
Today $AKE , $IDOL and $UAI has gone down. tomorrow there will be new tokens yet again it's part of the game now. Retails like these tokens that's why you see huge volumes in these tokens.
$BTW also a next one which could go down.
{future}(UAIUSDT)
{future}(IDOLUSDT)
{future}(AKEUSDT)
Three of the most manipulated tokens have drop hard in a week and it's not a coincidence that these are dropping in a same week.
Whales that is manipulating these tokens are a single entity who creates 100 accounts to manipulate these tokens. It has been going on for almost few years now. Previously these were just pump and dump in single day now they manipulate these tokens for months then in a single day they drop on retail traders.
Today $AKE , $IDOL and $UAI has gone down. tomorrow there will be new tokens yet again it's part of the game now. Retails like these tokens that's why you see huge volumes in these tokens.
$BTW also a next one which could go down.
Whales that is manipulating these tokens are a single entity who creates 100 accounts to manipulate these tokens. It has been going on for almost few years now. Previously these were just pump and dump in single day now they manipulate these tokens for months then in a single day they drop on retail traders.
Today $AKE , $IDOL and $UAI has gone down. tomorrow there will be new tokens yet again it's part of the game now. Retails like these tokens that's why you see huge volumes in these tokens.
$BTW also a next one which could go down.
1.4k
·
--
Bearish
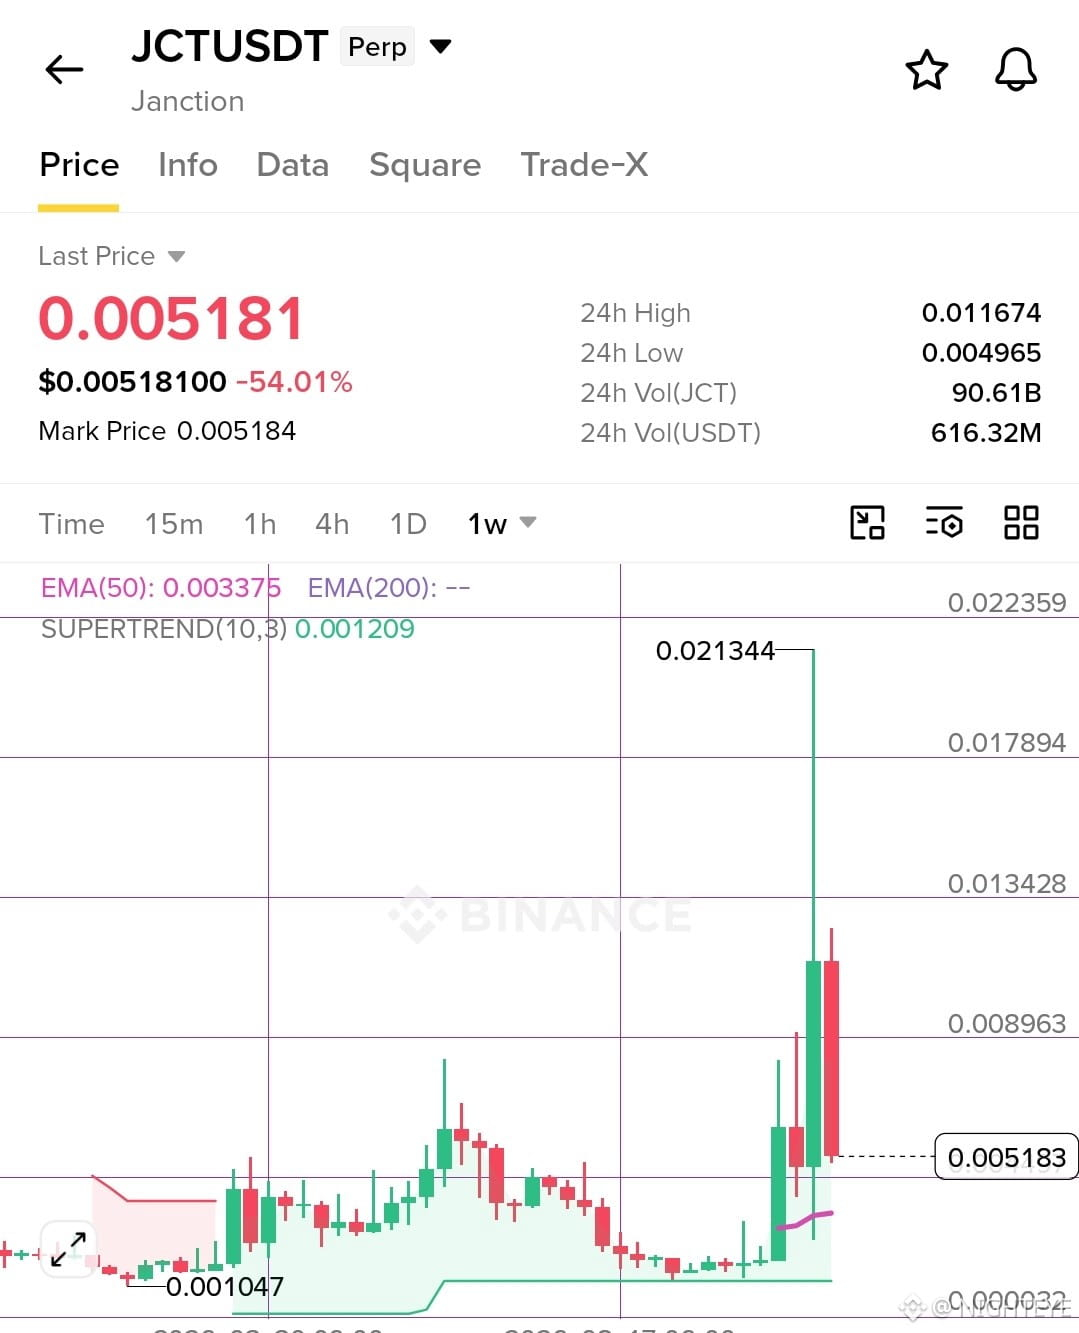
$JCT might drop more weekly candle looks very weak here.
{future}(JCTUSDT)
$JCT might drop more weekly candle looks very weak here.
308
·
--
Bearish
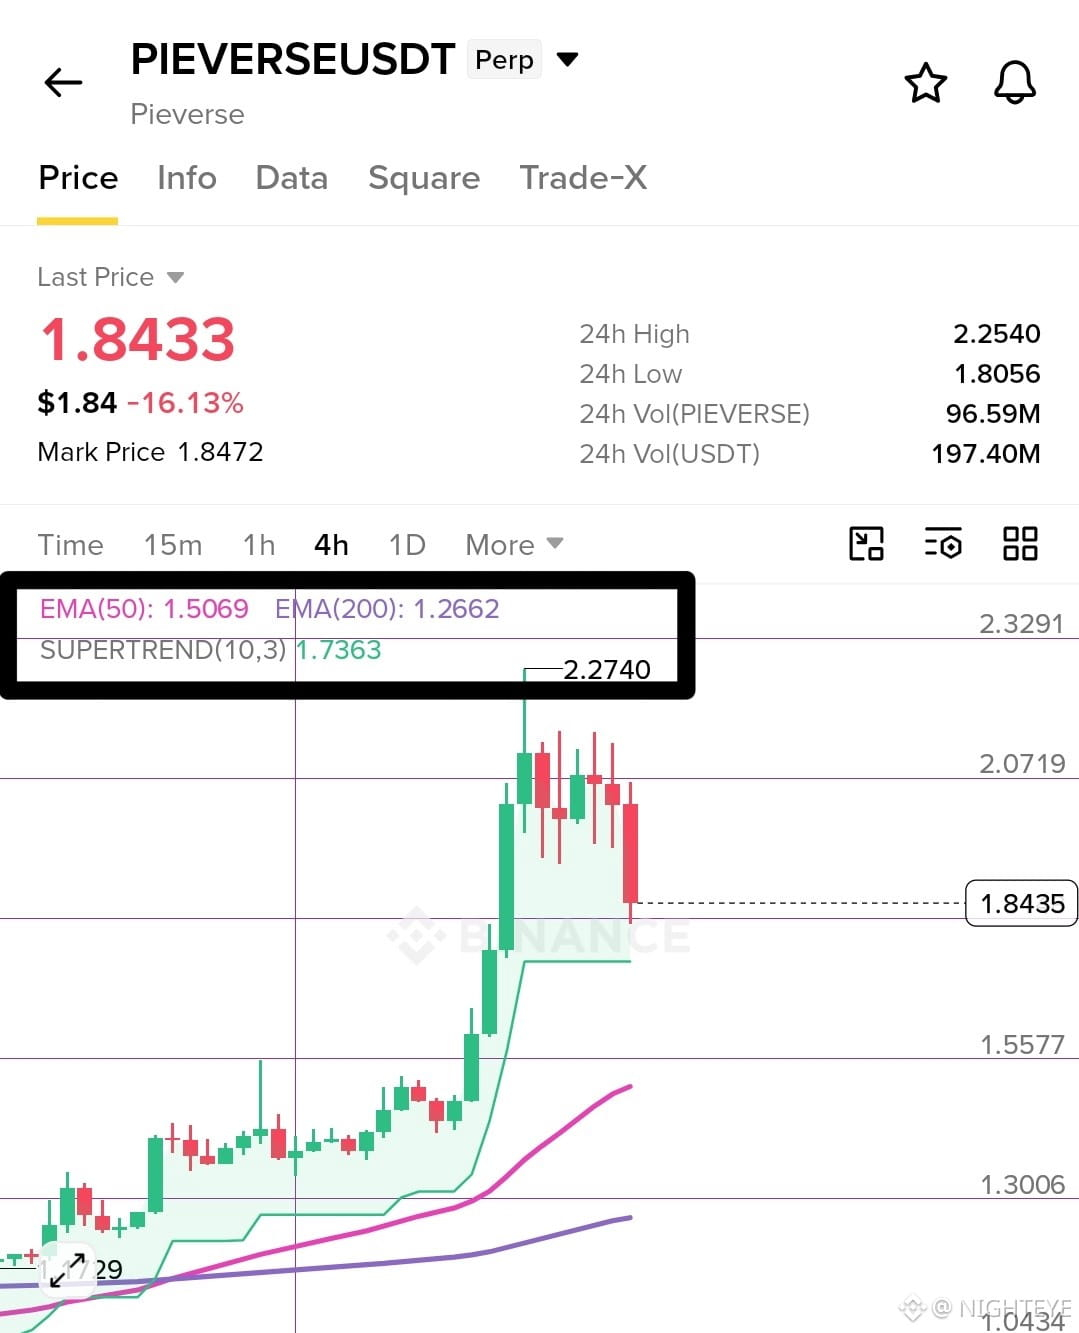
$PIEVERSE Short already hit the target i mentioned earlier 👀
Now i am watching for the next move and after daily candle we can have some confirmation. Right now $PIEVERSE is holding above the Supertrend 1.70$ area and we can see a drop in this area. If it fail to hold the level then we can see further drop towards 50 EMA 1.50$ area.
If you already took the trade book prodfit and hold some or else wait for clear decision point.
{future}(PIEVERSEUSDT)
$PIEVERSE Short already hit the target i mentioned earlier 👀
Now i am watching for the next move and after daily candle we can have some confirmation. Right now $PIEVERSE is holding above the Supertrend 1.70$ area and we can see a drop in this area. If it fail to hold the level then we can see further drop towards 50 EMA 1.50$ area.
If you already took the trade book prodfit and hold some or else wait for clear decision point.
Now i am watching for the next move and after daily candle we can have some confirmation. Right now $PIEVERSE is holding above the Supertrend 1.70$ area and we can see a drop in this area. If it fail to hold the level then we can see further drop towards 50 EMA 1.50$ area.
If you already took the trade book prodfit and hold some or else wait for clear decision point.
219
·
--
Bearish
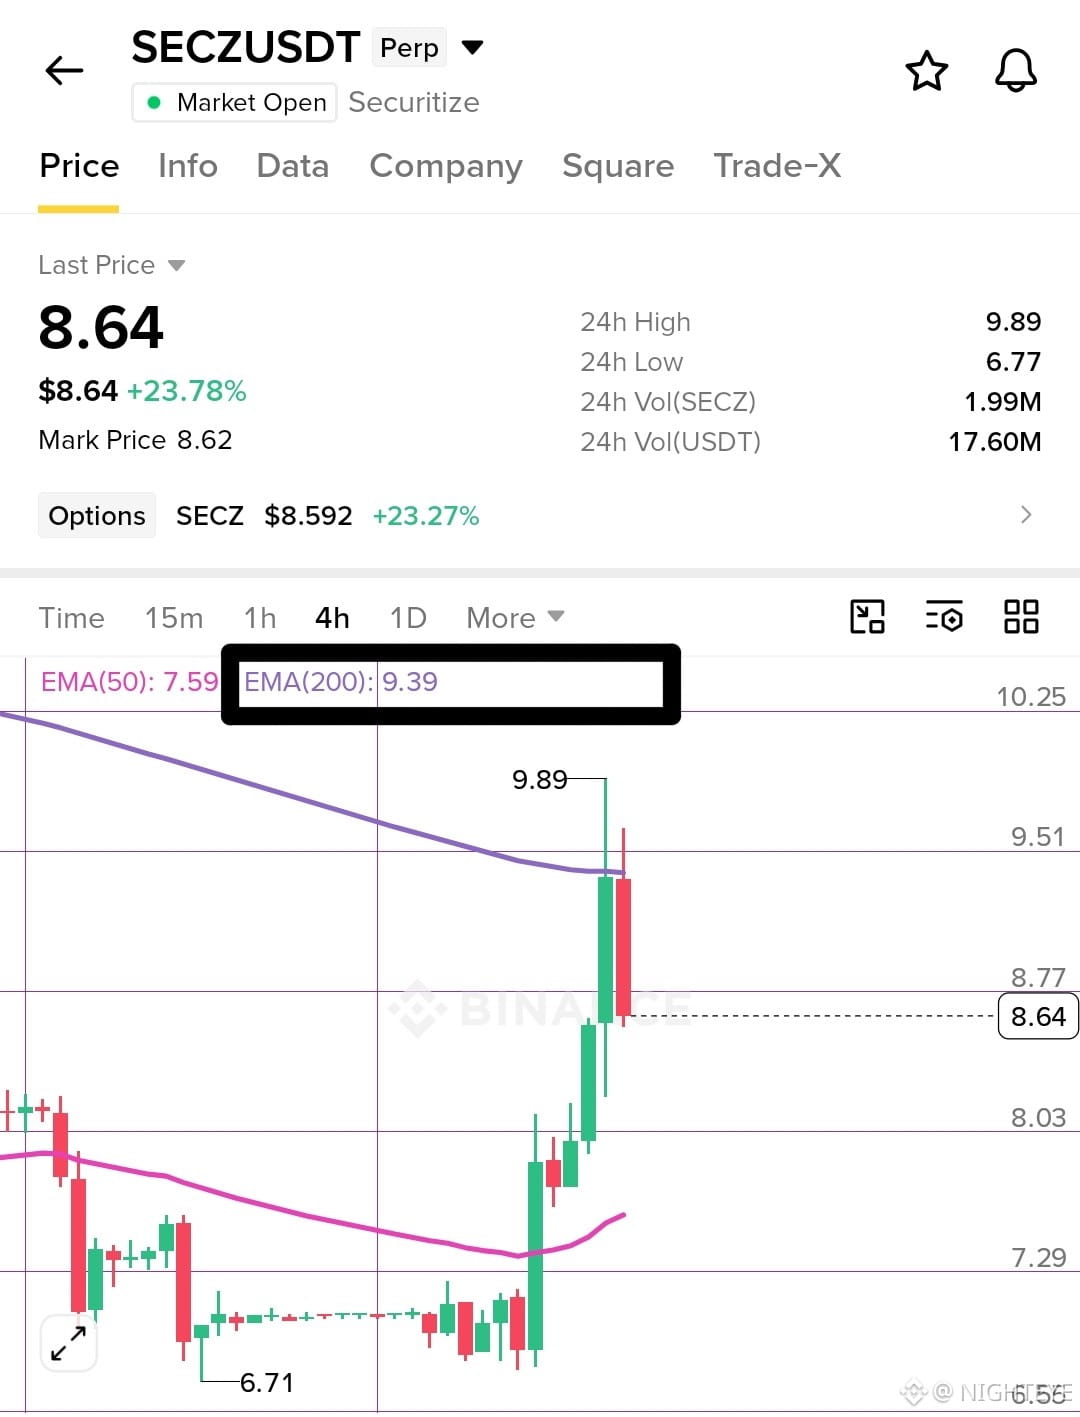
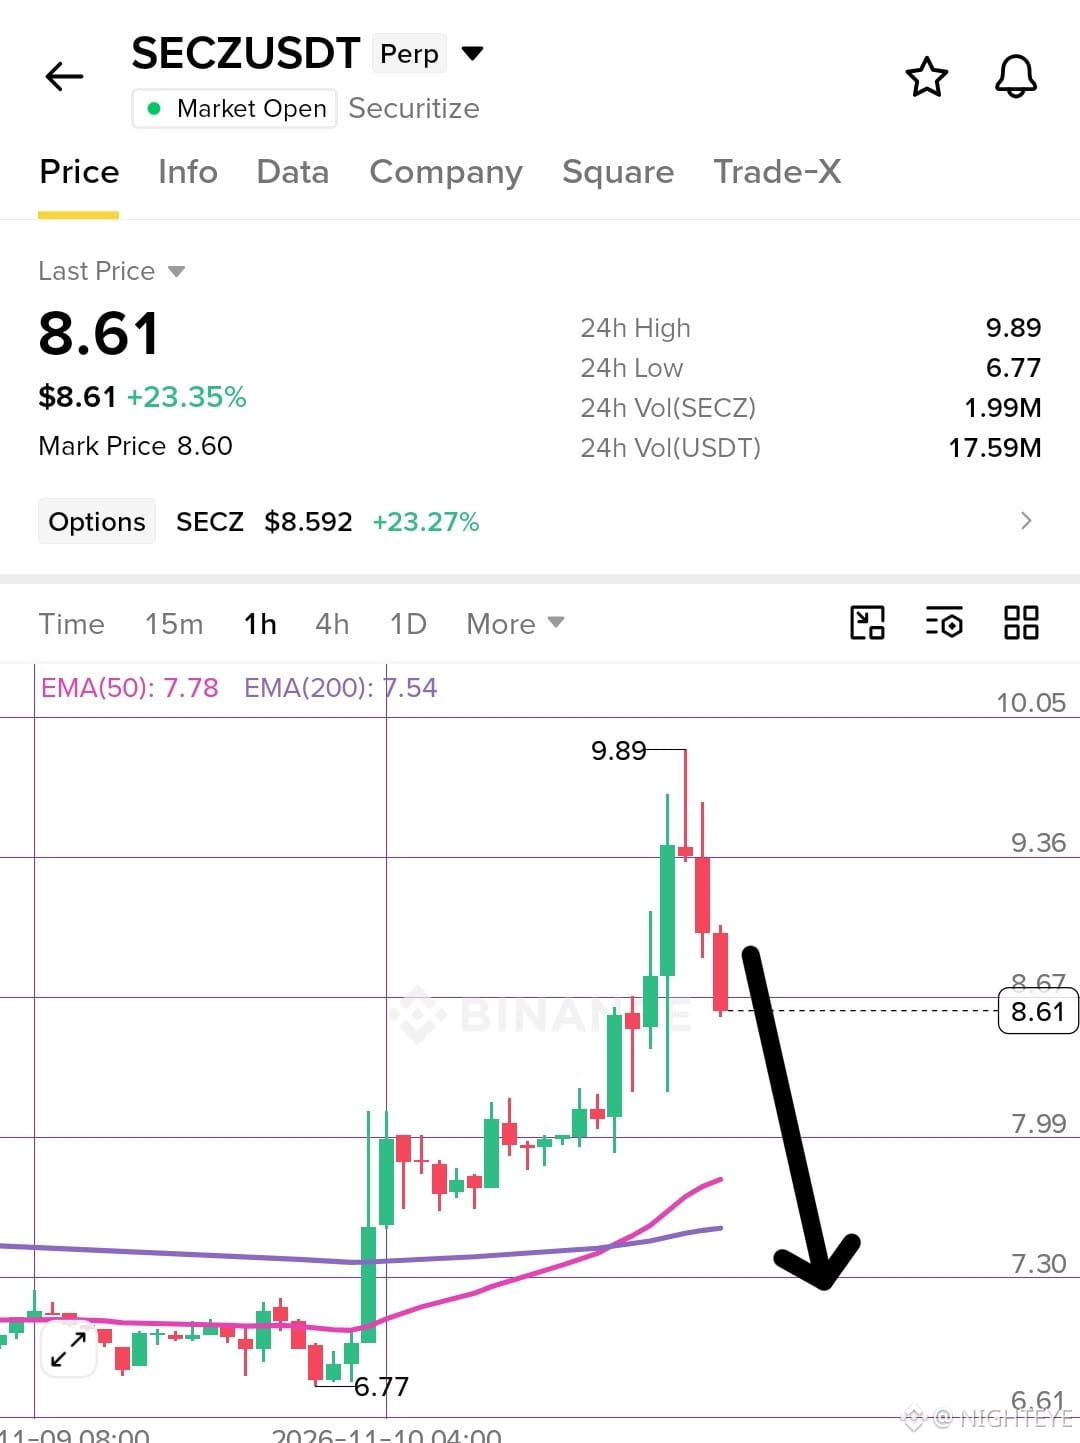
Open a short on $SECZ 200 EMA rejection is here woth low volume so expecting some drop here 🔴
Entry- 8.70-9.20
SL- 10
TP - 8.3-8.0-7.6
{future}(SECZUSDT)
Open a short on $SECZ 200 EMA rejection is here woth low volume so expecting some drop here 🔴
Entry- 8.70-9.20
SL- 10
TP - 8.3-8.0-7.6
Entry- 8.70-9.20
SL- 10
TP - 8.3-8.0-7.6
98
·
--
Bearish
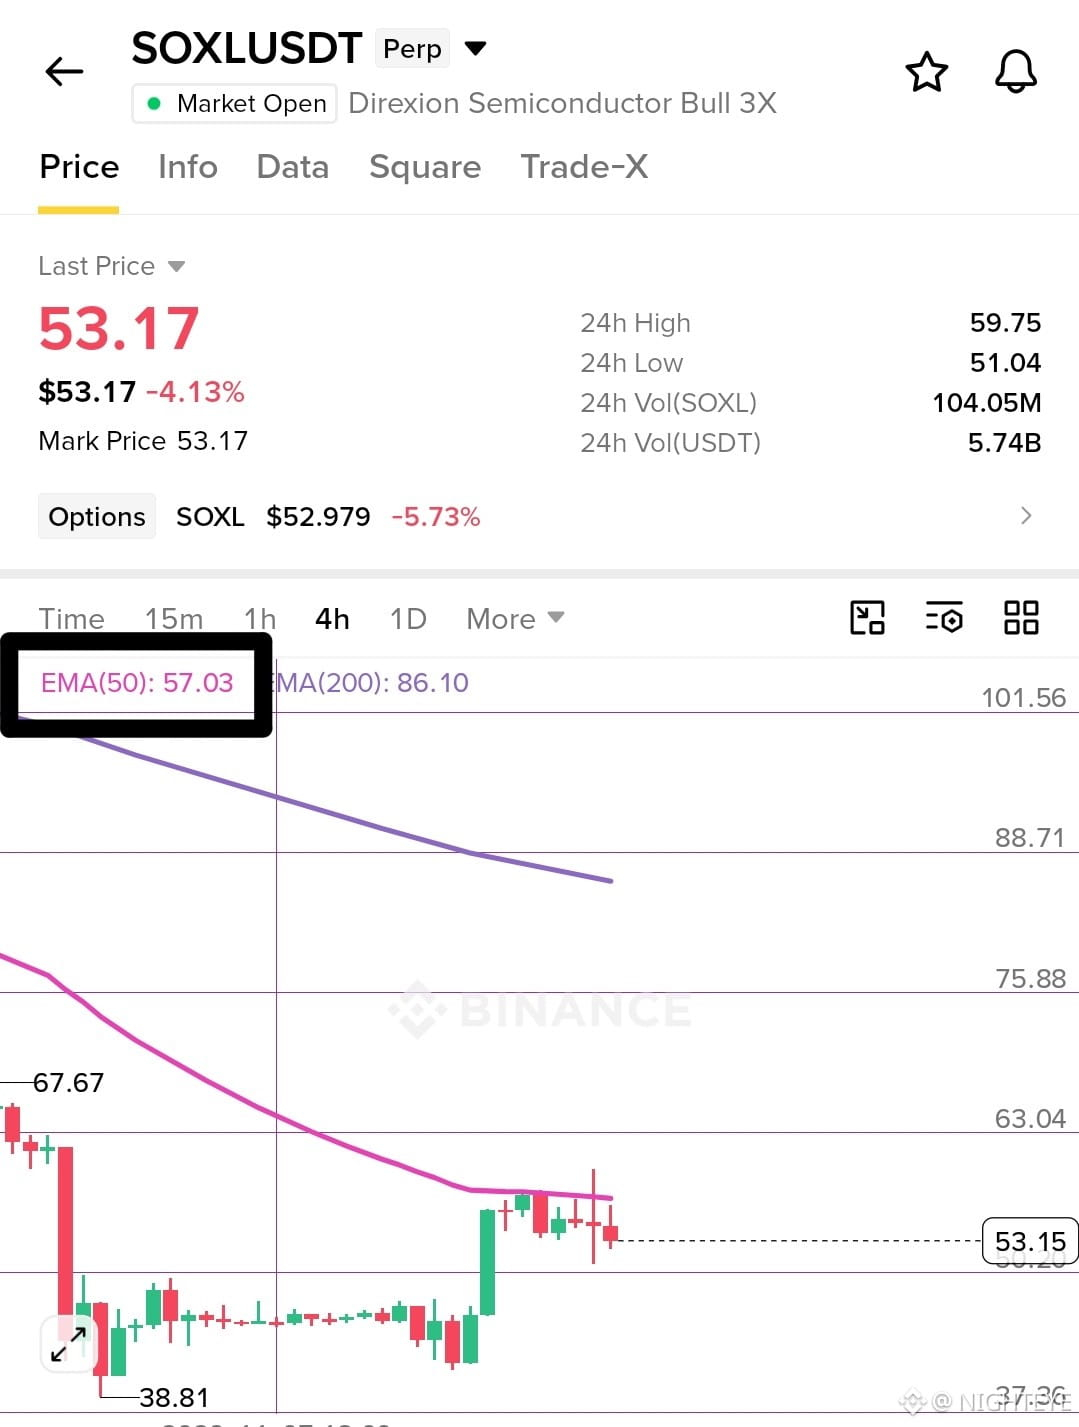
Open a short on $SOXL Sharp rejection on 50 EMA can trigger a break down now 🔴
Entry- 53-56
SL- 62
TP - 51-49-47
{future}(SOXLUSDT)
Open a short on $SOXL Sharp rejection on 50 EMA can trigger a break down now 🔴
Entry- 53-56
SL- 62
TP - 51-49-47
Entry- 53-56
SL- 62
TP - 51-49-47
421
·
--
Bearish
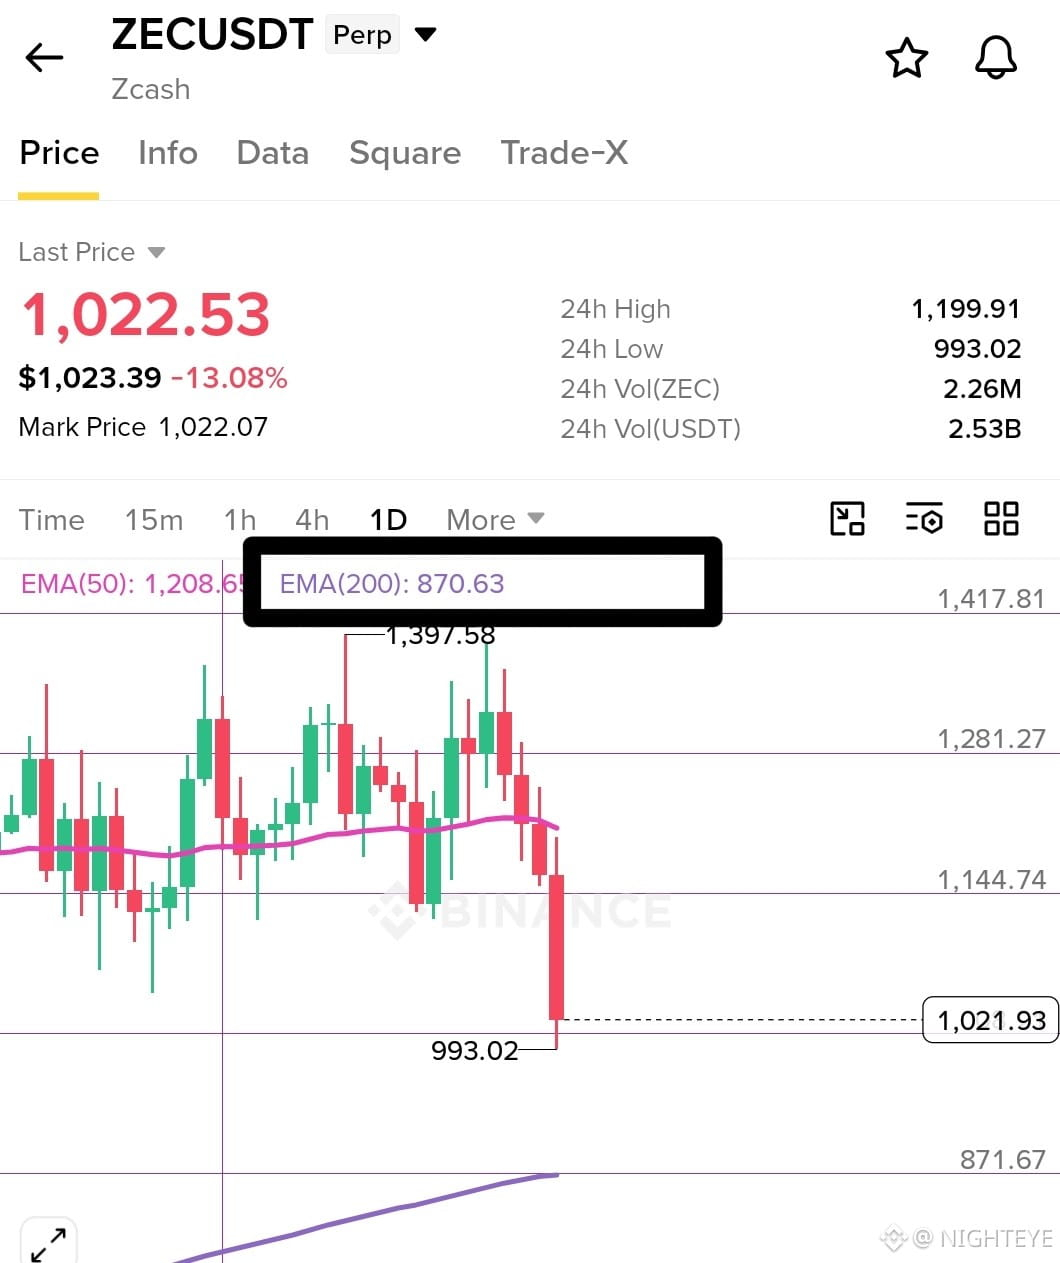
I didn't expect $ZEC to drop this much today in just few hours. Earlier we saw some movement in this token but hard rejection trigger this huge break down bacause of the market condition.
Now $ZEC is entering the final support area towards 200 EMA - 870-900$ area. This is the next important support level.
Once $ZEC breaks the 1000$ area then it will easily drop towards the EMA 200.
Market condition is not good so expect to see more drop soon.
{future}(ZECUSDT)
I didn't expect $ZEC to drop this much today in just few hours. Earlier we saw some movement in this token but hard rejection trigger this huge break down bacause of the market condition.
Now $ZEC is entering the final support area towards 200 EMA - 870-900$ area. This is the next important support level.
Once $ZEC breaks the 1000$ area then it will easily drop towards the EMA 200.
Market condition is not good so expect to see more drop soon.
Now $ZEC is entering the final support area towards 200 EMA - 870-900$ area. This is the next important support level.
Once $ZEC breaks the 1000$ area then it will easily drop towards the EMA 200.
Market condition is not good so expect to see more drop soon.
361
·
--
Bearish
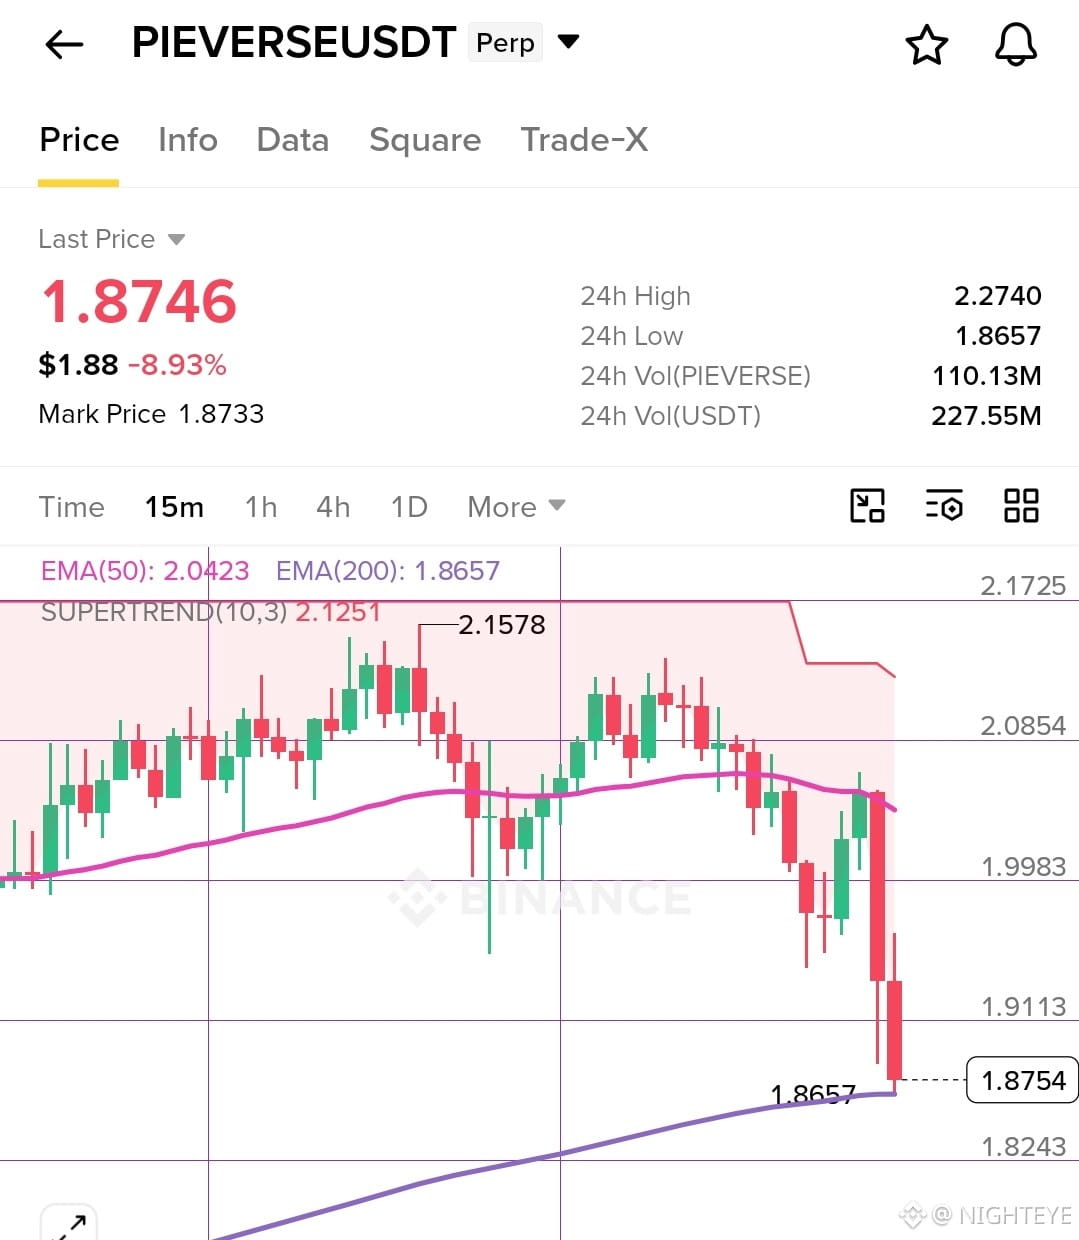
$PIEVERSE short Tp hit ✅
Price dropped fafter failing to hold above 2$ level ❌
{future}(PIEVERSEUSDT)
$PIEVERSE short Tp hit ✅
Price dropped fafter failing to hold above 2$ level ❌
Price dropped fafter failing to hold above 2$ level ❌
NIGHTEYE
·
--
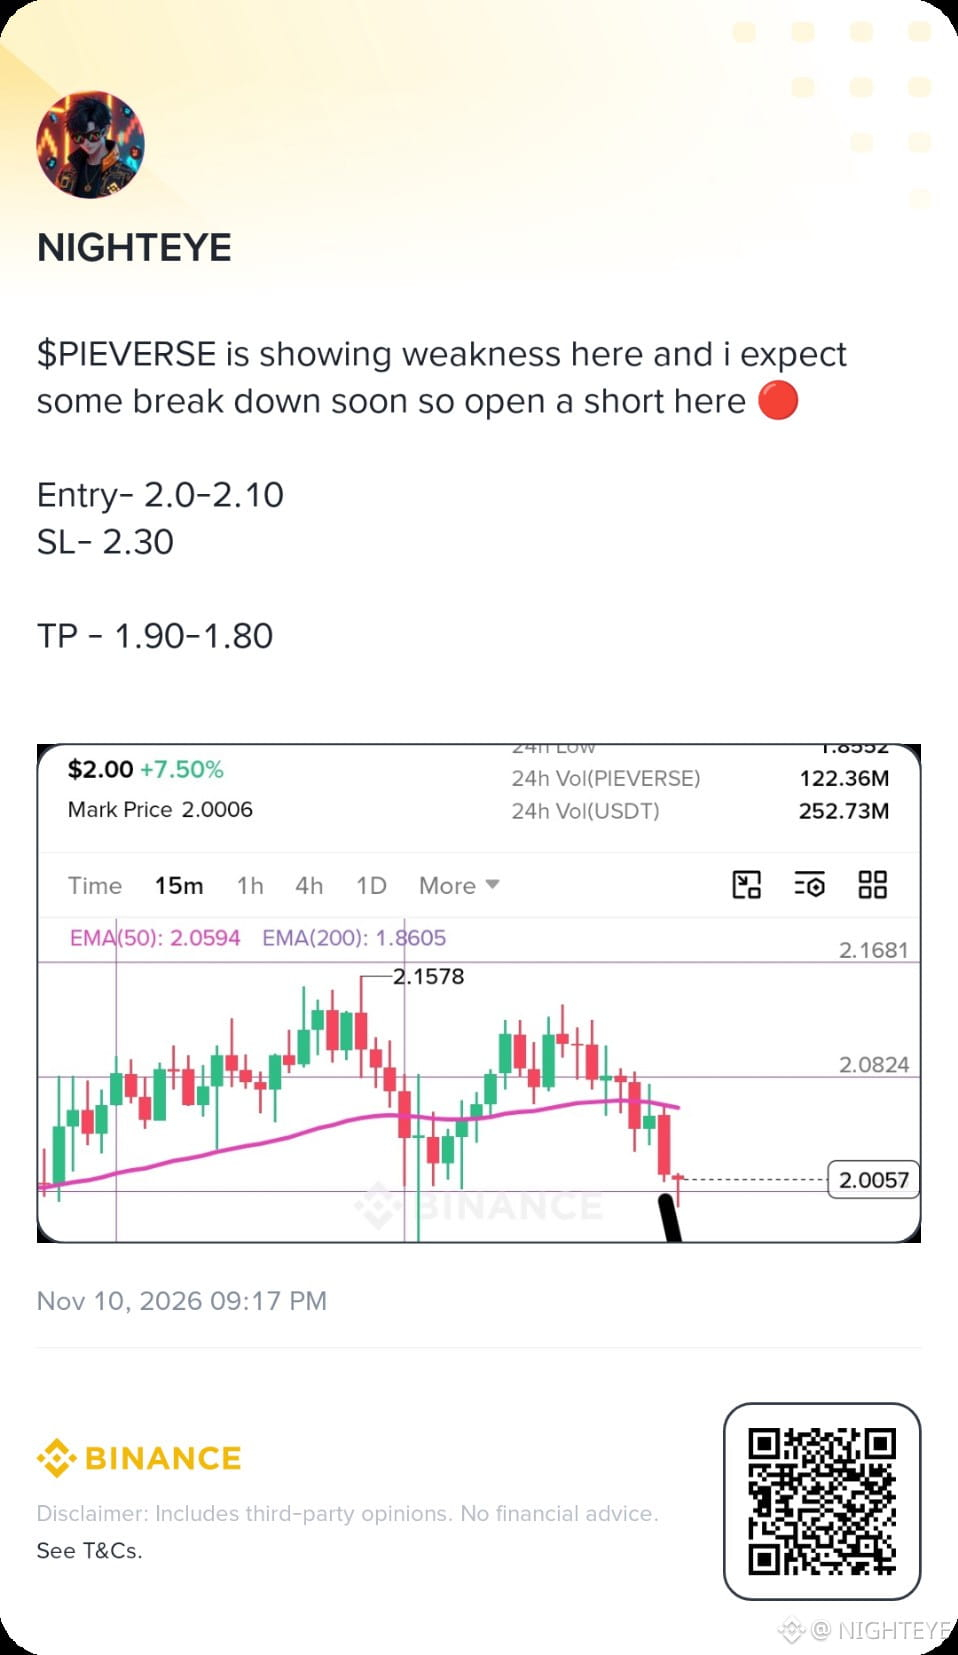
Bearish$PIEVERSE is showing weakness here and i expect some break down soon so open a short here 🔴
Entry- 2.0-2.10
SL- 2.30
TP - 1.90-1.80
Entry- 2.0-2.10
SL- 2.30
TP - 1.90-1.80
293
·
--
Bullish
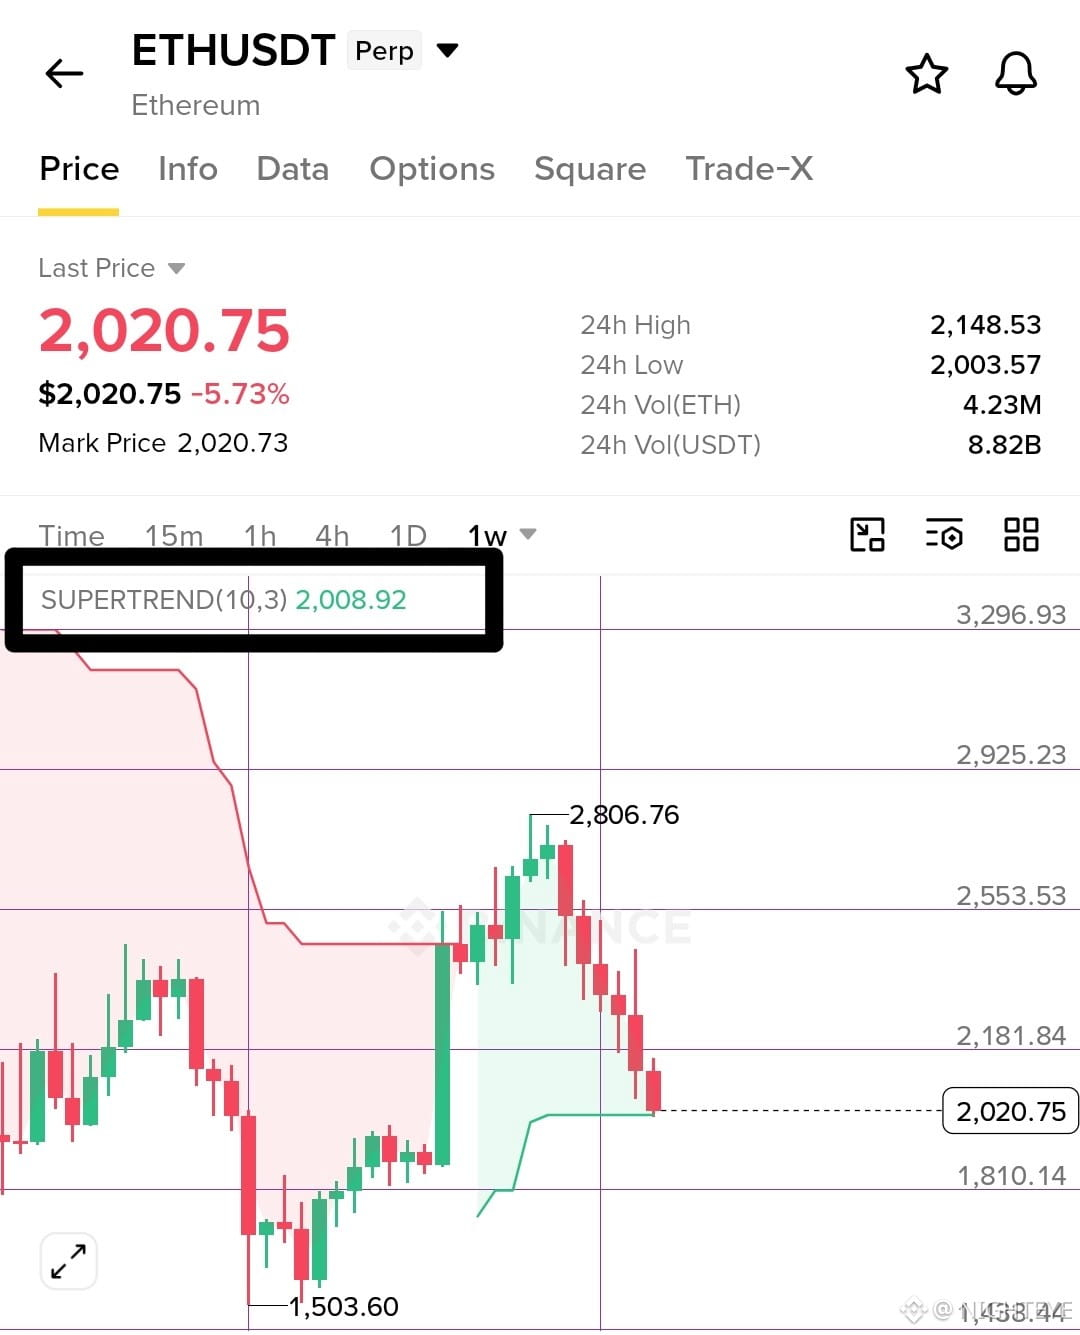
$ETH
Currently it has enter a very strong support range and the next decision depends on how this zone will hold now.
Supertrend area 2000$ area is the petfect entry zone for $ETH now. While market is currentlg going down but it is the perfect time for taling entry and this time we can see some strong bounce from here.
So buy the dip and hold 🚀
{future}(ETHUSDT)
$ETH
Currently it has enter a very strong support range and the next decision depends on how this zone will hold now.
Supertrend area 2000$ area is the petfect entry zone for $ETH now. While market is currentlg going down but it is the perfect time for taling entry and this time we can see some strong bounce from here.
So buy the dip and hold 🚀
Currently it has enter a very strong support range and the next decision depends on how this zone will hold now.
Supertrend area 2000$ area is the petfect entry zone for $ETH now. While market is currentlg going down but it is the perfect time for taling entry and this time we can see some strong bounce from here.
So buy the dip and hold 🚀
177
·
--
Bearish
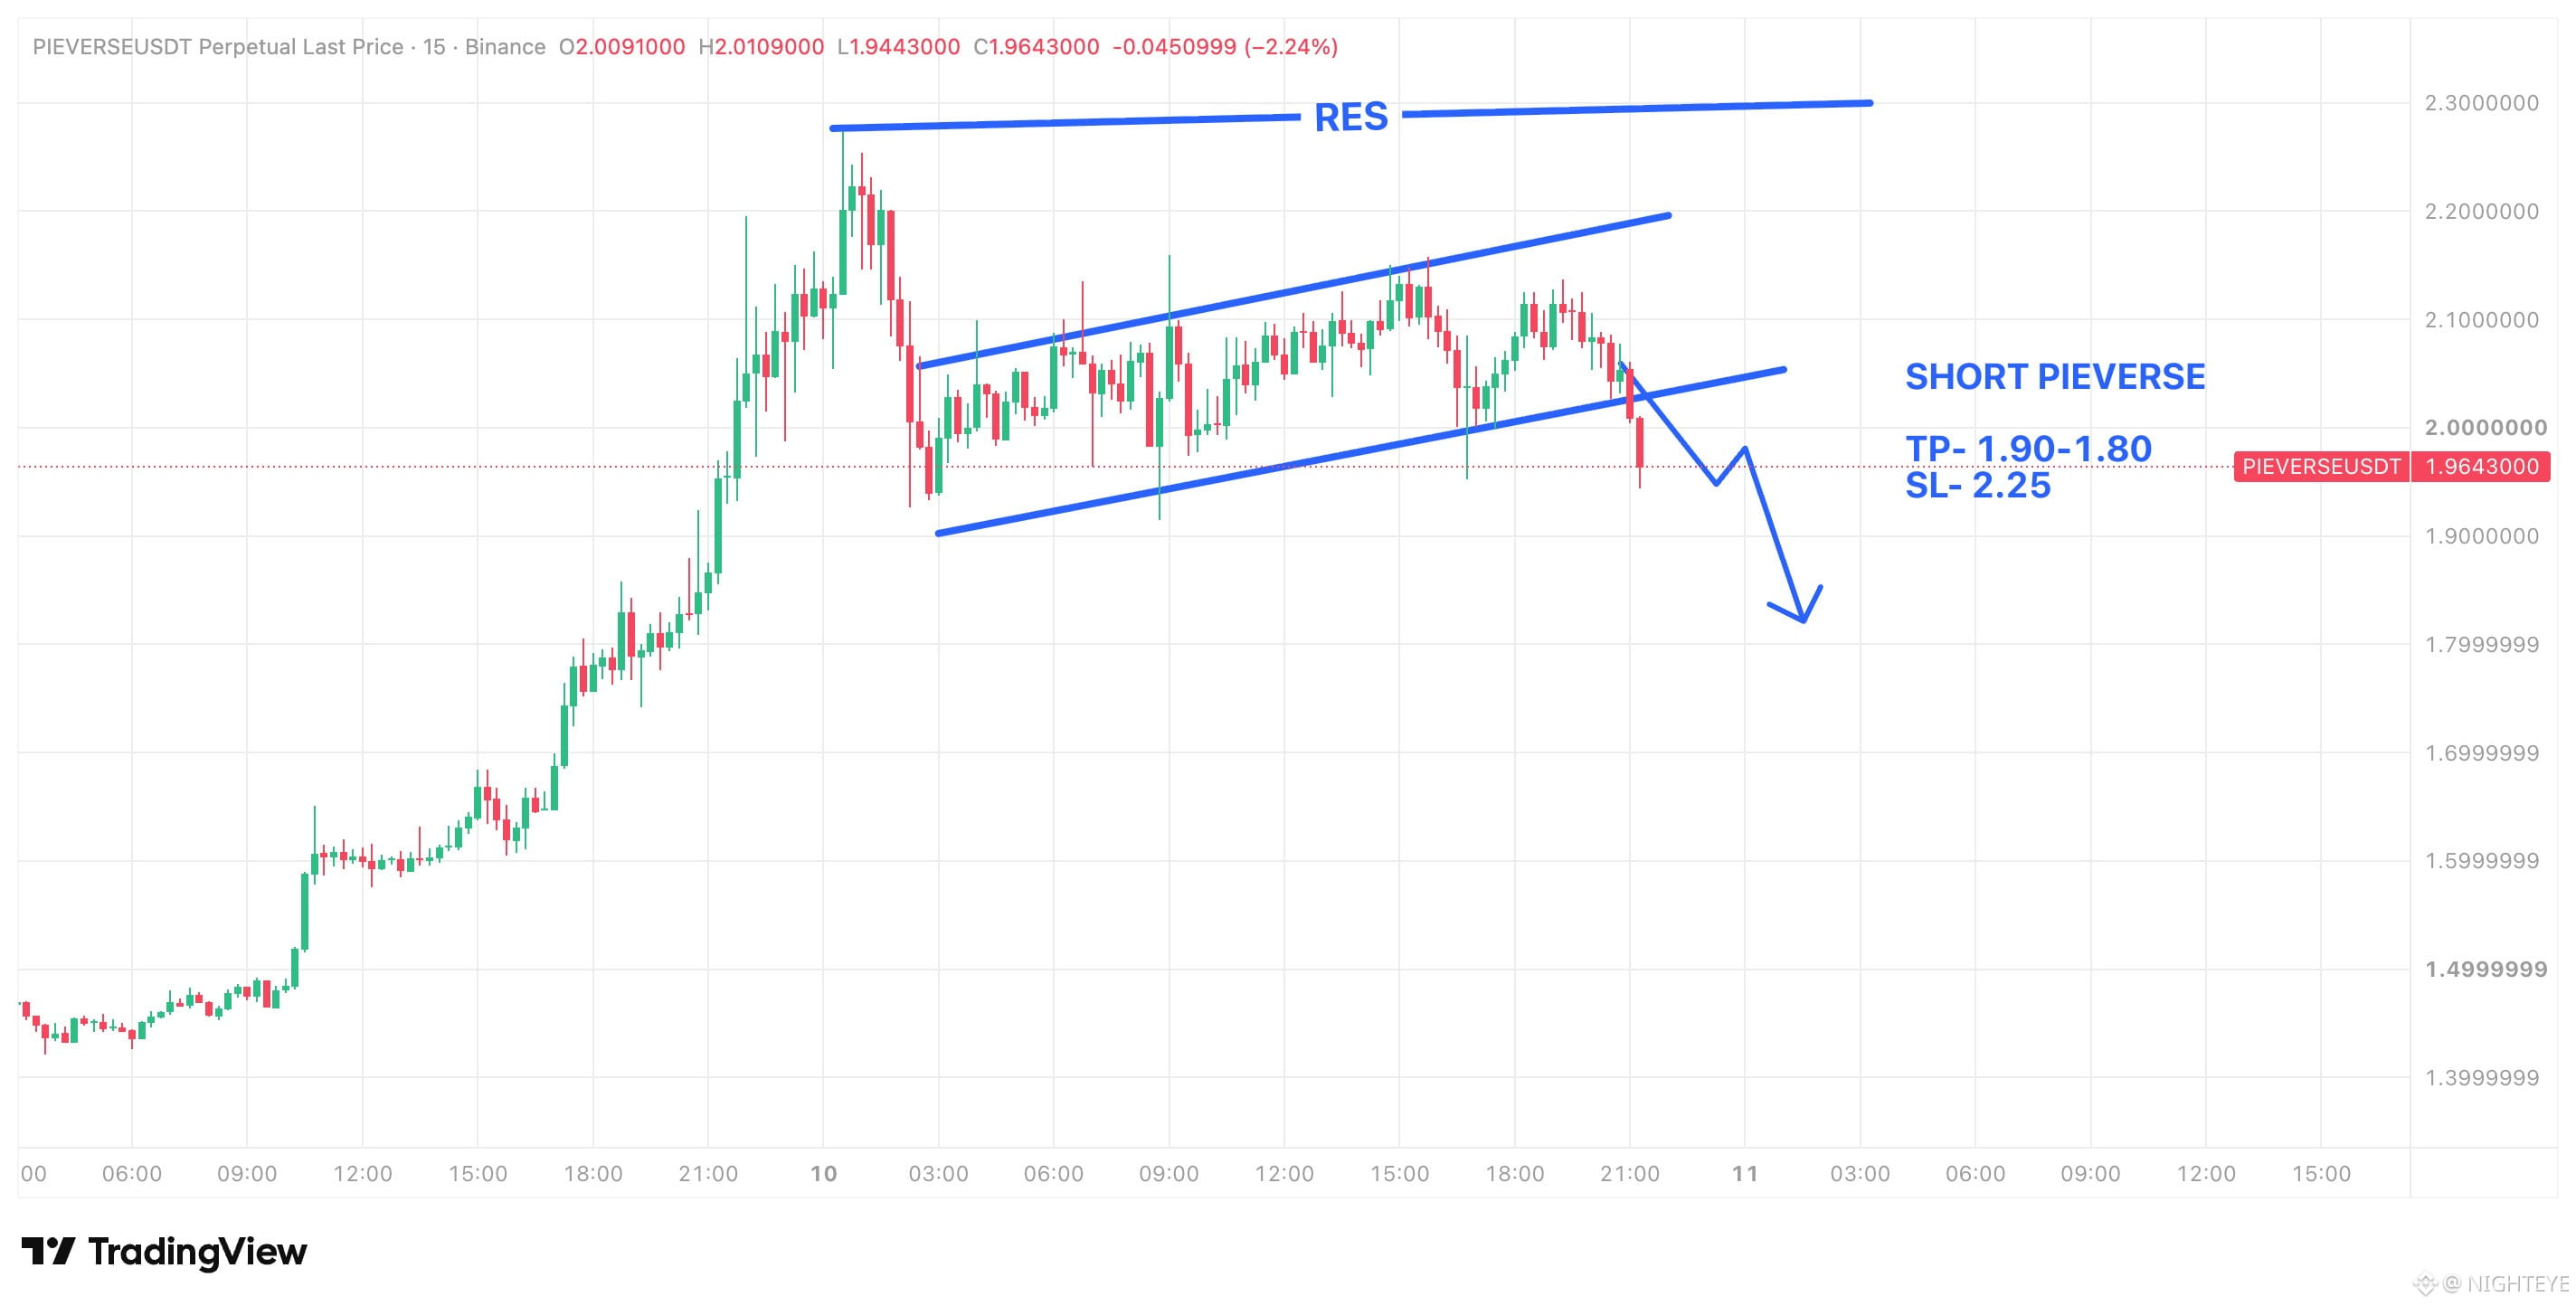
$PIEVERSE just broke below the rising channel it had been building since the sharp drop off the 2.27 high.
The bounces inside that channel were slow, with each push stalling under the upper trendline near 2.10 and never getting back toward the highs. That looks more like a bear flag than a base. The lower trendline gave way around 2.00 on a strong red candle, and the last two closes are sitting under it. The first real support is the 1.90 area where the channel started, and below that there's very little structure until 1.80.
If price stays under 2.00 and the channel line turns into resistance on a retest, I'd expect 1.90 first and then a push toward 1.80. If it reclaims 2.10 and holds, the breakdown was a fakeout, and the 2.25 resistance comes back into play.
$PIEVERSE just broke below the rising channel it had been building since the sharp drop off the 2.27 high.
The bounces inside that channel were slow, with each push stalling under the upper trendline near 2.10 and never getting back toward the highs. That looks more like a bear flag than a base. The lower trendline gave way around 2.00 on a strong red candle, and the last two closes are sitting under it. The first real support is the 1.90 area where the channel started, and below that there's very little structure until 1.80.
If price stays under 2.00 and the channel line turns into resistance on a retest, I'd expect 1.90 first and then a push toward 1.80. If it reclaims 2.10 and holds, the breakdown was a fakeout, and the 2.25 resistance comes back into play.
The bounces inside that channel were slow, with each push stalling under the upper trendline near 2.10 and never getting back toward the highs. That looks more like a bear flag than a base. The lower trendline gave way around 2.00 on a strong red candle, and the last two closes are sitting under it. The first real support is the 1.90 area where the channel started, and below that there's very little structure until 1.80.
If price stays under 2.00 and the channel line turns into resistance on a retest, I'd expect 1.90 first and then a push toward 1.80. If it reclaims 2.10 and holds, the breakdown was a fakeout, and the 2.25 resistance comes back into play.
290
·
--
Bearish
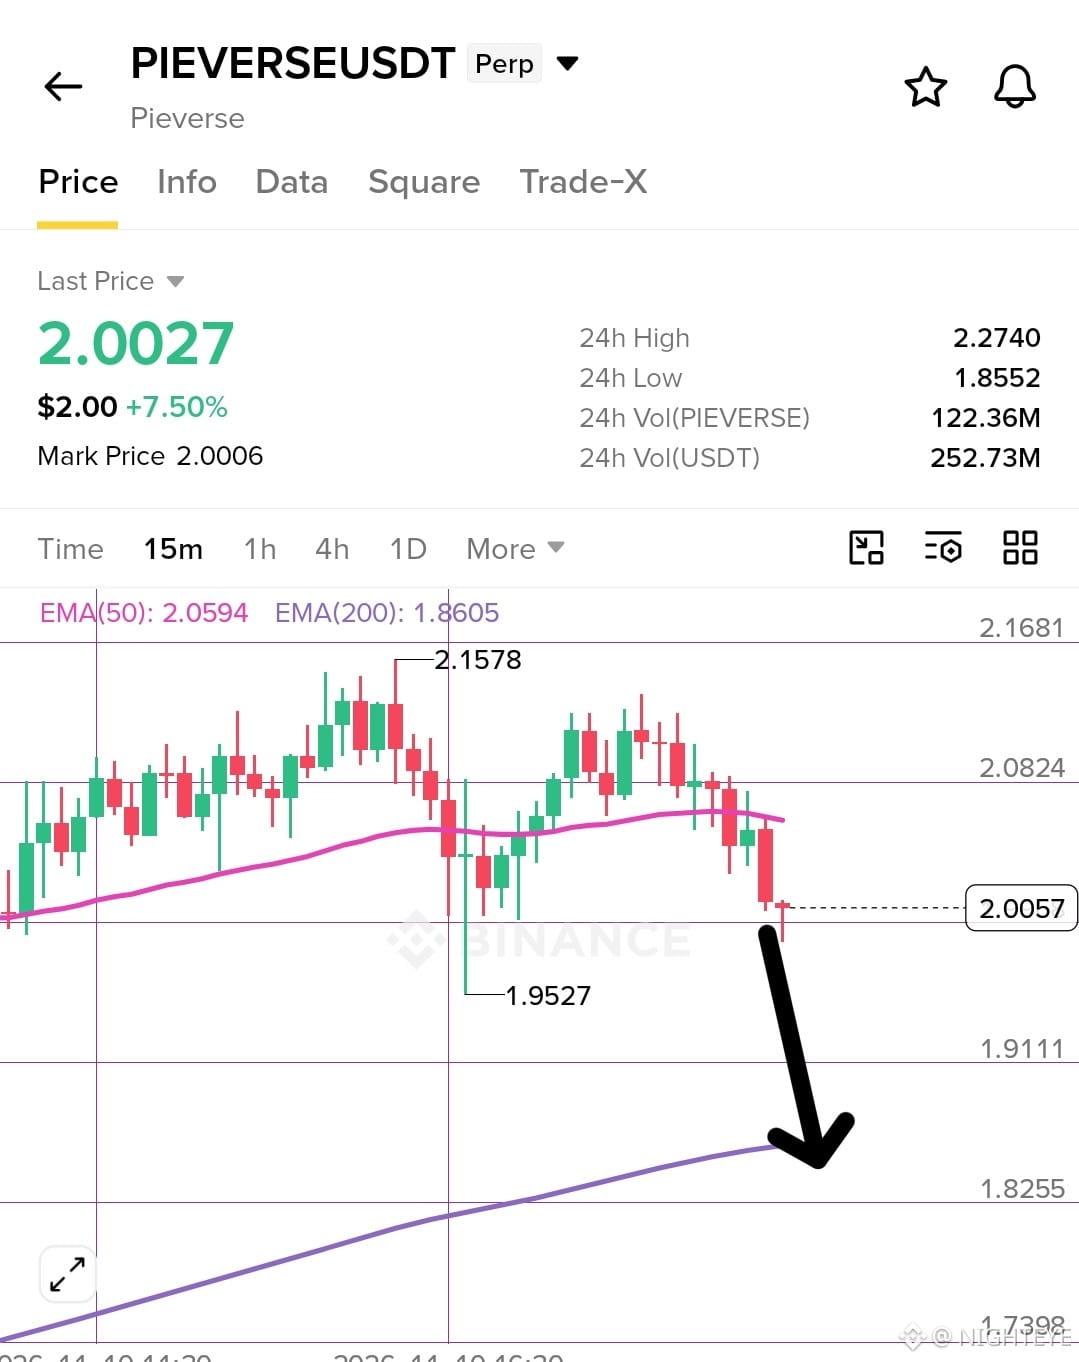
$PIEVERSE is showing weakness here and i expect some break down soon so open a short here 🔴
Entry- 2.0-2.10
SL- 2.30
TP - 1.90-1.80
{future}(PIEVERSEUSDT)
$PIEVERSE is showing weakness here and i expect some break down soon so open a short here 🔴
Entry- 2.0-2.10
SL- 2.30
TP - 1.90-1.80
Entry- 2.0-2.10
SL- 2.30
TP - 1.90-1.80
1
2
298
·
--
Bearish
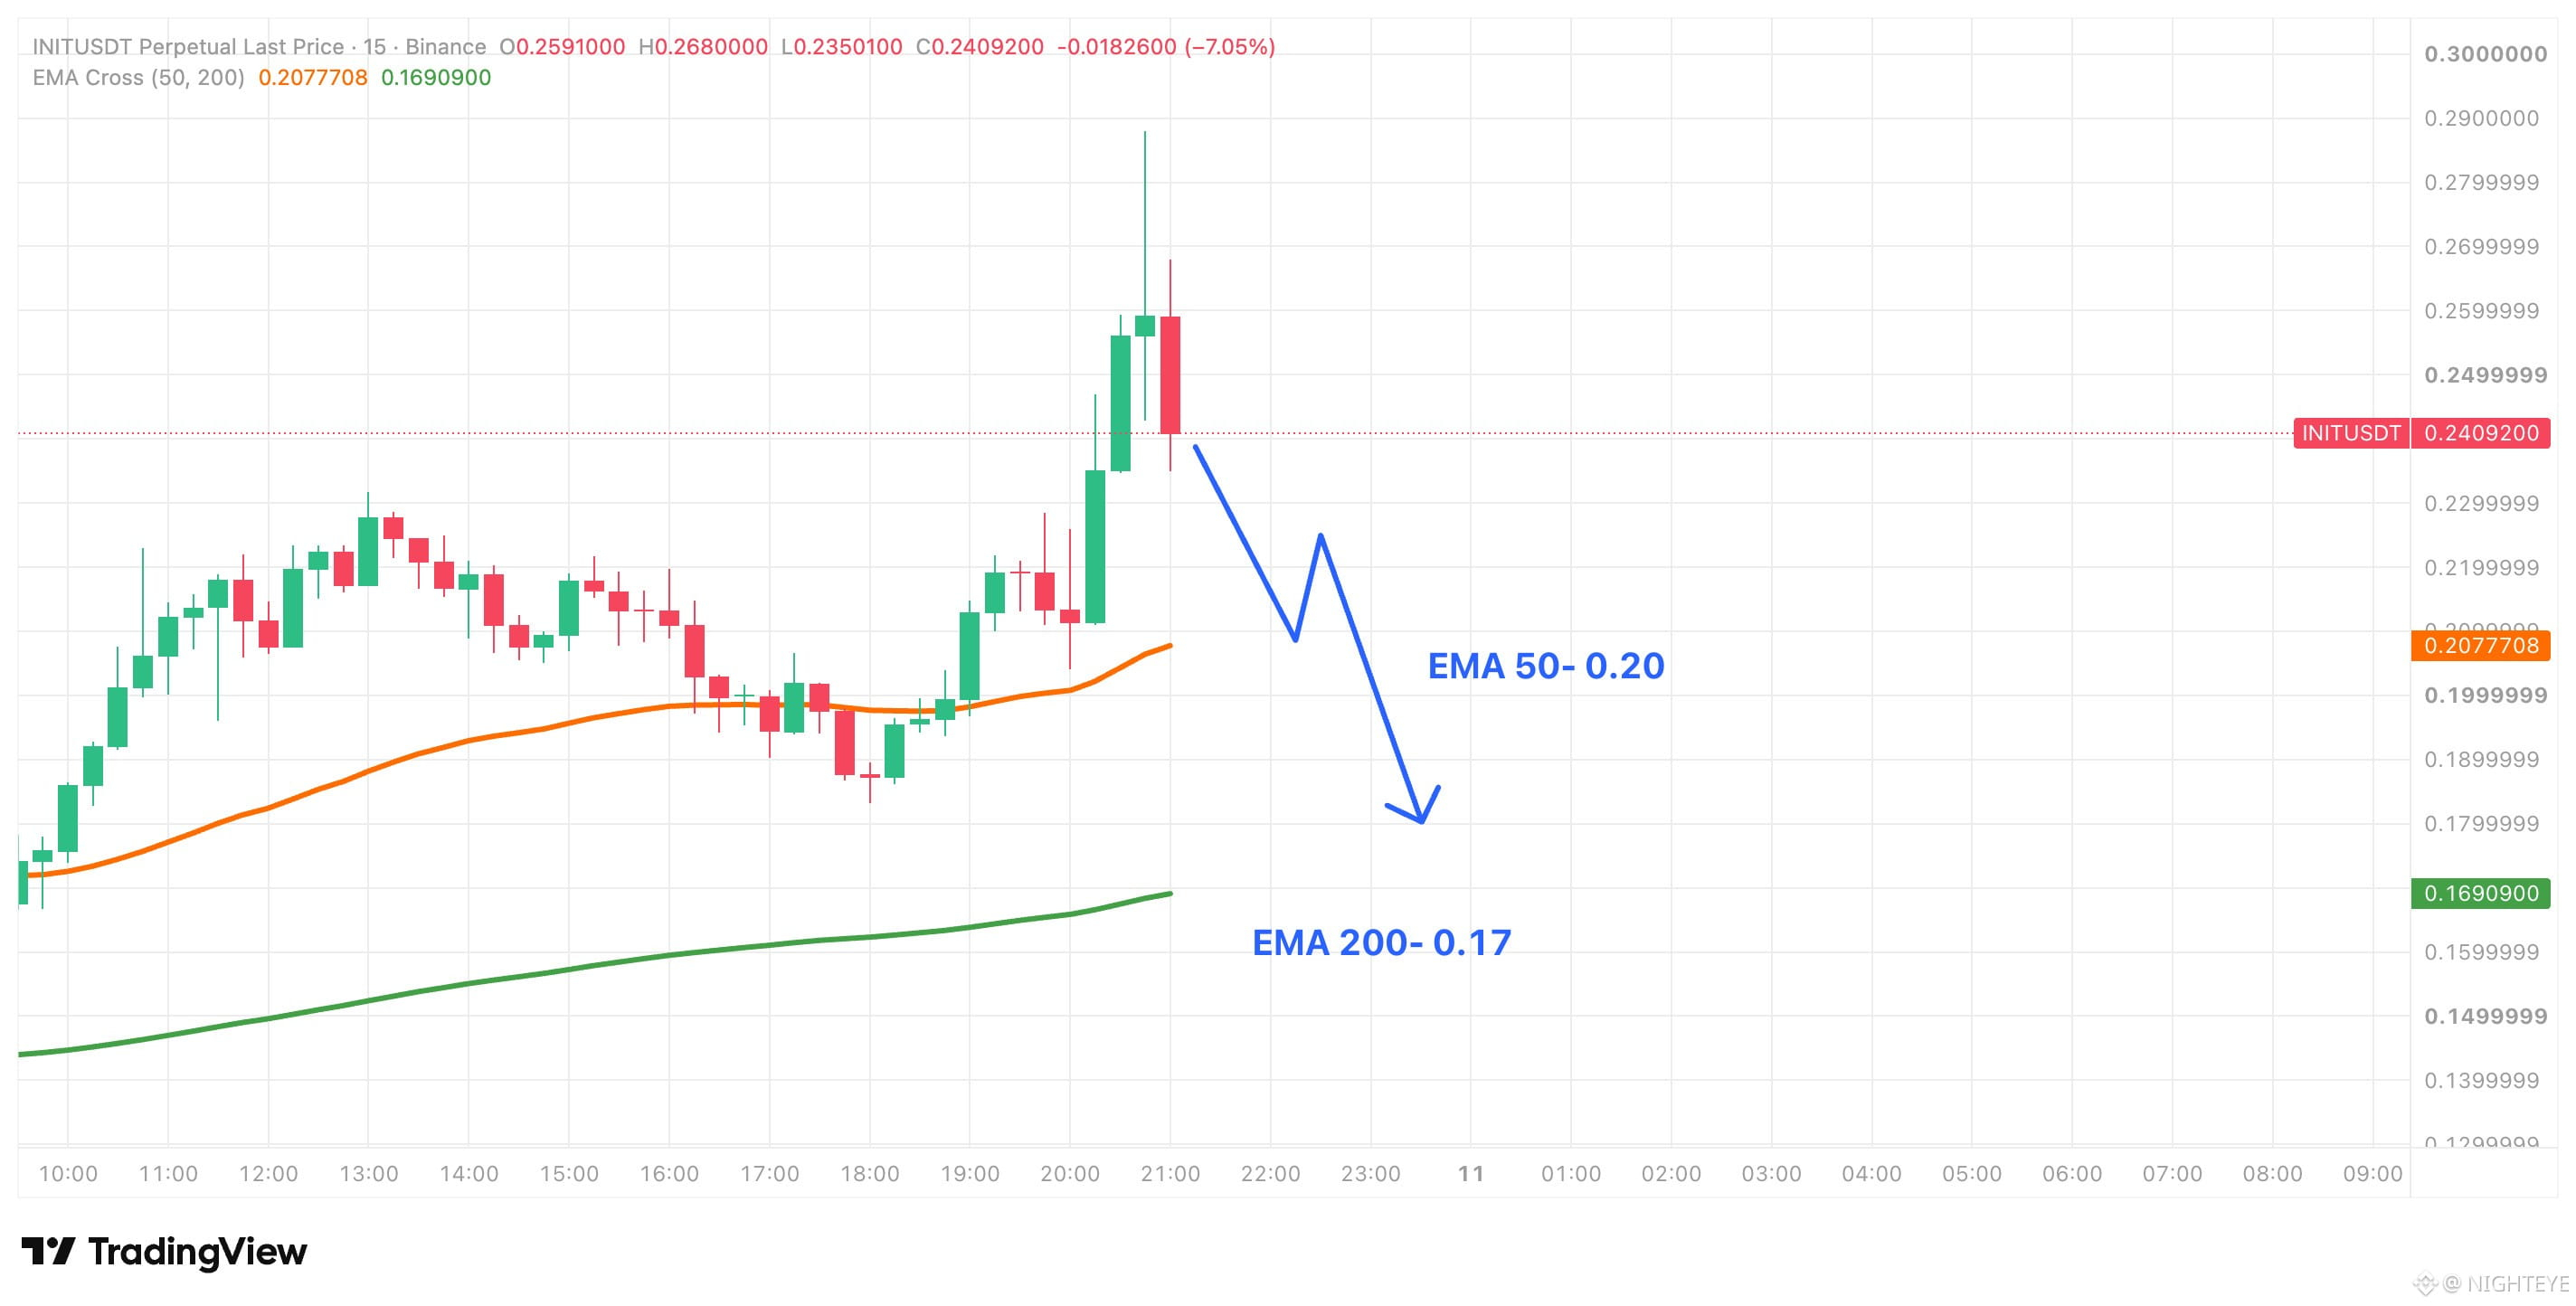
$INIT just printed a long upper wick to around 0.29 and is now closing back down at 0.241, far above both EMAs on the 15m.
What stands out is how stretched this is. Price sits roughly 16% above the 50 EMA at 0.208 and well clear of the 200 EMA at 0.169, after a vertical run with almost no pullbacks.
The wick shows sellers stepped in hard at the top, and the current candle gave back most of the last green one. I'm not calling a full reversal yet, but a move this extended usually needs to come back and retest the EMA before it can build anything sustainable.
If price loses 0.22, I'd expect a fast drop toward the 50 EMA near 0.208, with the 200 EMA at 0.17 as the deeper level if that fails. If buyers reclaim 0.26 and hold it, the rejection was just a shakeout and the move can keep going toward the 0.29 high.
{future}(INITUSDT)
$INIT just printed a long upper wick to around 0.29 and is now closing back down at 0.241, far above both EMAs on the 15m.
What stands out is how stretched this is. Price sits roughly 16% above the 50 EMA at 0.208 and well clear of the 200 EMA at 0.169, after a vertical run with almost no pullbacks.
The wick shows sellers stepped in hard at the top, and the current candle gave back most of the last green one. I'm not calling a full reversal yet, but a move this extended usually needs to come back and retest the EMA before it can build anything sustainable.
If price loses 0.22, I'd expect a fast drop toward the 50 EMA near 0.208, with the 200 EMA at 0.17 as the deeper level if that fails. If buyers reclaim 0.26 and hold it, the rejection was just a shakeout and the move can keep going toward the 0.29 high.
What stands out is how stretched this is. Price sits roughly 16% above the 50 EMA at 0.208 and well clear of the 200 EMA at 0.169, after a vertical run with almost no pullbacks.
The wick shows sellers stepped in hard at the top, and the current candle gave back most of the last green one. I'm not calling a full reversal yet, but a move this extended usually needs to come back and retest the EMA before it can build anything sustainable.
If price loses 0.22, I'd expect a fast drop toward the 50 EMA near 0.208, with the 200 EMA at 0.17 as the deeper level if that fails. If buyers reclaim 0.26 and hold it, the rejection was just a shakeout and the move can keep going toward the 0.29 high.
313
·
--
Bullish
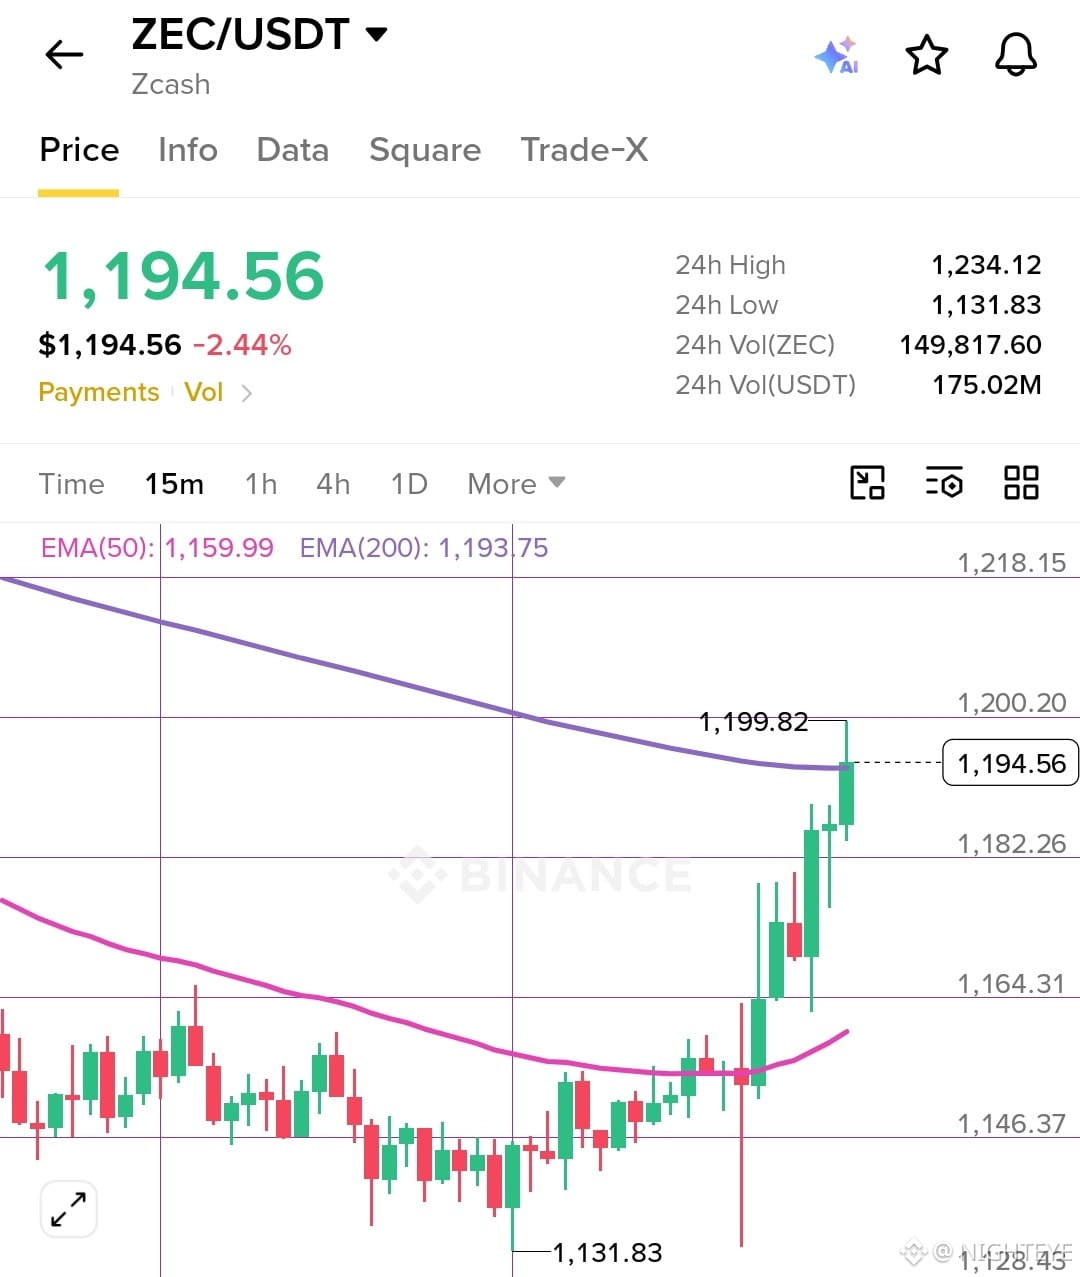
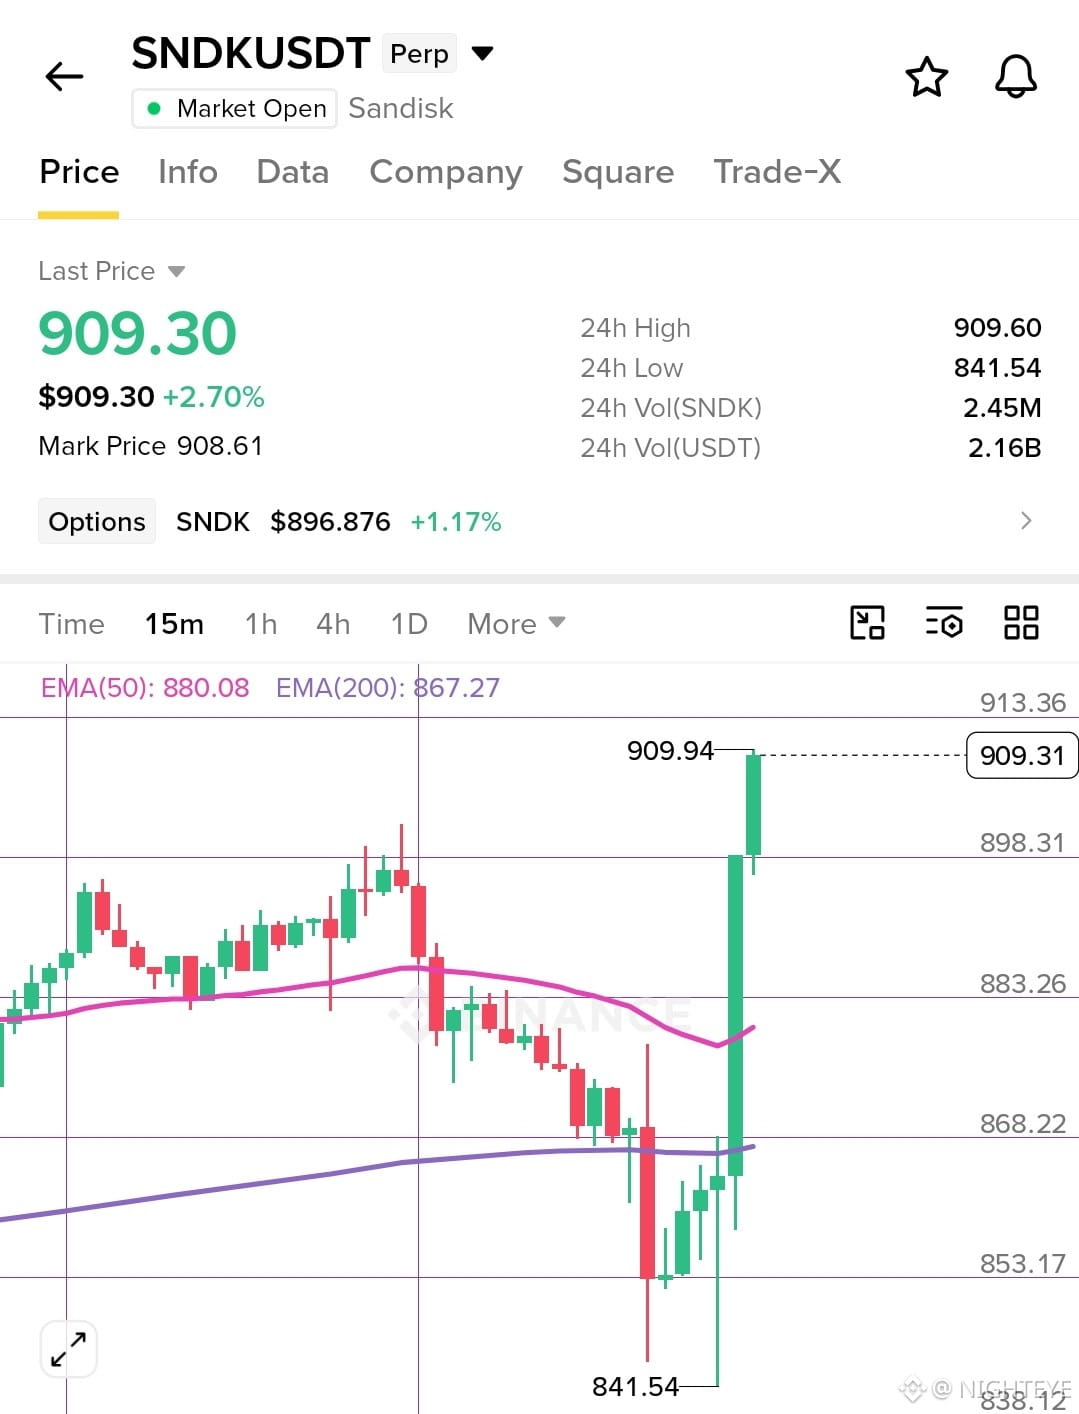
$ZEC and $SNDK Both are moving from bottom and i expect big bounce very soon anytime 👀
{future}(SNDKUSDT)
{future}(ZECUSDT)
$ZEC and $SNDK Both are moving from bottom and i expect big bounce very soon anytime 👀
1
685
·
--
Bullish
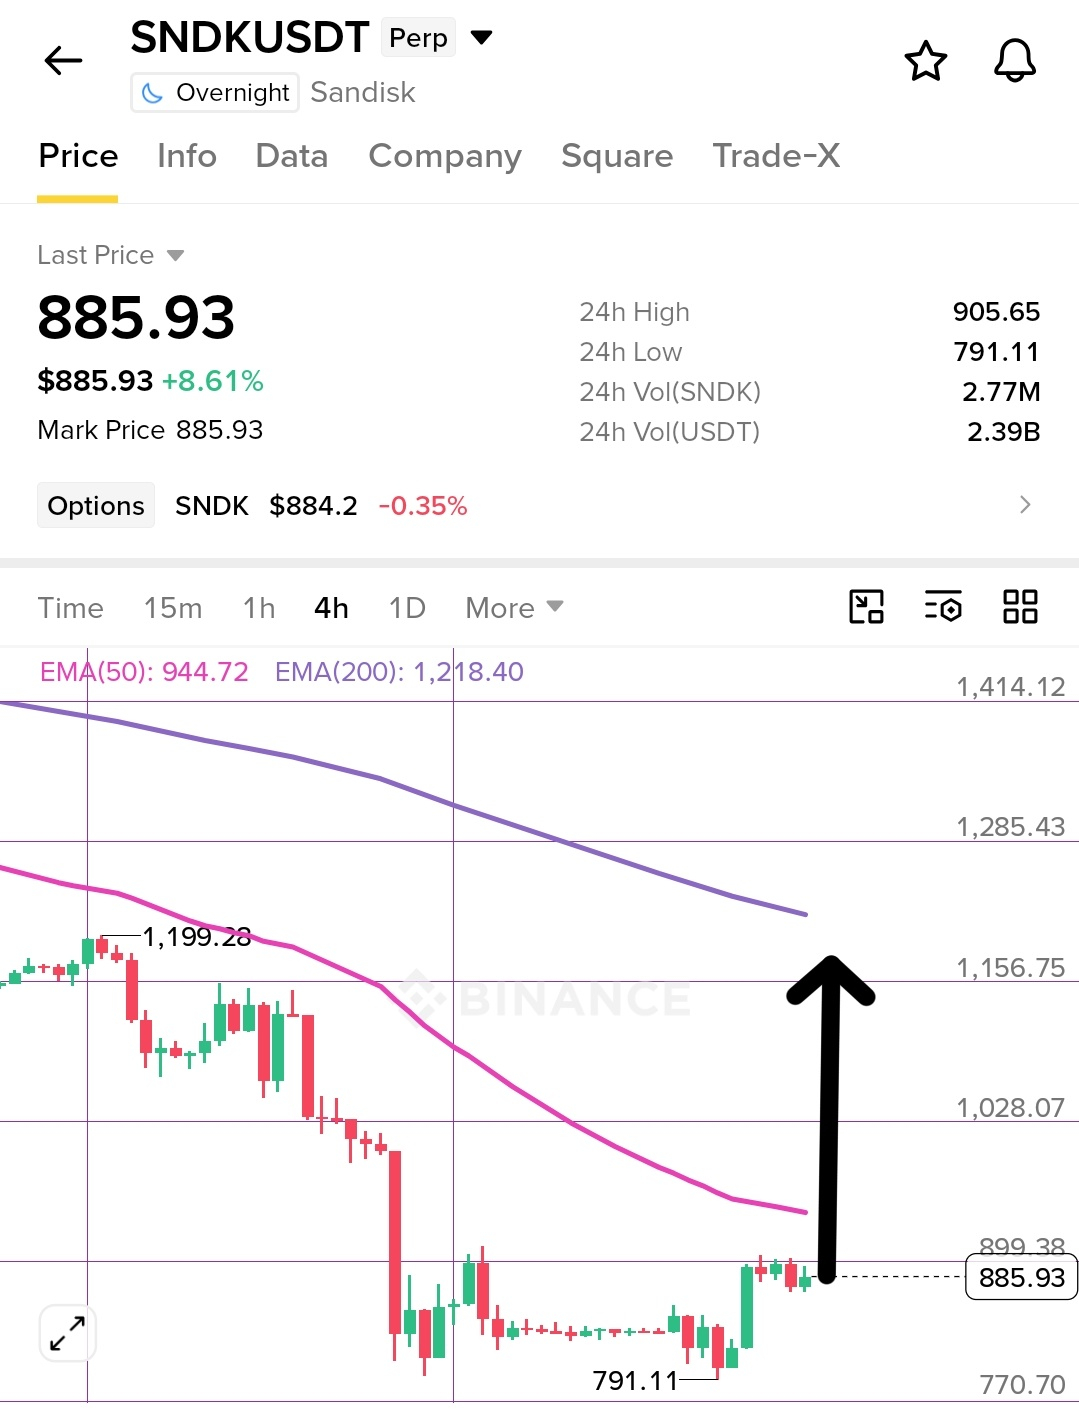
$SNDK Big bounce from bottom and smashed first target 🚀
We are just getting started on this don't miss trade here 👇
{future}(SNDKUSDT)
$SNDK Big bounce from bottom and smashed first target 🚀
We are just getting started on this don't miss trade here 👇
We are just getting started on this don't miss trade here 👇
NIGHTEYE
·
--
BullishLong on $SNDK here stock market showing some strength so this is going give some pump 🟢
Entry- 840-880
SL- 780
TP - 900-930-950
Entry- 840-880
SL- 780
TP - 900-930-950
477
·
--
Bullish
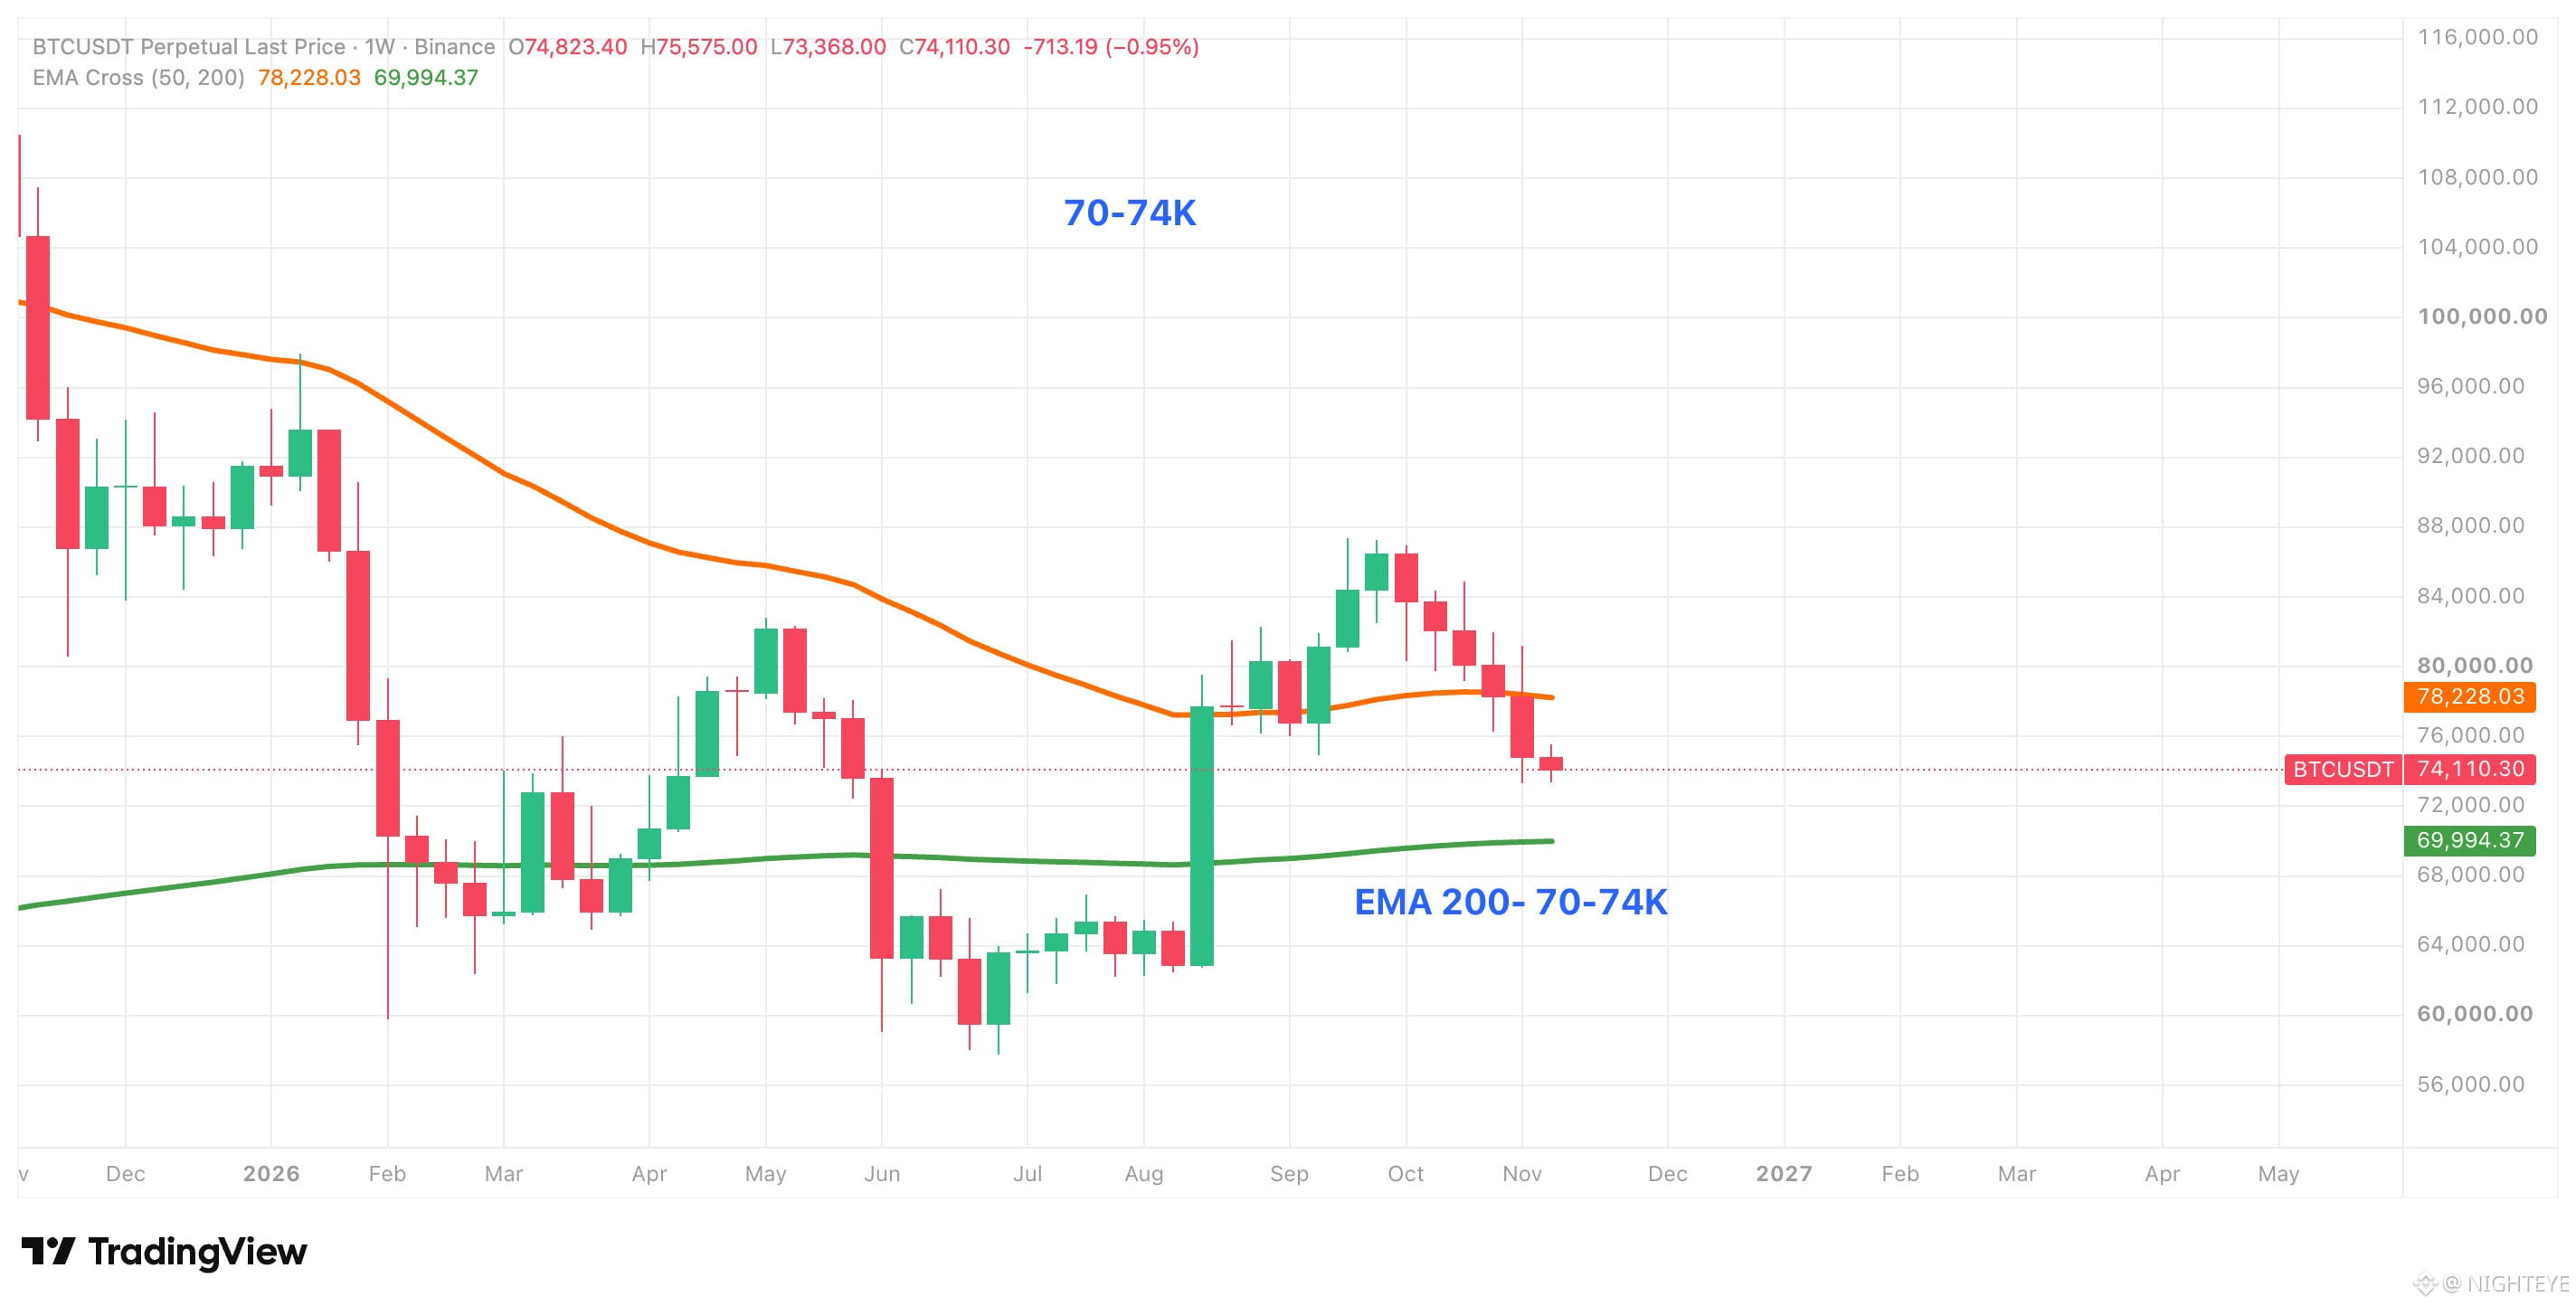
$BTC lost the weekly 50 EMA and is now sitting right above the 200 EMA, with the 70-74K zone as the next real test.
The rejection near 87K turned into five red weekly candles in a row, and the last one closed under the 50 EMA around 78.2K.
What I like about the 70-74K zone is that it stacks the 200 EMA near 70K with the area where the big weekly breakout candle started, so buyers have a reason to show up there. I'm not treating it as a guaranteed bounce, though. Momentum is still pointing down, and the 50 EMA is now overhead resistance.
If price holds 70-74K and reclaims 78.2K, the pullback was just a retest and the trend stays intact. If BTC closes a weekly candle below 70K, the 200 EMA is gone as support, and the next area on the chart is the 60K lows.
{future}(BTCUSDT)
$BTC lost the weekly 50 EMA and is now sitting right above the 200 EMA, with the 70-74K zone as the next real test.
The rejection near 87K turned into five red weekly candles in a row, and the last one closed under the 50 EMA around 78.2K.
What I like about the 70-74K zone is that it stacks the 200 EMA near 70K with the area where the big weekly breakout candle started, so buyers have a reason to show up there. I'm not treating it as a guaranteed bounce, though. Momentum is still pointing down, and the 50 EMA is now overhead resistance.
If price holds 70-74K and reclaims 78.2K, the pullback was just a retest and the trend stays intact. If BTC closes a weekly candle below 70K, the 200 EMA is gone as support, and the next area on the chart is the 60K lows.
The rejection near 87K turned into five red weekly candles in a row, and the last one closed under the 50 EMA around 78.2K.
What I like about the 70-74K zone is that it stacks the 200 EMA near 70K with the area where the big weekly breakout candle started, so buyers have a reason to show up there. I'm not treating it as a guaranteed bounce, though. Momentum is still pointing down, and the 50 EMA is now overhead resistance.
If price holds 70-74K and reclaims 78.2K, the pullback was just a retest and the trend stays intact. If BTC closes a weekly candle below 70K, the 200 EMA is gone as support, and the next area on the chart is the 60K lows.
71
·
--
Bullish
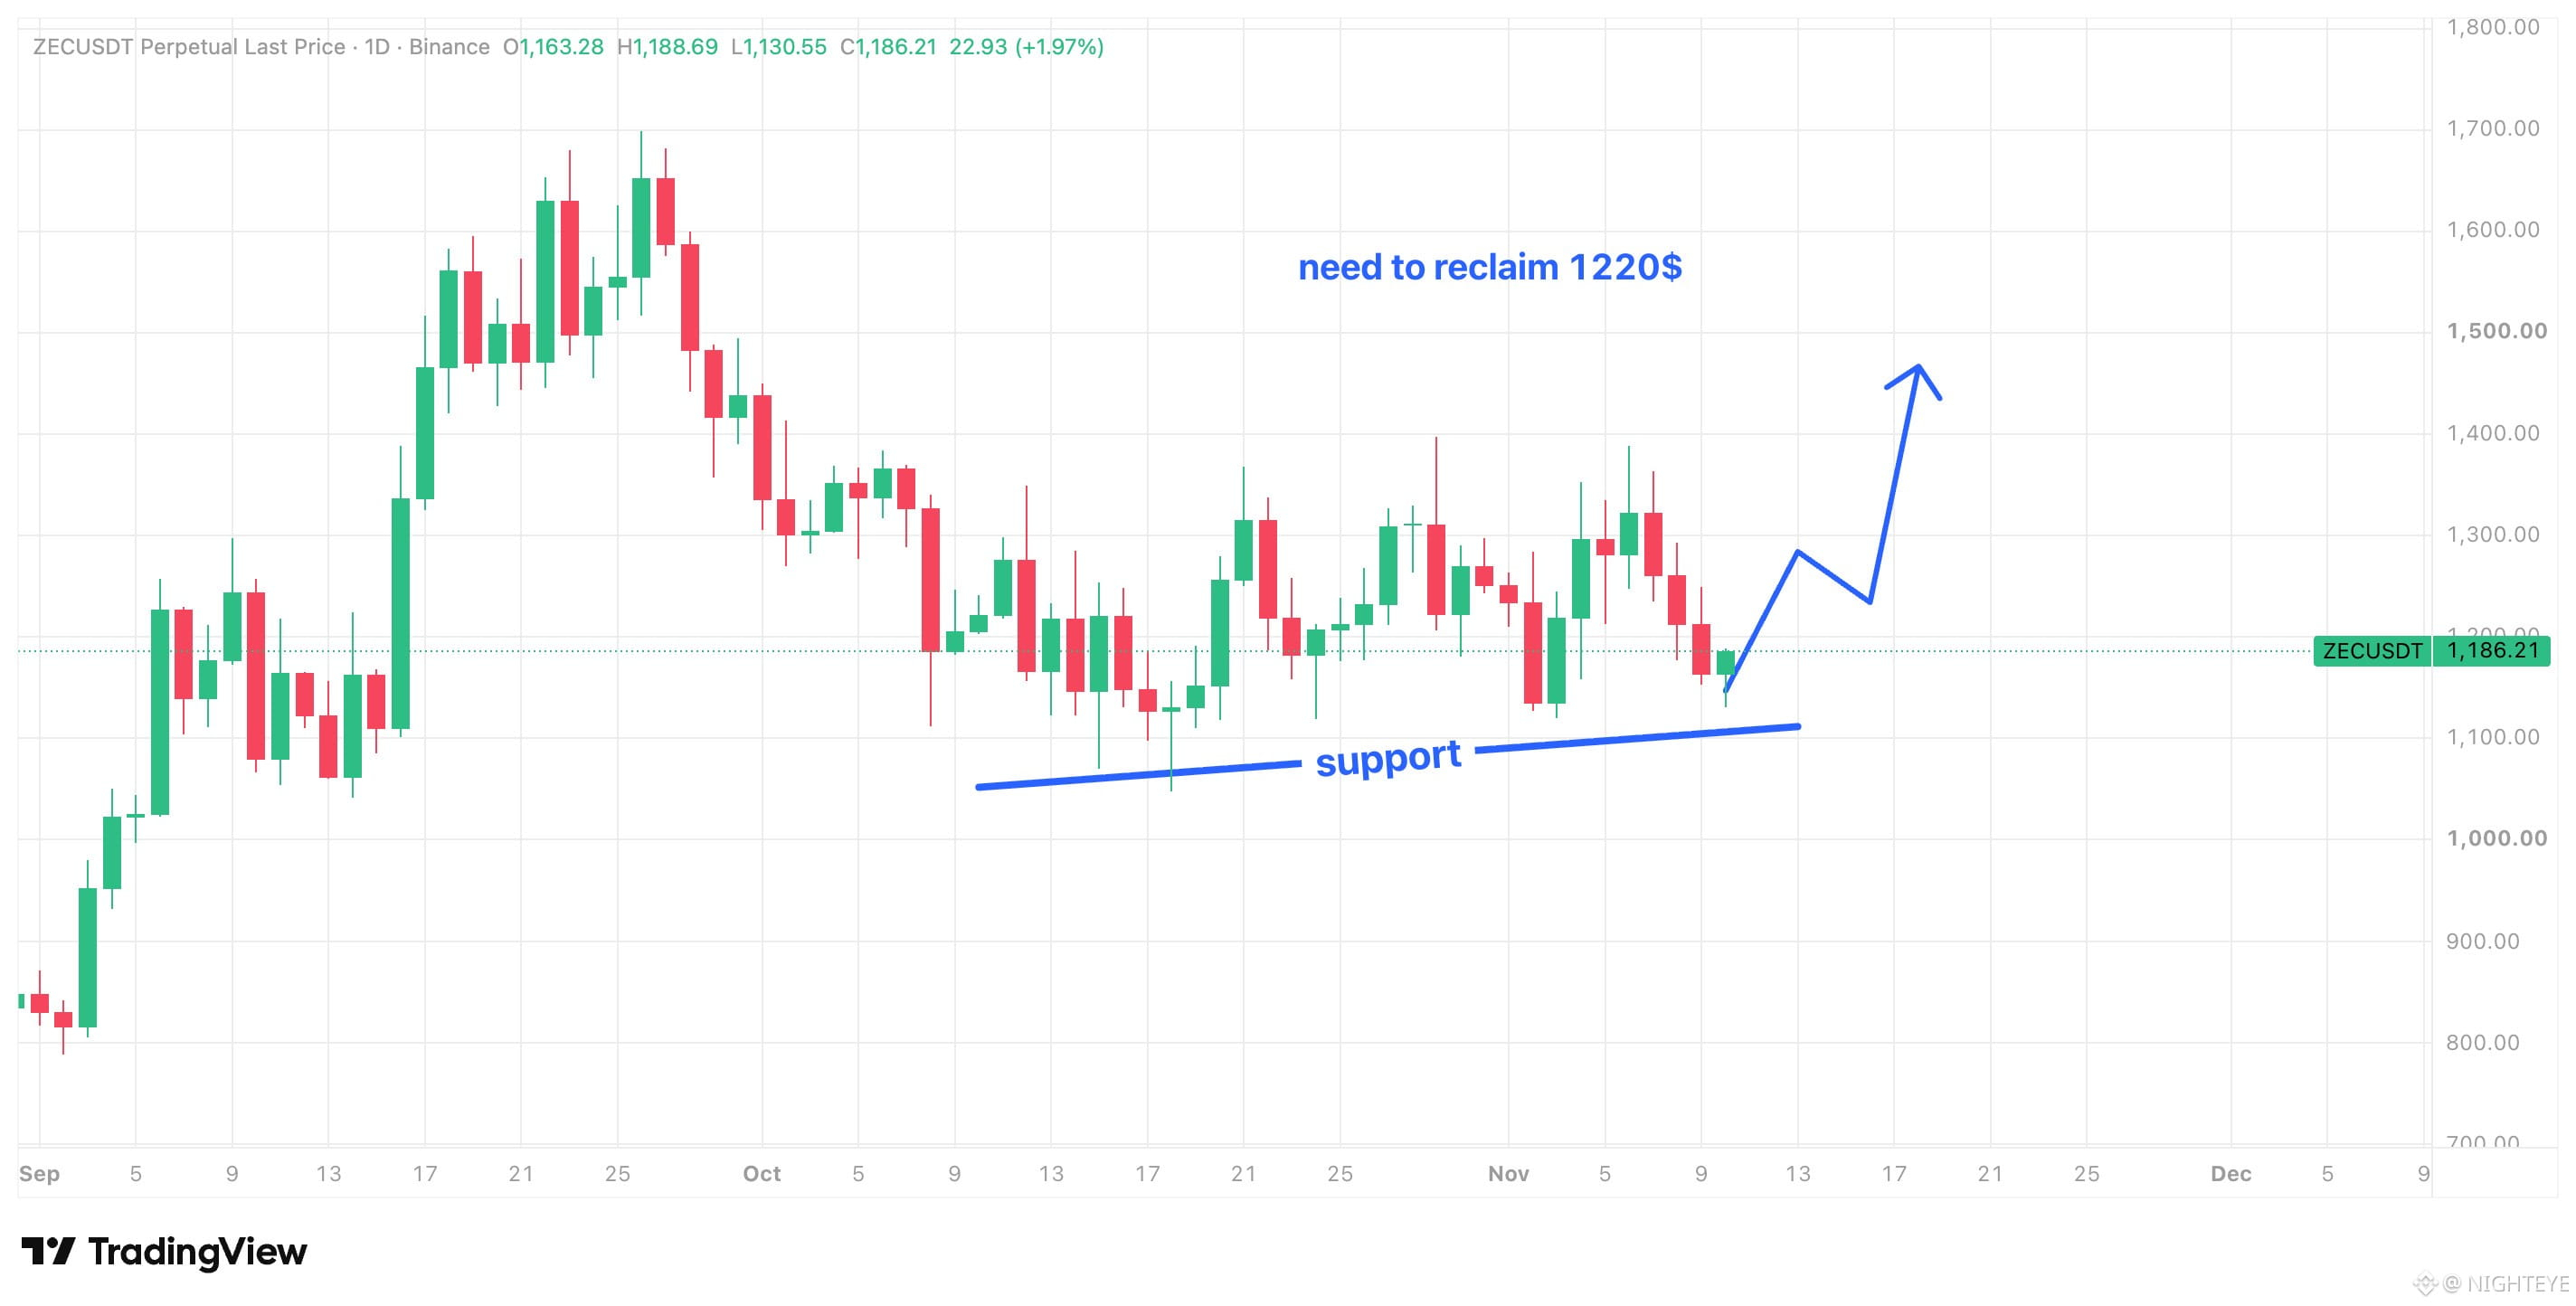
Open a $ZEC long at current range as this is showing some momentum
entry- 1140-1180
SL- 1100
TP- 1200-1220-1250
{future}(ZECUSDT)
Open a $ZEC long at current range as this is showing some momentum
entry- 1140-1180
SL- 1100
TP- 1200-1220-1250
entry- 1140-1180
SL- 1100
TP- 1200-1220-1250
292
·
--
Bearish
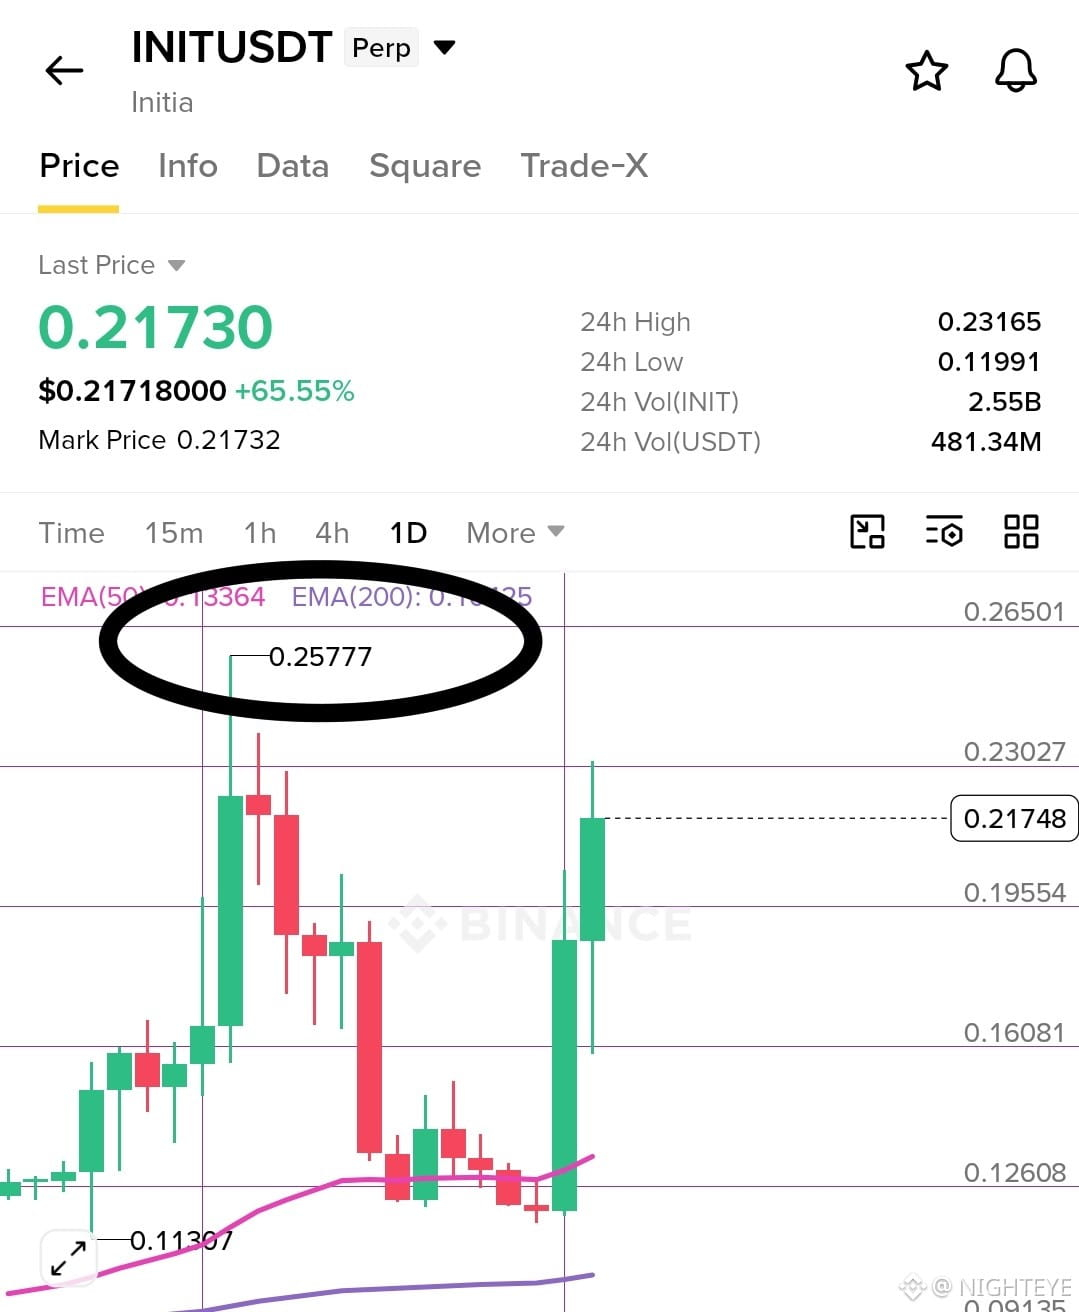
Today i am watching $INIT price action is good but there is a resistance above 0.25$ area. This resistance remains active for now and a rejection from this level will trigger a break down here in $INIT
So keep an eye on this for now 👀
{future}(INITUSDT)
Today i am watching $INIT price action is good but there is a resistance above 0.25$ area. This resistance remains active for now and a rejection from this level will trigger a break down here in $INIT
So keep an eye on this for now 👀
So keep an eye on this for now 👀
256
·
--
Bullish
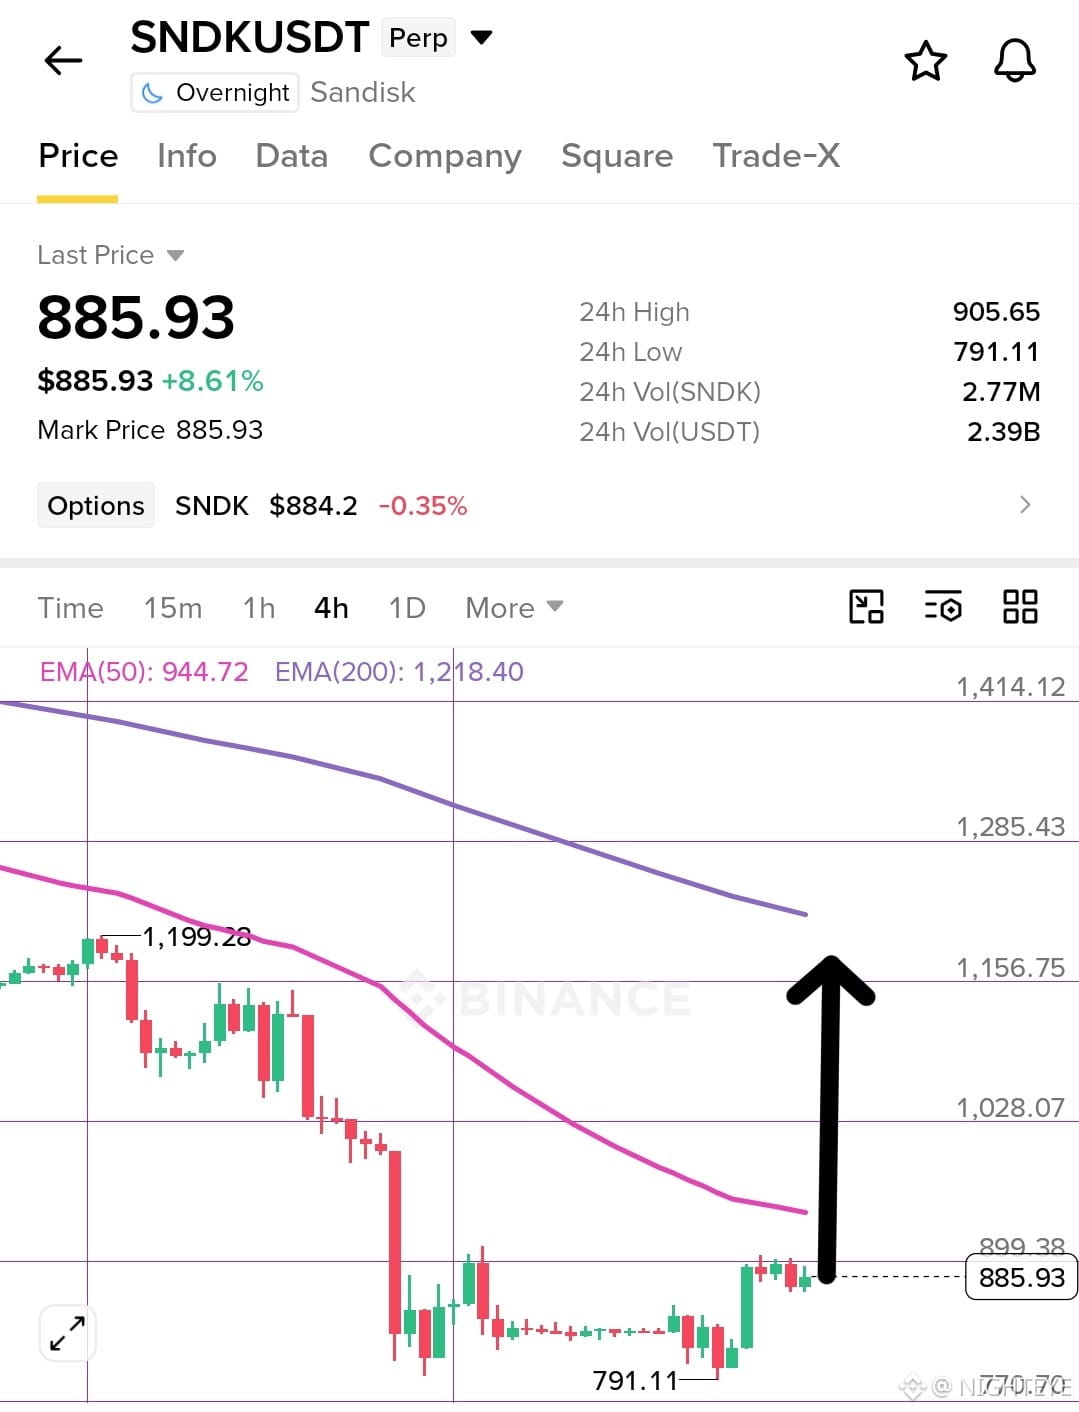
Long on $SNDK here stock market showing some strength so this is going give some pump 🟢
Entry- 840-880
SL- 780
TP - 900-930-950
{future}(SNDKUSDT)
Long on $SNDK here stock market showing some strength so this is going give some pump 🟢
Entry- 840-880
SL- 780
TP - 900-930-950
Entry- 840-880
SL- 780
TP - 900-930-950
1
255
·
--
Bearish
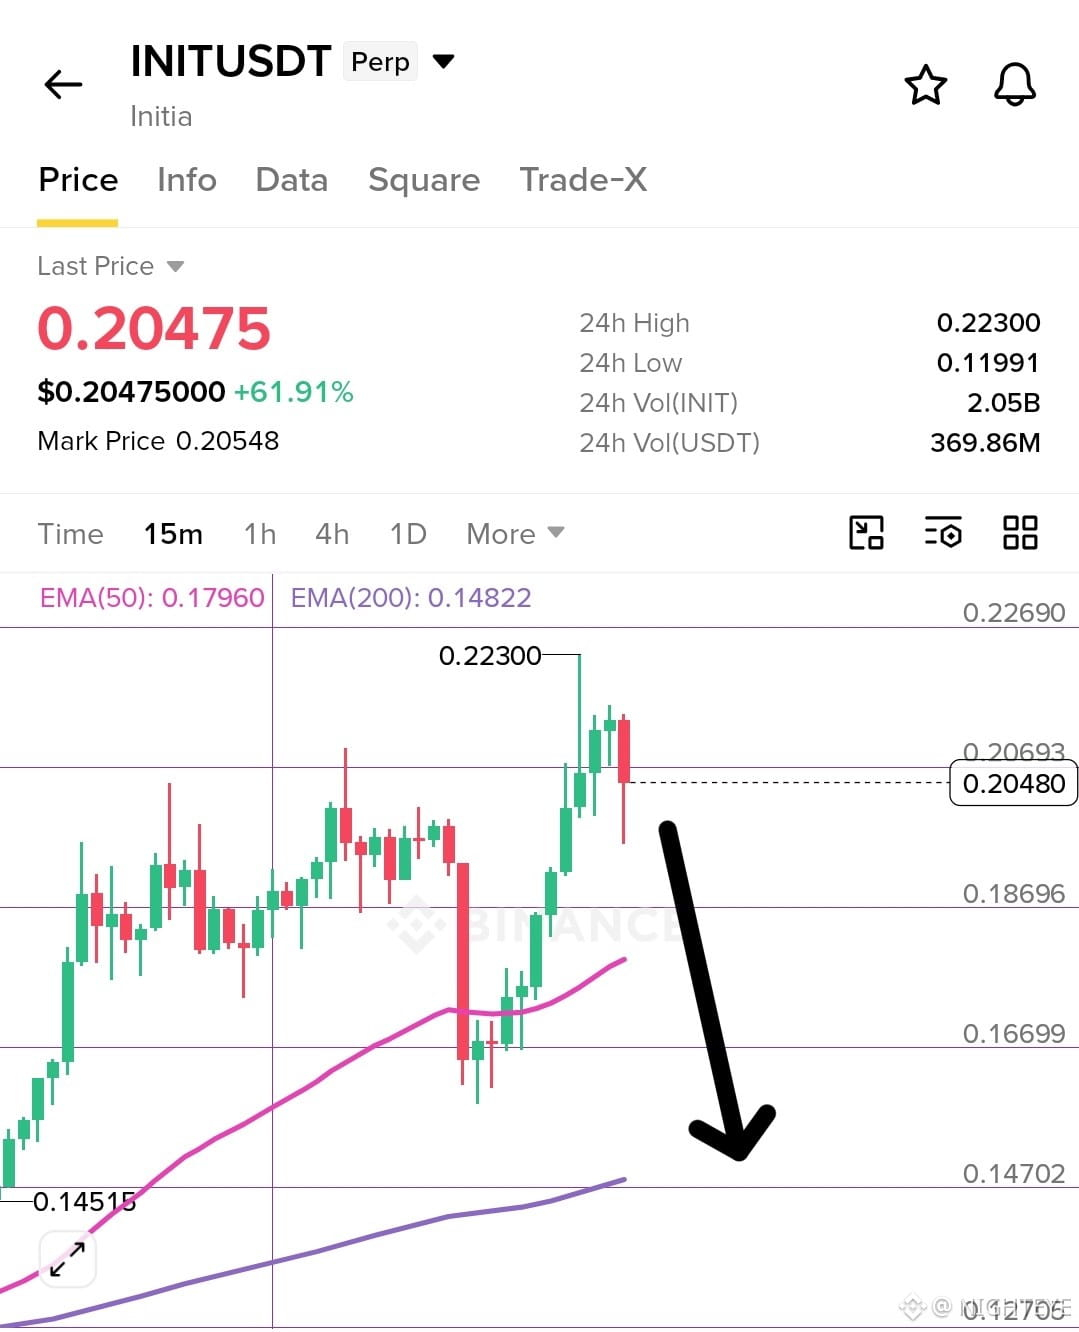
Open short on $INIT here looks very over pumped and i expect some drop very soon.
Entry- 0.205-0.22
SL- 0.24
TP - 0.20-0.19-0.18
{future}(INITUSDT)
Open short on $INIT here looks very over pumped and i expect some drop very soon.
Entry- 0.205-0.22
SL- 0.24
TP - 0.20-0.19-0.18
Entry- 0.205-0.22
SL- 0.24
TP - 0.20-0.19-0.18
294
Log in to explore more content
Join global crypto users on Binance Square
⚡️ Get latest and useful information about crypto.
💬 Trusted by the world’s largest crypto exchange.
👍 Discover real insights from verified creators.
Email / Phone number
Trending Topics
HotCPIDecemberHikePriced
110,099 views
1,275 Discussing
CPI Market Watch | US CPI Rises 0.4% in October, Hotter Than 0.3% Forecast
Binance News
·27 Likes
·41.7k views
AnthropicRejectsIPODelayValuationinQuestion
232,825 views
1,942 Discussing
CanNvidiaEarningsEaseMarketConcerns?
40,087 views
583 Discussing