
CRIPTO SIN HUMOS
580 Posts

CRIPTO SIN HUMOS
Report
Block User
Noticias y análisis cripto para Chile y LATAM Datos verificados, cero humo
🇨🇱 BTC · ETH · DeFi · Regulación CMF/SII
Nada de esto es consejo financiero
139 Following
40 Followers
60 Liked
Posts
All
Quotes
Videos
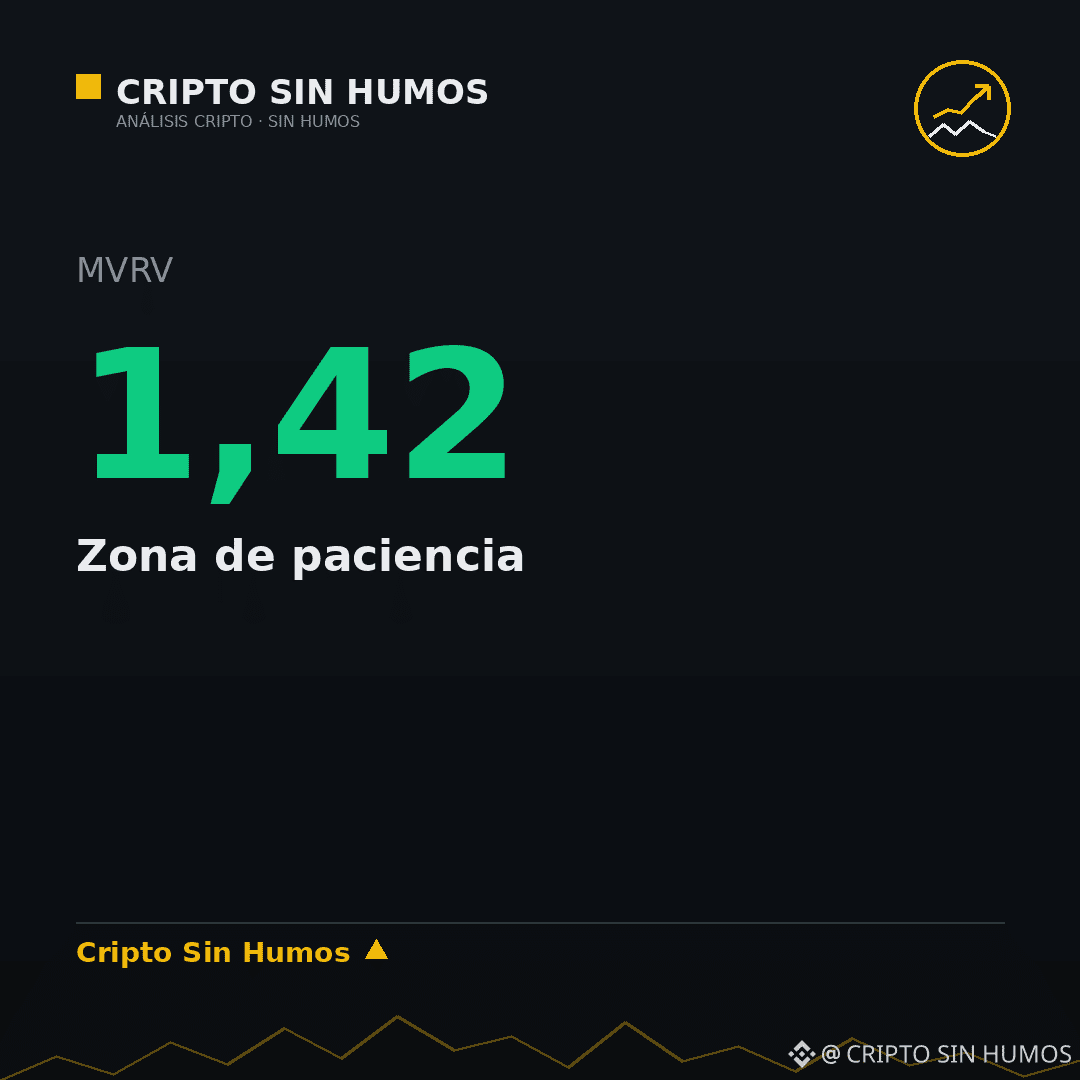
MVRV at 1.42: neither euphoria nor a bottom, so what does that mean?
MVRV stands at 1.42, a level that marks neither a historical bottom nor extreme euphoria. With the price at US$58,145 and a change of -9.36% over seven days, the market offers no clear signs of a reversal or an imminent collapse.
This reading indicates that holders are, on average, slightly in profit, but without the aggressive selling pressure that usually accompanies peaks of euphoria or the panic seen at lows. It is a transitional zone where volatility is managed with patience, not urgency. The Extreme Fear reading (12/100) reinforces that sentiment is negative, but MVRV suggests that the structural damage is not total.
My base case is that $BTC will remain range-bound as long as MVRV stays between 1.0 and 3.0. This scenario is invalidated if the indicator falls below 1.0, signaling a bottom, or rises above 3.0, signaling euphoria. What MVRV level do you consider an entry signal?
This is not financial advice. Do your own research before investing.
MVRV at 1.42: neither euphoria nor a bottom, so what does that mean?
MVRV stands at 1.42, a level that marks neither a historical bottom nor extreme euphoria. With the price at US$58,145 and a change of -9.36% over seven days, the market offers no clear signs of a reversal or an imminent collapse.
This reading indicates that holders are, on average, slightly in profit, but without the aggressive selling pressure that usually accompanies peaks of euphoria or the panic seen at lows. It is a transitional zone where volatility is managed with patience, not urgency. The Extreme Fear reading (12/100) reinforces that sentiment is negative, but MVRV suggests that the structural damage is not total.
My base case is that $BTC will remain range-bound as long as MVRV stays between 1.0 and 3.0. This scenario is invalidated if the indicator falls below 1.0, signaling a bottom, or rises above 3.0, signaling euphoria. What MVRV level do you consider an entry signal?
This is not financial advice. Do your own research before investing.
MVRV stands at 1.42, a level that marks neither a historical bottom nor extreme euphoria. With the price at US$58,145 and a change of -9.36% over seven days, the market offers no clear signs of a reversal or an imminent collapse.
This reading indicates that holders are, on average, slightly in profit, but without the aggressive selling pressure that usually accompanies peaks of euphoria or the panic seen at lows. It is a transitional zone where volatility is managed with patience, not urgency. The Extreme Fear reading (12/100) reinforces that sentiment is negative, but MVRV suggests that the structural damage is not total.
My base case is that $BTC will remain range-bound as long as MVRV stays between 1.0 and 3.0. This scenario is invalidated if the indicator falls below 1.0, signaling a bottom, or rises above 3.0, signaling euphoria. What MVRV level do you consider an entry signal?
This is not financial advice. Do your own research before investing.
141
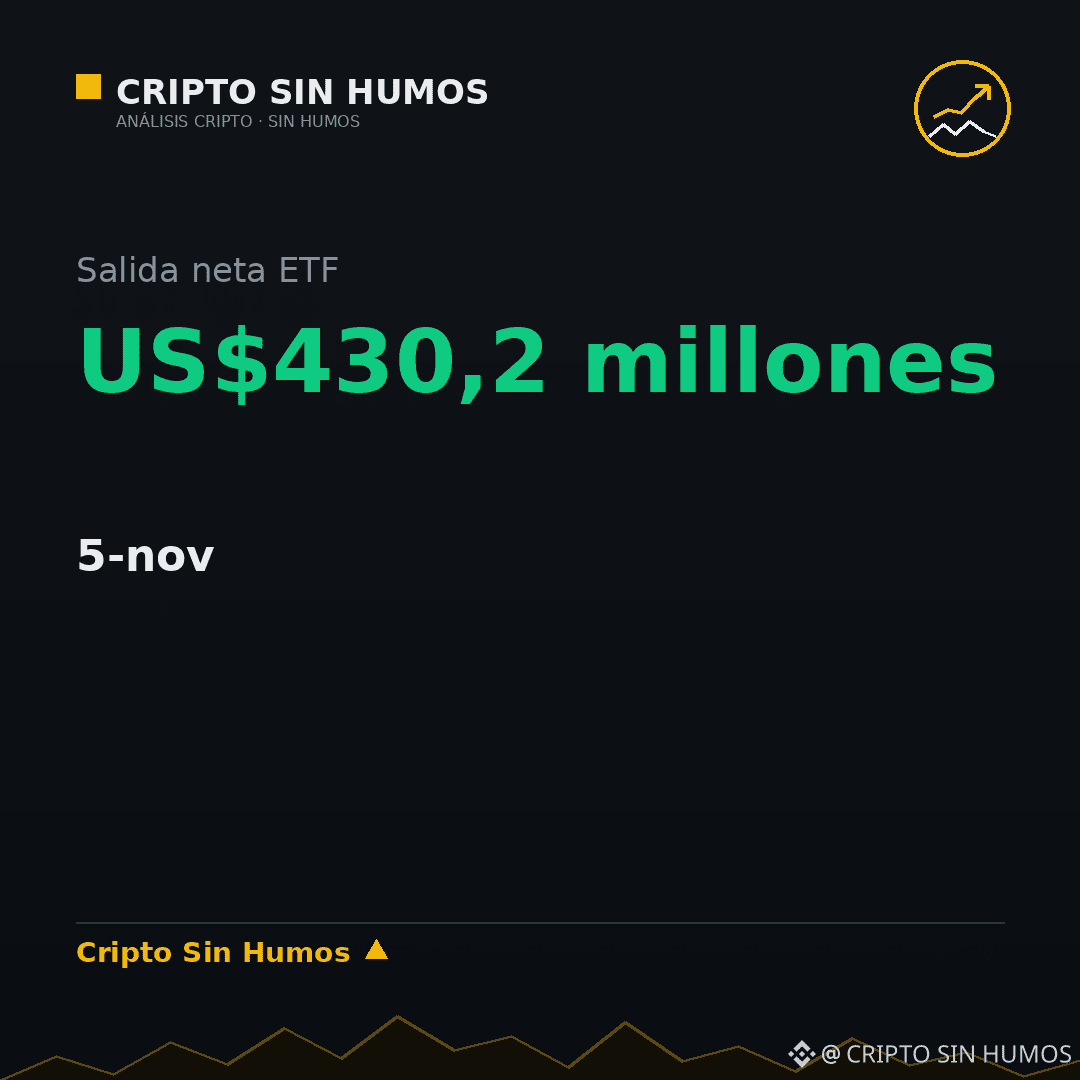
Three days of ETF inflows would be the first real sign of a shift
On November 5, spot ETFs recorded US$430.2 million in net outflows. That figure is not noise; it confirms that selling pressure continues to dominate institutional flows. With $BTC trading at US$59,238, down 13.29% from its level a week ago, the market is not looking for new funds, but for liquidity to cover short positions or exit weak long positions.
My base-case scenario is that the first real trend reversal will not come with a headline, but with three consecutive days of positive net inflows. That would mark the end of the distribution cycle. This thesis would be invalidated if flows remain negative for another two weeks, which would confirm that the decline toward all-time lows is structural rather than a temporary correction.
What specific data point would make you buy again?
This is not financial advice. Verify before investing.
Three days of ETF inflows would be the first real sign of a shift
On November 5, spot ETFs recorded US$430.2 million in net outflows. That figure is not noise; it confirms that selling pressure continues to dominate institutional flows. With $BTC trading at US$59,238, down 13.29% from its level a week ago, the market is not looking for new funds, but for liquidity to cover short positions or exit weak long positions.
My base-case scenario is that the first real trend reversal will not come with a headline, but with three consecutive days of positive net inflows. That would mark the end of the distribution cycle. This thesis would be invalidated if flows remain negative for another two weeks, which would confirm that the decline toward all-time lows is structural rather than a temporary correction.
What specific data point would make you buy again?
This is not financial advice. Verify before investing.
On November 5, spot ETFs recorded US$430.2 million in net outflows. That figure is not noise; it confirms that selling pressure continues to dominate institutional flows. With $BTC trading at US$59,238, down 13.29% from its level a week ago, the market is not looking for new funds, but for liquidity to cover short positions or exit weak long positions.
My base-case scenario is that the first real trend reversal will not come with a headline, but with three consecutive days of positive net inflows. That would mark the end of the distribution cycle. This thesis would be invalidated if flows remain negative for another two weeks, which would confirm that the decline toward all-time lows is structural rather than a temporary correction.
What specific data point would make you buy again?
This is not financial advice. Verify before investing.
143
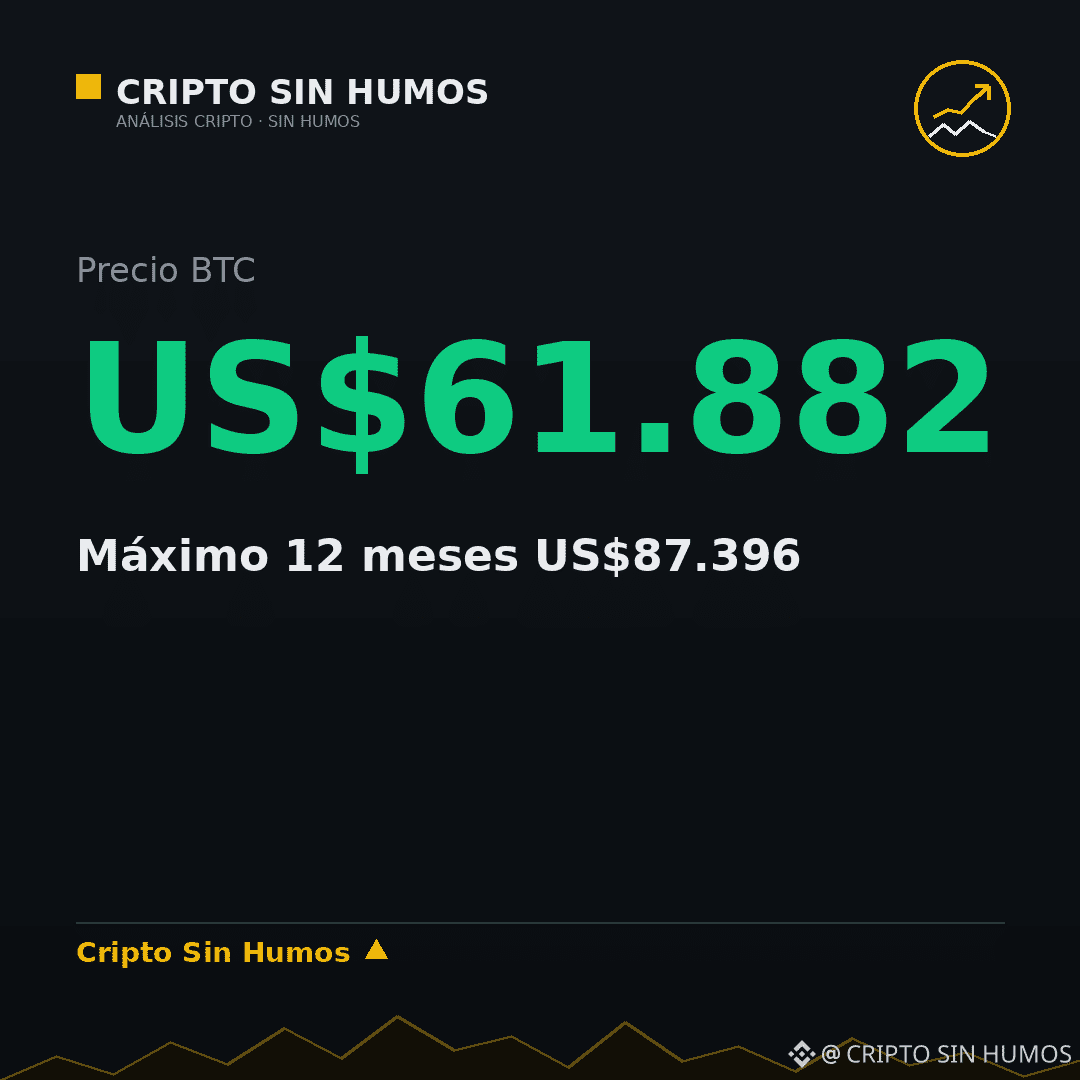
Paraguay: the country that mines bitcoin and just discovered its bank wasn’t a bank
Ueno Bank has 3 million customers and US$850 million in public funds committed, according to the recent report. The price of $BTC stands at US$61,882, with a 12-month high of US$87,396, showing a significant decline without putting an end to the debate over its role in the local economy. My base case is that, having discovered its digital banking service wasn’t a bank, Paraguay reinforces the narrative that crypto is gaining a stronger case without gaining users; this view would be invalidated if Paraguay’s banking system demonstrates solvency quickly. Do you think this development will boost the adoption of $BTC in the region?
This is not financial advice. Do your own research before investing.
Paraguay: the country that mines bitcoin and just discovered its bank wasn’t a bank
Ueno Bank has 3 million customers and US$850 million in public funds committed, according to the recent report. The price of $BTC stands at US$61,882, with a 12-month high of US$87,396, showing a significant decline without putting an end to the debate over its role in the local economy. My base case is that, having discovered its digital banking service wasn’t a bank, Paraguay reinforces the narrative that crypto is gaining a stronger case without gaining users; this view would be invalidated if Paraguay’s banking system demonstrates solvency quickly. Do you think this development will boost the adoption of $BTC in the region?
This is not financial advice. Do your own research before investing.
Ueno Bank has 3 million customers and US$850 million in public funds committed, according to the recent report. The price of $BTC stands at US$61,882, with a 12-month high of US$87,396, showing a significant decline without putting an end to the debate over its role in the local economy. My base case is that, having discovered its digital banking service wasn’t a bank, Paraguay reinforces the narrative that crypto is gaining a stronger case without gaining users; this view would be invalidated if Paraguay’s banking system demonstrates solvency quickly. Do you think this development will boost the adoption of $BTC in the region?
This is not financial advice. Do your own research before investing.
159
What is your invalidation level for this month?
The current price of $BTC is US$64.056, while the realized price is US$53.800. This gap indicates that the market is trading above the average acquisition cost, but the distance is smaller than in previous euphoria cycles. The fear and greed indicator at 10/100 reinforces caution, suggesting that most participants have already adjusted their expectations downward. My base-case scenario is that holding a position without a written invalidation level turns any technical correction into an excuse to sell in a panic. This scenario is invalidated if the price closes below US$53.800 on a weekly basis, the level at which the market would enter a zone of widespread average losses. Defining that limit before a decline occurs is the only way to distinguish trading discipline from an emotional reaction. What price level would force you to close your position today?
This is not financial advice. Verify before investing.
What is your invalidation level for this month?
The current price of $BTC is US$64.056, while the realized price is US$53.800. This gap indicates that the market is trading above the average acquisition cost, but the distance is smaller than in previous euphoria cycles. The fear and greed indicator at 10/100 reinforces caution, suggesting that most participants have already adjusted their expectations downward. My base-case scenario is that holding a position without a written invalidation level turns any technical correction into an excuse to sell in a panic. This scenario is invalidated if the price closes below US$53.800 on a weekly basis, the level at which the market would enter a zone of widespread average losses. Defining that limit before a decline occurs is the only way to distinguish trading discipline from an emotional reaction. What price level would force you to close your position today?
This is not financial advice. Verify before investing.
The current price of $BTC is US$64.056, while the realized price is US$53.800. This gap indicates that the market is trading above the average acquisition cost, but the distance is smaller than in previous euphoria cycles. The fear and greed indicator at 10/100 reinforces caution, suggesting that most participants have already adjusted their expectations downward. My base-case scenario is that holding a position without a written invalidation level turns any technical correction into an excuse to sell in a panic. This scenario is invalidated if the price closes below US$53.800 on a weekly basis, the level at which the market would enter a zone of widespread average losses. Defining that limit before a decline occurs is the only way to distinguish trading discipline from an emotional reaction. What price level would force you to close your position today?
This is not financial advice. Verify before investing.

1
466
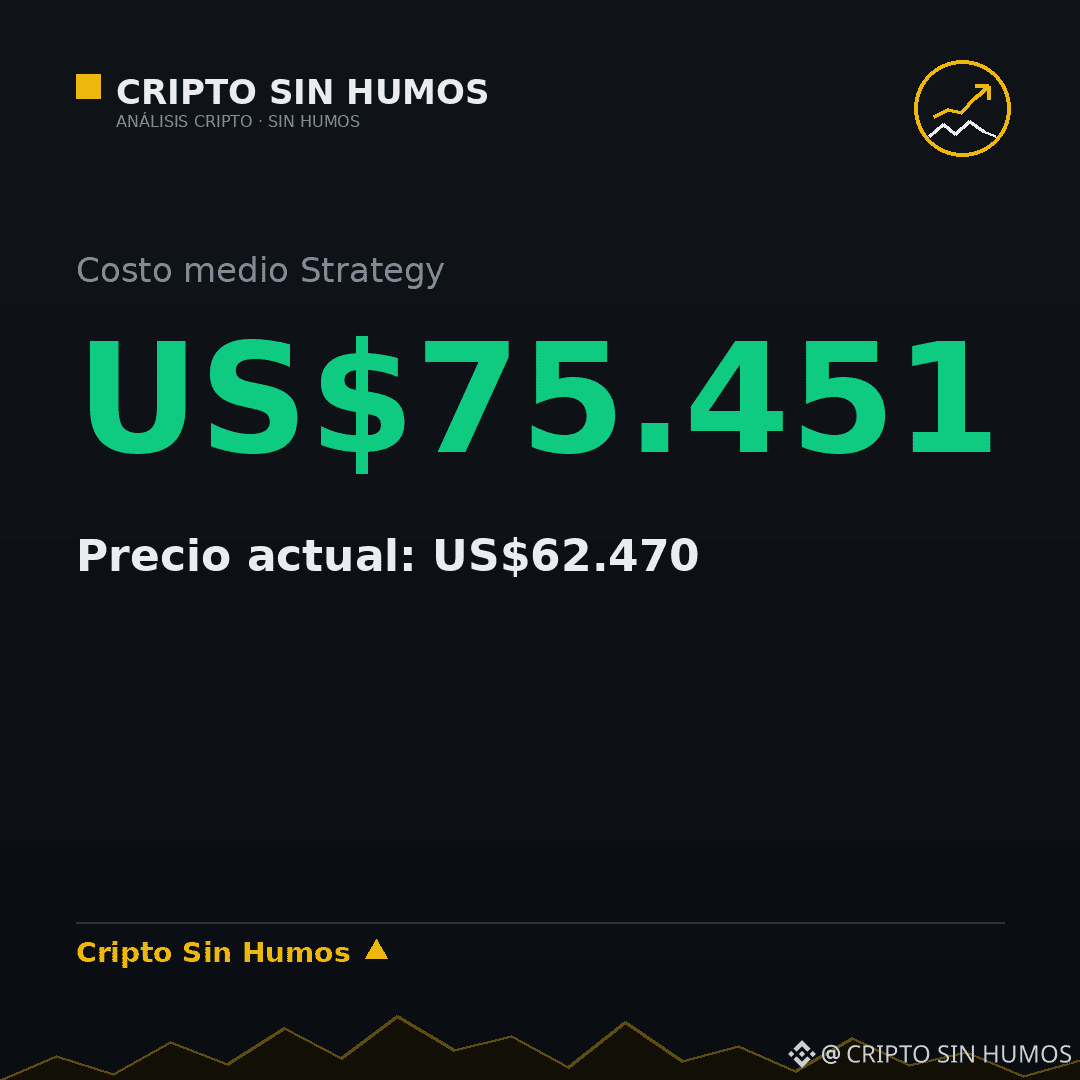
Strategy has 849,327 BTC at US$75,451
Strategy holds 849,327 BTC at an average price of US$75,451. The key point is not the size of the position, but the gap between that cost and the current price of $BTC, which is trading at US$62,470. This scenario would be invalidated if the company made a sale, however small, because it would break the assumption of absolute holding. My view is that the market is pricing in these assets remaining on the books, not being liquidated, but that confidence depends on there being no outflows. Do you think Strategy’s selling pressure is the missing variable needed to determine the next bottom?
This is not financial advice. Do your own research before investing.
Strategy has 849,327 BTC at US$75,451
Strategy holds 849,327 BTC at an average price of US$75,451. The key point is not the size of the position, but the gap between that cost and the current price of $BTC , which is trading at US$62,470. This scenario would be invalidated if the company made a sale, however small, because it would break the assumption of absolute holding. My view is that the market is pricing in these assets remaining on the books, not being liquidated, but that confidence depends on there being no outflows. Do you think Strategy’s selling pressure is the missing variable needed to determine the next bottom?
This is not financial advice. Do your own research before investing.
Strategy holds 849,327 BTC at an average price of US$75,451. The key point is not the size of the position, but the gap between that cost and the current price of $BTC , which is trading at US$62,470. This scenario would be invalidated if the company made a sale, however small, because it would break the assumption of absolute holding. My view is that the market is pricing in these assets remaining on the books, not being liquidated, but that confidence depends on there being no outflows. Do you think Strategy’s selling pressure is the missing variable needed to determine the next bottom?
This is not financial advice. Do your own research before investing.
124
The four-year cycle didn’t die: ETFs killed it
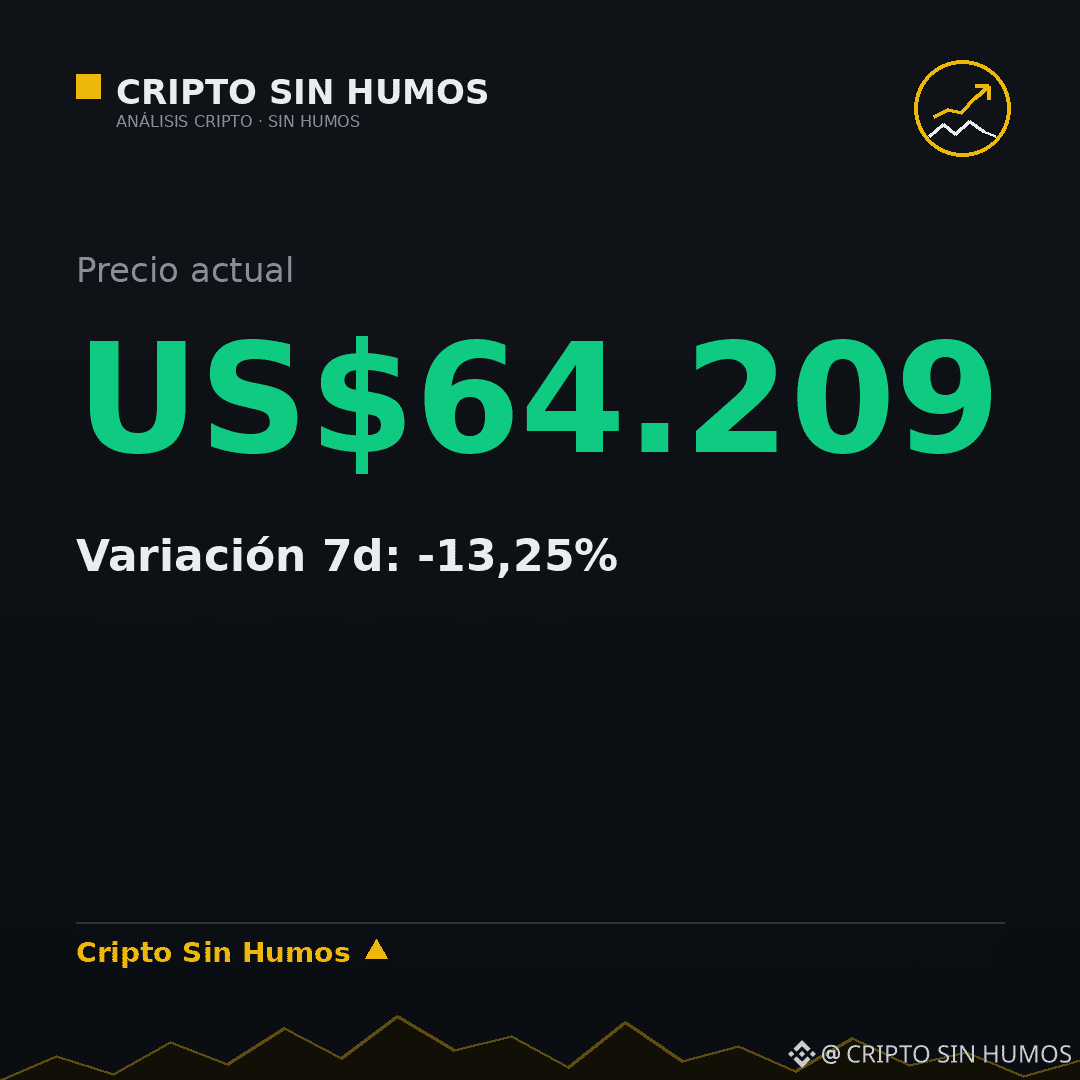
Two consecutive Octobers in the red, with drops of -3.9% in 2025 and -7.2% in 2026, break the classic narrative that the post-halving year is one of euphoria. The current price of $BTC at US$64.209 reflects a dynamic in which newly issued supply is no longer the market’s main driver.
This means that selling pressure from ETFs and institutional rotation matter more than the reduction in issuance. The thesis is clear: ETFs have redefined the four-year cycle, making issuance matter less and less in the formation of highs and lows. Extreme fear, with an index of 11/100, accompanies this structural transition.
My base case is that fund demand will continue to dominate over miner supply until the next halving. This view is invalidated if issuance becomes the determining factor again in 2028. Do you think institutional liquidity has definitively buried the mining cycle?
This is not financial advice. Do your own research before investing.
The four-year cycle didn’t die: ETFs killed it
Two consecutive Octobers in the red, with drops of -3.9% in 2025 and -7.2% in 2026, break the classic narrative that the post-halving year is one of euphoria. The current price of $BTC at US$64.209 reflects a dynamic in which newly issued supply is no longer the market’s main driver.
This means that selling pressure from ETFs and institutional rotation matter more than the reduction in issuance. The thesis is clear: ETFs have redefined the four-year cycle, making issuance matter less and less in the formation of highs and lows. Extreme fear, with an index of 11/100, accompanies this structural transition.
My base case is that fund demand will continue to dominate over miner supply until the next halving. This view is invalidated if issuance becomes the determining factor again in 2028. Do you think institutional liquidity has definitively buried the mining cycle?
This is not financial advice. Do your own research before investing.
Two consecutive Octobers in the red, with drops of -3.9% in 2025 and -7.2% in 2026, break the classic narrative that the post-halving year is one of euphoria. The current price of $BTC at US$64.209 reflects a dynamic in which newly issued supply is no longer the market’s main driver.
This means that selling pressure from ETFs and institutional rotation matter more than the reduction in issuance. The thesis is clear: ETFs have redefined the four-year cycle, making issuance matter less and less in the formation of highs and lows. Extreme fear, with an index of 11/100, accompanies this structural transition.
My base case is that fund demand will continue to dominate over miner supply until the next halving. This view is invalidated if issuance becomes the determining factor again in 2028. Do you think institutional liquidity has definitively buried the mining cycle?
This is not financial advice. Do your own research before investing.
136
1,000 EH/s of hashrate: who pays for energy when the price falls
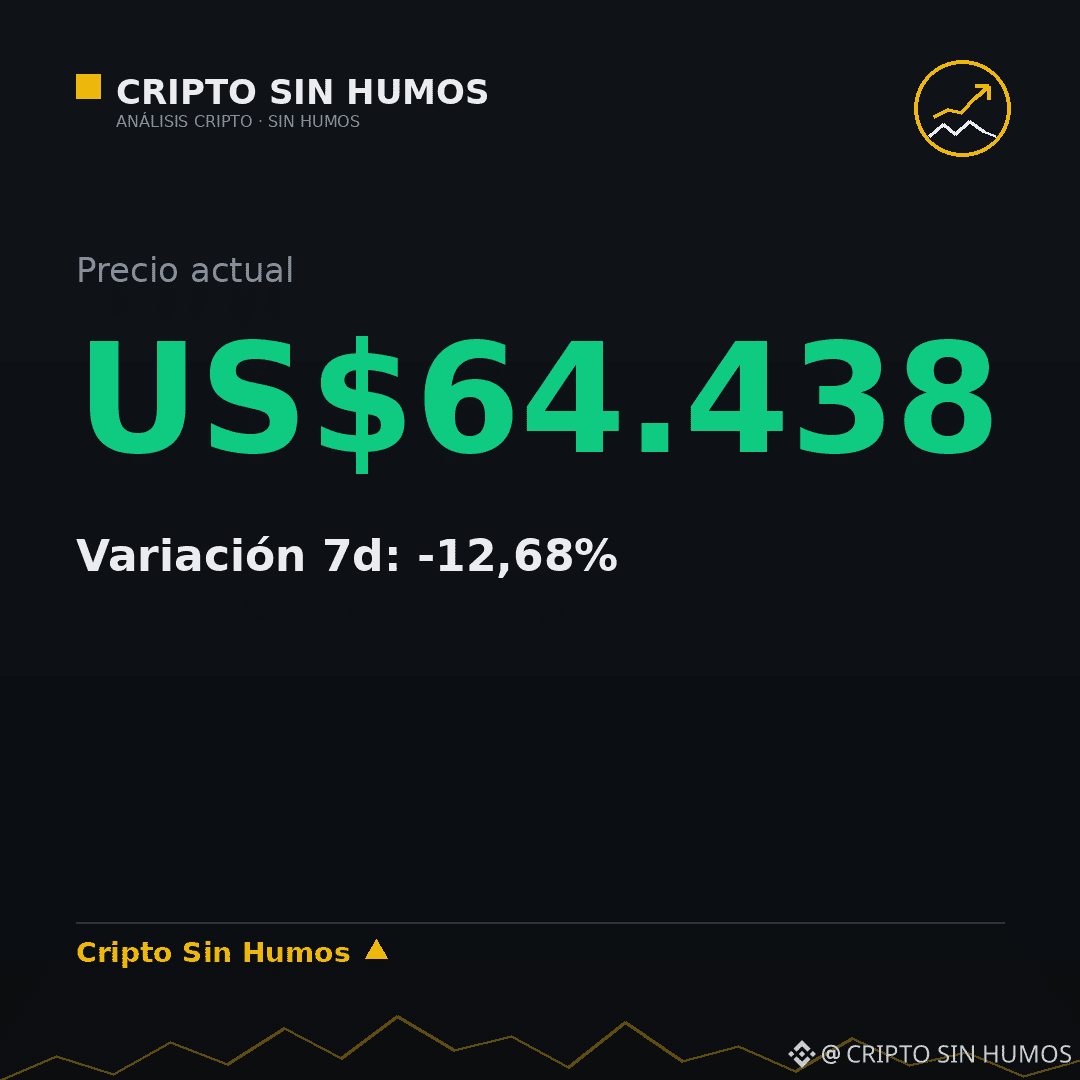
The network’s hashrate remains around 1,000 EH/s, a figure that does not distinguish between efficiency and gross expenditure. With $BTC at US$64,438, the miner profitability equation becomes critical: the asset’s price is only half the story; the other half is the cost of energy, which does not fall when the market declines. If the price collapses, the margin is squeezed until shutting down the machine is the only rational option to avoid losing money. My base case is that miners with long-term energy contracts will continue operating, while weaker independent miners will leave the market. This is invalidated if the hashrate falls 15% in a month, which would indicate that shutdowns are already happening on a large scale. Do local miners in Chile have access to enough cheap energy to survive this extreme fear cycle?
This is not financial advice. Verify before investing.
1,000 EH/s of hashrate: who pays for energy when the price falls
The network’s hashrate remains around 1,000 EH/s, a figure that does not distinguish between efficiency and gross expenditure. With $BTC at US$64,438, the miner profitability equation becomes critical: the asset’s price is only half the story; the other half is the cost of energy, which does not fall when the market declines. If the price collapses, the margin is squeezed until shutting down the machine is the only rational option to avoid losing money. My base case is that miners with long-term energy contracts will continue operating, while weaker independent miners will leave the market. This is invalidated if the hashrate falls 15% in a month, which would indicate that shutdowns are already happening on a large scale. Do local miners in Chile have access to enough cheap energy to survive this extreme fear cycle?
This is not financial advice. Verify before investing.
The network’s hashrate remains around 1,000 EH/s, a figure that does not distinguish between efficiency and gross expenditure. With $BTC at US$64,438, the miner profitability equation becomes critical: the asset’s price is only half the story; the other half is the cost of energy, which does not fall when the market declines. If the price collapses, the margin is squeezed until shutting down the machine is the only rational option to avoid losing money. My base case is that miners with long-term energy contracts will continue operating, while weaker independent miners will leave the market. This is invalidated if the hashrate falls 15% in a month, which would indicate that shutdowns are already happening on a large scale. Do local miners in Chile have access to enough cheap energy to survive this extreme fear cycle?
This is not financial advice. Verify before investing.
161
Next week: three dates and one level that will decide
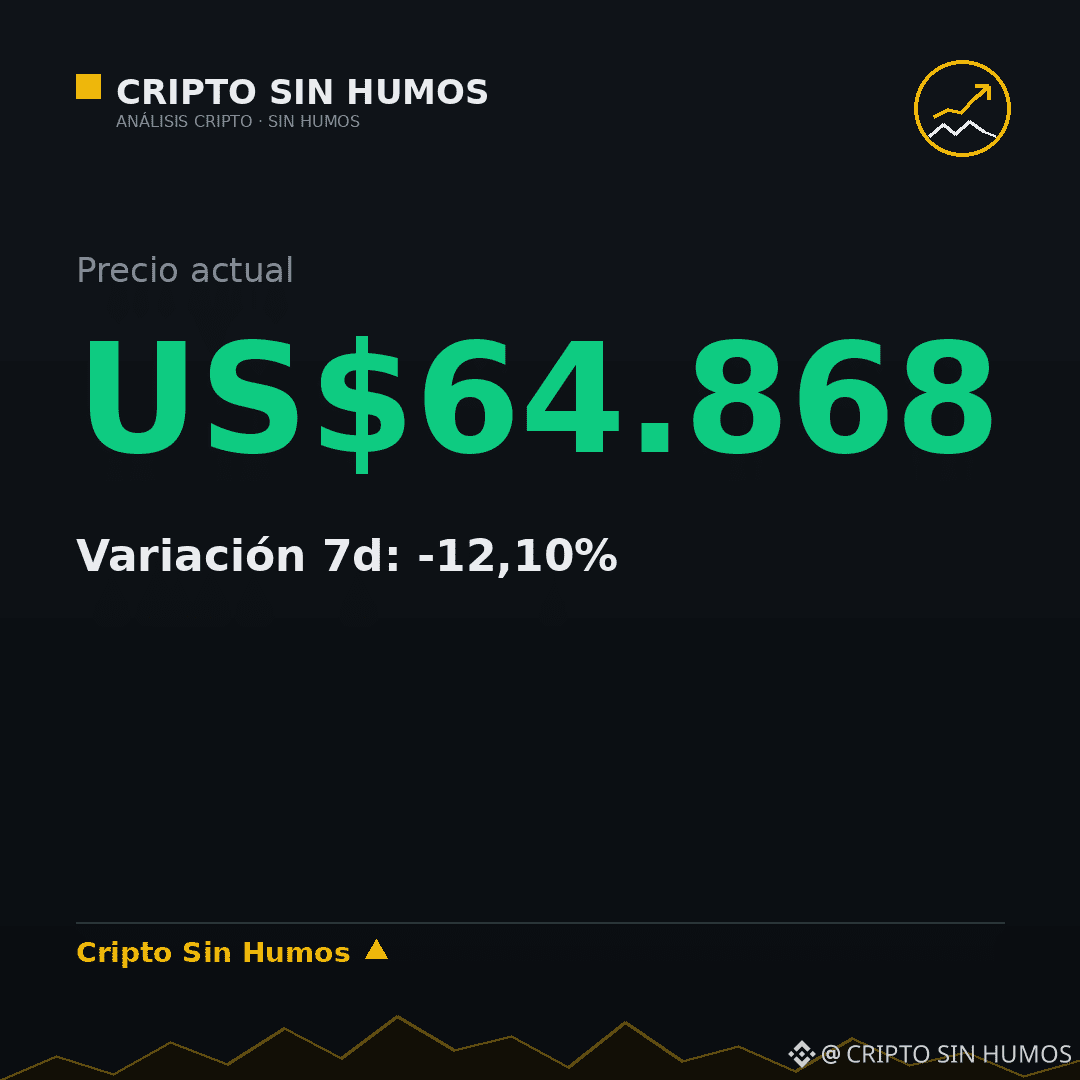
The current price of $BTC stands at US$64,868, a figure far below the 12-month high of US$87,396. This week’s thesis does not depend on the narrative, but on two specific variables: the publication of the MSCI list on November 11 and the daily direction of ETF flows. These data will determine whether the market seeks liquidity or consolidates in extreme fear, with the index at 12/100. My base case is that the 73,200 level acts as a technical barrier as long as flows do not show a clear trend reversal. This view is immediately invalidated if the week closes above 77,700, which would break the current downward structure. Which event weighs more in your analysis: the MSCI list or the flows?
This is not financial advice. Do your own research before investing.
Next week: three dates and one level that will decide
The current price of $BTC stands at US$64,868, a figure far below the 12-month high of US$87,396. This week’s thesis does not depend on the narrative, but on two specific variables: the publication of the MSCI list on November 11 and the daily direction of ETF flows. These data will determine whether the market seeks liquidity or consolidates in extreme fear, with the index at 12/100. My base case is that the 73,200 level acts as a technical barrier as long as flows do not show a clear trend reversal. This view is immediately invalidated if the week closes above 77,700, which would break the current downward structure. Which event weighs more in your analysis: the MSCI list or the flows?
This is not financial advice. Do your own research before investing.
The current price of $BTC stands at US$64,868, a figure far below the 12-month high of US$87,396. This week’s thesis does not depend on the narrative, but on two specific variables: the publication of the MSCI list on November 11 and the daily direction of ETF flows. These data will determine whether the market seeks liquidity or consolidates in extreme fear, with the index at 12/100. My base case is that the 73,200 level acts as a technical barrier as long as flows do not show a clear trend reversal. This view is immediately invalidated if the week closes above 77,700, which would break the current downward structure. Which event weighs more in your analysis: the MSCI list or the flows?
This is not financial advice. Do your own research before investing.
BTC-1,72%
MSCIUS-2,28%
101
Five metrics to check on Monday without drowning in candlesticks
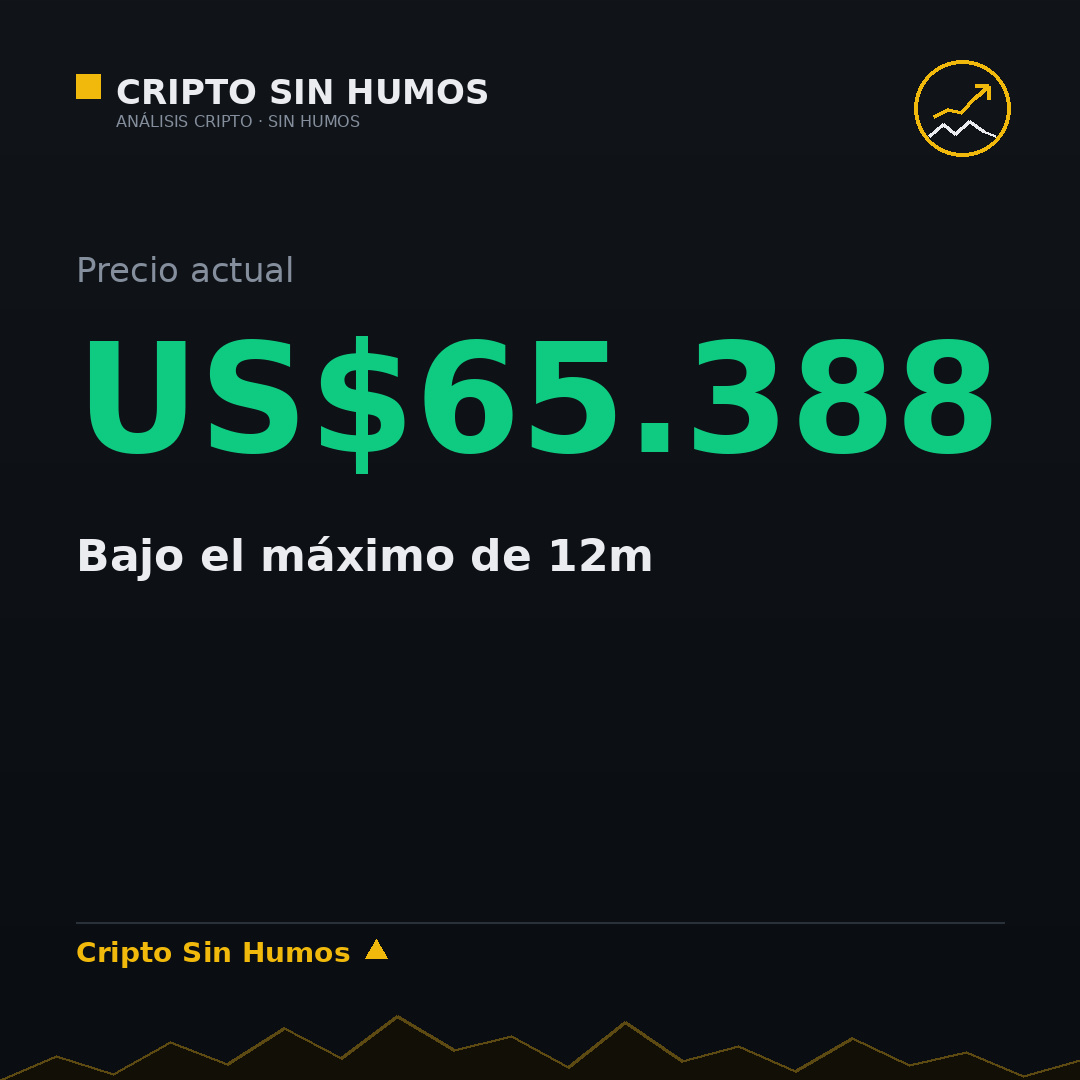
The price of $BTC is US$65,388, well below the 12-month high of US$87,396. This gap defines the current context. The thesis is clear: three metrics are enough to tell whether you're in a panic, range-bound, or euphoric. You don't need to analyze every candlestick. Extreme fear persists, suggesting the market is in a stress phase, not a euphoric one. My base case is that the price will remain range-bound until volatility metrics normalize. This is invalidated if two of the three key metrics move into extreme territory at the same time, which would indicate a regime shift. Which of the five do you watch?
This is not financial advice. Do your own research before investing.
Five metrics to check on Monday without drowning in candlesticks
The price of $BTC is US$65,388, well below the 12-month high of US$87,396. This gap defines the current context. The thesis is clear: three metrics are enough to tell whether you're in a panic, range-bound, or euphoric. You don't need to analyze every candlestick. Extreme fear persists, suggesting the market is in a stress phase, not a euphoric one. My base case is that the price will remain range-bound until volatility metrics normalize. This is invalidated if two of the three key metrics move into extreme territory at the same time, which would indicate a regime shift. Which of the five do you watch?
This is not financial advice. Do your own research before investing.
The price of $BTC is US$65,388, well below the 12-month high of US$87,396. This gap defines the current context. The thesis is clear: three metrics are enough to tell whether you're in a panic, range-bound, or euphoric. You don't need to analyze every candlestick. Extreme fear persists, suggesting the market is in a stress phase, not a euphoric one. My base case is that the price will remain range-bound until volatility metrics normalize. This is invalidated if two of the three key metrics move into extreme territory at the same time, which would indicate a regime shift. Which of the five do you watch?
This is not financial advice. Do your own research before investing.
162
Five lessons from the US$6.3 billion theft (and none is about Bitcoin)
US$6.3 billion was stolen, 98% has been recovered, and US$2.85 billion remains frozen.
This event does not affect the architecture of the Bitcoin network, whose price is trading at US$64,485, far below its 12-month high of US$87,396. The situation shows that users’ exposure depends on the quality of external custody, not on the underlying blockchain.
My base-case scenario is that the vulnerability lay in the company’s custody practices; this would be invalidated if a protocol failure were to emerge, which has not happened. In any case, the responsibility for protecting the funds lies with whoever controls the keys, and $BTC continues operating under its own rules.
What custody measures do you consider essential to prevent incidents of this magnitude?
This is not financial advice. Do your own research before investing.
Five lessons from the US$6.3 billion theft (and none is about Bitcoin)
US$6.3 billion was stolen, 98% has been recovered, and US$2.85 billion remains frozen.
This event does not affect the architecture of the Bitcoin network, whose price is trading at US$64,485, far below its 12-month high of US$87,396. The situation shows that users’ exposure depends on the quality of external custody, not on the underlying blockchain.
My base-case scenario is that the vulnerability lay in the company’s custody practices; this would be invalidated if a protocol failure were to emerge, which has not happened. In any case, the responsibility for protecting the funds lies with whoever controls the keys, and $BTC continues operating under its own rules.
What custody measures do you consider essential to prevent incidents of this magnitude?
This is not financial advice. Do your own research before investing.
US$6.3 billion was stolen, 98% has been recovered, and US$2.85 billion remains frozen.
This event does not affect the architecture of the Bitcoin network, whose price is trading at US$64,485, far below its 12-month high of US$87,396. The situation shows that users’ exposure depends on the quality of external custody, not on the underlying blockchain.
My base-case scenario is that the vulnerability lay in the company’s custody practices; this would be invalidated if a protocol failure were to emerge, which has not happened. In any case, the responsibility for protecting the funds lies with whoever controls the keys, and $BTC continues operating under its own rules.
What custody measures do you consider essential to prevent incidents of this magnitude?
This is not financial advice. Do your own research before investing.

109
Those who are in vs. those who aren’t (part two): the one waiting for the exact bottom
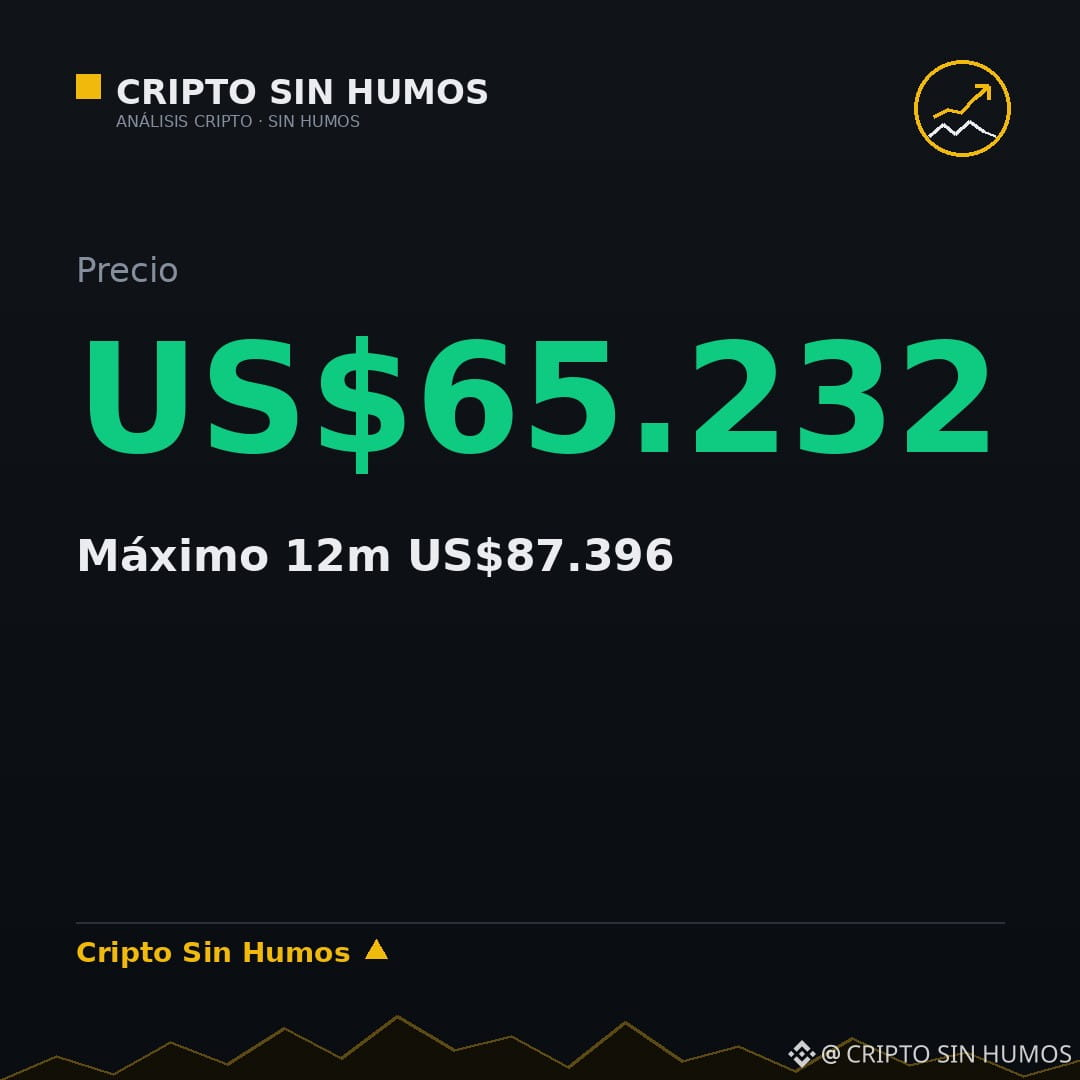
Five consecutive weeks of closing in the red mark the longest losing streak for $BTC. The current price is US$65,232, down 12.85% over the past seven days, with a high of US$87,396 reached in the past twelve months. This sustained decline suggests that the market remains under pressure and that buyers waiting for the “exact bottom” may be chasing a rebound that is no longer justified by recent fundamentals.
In this context, the expectation of a precise support level leads traders to enter buy positions during brief recoveries, often resulting in further losses when the price falls again. The lack of a clear bottom turns the strategy into a bet based more on hope than on objective data.
My base case is that someone waiting for the exact bottom usually buys a rebound they can no longer justify; this is invalidated if the piece is humorous. Do you think continuing to wait for a specific support level is still viable in a market with prolonged downward trends?
This is not financial advice. Do your own research before investing.
Those who are in vs. those who aren’t (part two): the one waiting for the exact bottom
Five consecutive weeks of closing in the red mark the longest losing streak for $BTC . The current price is US$65,232, down 12.85% over the past seven days, with a high of US$87,396 reached in the past twelve months. This sustained decline suggests that the market remains under pressure and that buyers waiting for the “exact bottom” may be chasing a rebound that is no longer justified by recent fundamentals.
In this context, the expectation of a precise support level leads traders to enter buy positions during brief recoveries, often resulting in further losses when the price falls again. The lack of a clear bottom turns the strategy into a bet based more on hope than on objective data.
My base case is that someone waiting for the exact bottom usually buys a rebound they can no longer justify; this is invalidated if the piece is humorous. Do you think continuing to wait for a specific support level is still viable in a market with prolonged downward trends?
This is not financial advice. Do your own research before investing.
Five consecutive weeks of closing in the red mark the longest losing streak for $BTC . The current price is US$65,232, down 12.85% over the past seven days, with a high of US$87,396 reached in the past twelve months. This sustained decline suggests that the market remains under pressure and that buyers waiting for the “exact bottom” may be chasing a rebound that is no longer justified by recent fundamentals.
In this context, the expectation of a precise support level leads traders to enter buy positions during brief recoveries, often resulting in further losses when the price falls again. The lack of a clear bottom turns the strategy into a bet based more on hope than on objective data.
My base case is that someone waiting for the exact bottom usually buys a rebound they can no longer justify; this is invalidated if the piece is humorous. Do you think continuing to wait for a specific support level is still viable in a market with prolonged downward trends?
This is not financial advice. Do your own research before investing.
250
If your bank shuts down its app on a Monday, how much of your money do you have outside it?
Ueno Bank has 3 million customers, and 97% of its balances are covered by insurance, but there is no set payment date. This means the protection exists on paper, but actual liquidity may take weeks or months. Meanwhile, the crypto market reflects the tension: the fear and greed index is at 10/100, an extreme fear level, and the price of $BTC stands at US$65,482, far below its 12-month high. My base case is that relying exclusively on traditional banking leaves an operational gap during a liquidity crisis; this scenario would be invalidated if the insurance pays the full amount in less than 30 days. What percentage of your assets do you currently keep outside the banking system?
This is not financial advice. Verify before investing.
If your bank shuts down its app on a Monday, how much of your money do you have outside it?
Ueno Bank has 3 million customers, and 97% of its balances are covered by insurance, but there is no set payment date. This means the protection exists on paper, but actual liquidity may take weeks or months. Meanwhile, the crypto market reflects the tension: the fear and greed index is at 10/100, an extreme fear level, and the price of $BTC stands at US$65,482, far below its 12-month high. My base case is that relying exclusively on traditional banking leaves an operational gap during a liquidity crisis; this scenario would be invalidated if the insurance pays the full amount in less than 30 days. What percentage of your assets do you currently keep outside the banking system?
This is not financial advice. Verify before investing.
Ueno Bank has 3 million customers, and 97% of its balances are covered by insurance, but there is no set payment date. This means the protection exists on paper, but actual liquidity may take weeks or months. Meanwhile, the crypto market reflects the tension: the fear and greed index is at 10/100, an extreme fear level, and the price of $BTC stands at US$65,482, far below its 12-month high. My base case is that relying exclusively on traditional banking leaves an operational gap during a liquidity crisis; this scenario would be invalidated if the insurance pays the full amount in less than 30 days. What percentage of your assets do you currently keep outside the banking system?
This is not financial advice. Verify before investing.

121
Six red weeks or a rebound: what the 200-day average at 73,240 says
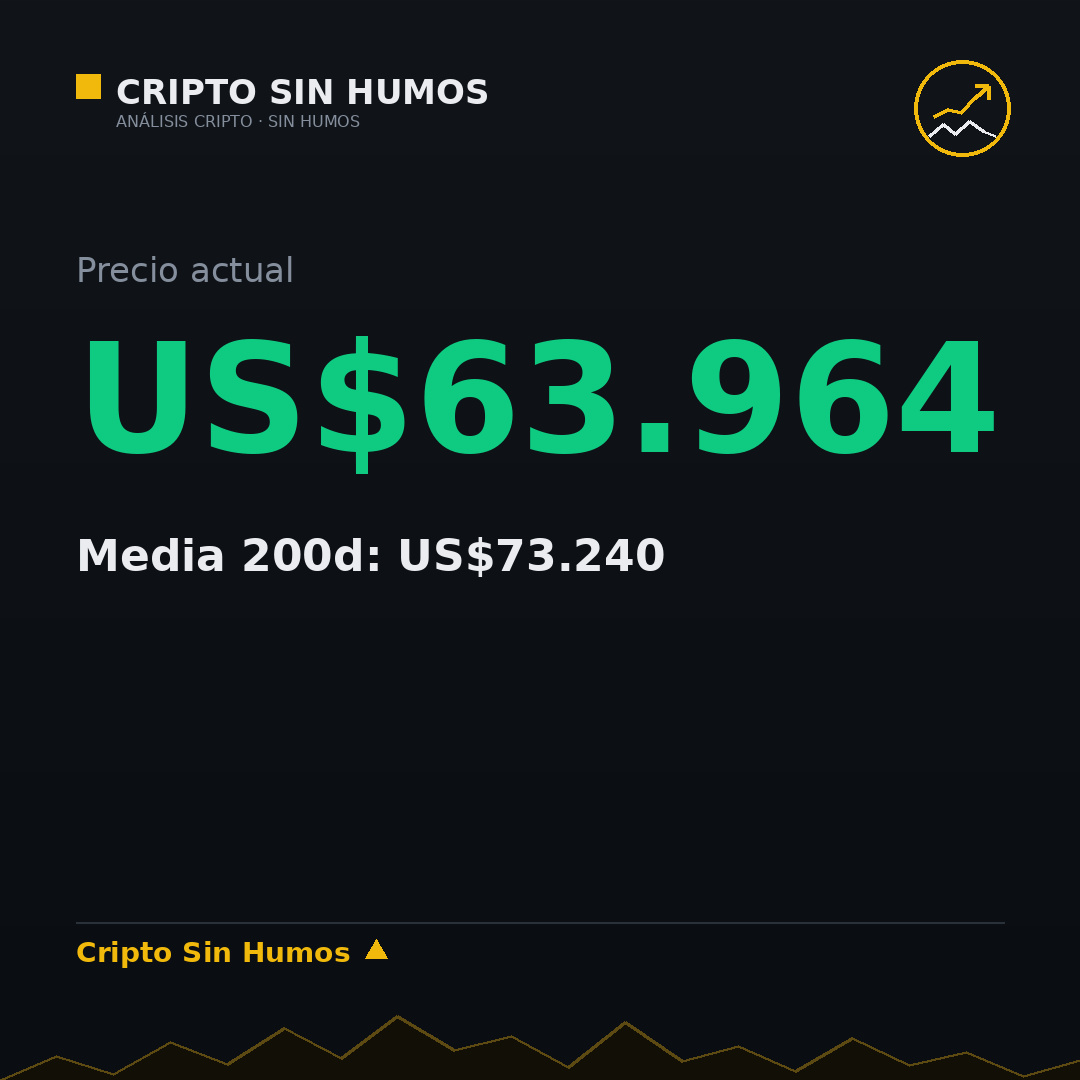
The current price of $BTC is US$63,964, far below the 200-day average of US$73,240. This distance defines the current technical picture. The thesis is clear: the range between 73,200 and 77,700 will determine the medium-term trend; any move outside that band is operational noise. My base case is that the asset will remain under downward pressure unless it recovers that level. This view is invalidated if there is a daily close below US$73,203, which would confirm the structural breakdown. The 15.69% decline over seven days reflects the strength of selling pressure. Do you think the price will manage to rebound toward the average before the end of the week?
This is not financial advice. Verify before investing.
Six red weeks or a rebound: what the 200-day average at 73,240 says
The current price of $BTC is US$63,964, far below the 200-day average of US$73,240. This distance defines the current technical picture. The thesis is clear: the range between 73,200 and 77,700 will determine the medium-term trend; any move outside that band is operational noise. My base case is that the asset will remain under downward pressure unless it recovers that level. This view is invalidated if there is a daily close below US$73,203, which would confirm the structural breakdown. The 15.69% decline over seven days reflects the strength of selling pressure. Do you think the price will manage to rebound toward the average before the end of the week?
This is not financial advice. Verify before investing.
The current price of $BTC is US$63,964, far below the 200-day average of US$73,240. This distance defines the current technical picture. The thesis is clear: the range between 73,200 and 77,700 will determine the medium-term trend; any move outside that band is operational noise. My base case is that the asset will remain under downward pressure unless it recovers that level. This view is invalidated if there is a daily close below US$73,203, which would confirm the structural breakdown. The 15.69% decline over seven days reflects the strength of selling pressure. Do you think the price will manage to rebound toward the average before the end of the week?
This is not financial advice. Verify before investing.
522
Paraguay and mining: 1,300 MW on the line
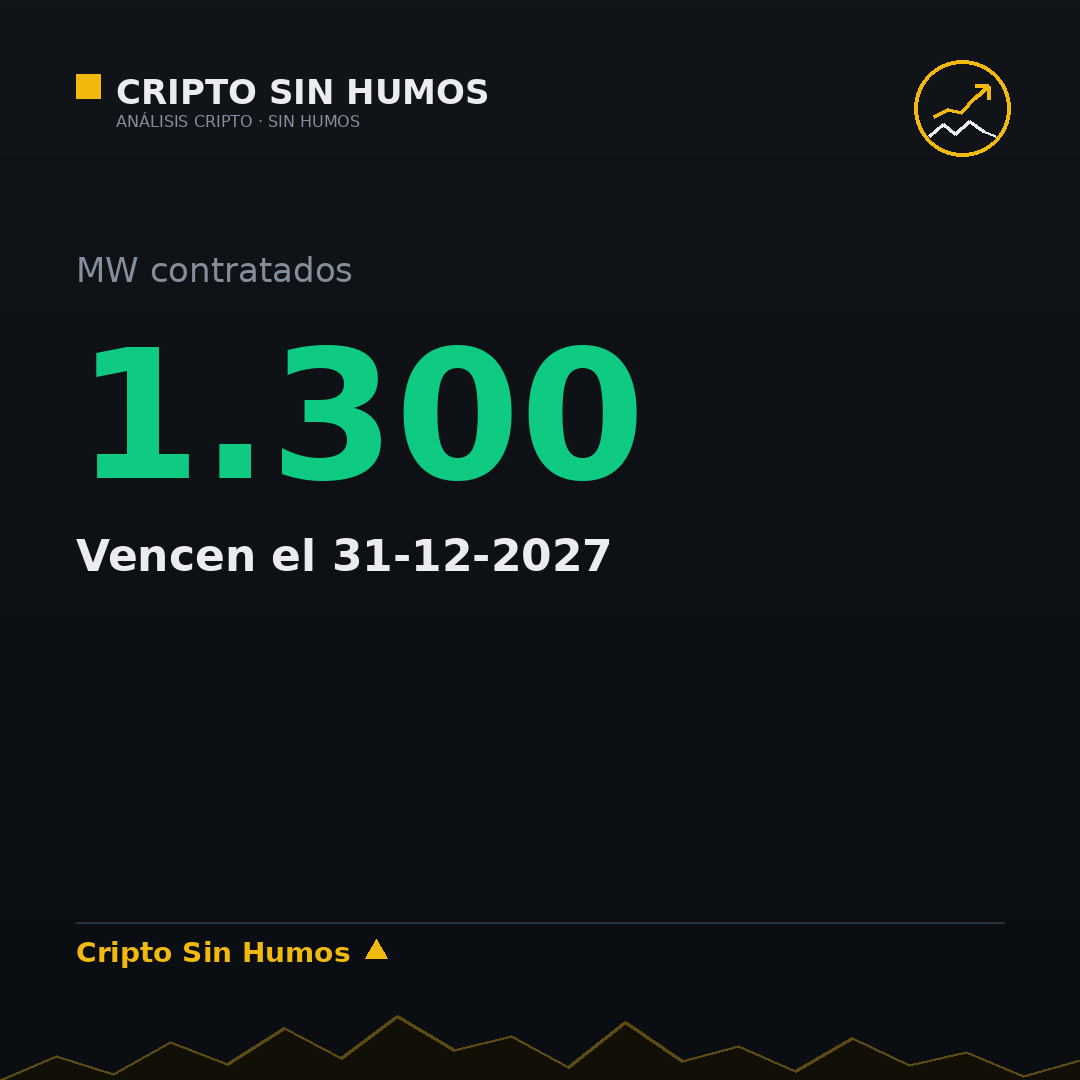
Paraguay has 1,300 MW contracted to the mining industry, and those contracts expire on December 31, 2027. The figure is concrete and the deadline is near. The global context isn't helping: $BTC is trading at US$67,271, far below the 12-month high of US$87,396. This price gap directly affects the profitability of mining operations in the region.
The Ueno crisis has increased fiscal pressure on the sector. With the asset's price falling, the margin for error is shrinking. Electricity rates are likely to be reviewed to protect state revenue. The local market is watching closely to see how the renewal of these contracts will be negotiated.
My base-case scenario is that the Paraguayan state will increase the tax burden or adjust rates before 2027. This scenario would be invalidated if ANDE renews the contracts for 10 years, allowing the hashrate to remain stable without structural changes to regulations. Do you think a rate adjustment is inevitable, or is there room to negotiate continued service?
This is not financial advice. Do your own research before investing.
Paraguay and mining: 1,300 MW on the line
Paraguay has 1,300 MW contracted to the mining industry, and those contracts expire on December 31, 2027. The figure is concrete and the deadline is near. The global context isn't helping: $BTC is trading at US$67,271, far below the 12-month high of US$87,396. This price gap directly affects the profitability of mining operations in the region.
The Ueno crisis has increased fiscal pressure on the sector. With the asset's price falling, the margin for error is shrinking. Electricity rates are likely to be reviewed to protect state revenue. The local market is watching closely to see how the renewal of these contracts will be negotiated.
My base-case scenario is that the Paraguayan state will increase the tax burden or adjust rates before 2027. This scenario would be invalidated if ANDE renews the contracts for 10 years, allowing the hashrate to remain stable without structural changes to regulations. Do you think a rate adjustment is inevitable, or is there room to negotiate continued service?
This is not financial advice. Do your own research before investing.
Paraguay has 1,300 MW contracted to the mining industry, and those contracts expire on December 31, 2027. The figure is concrete and the deadline is near. The global context isn't helping: $BTC is trading at US$67,271, far below the 12-month high of US$87,396. This price gap directly affects the profitability of mining operations in the region.
The Ueno crisis has increased fiscal pressure on the sector. With the asset's price falling, the margin for error is shrinking. Electricity rates are likely to be reviewed to protect state revenue. The local market is watching closely to see how the renewal of these contracts will be negotiated.
My base-case scenario is that the Paraguayan state will increase the tax burden or adjust rates before 2027. This scenario would be invalidated if ANDE renews the contracts for 10 years, allowing the hashrate to remain stable without structural changes to regulations. Do you think a rate adjustment is inevitable, or is there room to negotiate continued service?
This is not financial advice. Do your own research before investing.
123
Sixth week of losses: price falls below its 200-day average but remains above market cost
The price of $BTC trades at US$68,848, 9.22% below its level a week ago. This decline puts the asset 5.81% below its 200-day average, which marks the long-term trend at US$73,094. The technical picture is weak, but the fundamental data changes the context: the realized price, which represents the average cost at which each bitcoin moved over the past year, is US$53,905. This means that although the price is below its long-term average, it is still above the market’s average acquisition cost. The difference between the spot price and that level is what separates a technical adjustment from widespread losses. My base case is that the market is not in a structurally loss-making position, since the spot price maintains a safety cushion above realized cost. This view would be invalidated if the price falls below US$53,905, at which point the market average would move into loss. Do you think the current extreme fear is a sign of selling exhaustion, or just a correction within the downtrend?
This is not financial advice. Do your own research before investing.
Sixth week of losses: price falls below its 200-day average but remains above market cost
The price of $BTC trades at US$68,848, 9.22% below its level a week ago. This decline puts the asset 5.81% below its 200-day average, which marks the long-term trend at US$73,094. The technical picture is weak, but the fundamental data changes the context: the realized price, which represents the average cost at which each bitcoin moved over the past year, is US$53,905. This means that although the price is below its long-term average, it is still above the market’s average acquisition cost. The difference between the spot price and that level is what separates a technical adjustment from widespread losses. My base case is that the market is not in a structurally loss-making position, since the spot price maintains a safety cushion above realized cost. This view would be invalidated if the price falls below US$53,905, at which point the market average would move into loss. Do you think the current extreme fear is a sign of selling exhaustion, or just a correction within the downtrend?
This is not financial advice. Do your own research before investing.
The price of $BTC trades at US$68,848, 9.22% below its level a week ago. This decline puts the asset 5.81% below its 200-day average, which marks the long-term trend at US$73,094. The technical picture is weak, but the fundamental data changes the context: the realized price, which represents the average cost at which each bitcoin moved over the past year, is US$53,905. This means that although the price is below its long-term average, it is still above the market’s average acquisition cost. The difference between the spot price and that level is what separates a technical adjustment from widespread losses. My base case is that the market is not in a structurally loss-making position, since the spot price maintains a safety cushion above realized cost. This view would be invalidated if the price falls below US$53,905, at which point the market average would move into loss. Do you think the current extreme fear is a sign of selling exhaustion, or just a correction within the downtrend?
This is not financial advice. Do your own research before investing.

250
$1.6 billion in liquidations and funding remains flat: the drop did not leave the market overleveraged
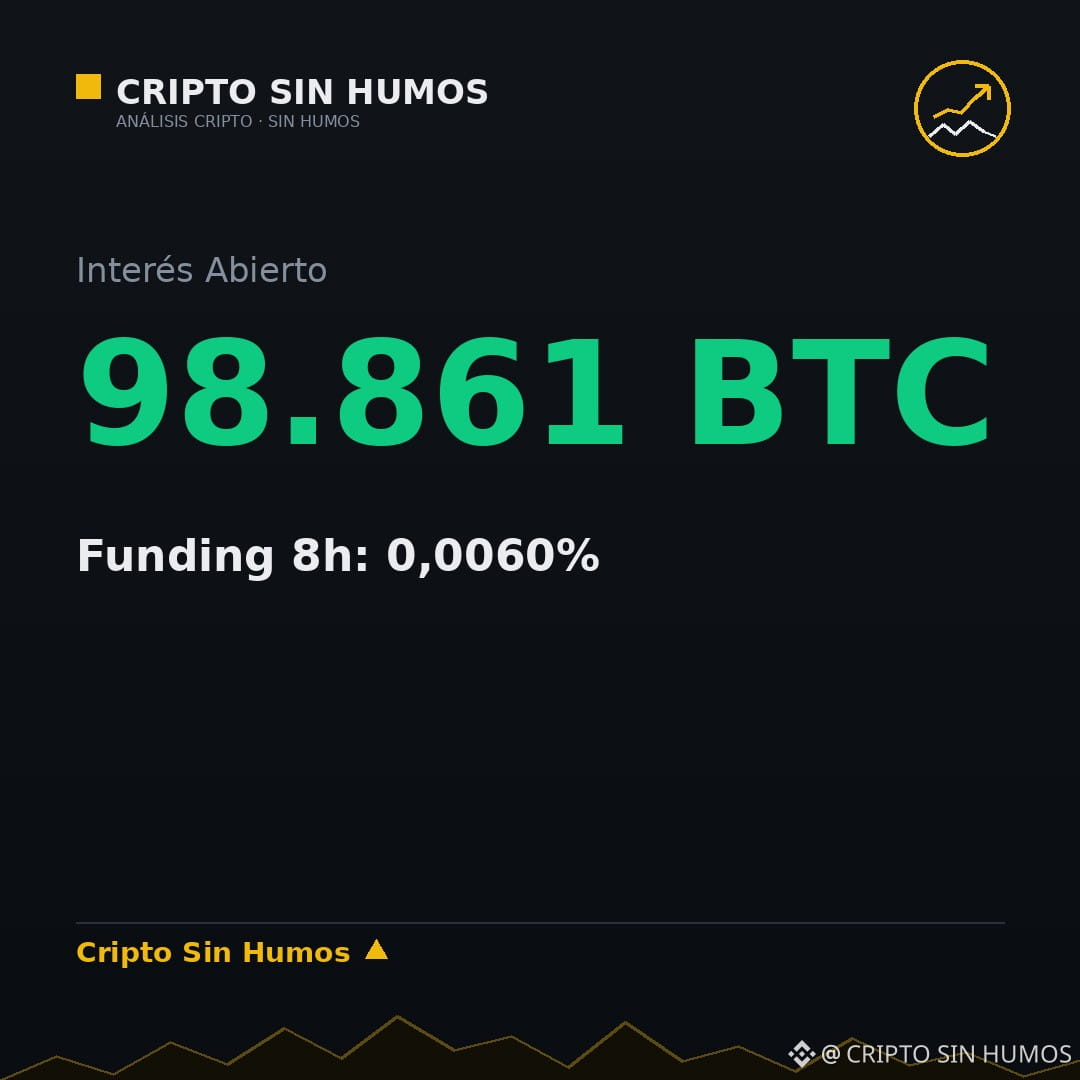
The price of $BTC hit a 12-week low of US$68,638, while liquidations exceeded US$1.6 billion. This move coincides with a strengthening dollar amid the interest rate outlook, putting pressure on the risk asset. The US$1.6 billion figure is significant, but the derivatives context changes how we interpret it. The 8-hour funding rate remains at 0.0060%, and open interest is holding at 98,861 BTC. This indicates that the drop was driven by isolated forced positions, not a widespread reduction in leverage. My base-case scenario is that, as long as funding stays near zero, the risk of another liquidation cascade is low. This thesis is invalidated if funding turns negative and open interest drops sharply on the same day. Do you think the market has already priced in the impact of the liquidations, or is more adjustment still needed?
This is not financial advice. Do your own research before investing.
$1.6 billion in liquidations and funding remains flat: the drop did not leave the market overleveraged
The price of $BTC hit a 12-week low of US$68,638, while liquidations exceeded US$1.6 billion. This move coincides with a strengthening dollar amid the interest rate outlook, putting pressure on the risk asset. The US$1.6 billion figure is significant, but the derivatives context changes how we interpret it. The 8-hour funding rate remains at 0.0060%, and open interest is holding at 98,861 BTC. This indicates that the drop was driven by isolated forced positions, not a widespread reduction in leverage. My base-case scenario is that, as long as funding stays near zero, the risk of another liquidation cascade is low. This thesis is invalidated if funding turns negative and open interest drops sharply on the same day. Do you think the market has already priced in the impact of the liquidations, or is more adjustment still needed?
This is not financial advice. Do your own research before investing.
The price of $BTC hit a 12-week low of US$68,638, while liquidations exceeded US$1.6 billion. This move coincides with a strengthening dollar amid the interest rate outlook, putting pressure on the risk asset. The US$1.6 billion figure is significant, but the derivatives context changes how we interpret it. The 8-hour funding rate remains at 0.0060%, and open interest is holding at 98,861 BTC. This indicates that the drop was driven by isolated forced positions, not a widespread reduction in leverage. My base-case scenario is that, as long as funding stays near zero, the risk of another liquidation cascade is low. This thesis is invalidated if funding turns negative and open interest drops sharply on the same day. Do you think the market has already priced in the impact of the liquidations, or is more adjustment still needed?
This is not financial advice. Do your own research before investing.
149
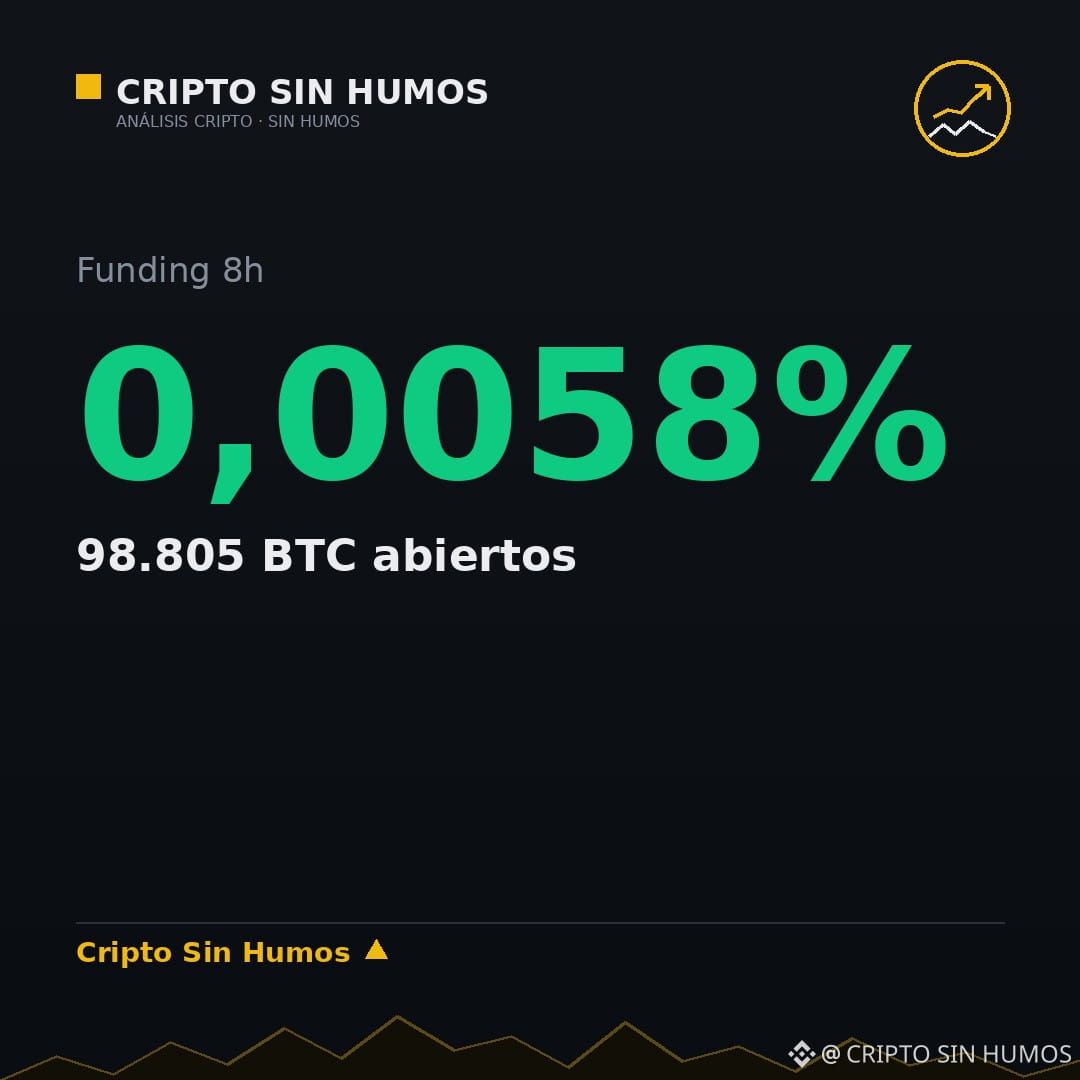
Funding at 0.0058% and 98,805 BTC in open interest: the market isn't leveraged
The 8-hour funding rate is at 0.0058%, with 98,805 BTC in open interest. That's a low level for a market that's down 3.88% in 24 hours: if there were excessive leverage, the funding rate would be different.
This means the drop isn't coming from cascading liquidations. The price of US$68,688 is moving on organic flows, and open interest isn't unwinding—which is what usually happens when leveraged longs give up.
My base case is that selling pressure will remain gradual as long as funding stays near zero. This view is invalidated if funding turns negative and open interest drops sharply: then I would call it capitulation and expect another bottom. $BTC
Do you see the drop as an orderly correction, or do you think the capitulation that usually marks the bottom is still to come?
This is not financial advice. Verify before investing.
Funding at 0.0058% and 98,805 BTC in open interest: the market isn't leveraged
The 8-hour funding rate is at 0.0058%, with 98,805 BTC in open interest. That's a low level for a market that's down 3.88% in 24 hours: if there were excessive leverage, the funding rate would be different.
This means the drop isn't coming from cascading liquidations. The price of US$68,688 is moving on organic flows, and open interest isn't unwinding—which is what usually happens when leveraged longs give up.
My base case is that selling pressure will remain gradual as long as funding stays near zero. This view is invalidated if funding turns negative and open interest drops sharply: then I would call it capitulation and expect another bottom. $BTC
Do you see the drop as an orderly correction, or do you think the capitulation that usually marks the bottom is still to come?
This is not financial advice. Verify before investing.
The 8-hour funding rate is at 0.0058%, with 98,805 BTC in open interest. That's a low level for a market that's down 3.88% in 24 hours: if there were excessive leverage, the funding rate would be different.
This means the drop isn't coming from cascading liquidations. The price of US$68,688 is moving on organic flows, and open interest isn't unwinding—which is what usually happens when leveraged longs give up.
My base case is that selling pressure will remain gradual as long as funding stays near zero. This view is invalidated if funding turns negative and open interest drops sharply: then I would call it capitulation and expect another bottom. $BTC
Do you see the drop as an orderly correction, or do you think the capitulation that usually marks the bottom is still to come?
This is not financial advice. Verify before investing.
129
The price isn’t waiting for the Fed: it’s waiting for the US$430 million that flowed out of ETFs
On November 5, US$430.2 million in net outflows left spot $BTC ETFs, according to Farside data. This outflow occurred while the asset was trading at US$71,413, down 6.14% over the past seven days. Institutional selling pressure isn’t letting up because of macroeconomic noise or expectations of rate cuts; the market responds to the actual liquidity flowing into or out of investment vehicles. My base case is that without sustained positive flows, any technical rebound will be fragile and vulnerable to reversing at the slightest sign of weakness. This thesis would be invalidated if we saw three consecutive days of positive net inflows into ETFs, which would confirm a structural shift in demand. Do you think the price can hold without the support of institutional flows?
This is not financial advice. Do your own research before investing.
The price isn’t waiting for the Fed: it’s waiting for the US$430 million that flowed out of ETFs
On November 5, US$430.2 million in net outflows left spot $BTC ETFs, according to Farside data. This outflow occurred while the asset was trading at US$71,413, down 6.14% over the past seven days. Institutional selling pressure isn’t letting up because of macroeconomic noise or expectations of rate cuts; the market responds to the actual liquidity flowing into or out of investment vehicles. My base case is that without sustained positive flows, any technical rebound will be fragile and vulnerable to reversing at the slightest sign of weakness. This thesis would be invalidated if we saw three consecutive days of positive net inflows into ETFs, which would confirm a structural shift in demand. Do you think the price can hold without the support of institutional flows?
This is not financial advice. Do your own research before investing.
On November 5, US$430.2 million in net outflows left spot $BTC ETFs, according to Farside data. This outflow occurred while the asset was trading at US$71,413, down 6.14% over the past seven days. Institutional selling pressure isn’t letting up because of macroeconomic noise or expectations of rate cuts; the market responds to the actual liquidity flowing into or out of investment vehicles. My base case is that without sustained positive flows, any technical rebound will be fragile and vulnerable to reversing at the slightest sign of weakness. This thesis would be invalidated if we saw three consecutive days of positive net inflows into ETFs, which would confirm a structural shift in demand. Do you think the price can hold without the support of institutional flows?
This is not financial advice. Do your own research before investing.

92
MSCI decides today: why removing Strategy from the indexes matters more than the price
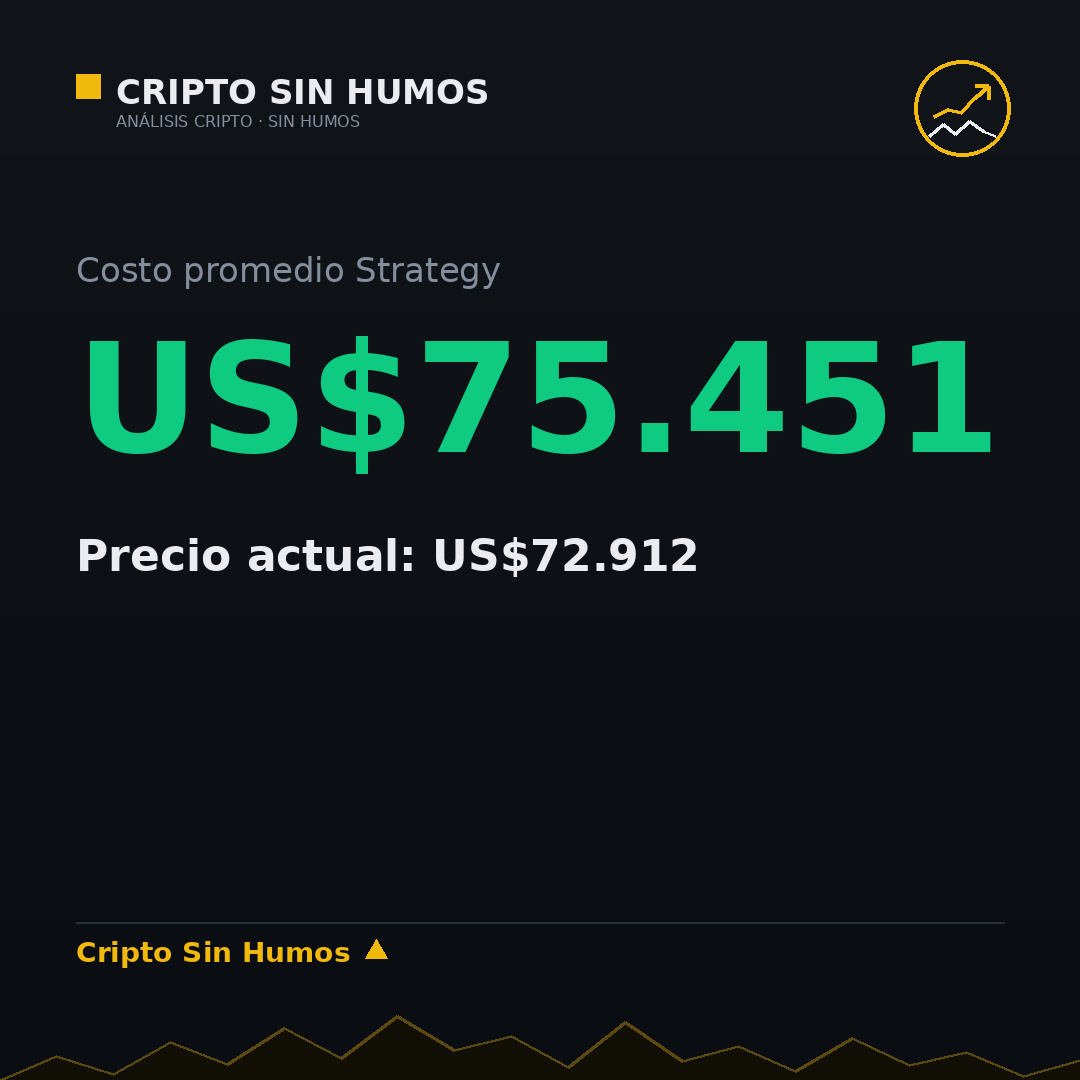
Strategy holds 849,327 BTC at an average cost of US$75,451. With the current price at US$72,912, the position is operating at an accounting loss. This is happening just as MSCI reviews its inclusion in global indexes on November 11. The key factor is not the spot price, but the gap between the acquisition cost and the market value. If passive flows depend on the profitability of the underlying asset, an accounting loss at the largest corporate holder could be seen as a structural risk. My base-case scenario is that MSCI will prioritize liquidity over immediate profitability and maintain the inclusion. This view would be invalidated if the committee decides that exposure to the volatility of $BTC exceeds the risk thresholds for institutional investors. In that case, a forced exit would create selling pressure that the market is not prepared to absorb. Do you consider Strategy's accounting loss a decisive factor in MSCI's decision?
This is not financial advice. Verify before investing.
MSCI decides today: why removing Strategy from the indexes matters more than the price
Strategy holds 849,327 BTC at an average cost of US$75,451. With the current price at US$72,912, the position is operating at an accounting loss. This is happening just as MSCI reviews its inclusion in global indexes on November 11. The key factor is not the spot price, but the gap between the acquisition cost and the market value. If passive flows depend on the profitability of the underlying asset, an accounting loss at the largest corporate holder could be seen as a structural risk. My base-case scenario is that MSCI will prioritize liquidity over immediate profitability and maintain the inclusion. This view would be invalidated if the committee decides that exposure to the volatility of $BTC exceeds the risk thresholds for institutional investors. In that case, a forced exit would create selling pressure that the market is not prepared to absorb. Do you consider Strategy's accounting loss a decisive factor in MSCI's decision?
This is not financial advice. Verify before investing.
Strategy holds 849,327 BTC at an average cost of US$75,451. With the current price at US$72,912, the position is operating at an accounting loss. This is happening just as MSCI reviews its inclusion in global indexes on November 11. The key factor is not the spot price, but the gap between the acquisition cost and the market value. If passive flows depend on the profitability of the underlying asset, an accounting loss at the largest corporate holder could be seen as a structural risk. My base-case scenario is that MSCI will prioritize liquidity over immediate profitability and maintain the inclusion. This view would be invalidated if the committee decides that exposure to the volatility of $BTC exceeds the risk thresholds for institutional investors. In that case, a forced exit would create selling pressure that the market is not prepared to absorb. Do you consider Strategy's accounting loss a decisive factor in MSCI's decision?
This is not financial advice. Verify before investing.
86
At what price would you sell your bitcoin: 85,000, 100,000, or not sell?
The Fear and Greed Index is at 28/100, compared with 29/100 yesterday. Meanwhile, $BTC is trading at US$73,735, down 3.09% over seven days. This scenario suggests that current fear does not necessarily signal a technical bottom, but rather a pause in market dynamics. My base case is that this fear, without extreme leverage, acts as consolidation rather than a breaking point. This thesis is invalidated if the index rises above 55 without the price recovering US$77,700. Would you sell at 85,000, wait for 100,000, or hold your position?
This is not financial advice. Do your own research before investing.
At what price would you sell your bitcoin: 85,000, 100,000, or not sell?
The Fear and Greed Index is at 28/100, compared with 29/100 yesterday. Meanwhile, $BTC is trading at US$73,735, down 3.09% over seven days. This scenario suggests that current fear does not necessarily signal a technical bottom, but rather a pause in market dynamics. My base case is that this fear, without extreme leverage, acts as consolidation rather than a breaking point. This thesis is invalidated if the index rises above 55 without the price recovering US$77,700. Would you sell at 85,000, wait for 100,000, or hold your position?
This is not financial advice. Do your own research before investing.
The Fear and Greed Index is at 28/100, compared with 29/100 yesterday. Meanwhile, $BTC is trading at US$73,735, down 3.09% over seven days. This scenario suggests that current fear does not necessarily signal a technical bottom, but rather a pause in market dynamics. My base case is that this fear, without extreme leverage, acts as consolidation rather than a breaking point. This thesis is invalidated if the index rises above 55 without the price recovering US$77,700. Would you sell at 85,000, wait for 100,000, or hold your position?
This is not financial advice. Do your own research before investing.

1
422
Log in to explore more content
Join global crypto users on Binance Square
⚡️ Get latest and useful information about crypto.
💬 Trusted by the world’s largest crypto exchange.
👍 Discover real insights from verified creators.
Email / Phone number
Trending Topics
XRPDropsToTwoYearLowNear87Cents
2,086 views
95 Discussing
🚨 XRP CRASHES TO $0.87! IS A BIGGER SELL-OFF COMING? 📉
XRP is facing another major setback as selling pressure spreads across the crypto market!
On November 21, XRP dropped to approximately $0.87, reaching its lowest level since November 2024. 👀
🔍 Here's what happened:
• Sharp decline: XRP fell around 9% in 24 hours and approximately 11.5% over the week.
• ETF pressure: US Spot XRP ETFs recorded around $4.97 million in net outflows on Friday.
• Liquidations: Approximately $18 million in XRP futures positions were liquidated, with nearly 94% coming from long positions.
• ETF assets decline: Total net assets across five US Spot XRP ETFs slipped below $1 billion.
• Oversold territory: XRP's daily RSI dropped below 30, suggesting heavy selling pressure. However, this does not guarantee an immediate recovery.
The decline is happening alongside a broader crypto market sell-off, showing that XRP is not facing pressure alone.
🔥 Can XRP recover above $1, or could sellers push the price even lower?
$XRP - $DODO - $RARE
#xrp #Ripple #CryptoMarket #XRPDropsToTwoYearLowNear87Cents
"Can XRP recover above $1 soon"!?⚡
GirlyHub
·2 Likes
·1.2k views
BitcoinFallsBelow$57KToTwoYearLow
1,206 views
20 Discussing
NvidiaLoses$2.7TrillionInMonthAndAHalf
606 views
31 Discussing