
mohamed_hamoud
2.6k Posts

mohamed_hamoud
Report
Block User
High-Frequency Trader
2.2 Years
723 Following
54 Followers
30 Liked
Posts
All
Quotes
$SPCXB 📈 Long buy setup
Entry: $146.64
Target 1: $147.88714
Target 2: $149.13429
Target 3: $150.38143
Stop loss: $145.39286
Setup on the hourly chart. Trend alignment confirmed.
#SPCX $SPCX
{future}(SPCXUSDT)
$SPCXB
{spot}(SPCXBUSDT)
#BTCRemainsUnderPressureAfterHawkishFOMCMinutes #BTCRemainsUnderPressureAfterHawkishFOMCMinutes #NvidiaBoardReportedlySplitOverHuang’sReturn #CanGTA6'sLaunchLiftTTWOShares?
$SPCXB 📈 Long buy setup
Entry: $146.64
Target 1: $147.88714
Target 2: $149.13429
Target 3: $150.38143
Stop loss: $145.39286
Setup on the hourly chart. Trend alignment confirmed.
#SPCX $SPCX
$SPCXB
#BTCRemainsUnderPressureAfterHawkishFOMCMinutes #BTCRemainsUnderPressureAfterHawkishFOMCMinutes #NvidiaBoardReportedlySplitOverHuang’sReturn #CanGTA6'sLaunchLiftTTWOShares?
Entry: $146.64
Target 1: $147.88714
Target 2: $149.13429
Target 3: $150.38143
Stop loss: $145.39286
Setup on the hourly chart. Trend alignment confirmed.
#SPCX $SPCX
$SPCXB
#BTCRemainsUnderPressureAfterHawkishFOMCMinutes #BTCRemainsUnderPressureAfterHawkishFOMCMinutes #NvidiaBoardReportedlySplitOverHuang’sReturn #CanGTA6'sLaunchLiftTTWOShares?
1
15
$IDOL Trade Setup
Symbol: $IDOL (IDOLUSDT Perp)
Position: Long 🚀🟢
Entry Range:
0.02050 - 0.02150 🎯
Take Profit (TP):
TP1: 0.02360 🎯
TP2: 0.02750 🎯
TP3: 0.03250 🎯
Stop Loss (SL):
SL: 0.01780 🛑
Symbol Details and Market Analysis: $IDOL (MEET48) is trending upward, with daily gains of +13.49%, making a strong rebound and recovering from a key support zone that held for several days near 0.012910. The price has reclaimed the MA(7) level (0.019962) and the MA(25) level (0.019007), alongside increasing buying volume, and is targeting an initial breakout test of the MA(99) resistance at 0.023600.
Risk Level: 3 / 5
Leverage: 15
{future}(IDOLUSDT)
#BTC #bitcoin #Binance #SouthKoreaPlansToLet3500ListedFirmsBuyBitcoin #FedMinutesShowAlmostAllOfficialsExpectMoreHikes
$IDOL Trade Setup
Symbol: $IDOL (IDOLUSDT Perp)
Position: Long 🚀🟢
Entry Range:
0.02050 - 0.02150 🎯
Take Profit (TP):
TP1: 0.02360 🎯
TP2: 0.02750 🎯
TP3: 0.03250 🎯
Stop Loss (SL):
SL: 0.01780 🛑
Symbol Details and Market Analysis: $IDOL (MEET48) is trending upward, with daily gains of +13.49%, making a strong rebound and recovering from a key support zone that held for several days near 0.012910. The price has reclaimed the MA(7) level (0.019962) and the MA(25) level (0.019007), alongside increasing buying volume, and is targeting an initial breakout test of the MA(99) resistance at 0.023600.
Risk Level: 3 / 5
Leverage: 15
#BTC #bitcoin #Binance #SouthKoreaPlansToLet3500ListedFirmsBuyBitcoin #FedMinutesShowAlmostAllOfficialsExpectMoreHikes
Symbol: $IDOL (IDOLUSDT Perp)
Position: Long 🚀🟢
Entry Range:
0.02050 - 0.02150 🎯
Take Profit (TP):
TP1: 0.02360 🎯
TP2: 0.02750 🎯
TP3: 0.03250 🎯
Stop Loss (SL):
SL: 0.01780 🛑
Symbol Details and Market Analysis: $IDOL (MEET48) is trending upward, with daily gains of +13.49%, making a strong rebound and recovering from a key support zone that held for several days near 0.012910. The price has reclaimed the MA(7) level (0.019962) and the MA(25) level (0.019007), alongside increasing buying volume, and is targeting an initial breakout test of the MA(99) resistance at 0.023600.
Risk Level: 3 / 5
Leverage: 15
#BTC #bitcoin #Binance #SouthKoreaPlansToLet3500ListedFirmsBuyBitcoin #FedMinutesShowAlmostAllOfficialsExpectMoreHikes
18
18
$SOPH Trade Setup
Symbol: $SOPH (SOPHUSDT Perpetual Contract)
Position: Long 🚀🟢
Entry Range:
0.000980 - 0.001030 🎯
Take Profit (TP):
TP1: 0.001180 🎯
TP2: 0.001350 🎯
TP3: 0.001580 🎯
Stop Loss (SL):
SL: 0.000830 🛑
Symbol Details and Market Analysis: $SOPH is showing strong recovery momentum, posting daily gains of +14.80% after clearly bouncing from key support near the swing low at 0.000833. The price is testing the confluence of the MA(7) (0.001026) and MA(25) (0.001036) moving averages; a decisive breakout above this zone could open the way for a strong corrective rally toward the MA(99) at 0.001325.
Risk Level: 3 / 5
{future}(SOPHUSDT)
$SOPH Trade Setup
Symbol: $SOPH (SOPHUSDT Perpetual Contract)
Position: Long 🚀🟢
Entry Range:
0.000980 - 0.001030 🎯
Take Profit (TP):
TP1: 0.001180 🎯
TP2: 0.001350 🎯
TP3: 0.001580 🎯
Stop Loss (SL):
SL: 0.000830 🛑
Symbol Details and Market Analysis: $SOPH is showing strong recovery momentum, posting daily gains of +14.80% after clearly bouncing from key support near the swing low at 0.000833. The price is testing the confluence of the MA(7) (0.001026) and MA(25) (0.001036) moving averages; a decisive breakout above this zone could open the way for a strong corrective rally toward the MA(99) at 0.001325.
Risk Level: 3 / 5
Symbol: $SOPH (SOPHUSDT Perpetual Contract)
Position: Long 🚀🟢
Entry Range:
0.000980 - 0.001030 🎯
Take Profit (TP):
TP1: 0.001180 🎯
TP2: 0.001350 🎯
TP3: 0.001580 🎯
Stop Loss (SL):
SL: 0.000830 🛑
Symbol Details and Market Analysis: $SOPH is showing strong recovery momentum, posting daily gains of +14.80% after clearly bouncing from key support near the swing low at 0.000833. The price is testing the confluence of the MA(7) (0.001026) and MA(25) (0.001036) moving averages; a decisive breakout above this zone could open the way for a strong corrective rally toward the MA(99) at 0.001325.
Risk Level: 3 / 5
4
127
🟢 $ICNT
{future}(ICNTUSDT)
$ICNT / USDt
📈 Direction: Bullish – LONG
💰 Entry zone:
0.3390 – 0.3420
🚀 Targets:
- TP1: 0.3480
- TP2: 0.3520
- TP3: 0.3580
🛑 Stop loss (SL):
0.3340
━━━━━━━━━━━━━━
📊 Technical analysis:
- Strong V-shaped recovery from 0.3200.
- Current resistance near 0.3448.
- A breakout above 0.3450 could support continued upward movement.
- Extended targets: 0.3580 – 0.3650.
⚠️ Momentum support level:
0.3350
📌 Plan:
Wait for confirmation of a breakout above 0.3450 on the 15-minute timeframe, and avoid chasing the price at the highs.
$ICNT
🟢 $ICNT
$ICNT / USDt
📈 Direction: Bullish – LONG
💰 Entry zone:
0.3390 – 0.3420
🚀 Targets:
- TP1: 0.3480
- TP2: 0.3520
- TP3: 0.3580
🛑 Stop loss (SL):
0.3340
━━━━━━━━━━━━━━
📊 Technical analysis:
- Strong V-shaped recovery from 0.3200.
- Current resistance near 0.3448.
- A breakout above 0.3450 could support continued upward movement.
- Extended targets: 0.3580 – 0.3650.
⚠️ Momentum support level:
0.3350
📌 Plan:
Wait for confirmation of a breakout above 0.3450 on the 15-minute timeframe, and avoid chasing the price at the highs.
$ICNT
$ICNT / USDt
📈 Direction: Bullish – LONG
💰 Entry zone:
0.3390 – 0.3420
🚀 Targets:
- TP1: 0.3480
- TP2: 0.3520
- TP3: 0.3580
🛑 Stop loss (SL):
0.3340
━━━━━━━━━━━━━━
📊 Technical analysis:
- Strong V-shaped recovery from 0.3200.
- Current resistance near 0.3448.
- A breakout above 0.3450 could support continued upward movement.
- Extended targets: 0.3580 – 0.3650.
⚠️ Momentum support level:
0.3350
📌 Plan:
Wait for confirmation of a breakout above 0.3450 on the 15-minute timeframe, and avoid chasing the price at the highs.
$ICNT
77
🟢 $ AKE / USDT
📈 Direction: LONG
$AKE
💰 Current price: 0.010547
📊 Change: +8.09%
🎯 Entry zone:
0.0105077 – 0.0105903
🚀 Targets:
- TP1: 0.0112327 (+6.5%)
- TP2: 0.0116885 (+10.8%)
- TP3: 0.0123721 (+17.3%)
🛑 Stop loss (SL):
0.0096374 (-8.6%)
📊 Technical analysis:
- The hourly trend is bullish.
- The price is above the EMA cluster.
- ADX: 31.8
- DI+: 25.0
- DI−: 13.5
📌 Trade management:
- Close 50% at TP1.
- Close 25% at TP2.
- Close 25% at TP3.
- Move the stop loss to the entry point after TP1.
⚠️ Signal strength: Moderate.
Caution is advised; avoid using an excessively large position size.
Note: This is educational analysis, not investment advice.
$AKE
{future}(AKEUSDT)
#BTC突破7万大关 #Altcoins! #btc
🟢 $ AKE / USDT
📈 Direction: LONG
$AKE
💰 Current price: 0.010547
📊 Change: +8.09%
🎯 Entry zone:
0.0105077 – 0.0105903
🚀 Targets:
- TP1: 0.0112327 (+6.5%)
- TP2: 0.0116885 (+10.8%)
- TP3: 0.0123721 (+17.3%)
🛑 Stop loss (SL):
0.0096374 (-8.6%)
📊 Technical analysis:
- The hourly trend is bullish.
- The price is above the EMA cluster.
- ADX: 31.8
- DI+: 25.0
- DI−: 13.5
📌 Trade management:
- Close 50% at TP1.
- Close 25% at TP2.
- Close 25% at TP3.
- Move the stop loss to the entry point after TP1.
⚠️ Signal strength: Moderate.
Caution is advised; avoid using an excessively large position size.
Note: This is educational analysis, not investment advice.
$AKE
#BTC突破7万大关 #Altcoins! #btc
📈 Direction: LONG
$AKE
💰 Current price: 0.010547
📊 Change: +8.09%
🎯 Entry zone:
0.0105077 – 0.0105903
🚀 Targets:
- TP1: 0.0112327 (+6.5%)
- TP2: 0.0116885 (+10.8%)
- TP3: 0.0123721 (+17.3%)
🛑 Stop loss (SL):
0.0096374 (-8.6%)
📊 Technical analysis:
- The hourly trend is bullish.
- The price is above the EMA cluster.
- ADX: 31.8
- DI+: 25.0
- DI−: 13.5
📌 Trade management:
- Close 50% at TP1.
- Close 25% at TP2.
- Close 25% at TP3.
- Move the stop loss to the entry point after TP1.
⚠️ Signal strength: Moderate.
Caution is advised; avoid using an excessively large position size.
Note: This is educational analysis, not investment advice.
$AKE
#BTC突破7万大关 #Altcoins! #btc
141
🟢 $ETHFI
{future}(ETHFIUSDT)
Breakout: 0.5278
Target 1: 0.5350
Target 2: 0.5450
Target 3: 0.5550
🔴 Pullback:
0.5150
0.5100
0.5000
#BTCRemainsUnderPressureAfterHawkishFOMCMinutes #CanGTA6'sLaunchLiftTTWOShares? #FOMCMinutesHighlightAIDebtRisks #BTC
🟢 $ETHFI
Breakout: 0.5278
Target 1: 0.5350
Target 2: 0.5450
Target 3: 0.5550
🔴 Pullback:
0.5150
0.5100
0.5000
#BTCRemainsUnderPressureAfterHawkishFOMCMinutes #CanGTA6'sLaunchLiftTTWOShares? #FOMCMinutesHighlightAIDebtRisks #BTC
Breakout: 0.5278
Target 1: 0.5350
Target 2: 0.5450
Target 3: 0.5550
🔴 Pullback:
0.5150
0.5100
0.5000
#BTCRemainsUnderPressureAfterHawkishFOMCMinutes #CanGTA6'sLaunchLiftTTWOShares? #FOMCMinutesHighlightAIDebtRisks #BTC
30
🟢 $USELESS
{future}(USELESSUSDT)
Breakout: 0.10193
Target 1: 0.10300
Target 2: 0.10500
Target 3: 0.11000
🔴 Pullback:
0.10000
0.09800
0.09400
#FedMinutesShowAlmostAllOfficialsExpectMoreHikes #CanGTA6'sLaunchLiftTTWOShares? #BTCRemainsUnderPressureAfterHawkishFOMCMinutes #FedMinutesShowAlmostAllOfficialsExpectMoreHikes #CanGTA6'sLaunchLiftTTWOShares?
🟢 $USELESS
Breakout: 0.10193
Target 1: 0.10300
Target 2: 0.10500
Target 3: 0.11000
🔴 Pullback:
0.10000
0.09800
0.09400
#FedMinutesShowAlmostAllOfficialsExpectMoreHikes #CanGTA6'sLaunchLiftTTWOShares? #BTCRemainsUnderPressureAfterHawkishFOMCMinutes #FedMinutesShowAlmostAllOfficialsExpectMoreHikes #CanGTA6'sLaunchLiftTTWOShares?
Breakout: 0.10193
Target 1: 0.10300
Target 2: 0.10500
Target 3: 0.11000
🔴 Pullback:
0.10000
0.09800
0.09400
#FedMinutesShowAlmostAllOfficialsExpectMoreHikes #CanGTA6'sLaunchLiftTTWOShares? #BTCRemainsUnderPressureAfterHawkishFOMCMinutes #FedMinutesShowAlmostAllOfficialsExpectMoreHikes #CanGTA6'sLaunchLiftTTWOShares?
31
🟢 $STX
{future}(STXUSDT)
Breakout: 0.2810
Target 1: 0.2850
Target 2: 0.2900
Target 3: 0.2950
🔴 Pullback:
0.2750
0.2700
0.2650
#BTCRemainsUnderPressureAfterHawkishFOMCMinutes #CanGTA6'sLaunchLiftTTWOShares? #BTC #BinanceSquareTalks
🟢 $STX
Breakout: 0.2810
Target 1: 0.2850
Target 2: 0.2900
Target 3: 0.2950
🔴 Pullback:
0.2750
0.2700
0.2650
#BTCRemainsUnderPressureAfterHawkishFOMCMinutes #CanGTA6'sLaunchLiftTTWOShares? #BTC #BinanceSquareTalks
Breakout: 0.2810
Target 1: 0.2850
Target 2: 0.2900
Target 3: 0.2950
🔴 Pullback:
0.2750
0.2700
0.2650
#BTCRemainsUnderPressureAfterHawkishFOMCMinutes #CanGTA6'sLaunchLiftTTWOShares? #BTC #BinanceSquareTalks
4
🚀 $BITO just made a massive move! Is this a recovery or just a temporary spike?
$BITO is getting a lot of attention after surging to 16.64 (+94.17%). The 4-hour chart shows a sharp downward wick to 8.70, followed by a quick recovery.
But I wouldn’t consider this a confirmed bullish reversal just yet. 👀
📊 Key levels to watch:
Resistance: 16.82–17.09
Next resistance: 19.08
Current price: 16.64
Main wick low: 8.70
The price is still trading below the 7-, 25-, and 99-period moving averages, so buyers need to reclaim the nearby resistance zone and hold above it.
My view: If $BITO breaks above 17.09 and holds its strength, a move toward 19.08 could become interesting. But rejection at this level could lead to another pullback.
🔥 After a rise of nearly 100%, would you take a bullish position or wait for confirmation?
{future}(BITOUSDT)
#FOMCMinutesHighlightAIDebtRisks #NvidiaBoardReportedlySplitOverHuang’sReturn #BTCRemainsUnderPressureAfterHawkishFOMCMinutes #BTC
🚀 $BITO just made a massive move! Is this a recovery or just a temporary spike?
$BITO is getting a lot of attention after surging to 16.64 (+94.17%). The 4-hour chart shows a sharp downward wick to 8.70, followed by a quick recovery.
But I wouldn’t consider this a confirmed bullish reversal just yet. 👀
📊 Key levels to watch:
Resistance: 16.82–17.09
Next resistance: 19.08
Current price: 16.64
Main wick low: 8.70
The price is still trading below the 7-, 25-, and 99-period moving averages, so buyers need to reclaim the nearby resistance zone and hold above it.
My view: If $BITO breaks above 17.09 and holds its strength, a move toward 19.08 could become interesting. But rejection at this level could lead to another pullback.
🔥 After a rise of nearly 100%, would you take a bullish position or wait for confirmation?
#FOMCMinutesHighlightAIDebtRisks #NvidiaBoardReportedlySplitOverHuang’sReturn #BTCRemainsUnderPressureAfterHawkishFOMCMinutes #BTC
$BITO is getting a lot of attention after surging to 16.64 (+94.17%). The 4-hour chart shows a sharp downward wick to 8.70, followed by a quick recovery.
But I wouldn’t consider this a confirmed bullish reversal just yet. 👀
📊 Key levels to watch:
Resistance: 16.82–17.09
Next resistance: 19.08
Current price: 16.64
Main wick low: 8.70
The price is still trading below the 7-, 25-, and 99-period moving averages, so buyers need to reclaim the nearby resistance zone and hold above it.
My view: If $BITO breaks above 17.09 and holds its strength, a move toward 19.08 could become interesting. But rejection at this level could lead to another pullback.
🔥 After a rise of nearly 100%, would you take a bullish position or wait for confirmation?
#FOMCMinutesHighlightAIDebtRisks #NvidiaBoardReportedlySplitOverHuang’sReturn #BTCRemainsUnderPressureAfterHawkishFOMCMinutes #BTC
41
ETHFI+ $USELESS + $STX Breakout or pullback?
$ETHFI: Breakout $0.5278 → $0.5350 → $0.5450 → $0.5550 | Drop to $0.5150 → $0.5100 → $0.5000
USELESS: Breakout $0.10193 → $0.10300 → $0.10500 → $0.11000 | Drop to $0.10000 → $0.09800 → $0.09400
$STX: Breakout $0.2810 → $0.2850 → $0.2900 → $0.2950 | Drop to $0.2750 → $0.2700 → $0.2650
Momentum: USELESS leads with a gain of +110.42% over 90 days, while ETHFI shows strong gains today. STX is testing its 24-hour high after breaking out of its previous range.
USELESS has the strongest long-term momentum. Wait for confirmation on the 15-minute timeframe—and avoid chasing sudden spikes!
#BTC #bitcoin
{future}(ETHFIUSDT)
{future}(USELESSUSDT)
{future}(STXUSDT)
ETHFI+ $USELESS + $STX Breakout or pullback?
$ETHFI: Breakout $0.5278 → $0.5350 → $0.5450 → $0.5550 | Drop to $0.5150 → $0.5100 → $0.5000
USELESS: Breakout $0.10193 → $0.10300 → $0.10500 → $0.11000 | Drop to $0.10000 → $0.09800 → $0.09400
$STX : Breakout $0.2810 → $0.2850 → $0.2900 → $0.2950 | Drop to $0.2750 → $0.2700 → $0.2650
Momentum: USELESS leads with a gain of +110.42% over 90 days, while ETHFI shows strong gains today. STX is testing its 24-hour high after breaking out of its previous range.
USELESS has the strongest long-term momentum. Wait for confirmation on the 15-minute timeframe—and avoid chasing sudden spikes!
#BTC #bitcoin
$ETHFI: Breakout $0.5278 → $0.5350 → $0.5450 → $0.5550 | Drop to $0.5150 → $0.5100 → $0.5000
USELESS: Breakout $0.10193 → $0.10300 → $0.10500 → $0.11000 | Drop to $0.10000 → $0.09800 → $0.09400
$STX : Breakout $0.2810 → $0.2850 → $0.2900 → $0.2950 | Drop to $0.2750 → $0.2700 → $0.2650
Momentum: USELESS leads with a gain of +110.42% over 90 days, while ETHFI shows strong gains today. STX is testing its 24-hour high after breaking out of its previous range.
USELESS has the strongest long-term momentum. Wait for confirmation on the 15-minute timeframe—and avoid chasing sudden spikes!
#BTC #bitcoin
56
Trade Setup
Symbol: $IRYS (IRYSUSDT Perpetual Contract)
Position: Long 🚀🟢
Entry Range:
0.02120 - 0.02260 🎯
Take Profit (TP):
TP1: 0.02560 🎯
TP2: 0.02950 🎯
TP3: 0.03400 🎯
Stop Loss (SL):
SL: 0.01720 🛑
Symbol Details and Market Analysis: $IRYS is showing strong bullish momentum, up +51.34%, with a massive vertical breakout candle above all major moving averages, including MA(99) at 0.01743. The enormous trading volume (142.12M USDT) confirms strong buyer dominance following its rebound from 0.01357.
Risk Level: 4 / 5
#BTC #Binance #BinanceSquareTalks #CanGTA6'sLaunchLiftTTWOShares? #NvidiaBoardReportedlySplitOverHuang’sReturn
$IRYS
{future}(IRYSUSDT)
Trade Setup
Symbol: $IRYS (IRYSUSDT Perpetual Contract)
Position: Long 🚀🟢
Entry Range:
0.02120 - 0.02260 🎯
Take Profit (TP):
TP1: 0.02560 🎯
TP2: 0.02950 🎯
TP3: 0.03400 🎯
Stop Loss (SL):
SL: 0.01720 🛑
Symbol Details and Market Analysis: $IRYS is showing strong bullish momentum, up +51.34%, with a massive vertical breakout candle above all major moving averages, including MA(99) at 0.01743. The enormous trading volume (142.12M USDT) confirms strong buyer dominance following its rebound from 0.01357.
Risk Level: 4 / 5
#BTC #Binance #BinanceSquareTalks #CanGTA6'sLaunchLiftTTWOShares? #NvidiaBoardReportedlySplitOverHuang’sReturn
$IRYS
Symbol: $IRYS (IRYSUSDT Perpetual Contract)
Position: Long 🚀🟢
Entry Range:
0.02120 - 0.02260 🎯
Take Profit (TP):
TP1: 0.02560 🎯
TP2: 0.02950 🎯
TP3: 0.03400 🎯
Stop Loss (SL):
SL: 0.01720 🛑
Symbol Details and Market Analysis: $IRYS is showing strong bullish momentum, up +51.34%, with a massive vertical breakout candle above all major moving averages, including MA(99) at 0.01743. The enormous trading volume (142.12M USDT) confirms strong buyer dominance following its rebound from 0.01357.
Risk Level: 4 / 5
#BTC #Binance #BinanceSquareTalks #CanGTA6'sLaunchLiftTTWOShares? #NvidiaBoardReportedlySplitOverHuang’sReturn
$IRYS
84
$BTW/USDT — 🔴 Sell · Confidence 50%
📍 Entry: 0.5686 – 0.5720
🛑 Stop loss: Unavailable (ATR(14) data for the 15-minute timeframe is not available in the screenshot/live feed)
🎯 Take profit 1: 0.5418
✅ Take profit 2: 0.5190
🏆 Take profit 3: 0.4848
The 4-hour structure remains within a broader downtrend, with lower highs and lower lows from the swing high at 1.3526 and the peak at 2.7522, despite the sharp +24.33% rebound to 0.5703.
About BTW: Bitway is building a Bitcoin-compatible on-chain finance ecosystem, including non-custodial BTC lending through Discreet Log contracts and Earn yield vaults; however, it faces significant risks from token supply dilution and smart contract/oracle/liquidation risks.
Does this rebound to 0.5703, above the 4-hour MA(7) and MA(25), signal a genuine trend reversal, or is it merely a liquidity trap within a structure that remains bearish on the 4-hour timeframe?
$BTW
{future}(BTWUSDT)
#BTC
$BTW /USDT — 🔴 Sell · Confidence 50%
📍 Entry: 0.5686 – 0.5720
🛑 Stop loss: Unavailable (ATR(14) data for the 15-minute timeframe is not available in the screenshot/live feed)
🎯 Take profit 1: 0.5418
✅ Take profit 2: 0.5190
🏆 Take profit 3: 0.4848
The 4-hour structure remains within a broader downtrend, with lower highs and lower lows from the swing high at 1.3526 and the peak at 2.7522, despite the sharp +24.33% rebound to 0.5703.
About BTW: Bitway is building a Bitcoin-compatible on-chain finance ecosystem, including non-custodial BTC lending through Discreet Log contracts and Earn yield vaults; however, it faces significant risks from token supply dilution and smart contract/oracle/liquidation risks.
Does this rebound to 0.5703, above the 4-hour MA(7) and MA(25), signal a genuine trend reversal, or is it merely a liquidity trap within a structure that remains bearish on the 4-hour timeframe?
$BTW
#BTC
📍 Entry: 0.5686 – 0.5720
🛑 Stop loss: Unavailable (ATR(14) data for the 15-minute timeframe is not available in the screenshot/live feed)
🎯 Take profit 1: 0.5418
✅ Take profit 2: 0.5190
🏆 Take profit 3: 0.4848
The 4-hour structure remains within a broader downtrend, with lower highs and lower lows from the swing high at 1.3526 and the peak at 2.7522, despite the sharp +24.33% rebound to 0.5703.
About BTW: Bitway is building a Bitcoin-compatible on-chain finance ecosystem, including non-custodial BTC lending through Discreet Log contracts and Earn yield vaults; however, it faces significant risks from token supply dilution and smart contract/oracle/liquidation risks.
Does this rebound to 0.5703, above the 4-hour MA(7) and MA(25), signal a genuine trend reversal, or is it merely a liquidity trap within a structure that remains bearish on the 4-hour timeframe?
$BTW
#BTC
86
$BULLA Trade Setup$BULLA
{future}(BULLAUSDT)
Symbol: $BULLA (BULLAUSDT perpetual contract)
Position: Long 🚀🟢
Entry range:
0.01480 - 0.01550 🎯
Take Profit (TP):
TP1: 0.01750 🎯
TP2: 0.02050 🎯
TP3: 0.02450 🎯
Stop Loss (SL):
SL: 0.01210 🛑
Symbol details and market analysis: Strong recovery momentum is evident, with daily gains of +13.76%, following a clear rebound from the key support level near the swing low at 0.011100. The price has reclaimed the MA(7) level at 0.014466 alongside increased buying volume, suggesting potential upside toward the MA(25) resistance at 0.016735 and higher targets.
Risk level: 4 / 5
$BULLA Trade Setup$BULLA
Symbol: $BULLA (BULLAUSDT perpetual contract)
Position: Long 🚀🟢
Entry range:
0.01480 - 0.01550 🎯
Take Profit (TP):
TP1: 0.01750 🎯
TP2: 0.02050 🎯
TP3: 0.02450 🎯
Stop Loss (SL):
SL: 0.01210 🛑
Symbol details and market analysis: Strong recovery momentum is evident, with daily gains of +13.76%, following a clear rebound from the key support level near the swing low at 0.011100. The price has reclaimed the MA(7) level at 0.014466 alongside increased buying volume, suggesting potential upside toward the MA(25) resistance at 0.016735 and higher targets.
Risk level: 4 / 5
Symbol: $BULLA (BULLAUSDT perpetual contract)
Position: Long 🚀🟢
Entry range:
0.01480 - 0.01550 🎯
Take Profit (TP):
TP1: 0.01750 🎯
TP2: 0.02050 🎯
TP3: 0.02450 🎯
Stop Loss (SL):
SL: 0.01210 🛑
Symbol details and market analysis: Strong recovery momentum is evident, with daily gains of +13.76%, following a clear rebound from the key support level near the swing low at 0.011100. The price has reclaimed the MA(7) level at 0.014466 alongside increased buying volume, suggesting potential upside toward the MA(25) resistance at 0.016735 and higher targets.
Risk level: 4 / 5
97
$1000LUNC Breakout above $0.045 or pullback?
Entry: $0.04450–$0.04490
Target 1: $0.04550
Target 2: $0.04600
Target 3: $0.04800
Target 4: $0.05000
Stop loss: $0.04380
LUNC rose by 1000 from $0.03810 with strong momentum on the 15-minute timeframe, forming higher highs and higher lows. The price is testing resistance at $0.04500 near its 24-hour high.
A confirmed 15-minute close above $0.04500 could trigger another upward move. A drop below $0.04350 could signal a deeper correction.
Wait for breakout confirmation. Avoid chasing resistance.
Trade here👇 $1000LUNC
{future}(1000LUNCUSDT)
$TREE
{future}(TREEUSDT)
#bitcoin #Binance #BTC #BinanceHerYerde
$1000LUNC Breakout above $0.045 or pullback?
Entry: $0.04450–$0.04490
Target 1: $0.04550
Target 2: $0.04600
Target 3: $0.04800
Target 4: $0.05000
Stop loss: $0.04380
LUNC rose by 1000 from $0.03810 with strong momentum on the 15-minute timeframe, forming higher highs and higher lows. The price is testing resistance at $0.04500 near its 24-hour high.
A confirmed 15-minute close above $0.04500 could trigger another upward move. A drop below $0.04350 could signal a deeper correction.
Wait for breakout confirmation. Avoid chasing resistance.
Trade here👇 $1000LUNC
$TREE
#bitcoin #Binance #BTC #BinanceHerYerde
Entry: $0.04450–$0.04490
Target 1: $0.04550
Target 2: $0.04600
Target 3: $0.04800
Target 4: $0.05000
Stop loss: $0.04380
LUNC rose by 1000 from $0.03810 with strong momentum on the 15-minute timeframe, forming higher highs and higher lows. The price is testing resistance at $0.04500 near its 24-hour high.
A confirmed 15-minute close above $0.04500 could trigger another upward move. A drop below $0.04350 could signal a deeper correction.
Wait for breakout confirmation. Avoid chasing resistance.
Trade here👇 $1000LUNC
$TREE
#bitcoin #Binance #BTC #BinanceHerYerde
100
🚨 $TRX Buy trade setup alert 🚨
Confirm that the moving averages align on the hourly timeframe
Entry: $0.3115
🎯 Target 1: $0.31288214
🎯 Target 2: $0.31426429
🎯 Target 3: $0.31564643
🛑 Stop loss: $0.31011786
Always do your own research. Manage your risk.
#TRX #Binance ce #العملات_البديلة
🎯 $TRX #BTC
{future}(TRXUSDT)
— Monitor this buy trade setup
🚨 $TRX Buy trade setup alert 🚨
Confirm that the moving averages align on the hourly timeframe
Entry: $0.3115
🎯 Target 1: $0.31288214
🎯 Target 2: $0.31426429
🎯 Target 3: $0.31564643
🛑 Stop loss: $0.31011786
Always do your own research. Manage your risk.
#TRX #Binance ce #العملات_البديلة
🎯 $TRX #BTC
— Monitor this buy trade setup
Confirm that the moving averages align on the hourly timeframe
Entry: $0.3115
🎯 Target 1: $0.31288214
🎯 Target 2: $0.31426429
🎯 Target 3: $0.31564643
🛑 Stop loss: $0.31011786
Always do your own research. Manage your risk.
#TRX #Binance ce #العملات_البديلة
🎯 $TRX #BTC
— Monitor this buy trade setup
17
📈 Long buy now - TREEUSDT
📍 Key levels
Entry: 0.031600
🛑 Stop loss: 0.030892
🎯 Take profit 1: 0.033017
🎯 Take profit 2: 0.033725
The trend is clearly upward, and the exponential moving averages (EMAs) show strength, while momentum is increasing with the MACD remaining positive. The RSI is in a healthy range, indicating room for this move to continue.
This signal was generated automatically based on technical indicators. It does not guarantee profit and is not investment advice. Always manage your own risk and do your own research.
$TREE
{future}(TREEUSDT)
#bitcoin #BTC #BinanceSquareTalks #meme板块关注热点
📈 Long buy now - TREEUSDT
📍 Key levels
Entry: 0.031600
🛑 Stop loss: 0.030892
🎯 Take profit 1: 0.033017
🎯 Take profit 2: 0.033725
The trend is clearly upward, and the exponential moving averages (EMAs) show strength, while momentum is increasing with the MACD remaining positive. The RSI is in a healthy range, indicating room for this move to continue.
This signal was generated automatically based on technical indicators. It does not guarantee profit and is not investment advice. Always manage your own risk and do your own research.
$TREE
#bitcoin #BTC #BinanceSquareTalks #meme板块关注热点
📍 Key levels
Entry: 0.031600
🛑 Stop loss: 0.030892
🎯 Take profit 1: 0.033017
🎯 Take profit 2: 0.033725
The trend is clearly upward, and the exponential moving averages (EMAs) show strength, while momentum is increasing with the MACD remaining positive. The RSI is in a healthy range, indicating room for this move to continue.
This signal was generated automatically based on technical indicators. It does not guarantee profit and is not investment advice. Always manage your own risk and do your own research.
$TREE
#bitcoin #BTC #BinanceSquareTalks #meme板块关注热点
42
🔴 $BTC | SHO Sell Trade
$BTC
{future}(BTCUSDT)
📍 Entry price: 62,800
🎯 Price targets:
1. TP1: 62,000
2. TP2: 61,500
3. TP3: 61,000
🛑 Stop loss (SL): 63,600
📊 Capital management is essential.
⚠️ The targets and trade do not guarantee profits
#bitcoin #BTC☀ .#MoreHikesExpectedIsBTCUnderPressure #
🔴 $BTC | SHO Sell Trade
$BTC
📍 Entry price: 62,800
🎯 Price targets:
1. TP1: 62,000
2. TP2: 61,500
3. TP3: 61,000
🛑 Stop loss (SL): 63,600
📊 Capital management is essential.
⚠️ The targets and trade do not guarantee profits
#bitcoin #BTC☀ .#MoreHikesExpectedIsBTCUnderPressure #
$BTC
📍 Entry price: 62,800
🎯 Price targets:
1. TP1: 62,000
2. TP2: 61,500
3. TP3: 61,000
🛑 Stop loss (SL): 63,600
📊 Capital management is essential.
⚠️ The targets and trade do not guarantee profits
#bitcoin #BTC☀ .#MoreHikesExpectedIsBTCUnderPressure #
33
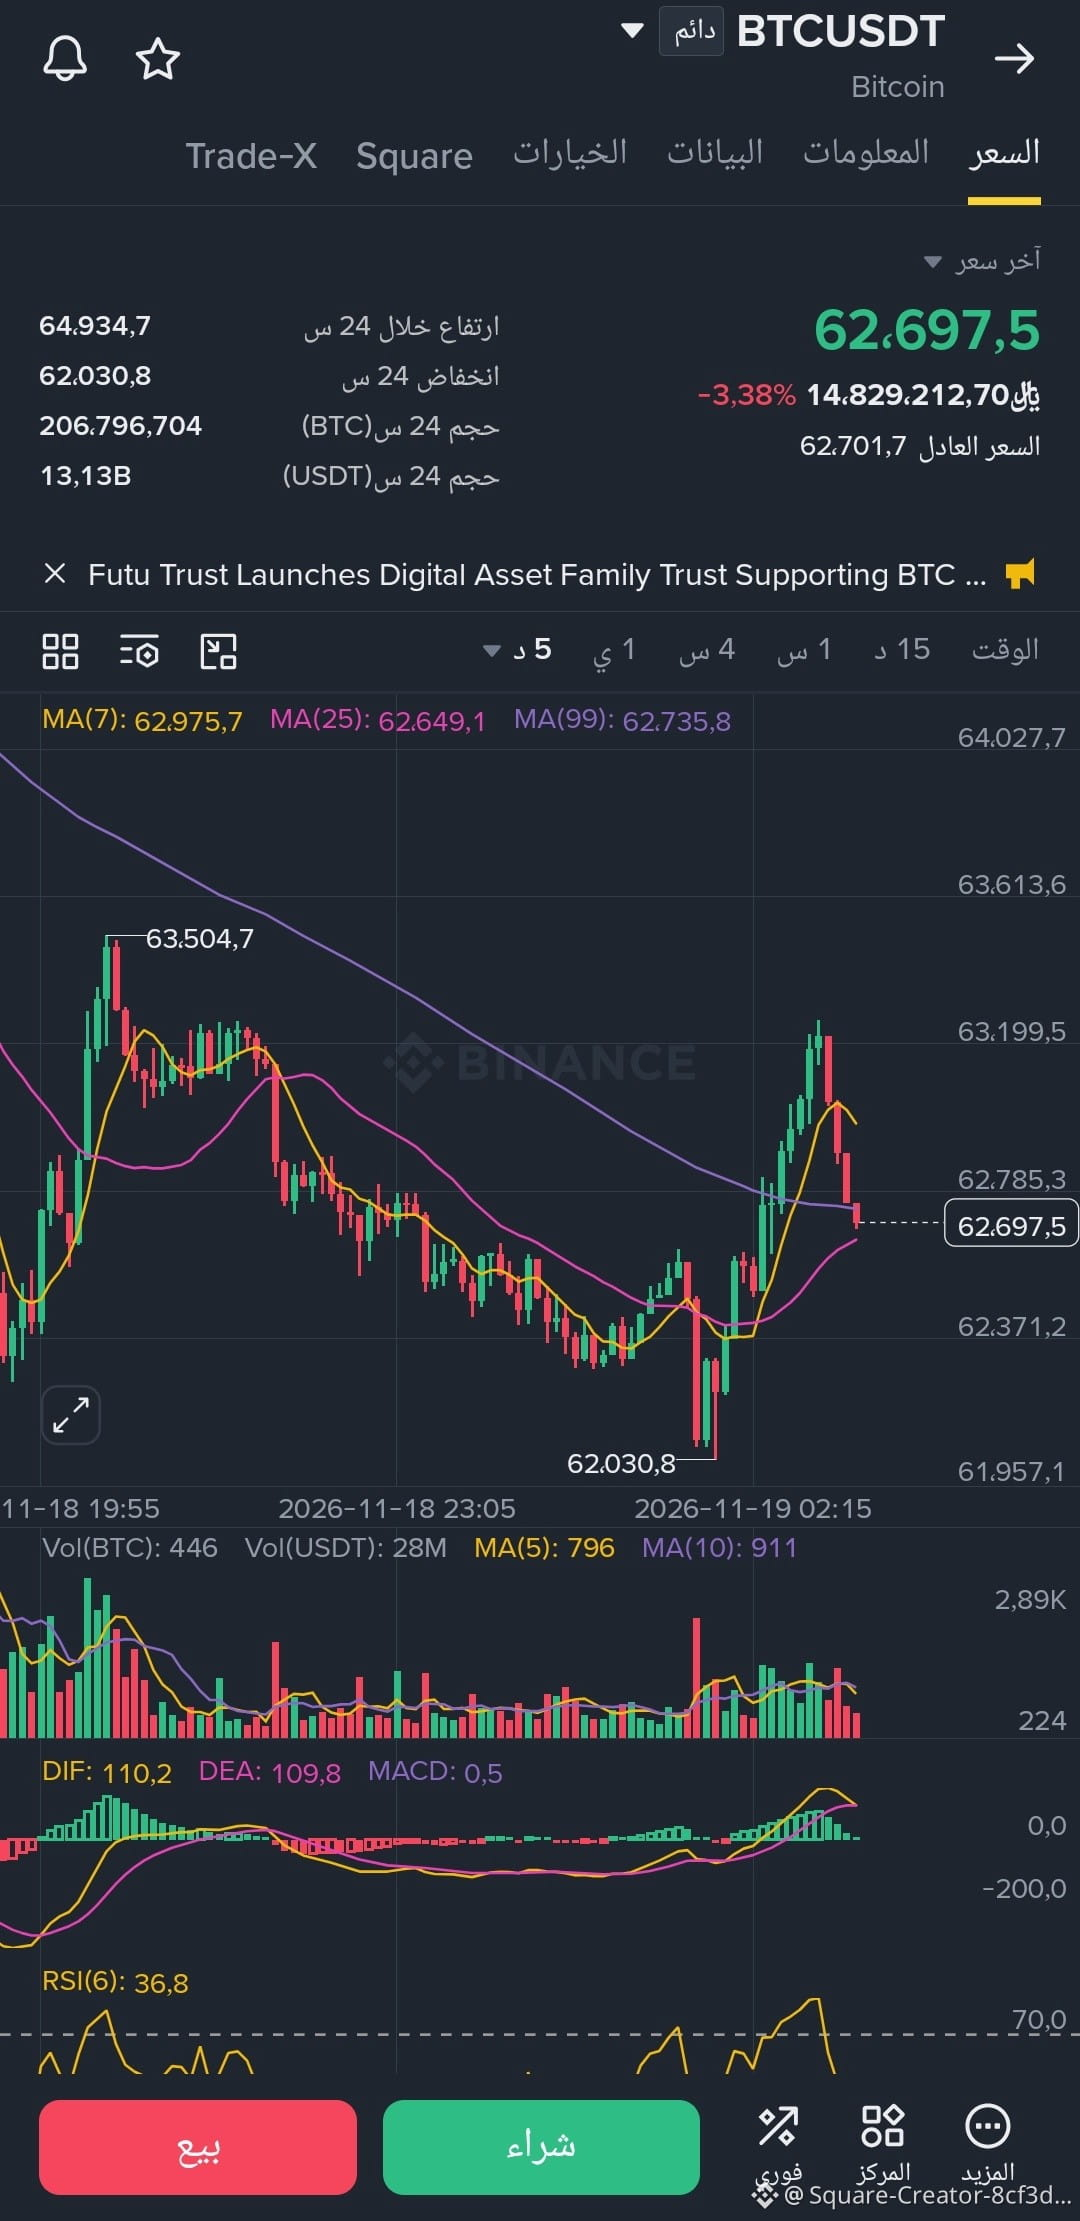
🔴 $BTC | SHORT SELL trade
$BTC
{future}(BTCUSDT)
📍 Entry price: 62,800
🎯 Price targets:
1. TP1: 62,000
2. TP2: 61,500
3. TP3: 61,000
🛑 Stop loss (SL): 63,600
📊 Capital management is essential.
⚠️ The targets and trade do not guarantee profits.
🔴 $BTC | SHORT SELL trade
$BTC
📍 Entry price: 62,800
🎯 Price targets:
1. TP1: 62,000
2. TP2: 61,500
3. TP3: 61,000
🛑 Stop loss (SL): 63,600
📊 Capital management is essential.
⚠️ The targets and trade do not guarantee profits.
$BTC
📍 Entry price: 62,800
🎯 Price targets:
1. TP1: 62,000
2. TP2: 61,500
3. TP3: 61,000
🛑 Stop loss (SL): 63,600
📊 Capital management is essential.
⚠️ The targets and trade do not guarantee profits.
98
🔴 $MMT | SHORT sell trade
{future}(MMTUSDT)
📍 Entry price: 0.22500
🎯 Price targets:
1. TP1: 0.2000
2. TP2: 0.1800
3. TP3: 0.1600
🛑 Stop loss (SL): 0.2900
⚠️ Capital management is essential..
🔴 $MMT | SHORT sell trade
📍 Entry price: 0.22500
🎯 Price targets:
1. TP1: 0.2000
2. TP2: 0.1800
3. TP3: 0.1600
🛑 Stop loss (SL): 0.2900
⚠️ Capital management is essential..
📍 Entry price: 0.22500
🎯 Price targets:
1. TP1: 0.2000
2. TP2: 0.1800
3. TP3: 0.1600
🛑 Stop loss (SL): 0.2900
⚠️ Capital management is essential..
155
🟢 iostUSDT | LONG buy trade
$IOST
{future}(IOSTUSDT)
📍 Entry price: 0.00058
🎯 Price targets:
1. TP1: 0.00060
2. TP2: 0.00062
3. TP3: 0.00066
4. TP4: 0.00072
5. TP5: 0.00075
🛑 Stop loss (SL): 0.53
📊 Capital management is essential.
⚠️ Targets are estimates and are not guaranteed.#NvidiaBoardNotConsideringHuang’sReturnasCEO #LedgerHardwareImplantReportsExtendToDubai
🟢 iostUSDT | LONG buy trade
$IOST
📍 Entry price: 0.00058
🎯 Price targets:
1. TP1: 0.00060
2. TP2: 0.00062
3. TP3: 0.00066
4. TP4: 0.00072
5. TP5: 0.00075
🛑 Stop loss (SL): 0.53
📊 Capital management is essential.
⚠️ Targets are estimates and are not guaranteed.#NvidiaBoardNotConsideringHuang’sReturnasCEO #LedgerHardwareImplantReportsExtendToDubai
$IOST
📍 Entry price: 0.00058
🎯 Price targets:
1. TP1: 0.00060
2. TP2: 0.00062
3. TP3: 0.00066
4. TP4: 0.00072
5. TP5: 0.00075
🛑 Stop loss (SL): 0.53
📊 Capital management is essential.
⚠️ Targets are estimates and are not guaranteed.#NvidiaBoardNotConsideringHuang’sReturnasCEO #LedgerHardwareImplantReportsExtendToDubai
1
194
Log in to explore more content
Join global crypto users on Binance Square
⚡️ Get latest and useful information about crypto.
💬 Trusted by the world’s largest crypto exchange.
👍 Discover real insights from verified creators.
Email / Phone number
Trending Topics
BTCRemainsUnderPressureAfterHawkishFOMCMinutes
51,168 views
682 Discussing
FOMC Minutes | Fed Minutes Show Almost All Officials Expect More Rate Hikes, With Some Open to a Larger December Move
Binance News
·47 Likes
·56.9k views
AnthropicToDebutAfter$83IPOPricing
13,510 views
70 Discussing
NvidiaBoardReportedlySplitOverHuang’sReturn
16,884 views
284 Discussing