imad soukkou

متداول العملات الرقمية 📊
Open Trade
APT Holder
APT Holder
Occasional Trader
3.5 Years
1 Following
75 Followers
59 Liked
Posts
Portfolio
·
--
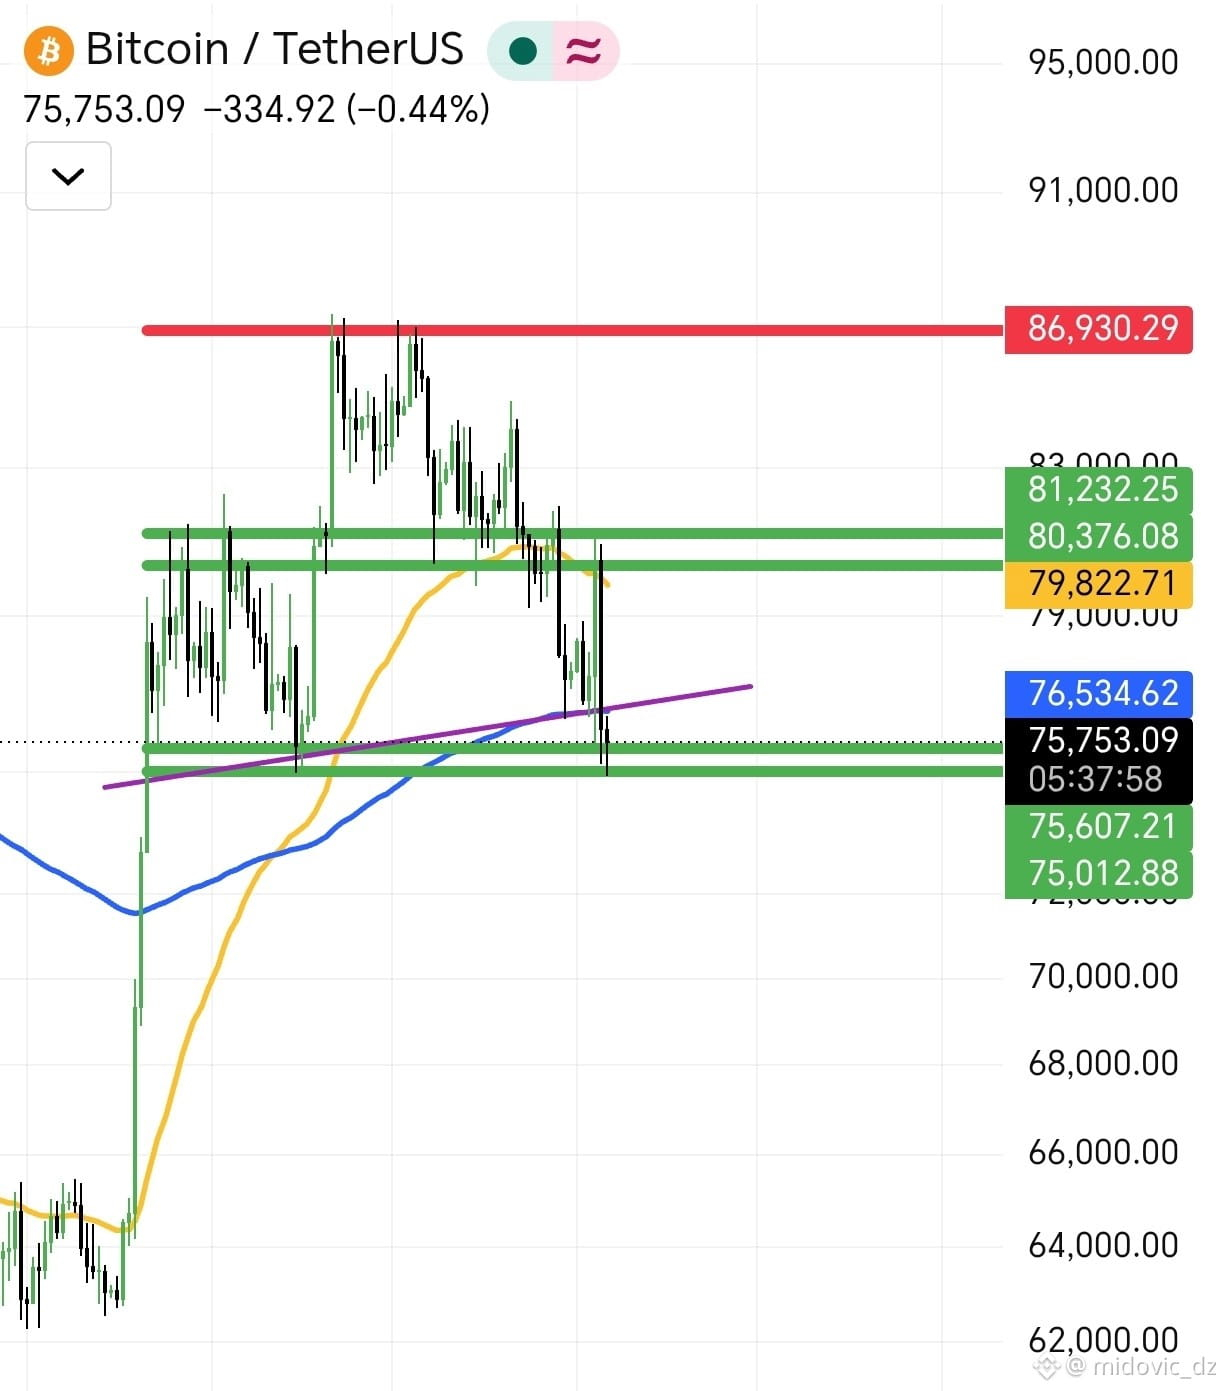
$BTC {spot}(BTCUSDT) Quick technical analysis of Bitcoin ($BTC) Bitcoin is currently trading around $75,753, down slightly by 0.44% as it tests a critical support zone. Current pivot zone: The price is currently near a major support range marked in green (between $75,607 and $75,753), which coincides with the ascending trendline (purple line). This makes it a crucial zone where prices may attempt to rebound. Nearby resistance: The first resistance is at $76,534, followed by the stronger, higher resistance range between $79,822 and $80,376. Moving averages: The price is approaching the moving average lines, reflecting volatility as the market awaits confirmation of the next direction. Possible scenarios: 📈 Bullish rebound scenario: Holding above the current support zone and breaking through the $76,534 resistance could help Bitcoin recover and move toward testing the higher resistance levels. 📉 Support breakdown scenario: A break below the trendline and current support could lead to a further decline toward lower liquidity zones near $75,012. Note: Please monitor the current candle's close carefully and manage risk with great caution. #bitcoin #BTC☀️ #BinanceSquare #CryptoAnalysis"
$BTC
Quick technical analysis of Bitcoin ($BTC )

Bitcoin is currently trading around $75,753, down slightly by 0.44% as it tests a critical support zone.

Current pivot zone: The price is currently near a major support range marked in green (between $75,607 and $75,753), which coincides with the ascending trendline (purple line). This makes it a crucial zone where prices may attempt to rebound.

Nearby resistance: The first resistance is at $76,534, followed by the stronger, higher resistance range between $79,822 and $80,376.

Moving averages: The price is approaching the moving average lines, reflecting volatility as the market awaits confirmation of the next direction.

Possible scenarios:

📈 Bullish rebound scenario: Holding above the current support zone and breaking through the $76,534 resistance could help Bitcoin recover and move toward testing the higher resistance levels.

📉 Support breakdown scenario: A break below the trendline and current support could lead to a further decline toward lower liquidity zones near $75,012.
Note: Please monitor the current candle's close carefully and manage risk with great caution.
#bitcoin #BTC☀️ #BinanceSquare
#CryptoAnalysis"
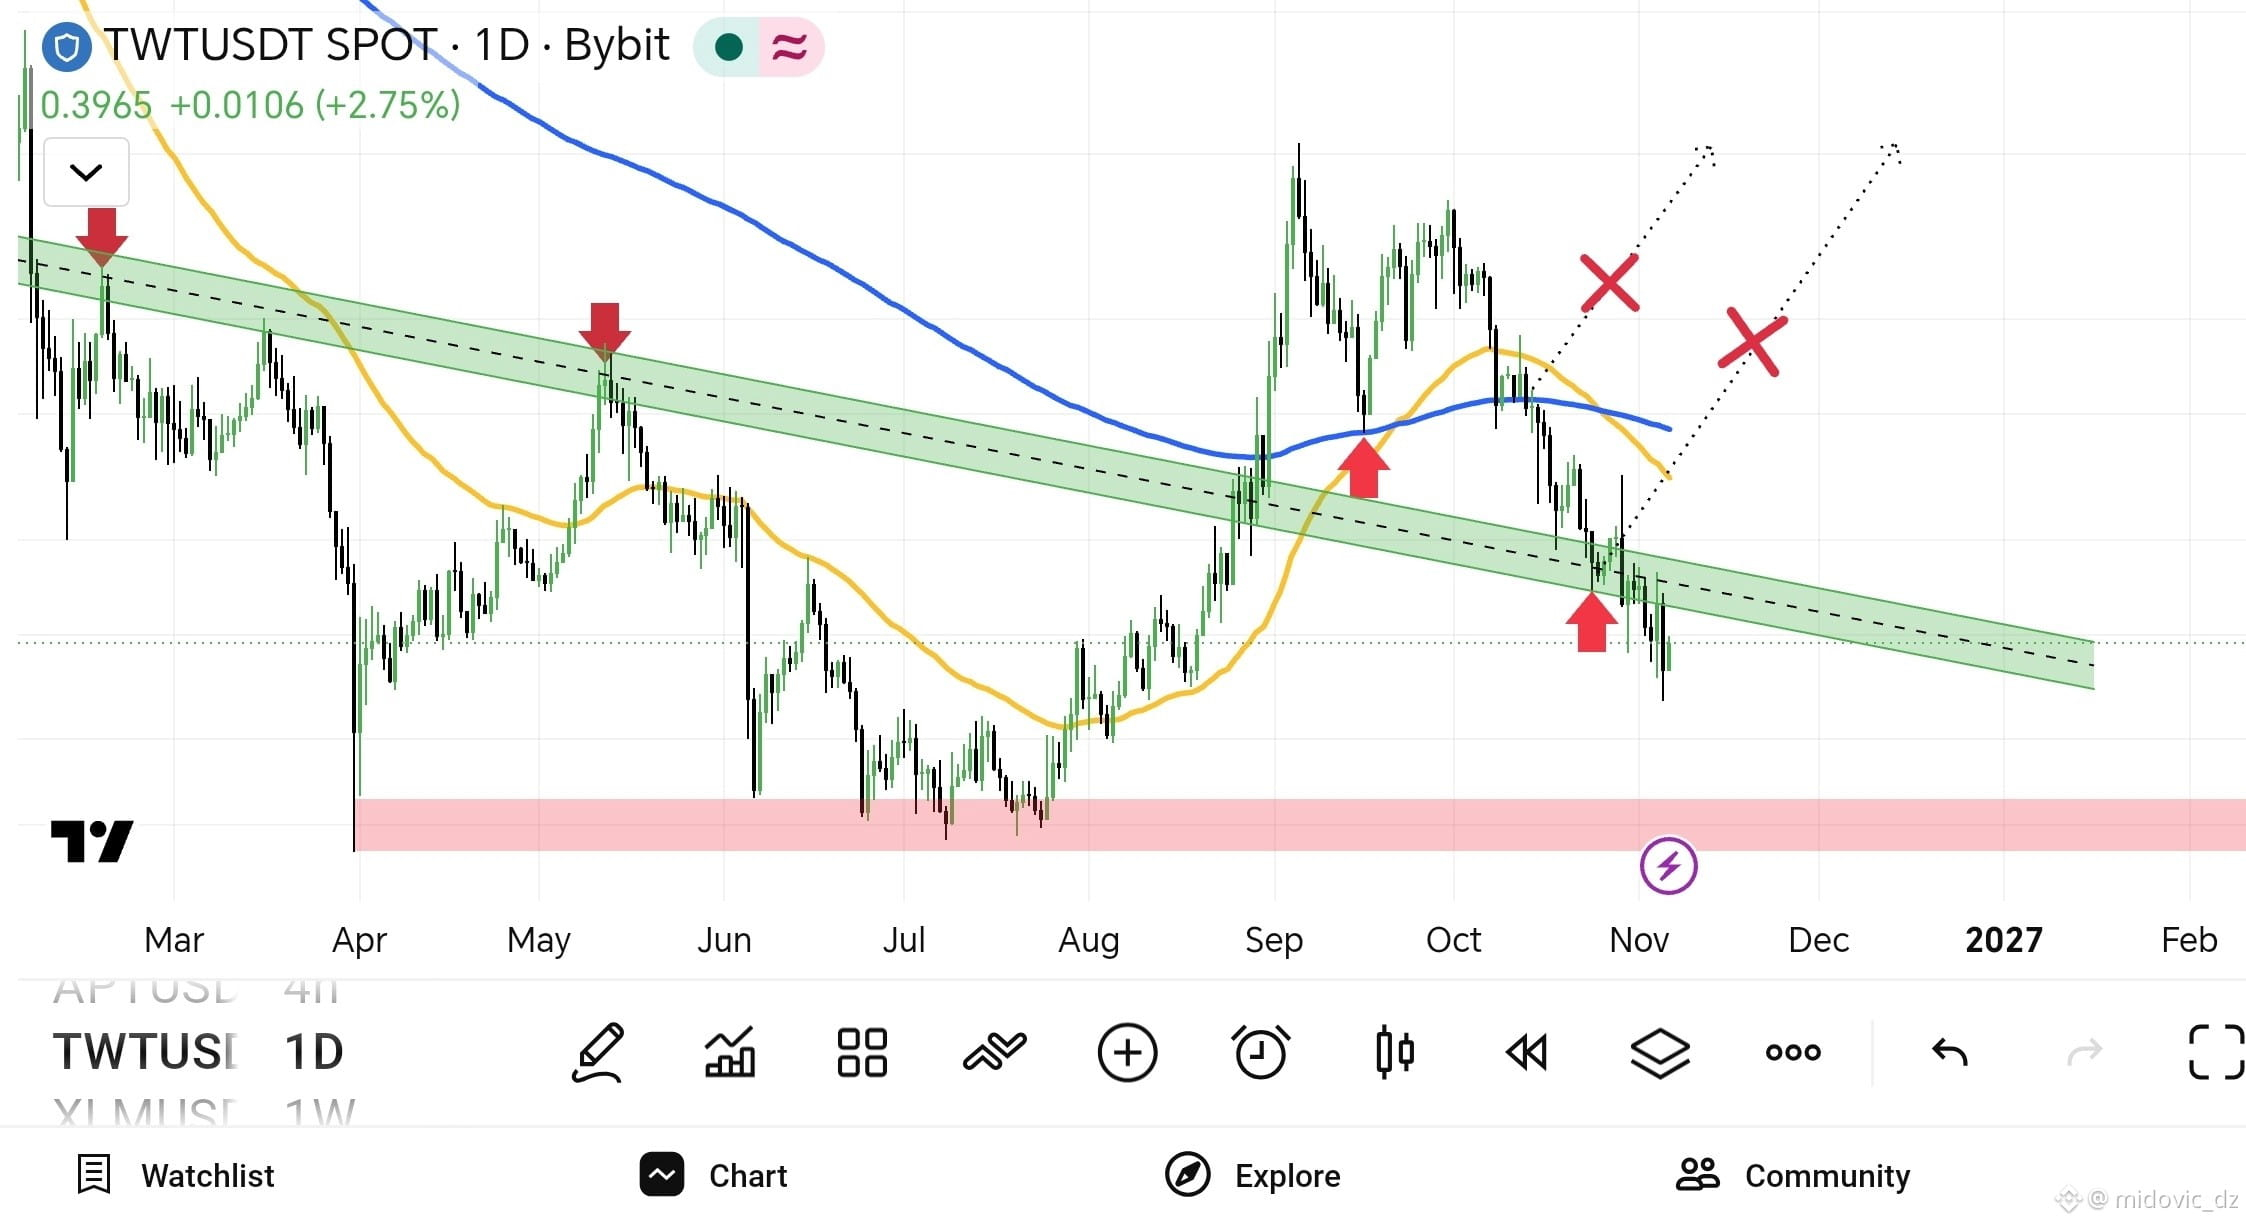
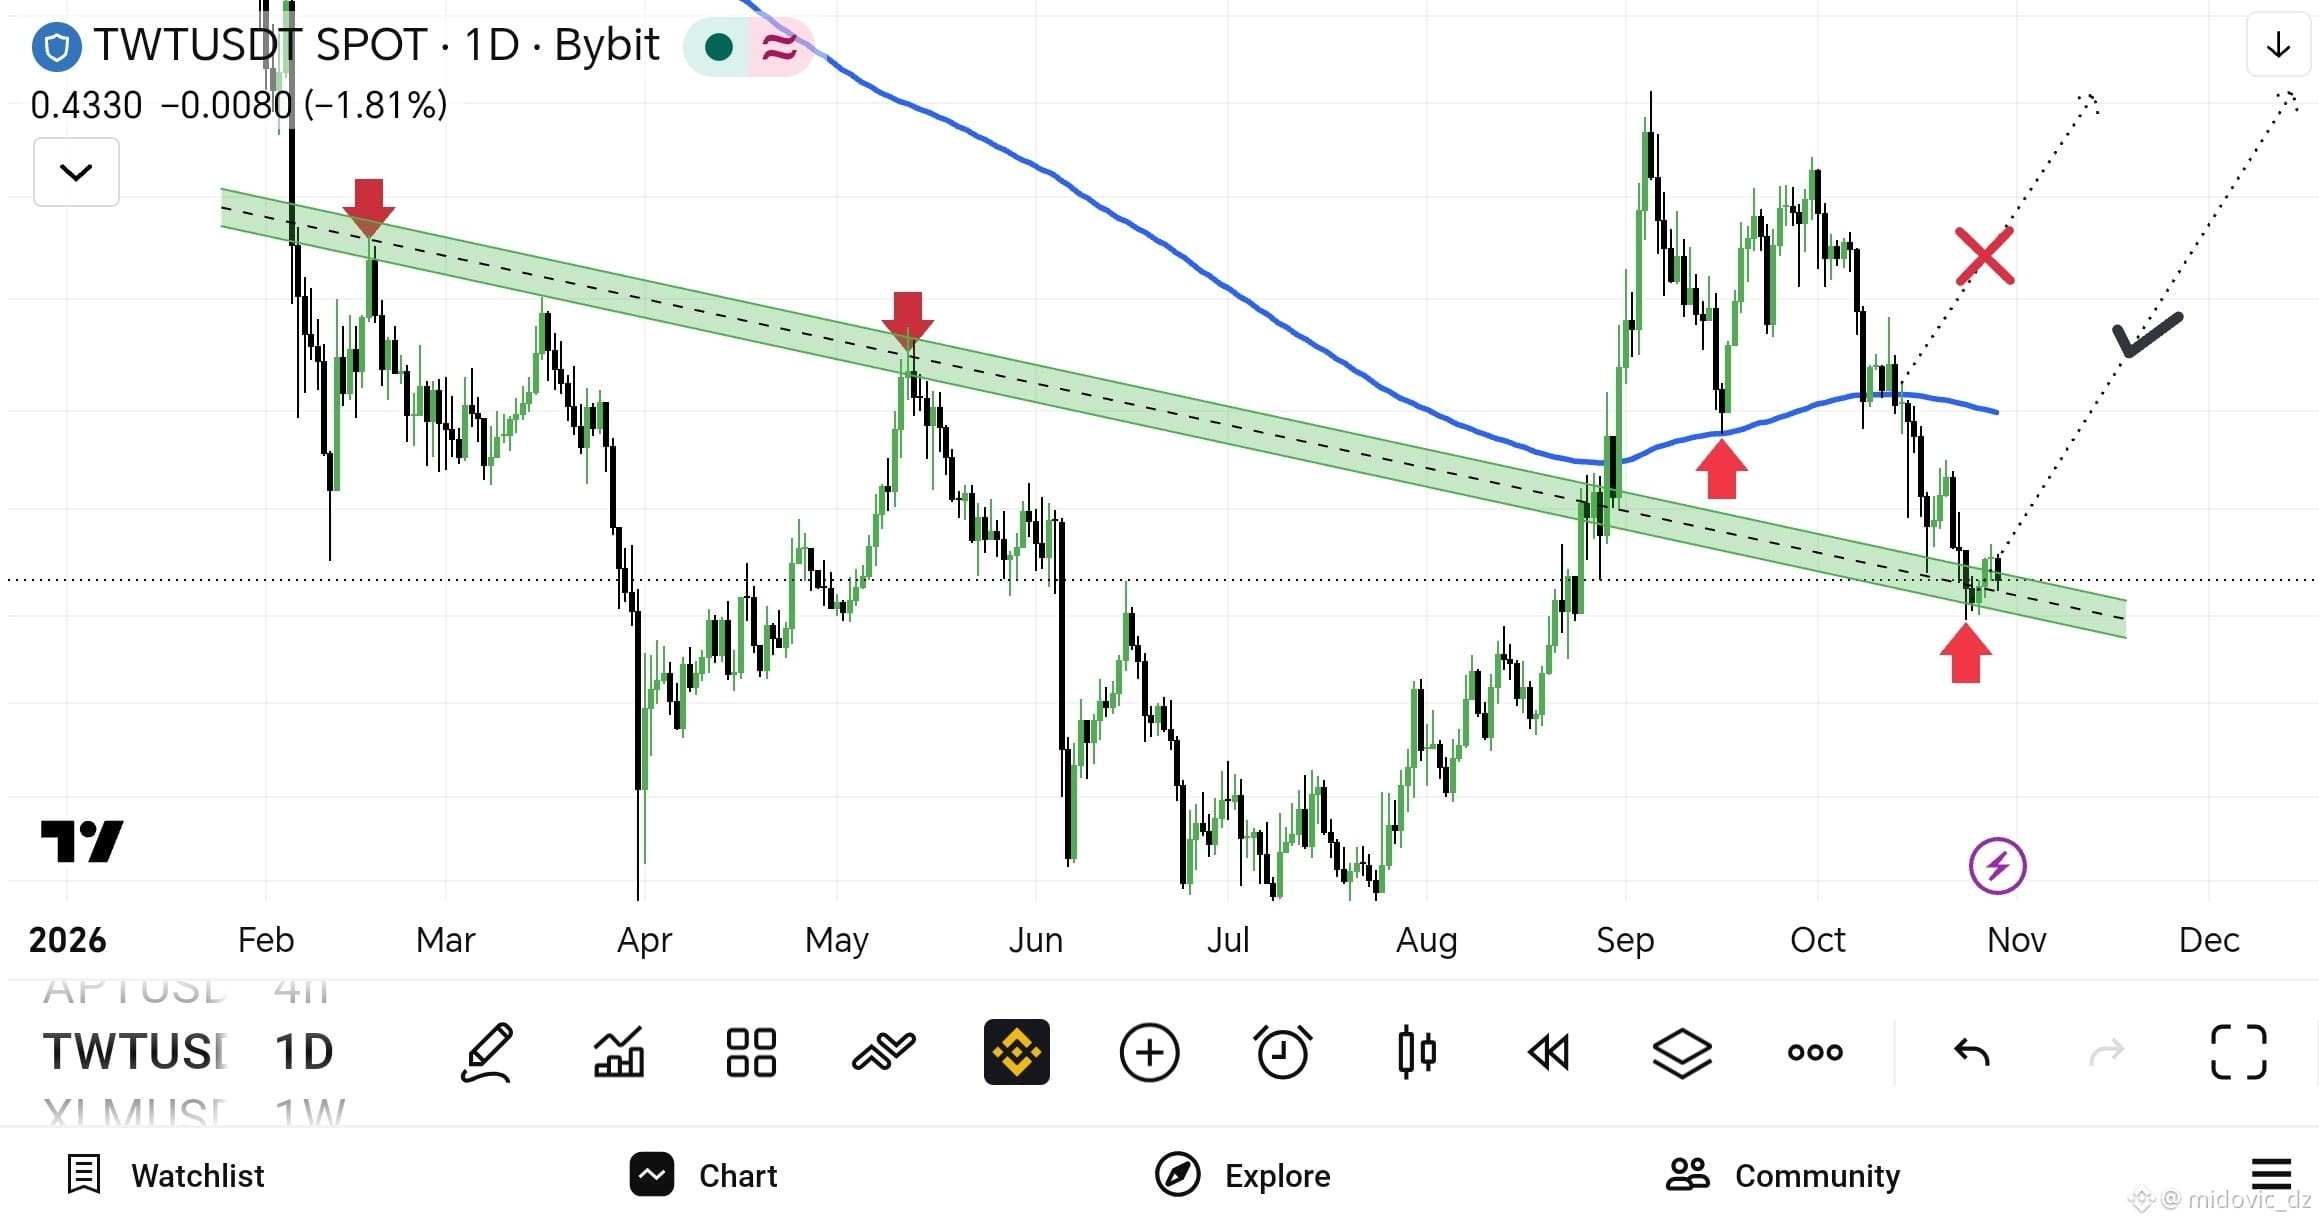
$TWT 🛡 The second test failed ❌ We are waiting for a correction to the request area highlighted in red
$TWT 🛡
The second test failed ❌
We are waiting for a correction to the request area highlighted in red
imad soukkou
·
--
$TWT 📊
Has the test been confirmed? 🤔
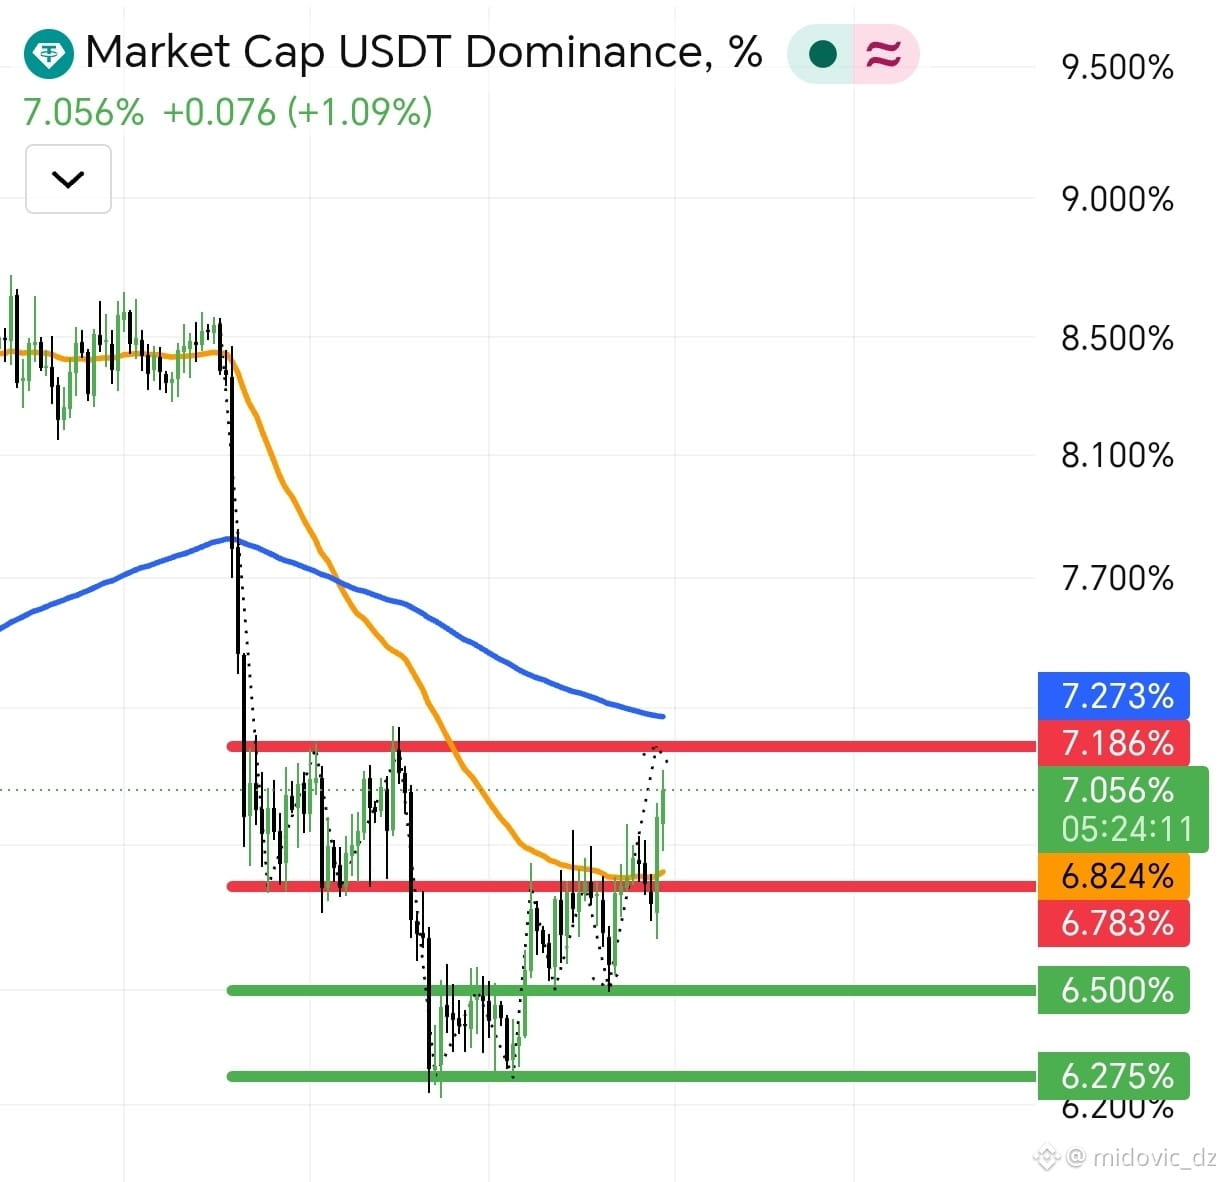
Market Cap USDT Dominance 7.18 ⌛
Market Cap USDT Dominance
7.18 ⌛
imad soukkou
·
--
Market Cap USDT Dominance 🤯
Next Target : 7% 😩
$BTC

$ETH

#EarningsSeason
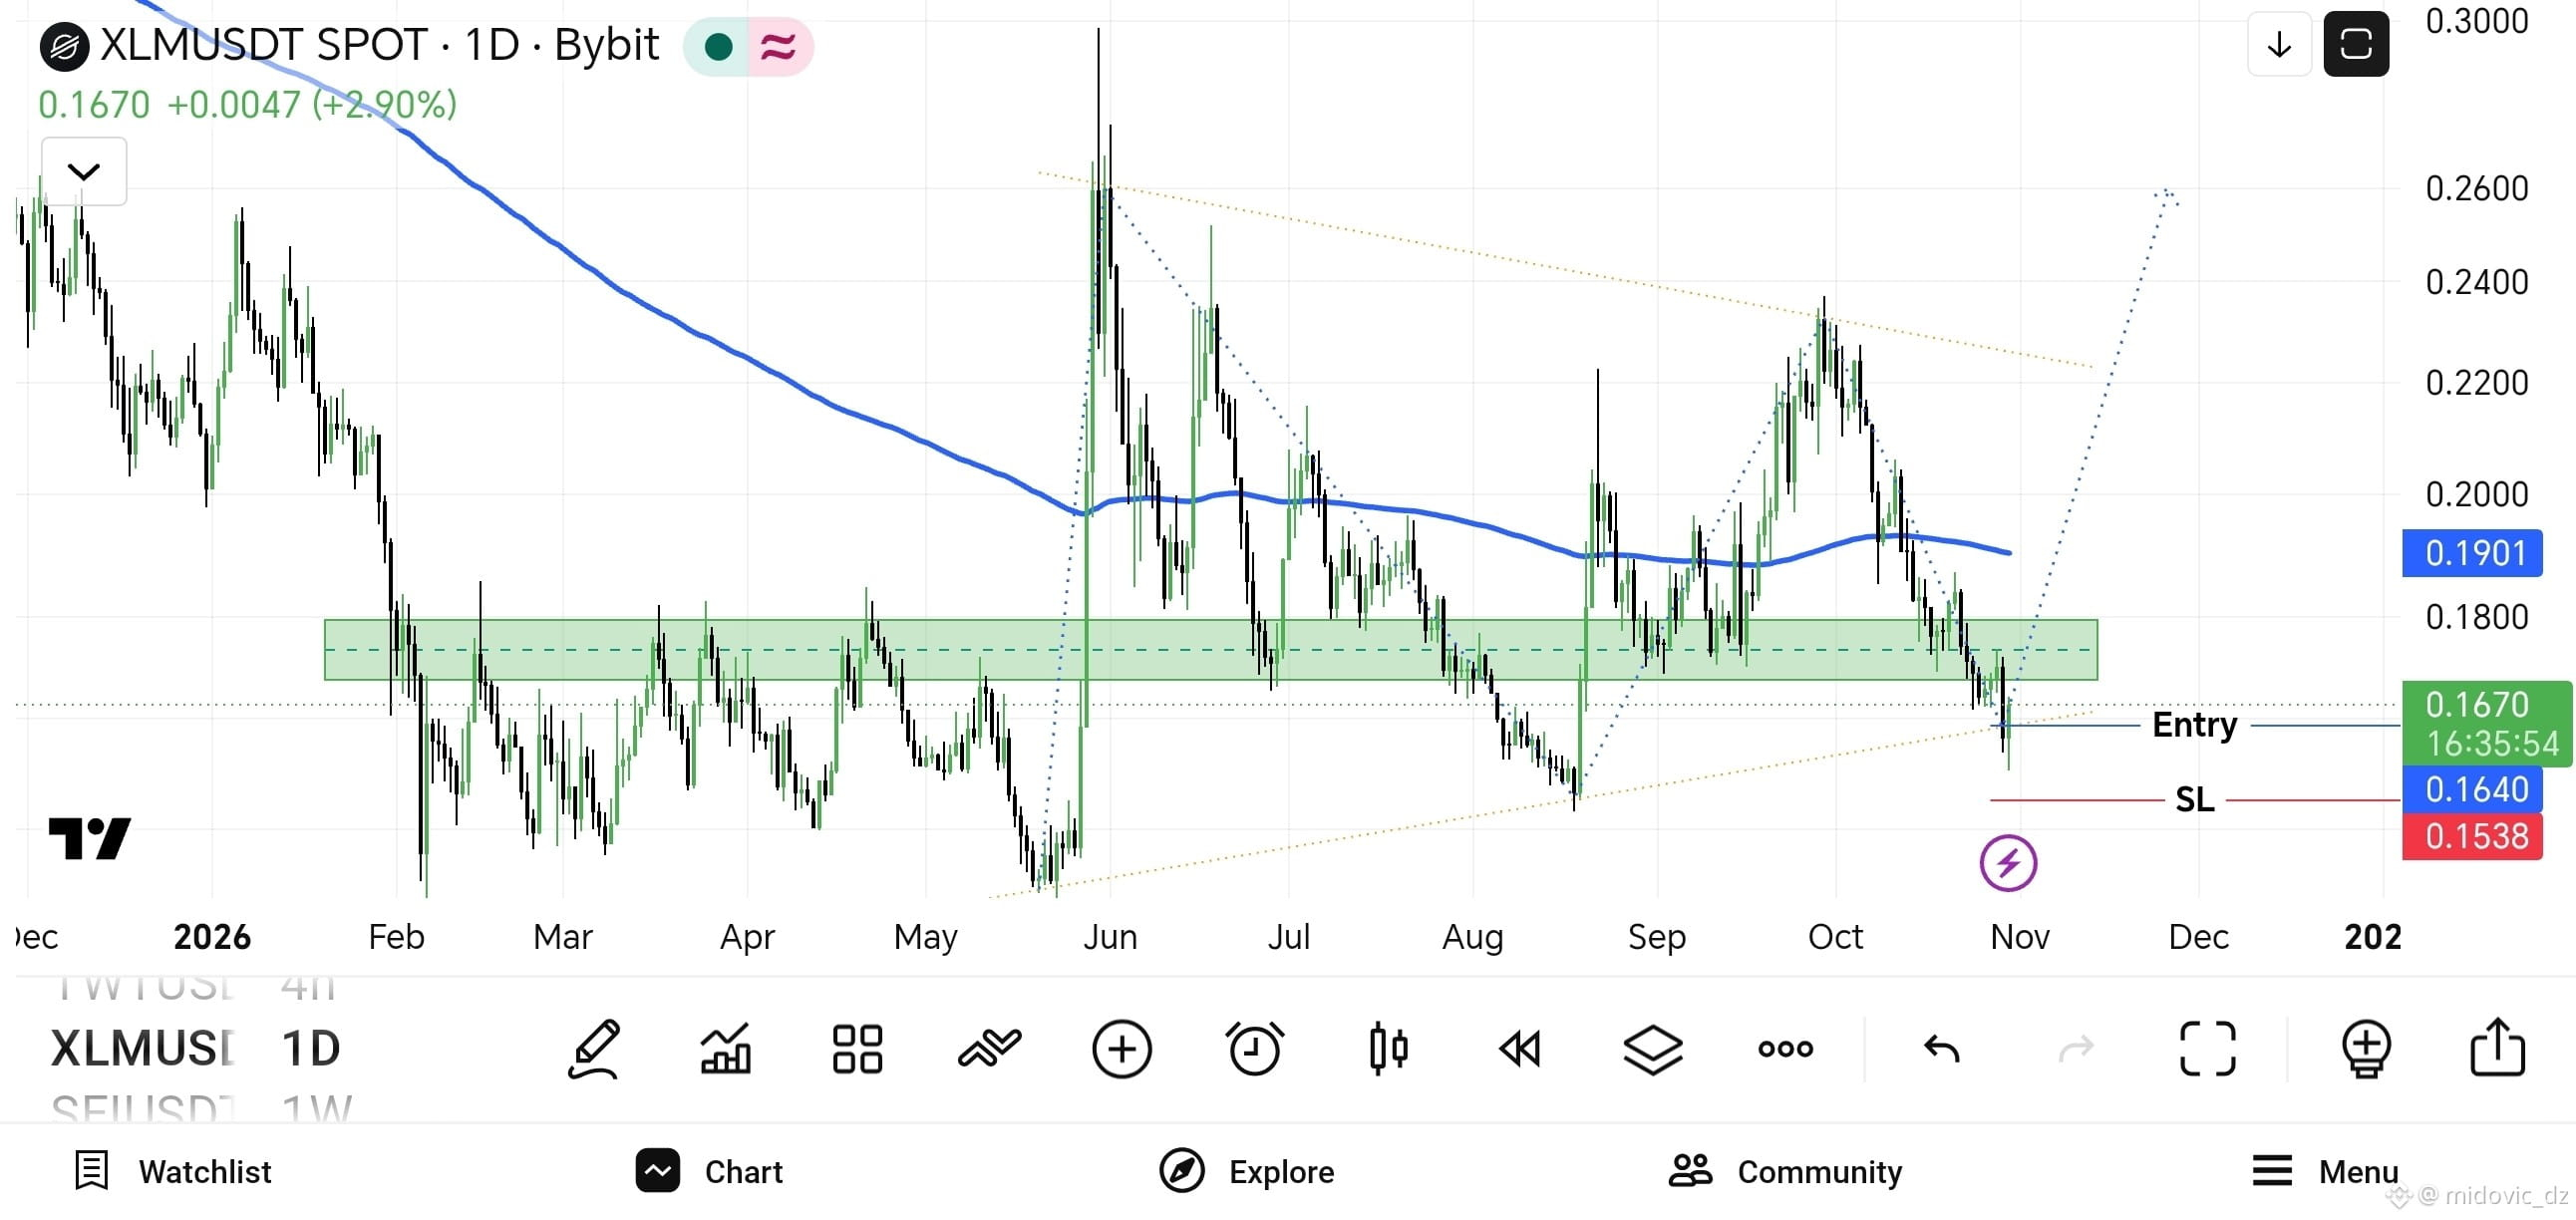
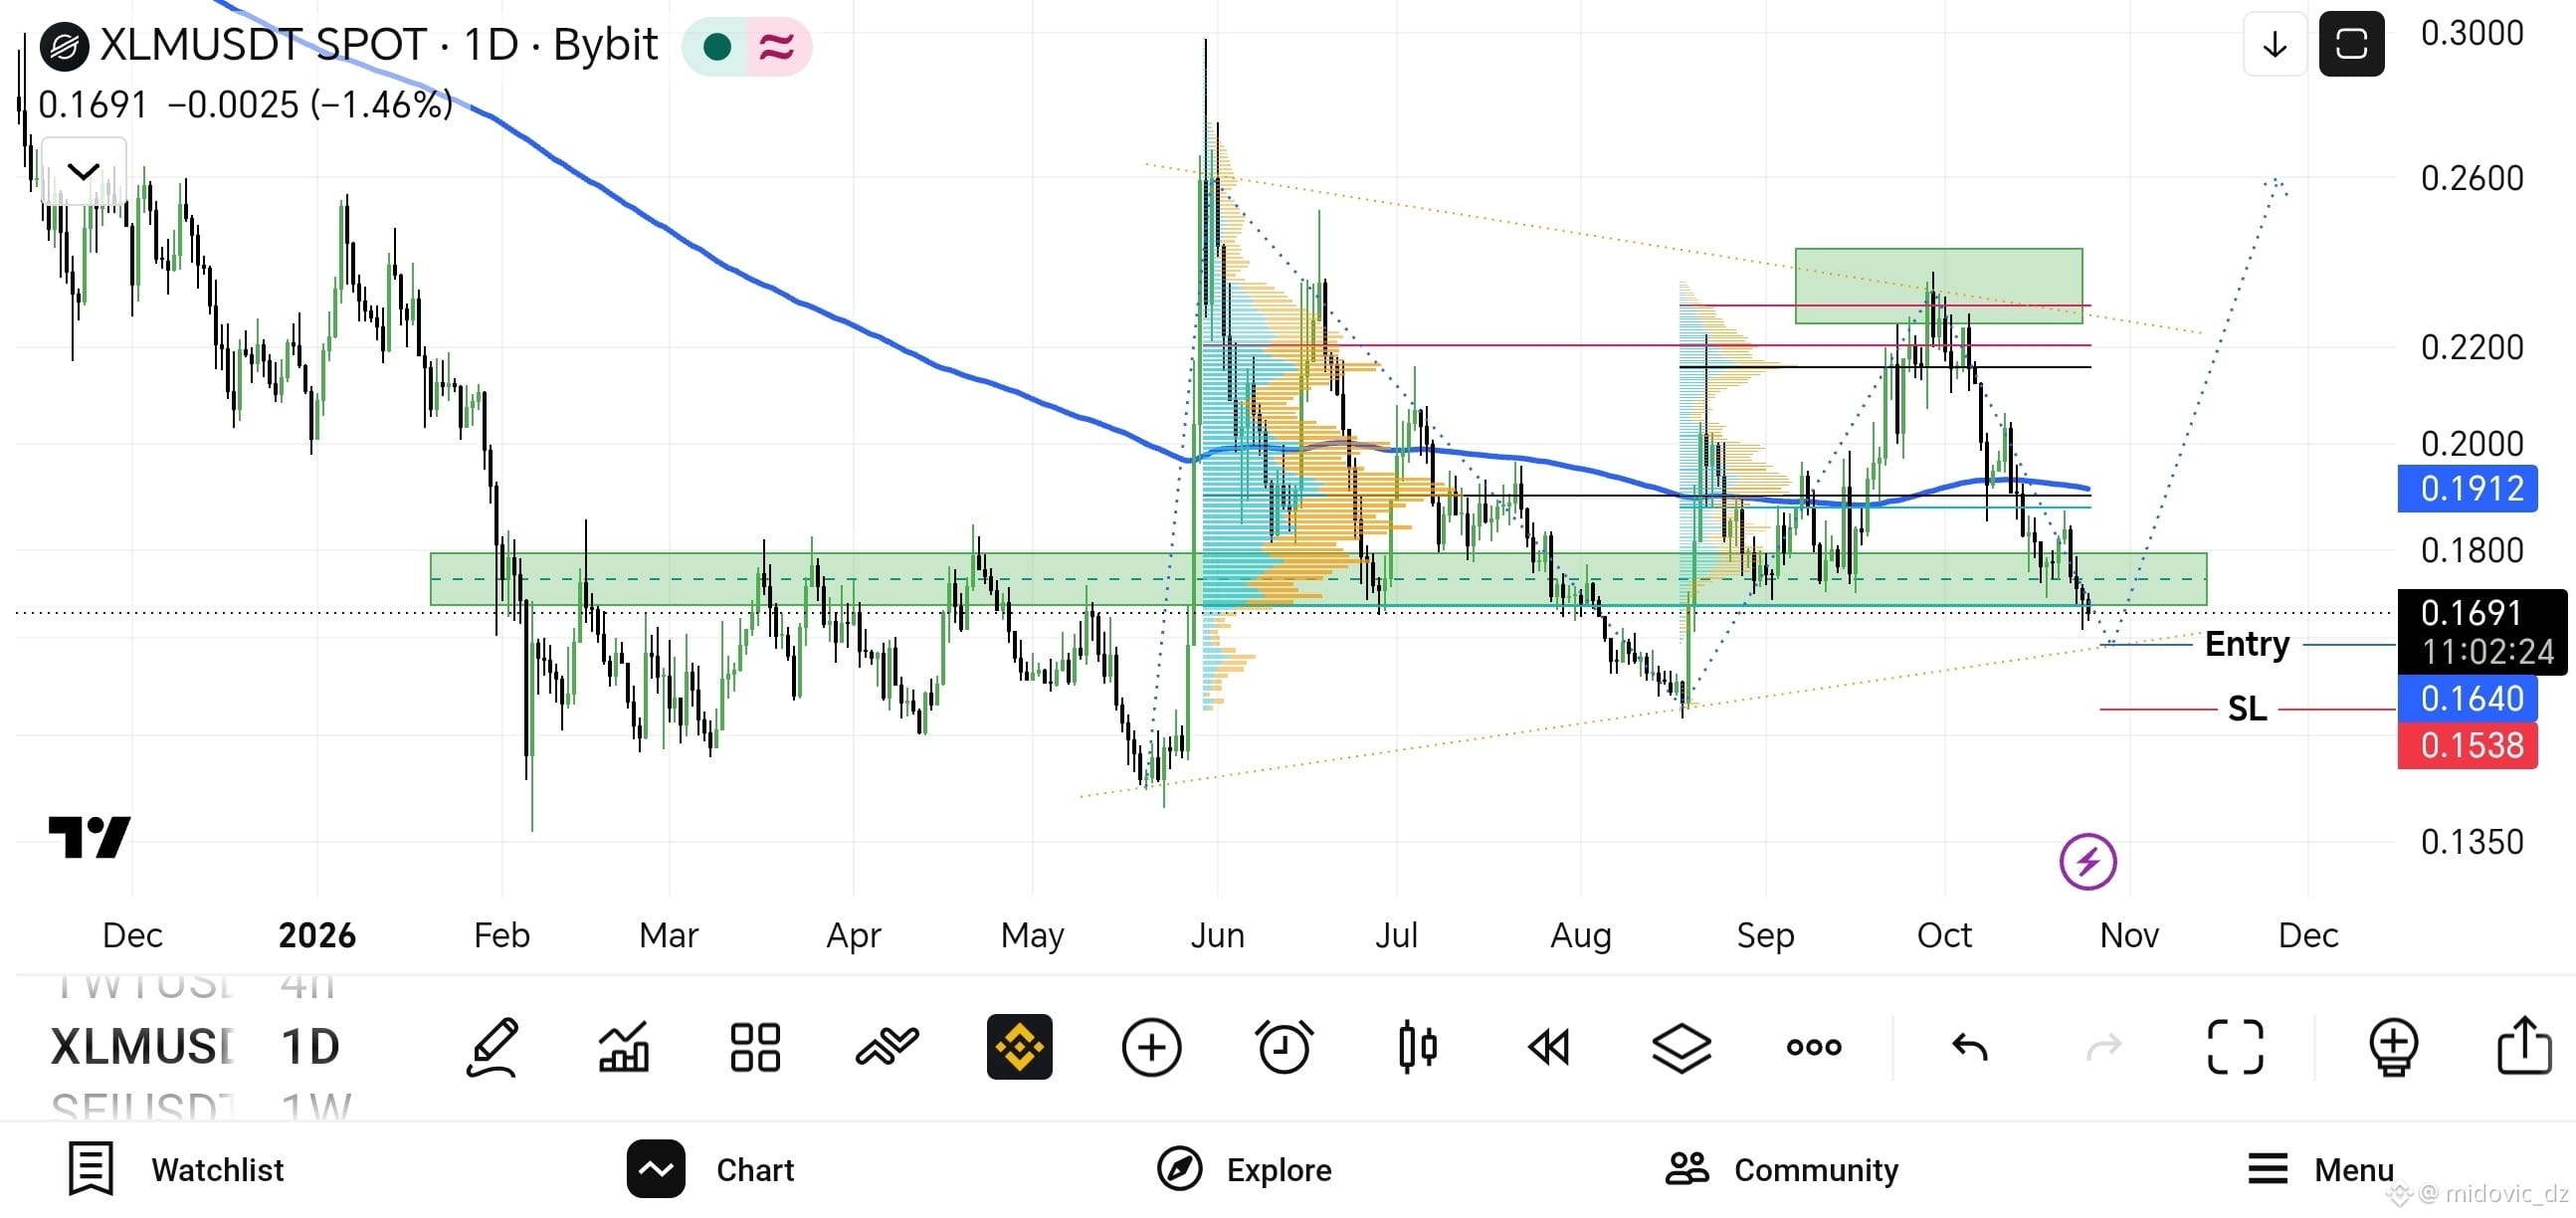
$XLM 😍😍😍 {spot}(XLMUSDT) Login has been activated 🚀🚀🚀
$XLM 😍😍😍
Login has been activated 🚀🚀🚀
imad soukkou
·
--
Bullish
$XLM 🚀🚀🚀
Entry : 0.164
SL : 0.1538
·
--
Bullish
Holding $TWT 98.5 USDT
$TWT 🛡 12% Profite 😍🚀
$TWT 🛡
12% Profite 😍🚀
imad soukkou
·
--
$TWT 📊
Has the test been confirmed? 🤔
Holding $APT 61.2 USDT
$APT 📊 The first entry zone was hit 0.65 ✅ 0.63 ⌛
$APT 📊
The first entry zone was hit
0.65 ✅
0.63 ⌛
imad soukkou
·
--
$APT 📊
Entry between 0.65 and 0.63 ⚡⚡

Holding $TWT 92.8 USDT
$TWT 📊 Has the test been confirmed? 🤔
$TWT 📊
Has the test been confirmed? 🤔
imad soukkou
·
--
Bullish
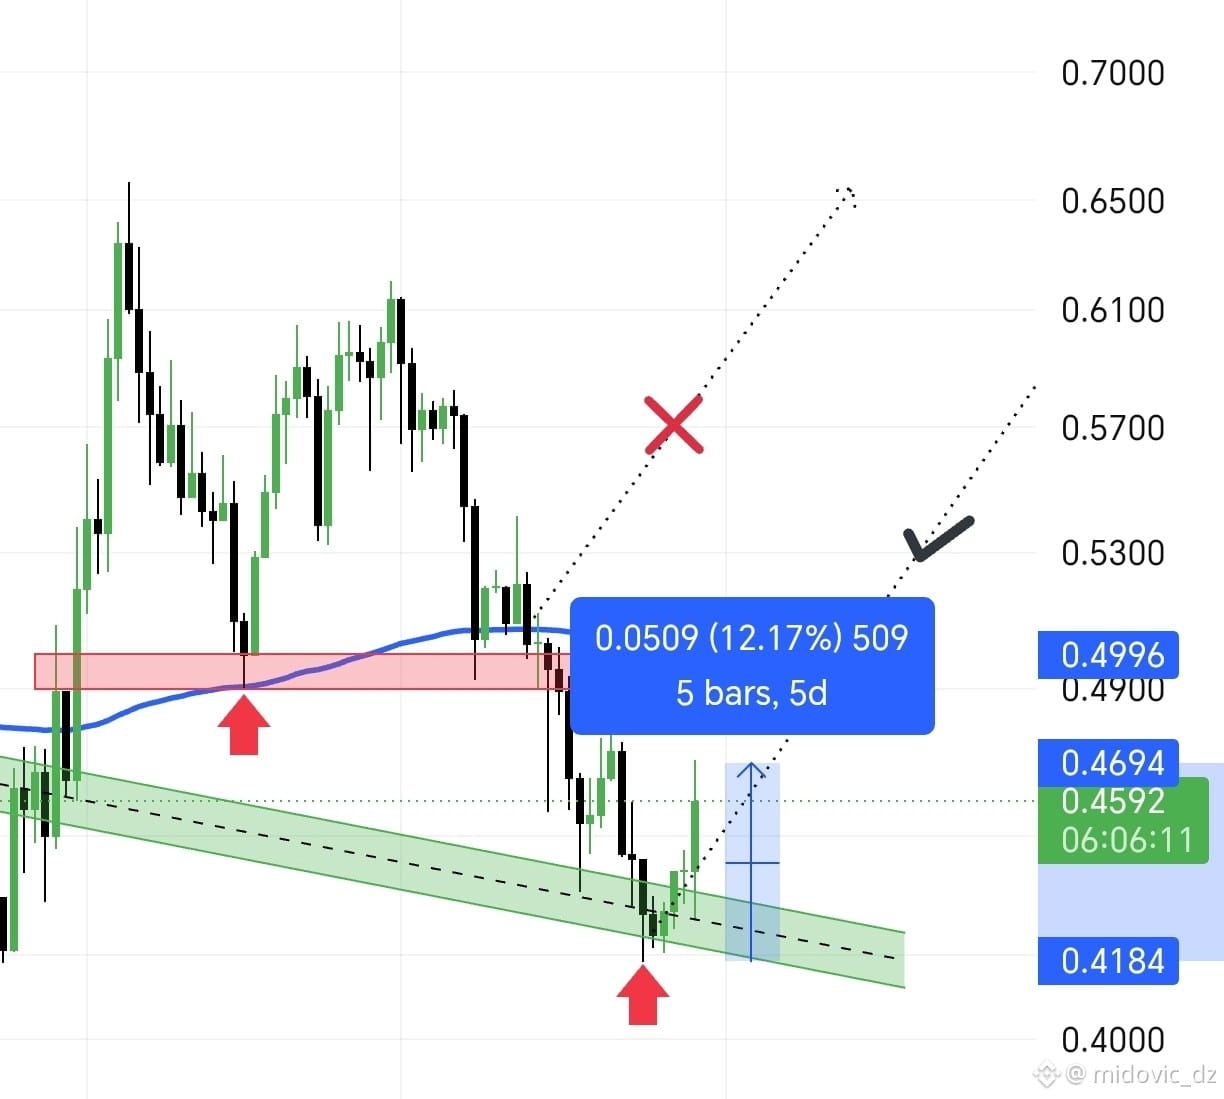
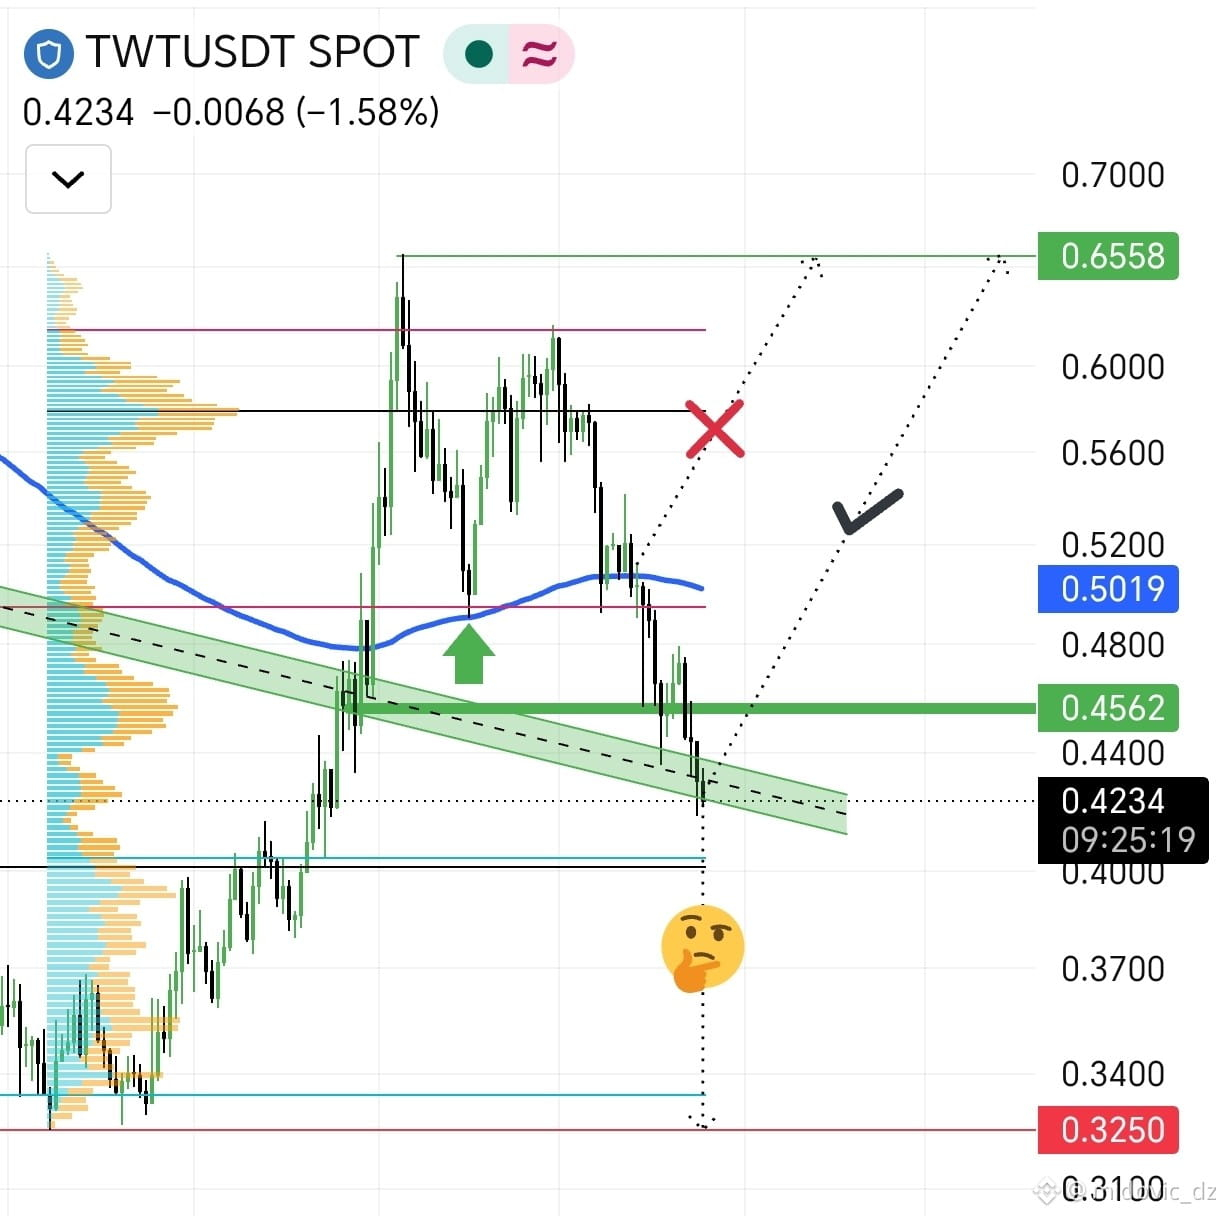
📊 Quick technical analysis of $TWT
The current price is trading around $0.4416, while testing a critical area and the boundaries of a minor price channel.

Current pivot zone: The price is currently testing a descending support range within the channel shown (the green area). This level may offer an opportunity for a temporary corrective rebound if it holds.
Moving averages: The price is below the main moving average (the blue line, at around $0.5000), reflecting previous selling pressure and attempts to break above the trend line.
​Possible scenarios:

​📈 Positive rebound scenario: If the price manages to hold the current support and break above $0.4562, we could target a return toward resistance near $0.5000.

​📉 Continued decline scenario: A break below the current support could push the price toward lower liquidity levels, with historical support at $0.3601.

Note: Please monitor the current candle's close and manage risk carefully.
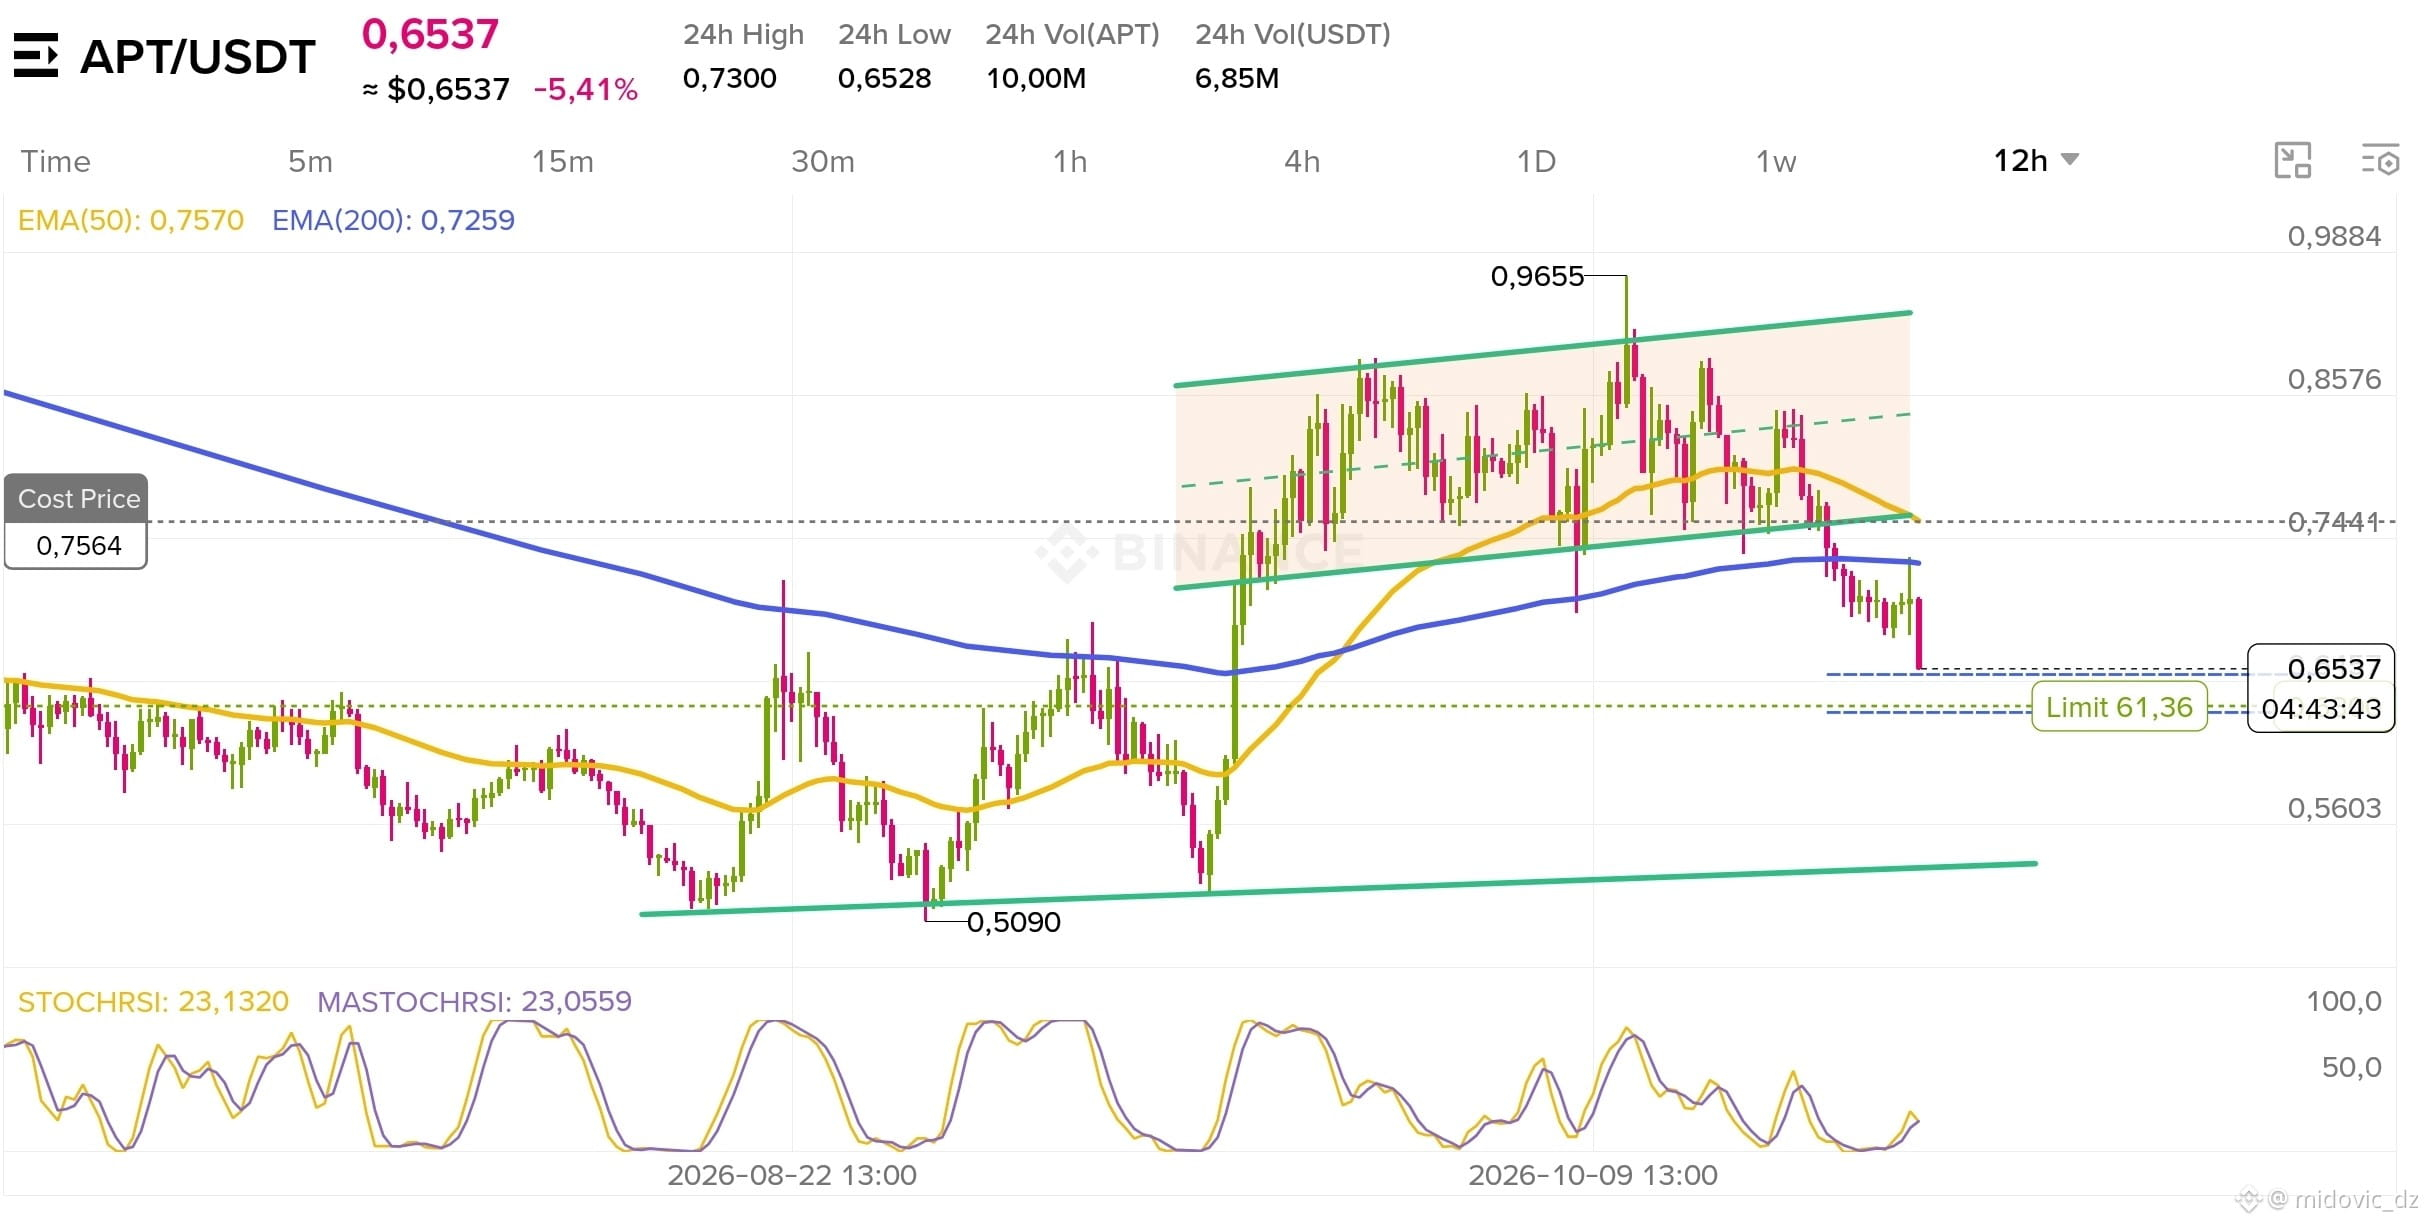
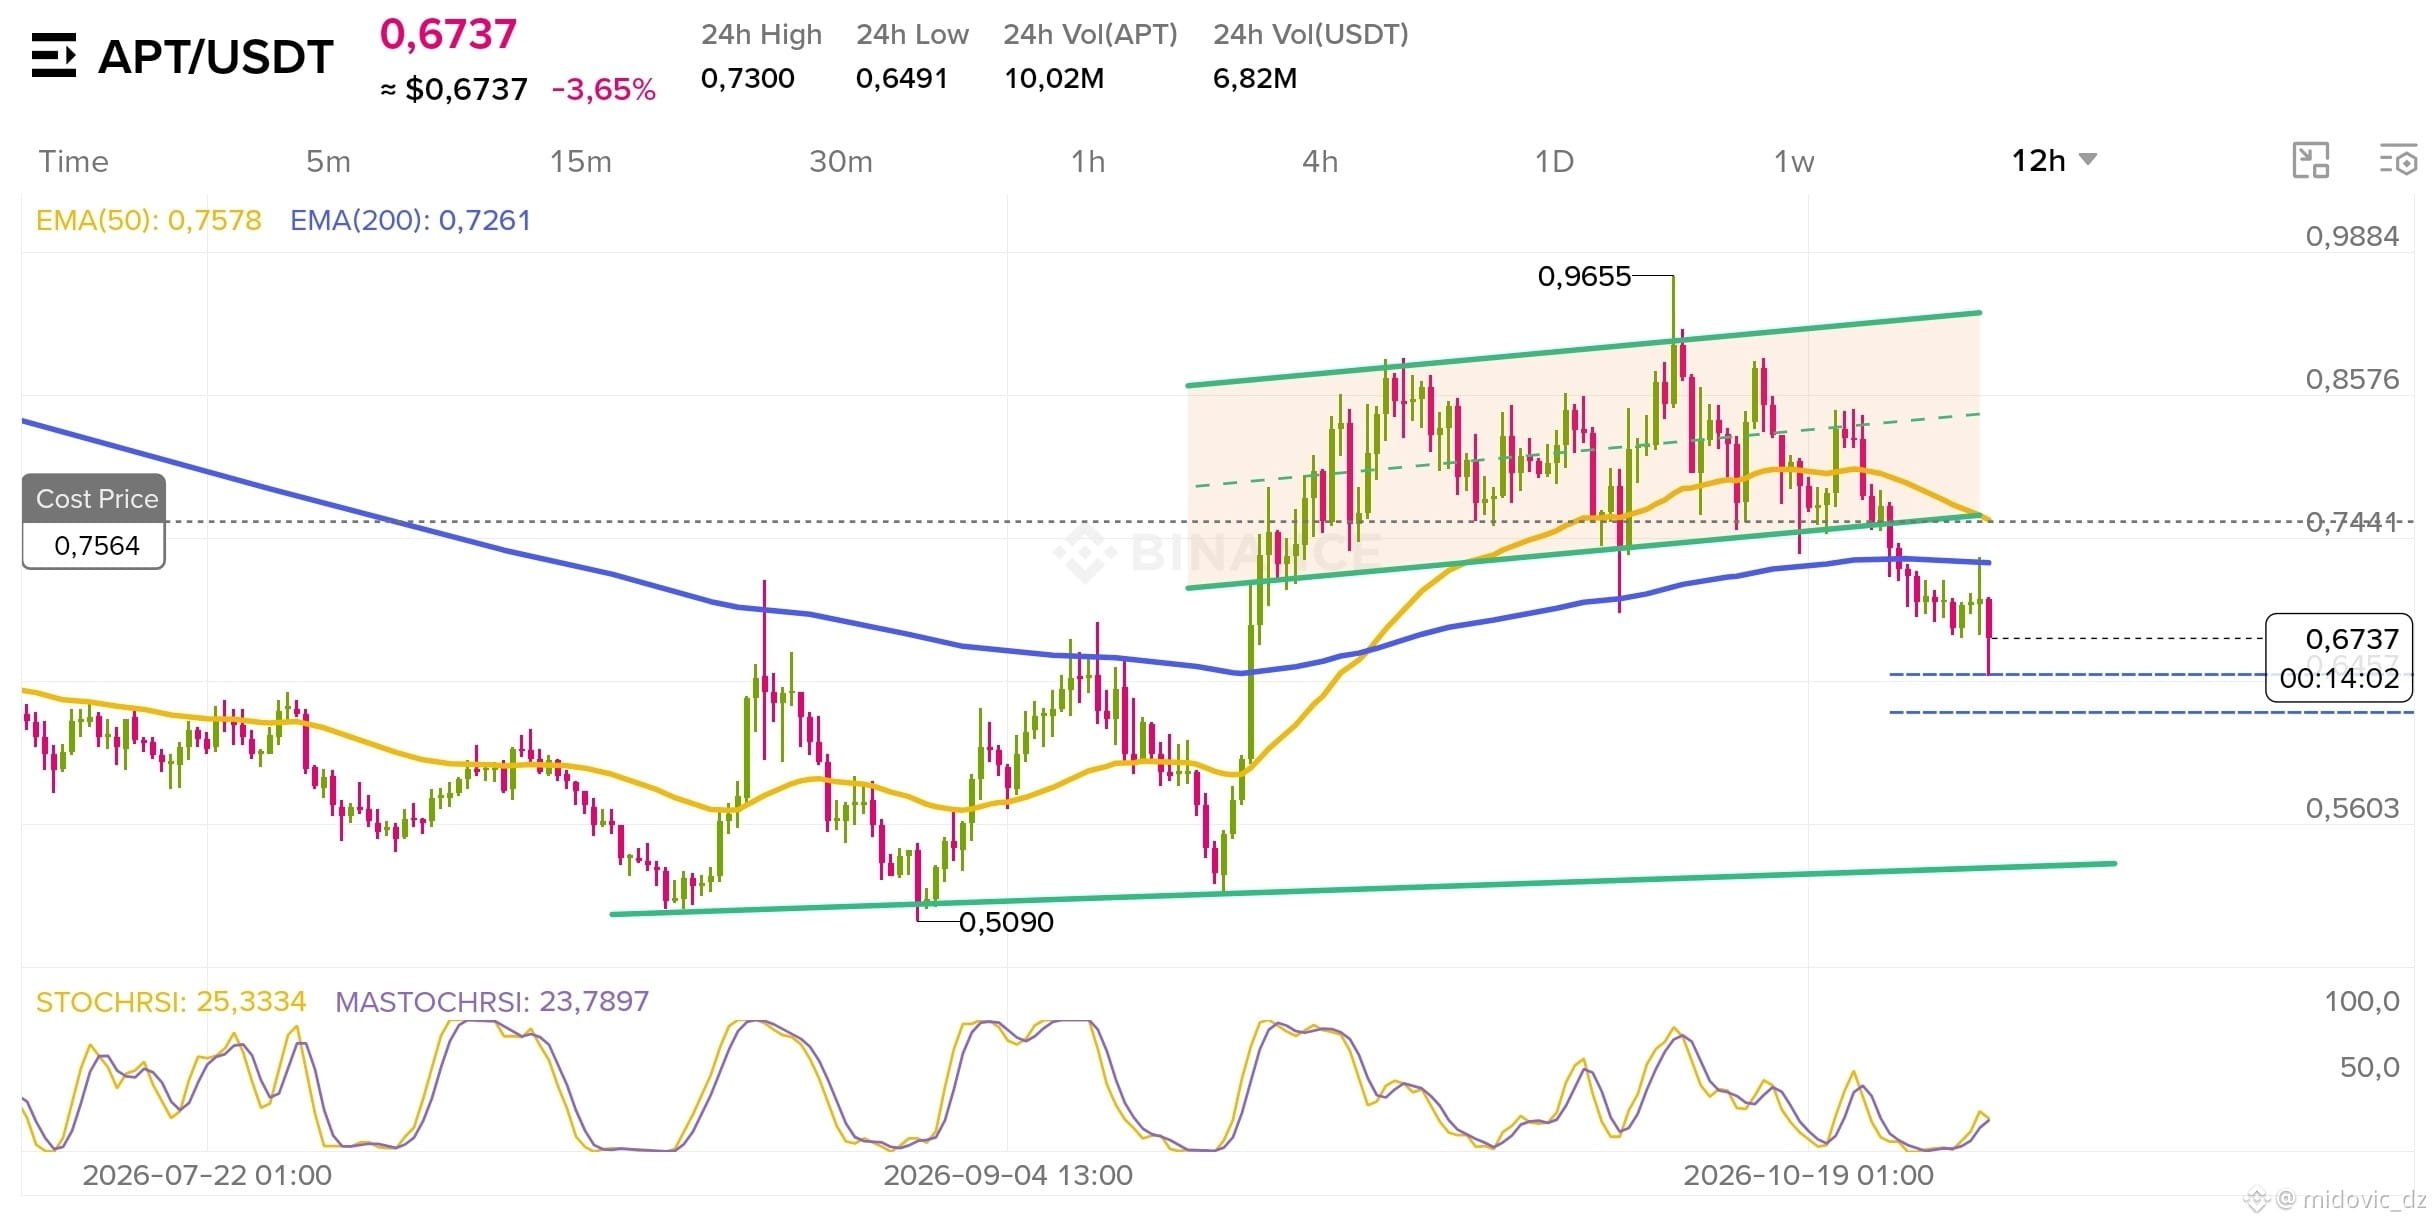
$APT 📊 Entry between 0.65 and 0.63 ⚡⚡ {spot}(APTUSDT)
$APT 📊
Entry between 0.65 and 0.63 ⚡⚡
imad soukkou
·
--
$APT

It has approached a strong support zone.
The price will bounce straight off it ⚡⚡⚡
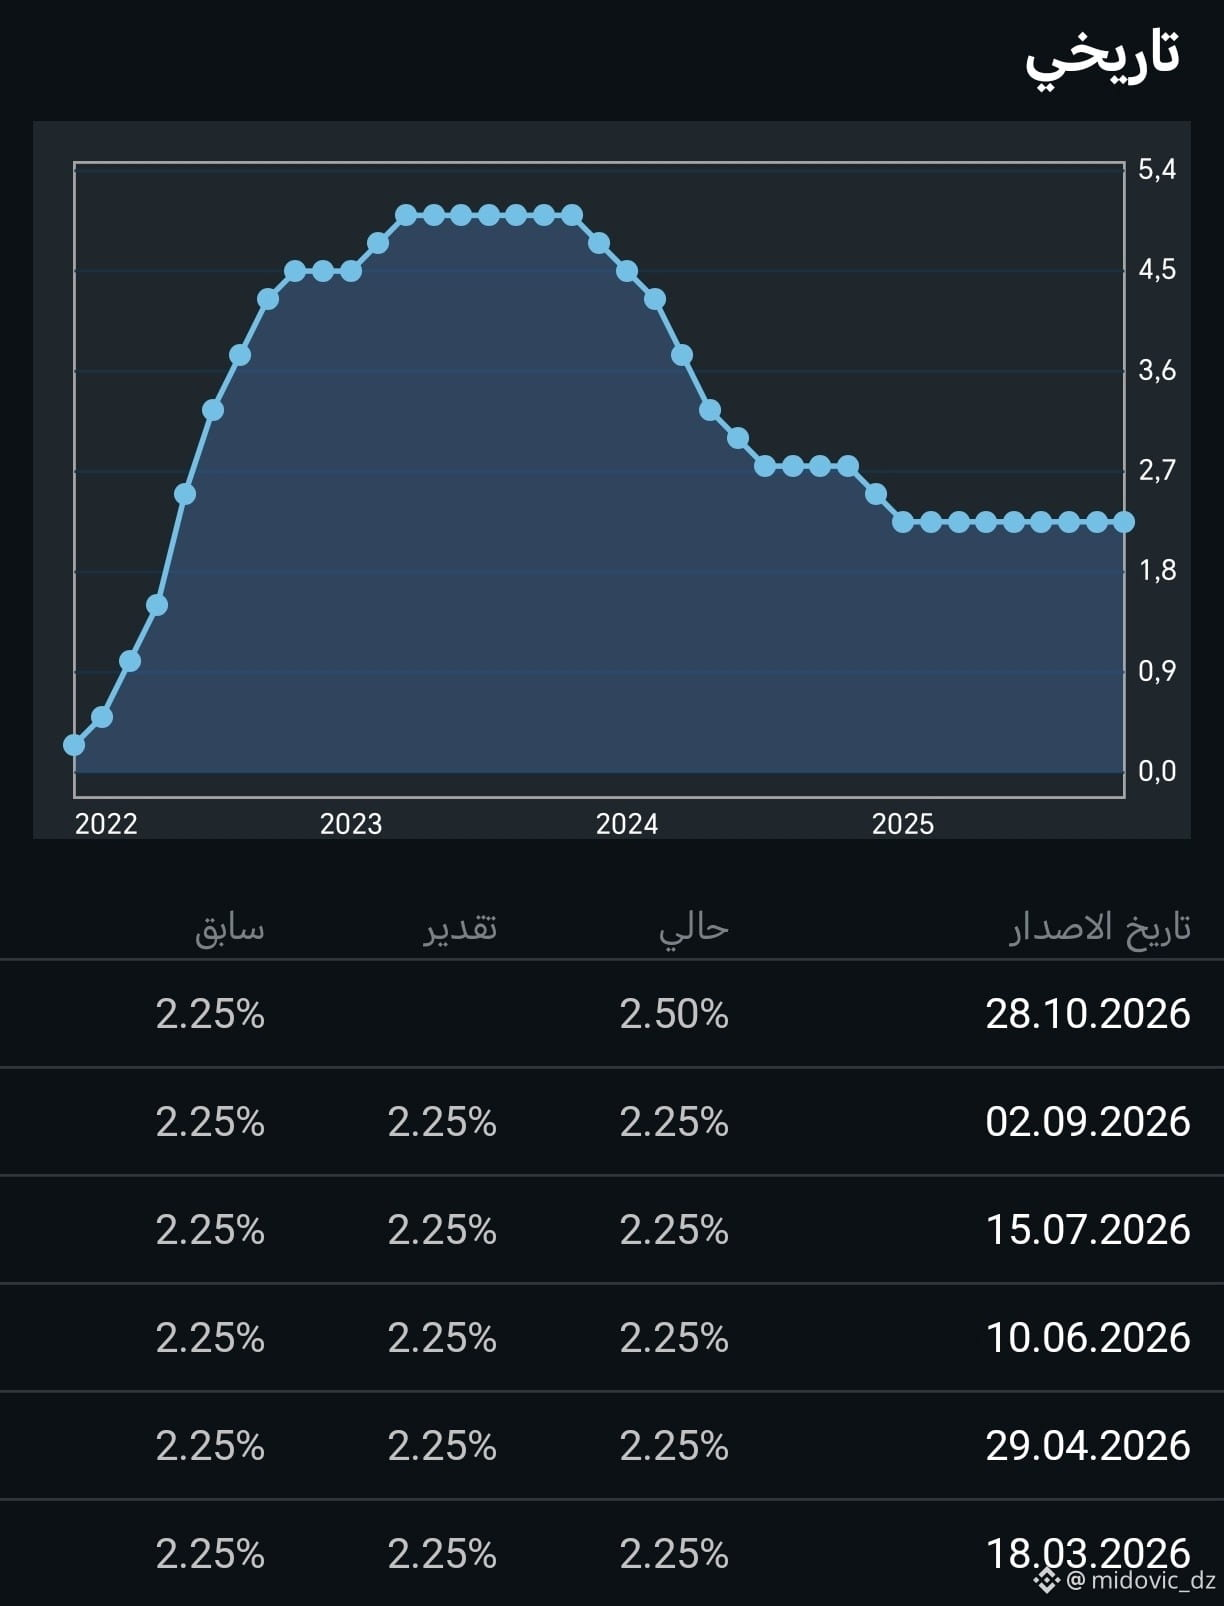
Canadian central bank interest rate decision Previous: 2.25% Current: 2٠50% Release date: 28/10/2026 Source: Bank Of Canada
Canadian central bank interest rate decision
Previous: 2.25%
Current: 2٠50%
Release date: 28/10/2026
Source: Bank Of Canada
·
--
Bullish
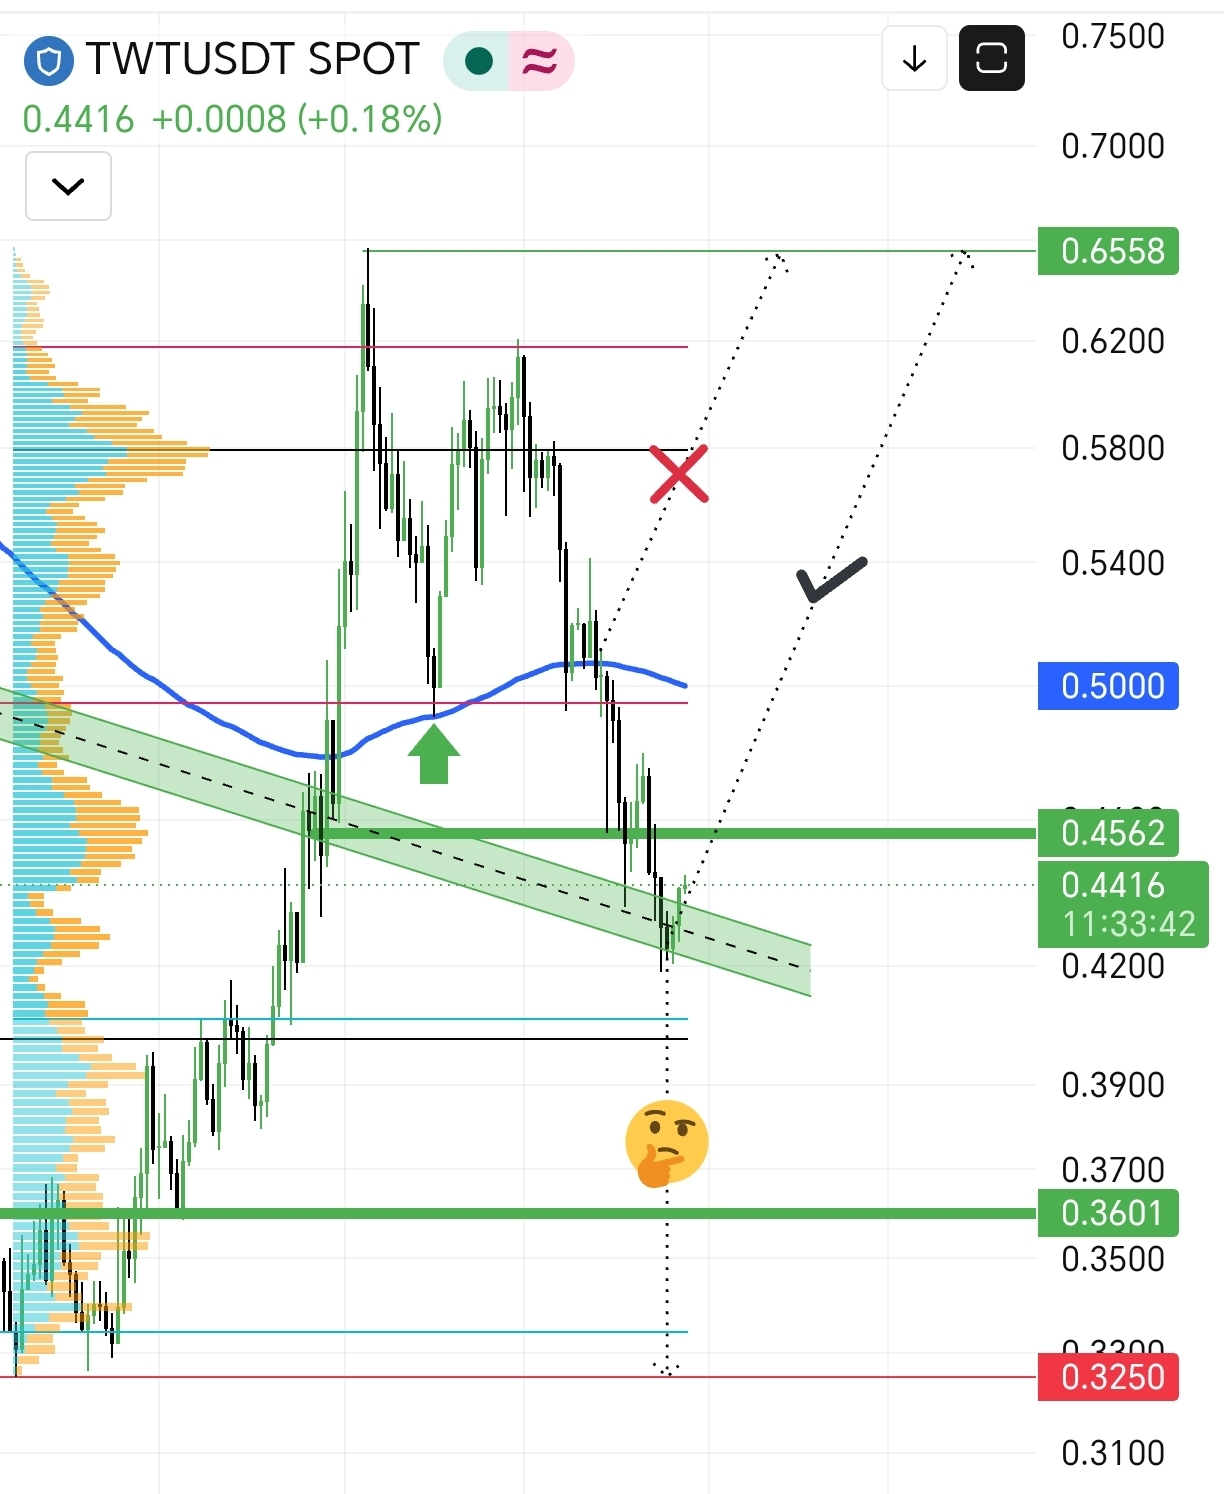
📊 Quick technical analysis of $TWT The current price is trading around $0.4416, while testing a critical area and the boundaries of a minor price channel. Current pivot zone: The price is currently testing a descending support range within the channel shown (the green area). This level may offer an opportunity for a temporary corrective rebound if it holds. Moving averages: The price is below the main moving average (the blue line, at around $0.5000), reflecting previous selling pressure and attempts to break above the trend line. ​Possible scenarios: ​📈 Positive rebound scenario: If the price manages to hold the current support and break above $0.4562, we could target a return toward resistance near $0.5000. ​📉 Continued decline scenario: A break below the current support could push the price toward lower liquidity levels, with historical support at $0.3601. Note: Please monitor the current candle's close and manage risk carefully.
📊 Quick technical analysis of $TWT
The current price is trading around $0.4416, while testing a critical area and the boundaries of a minor price channel.

Current pivot zone: The price is currently testing a descending support range within the channel shown (the green area). This level may offer an opportunity for a temporary corrective rebound if it holds.
Moving averages: The price is below the main moving average (the blue line, at around $0.5000), reflecting previous selling pressure and attempts to break above the trend line.
​Possible scenarios:

​📈 Positive rebound scenario: If the price manages to hold the current support and break above $0.4562, we could target a return toward resistance near $0.5000.

​📉 Continued decline scenario: A break below the current support could push the price toward lower liquidity levels, with historical support at $0.3601.

Note: Please monitor the current candle's close and manage risk carefully.
imad soukkou
·
--
$TWT 😫😫
First possibility: ❌
Second possibility: 80٪
Third possibility: 20٪

What do you all think? 🤔
$APT {spot}(APTUSDT) It has approached a strong support zone. The price will bounce straight off it ⚡⚡⚡
$APT
It has approached a strong support zone.
The price will bounce straight off it ⚡⚡⚡
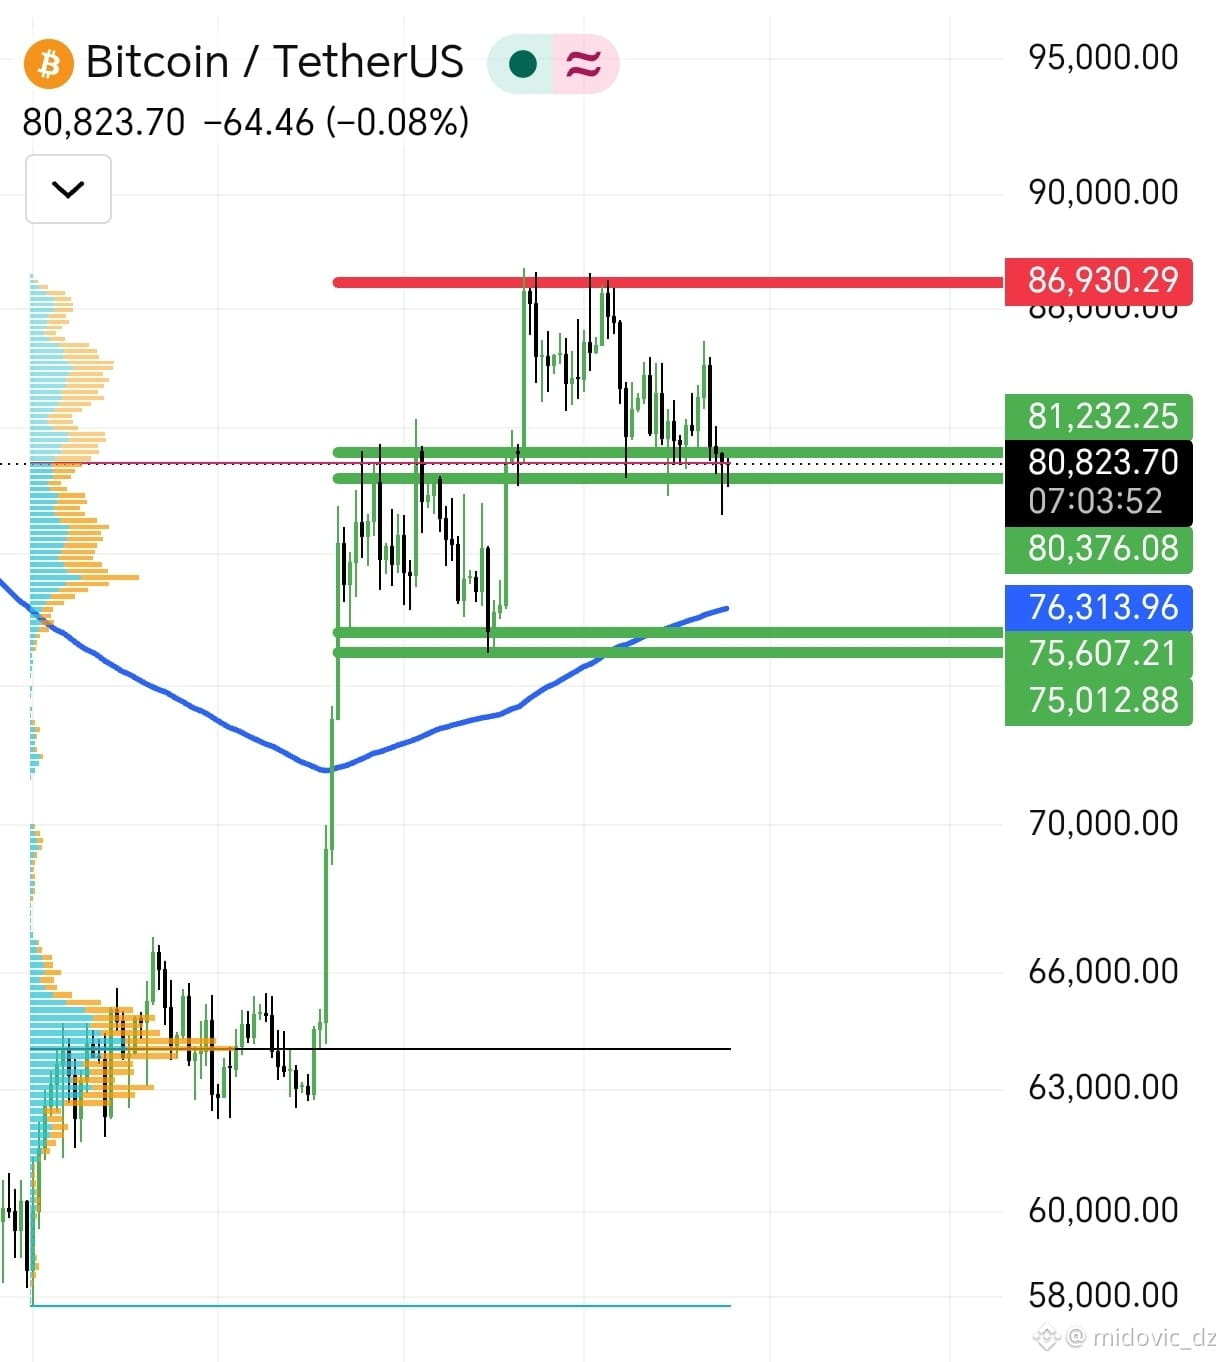
$TWT 😫😫 First possibility: ❌ Second possibility: 80٪ Third possibility: 20٪ What do you all think? 🤔
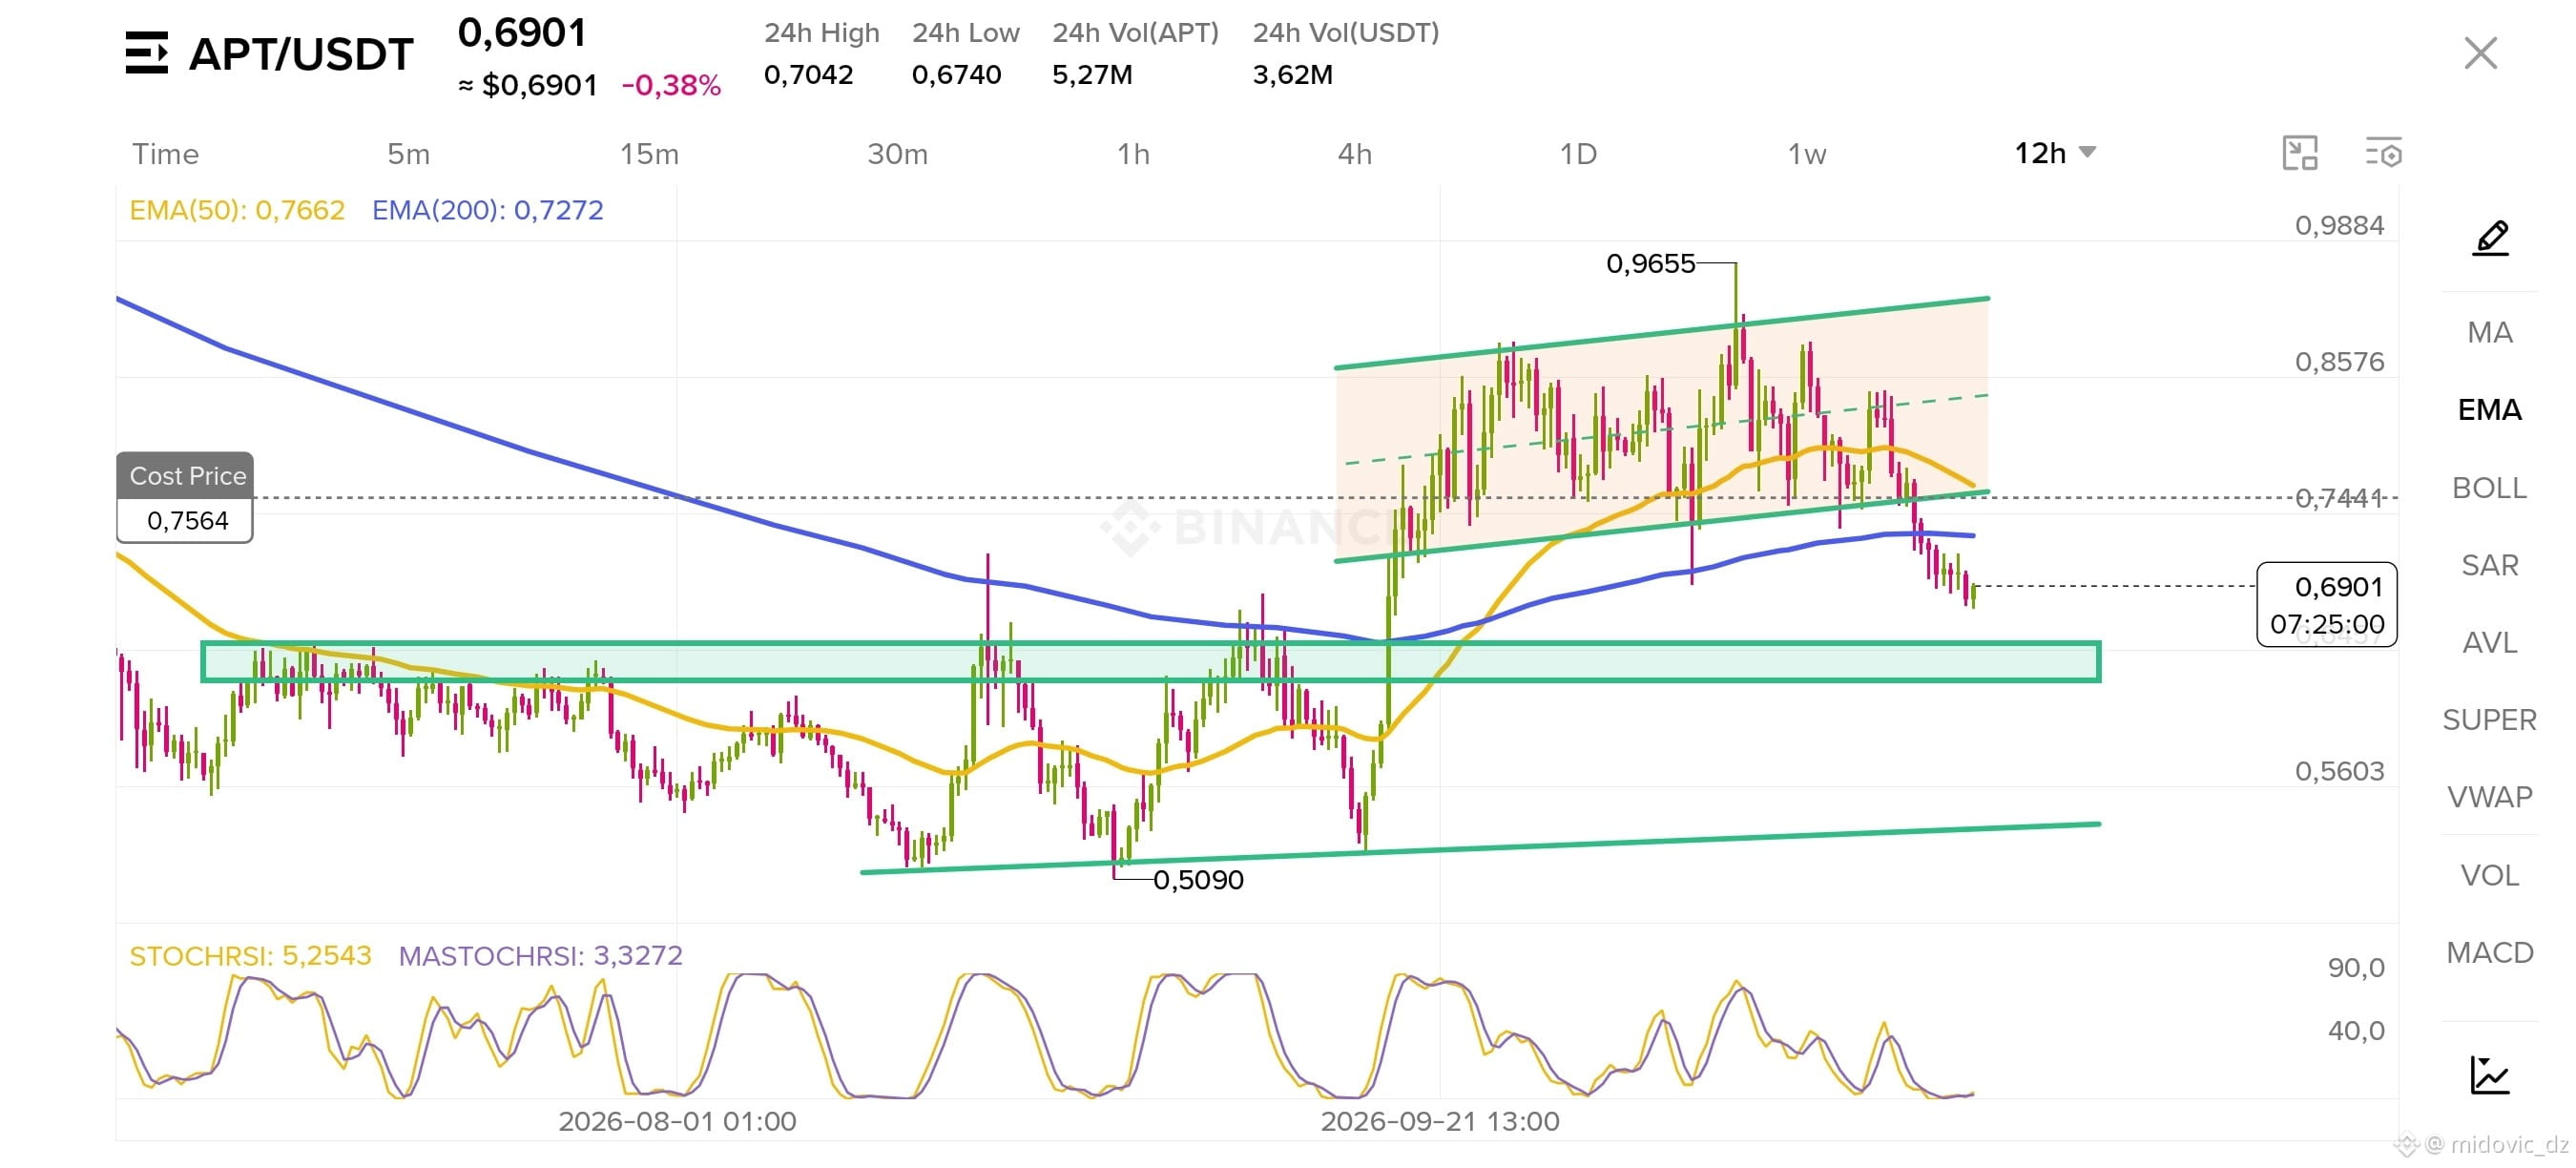
$TWT 😫😫
First possibility: ❌
Second possibility: 80٪
Third possibility: 20٪

What do you all think? 🤔
·
--
Bullish
$XLM 🚀🚀🚀 Entry : 0.164 SL : 0.1538
$XLM 🚀🚀🚀
Entry : 0.164
SL : 0.1538
imad soukkou
·
--
Bullish
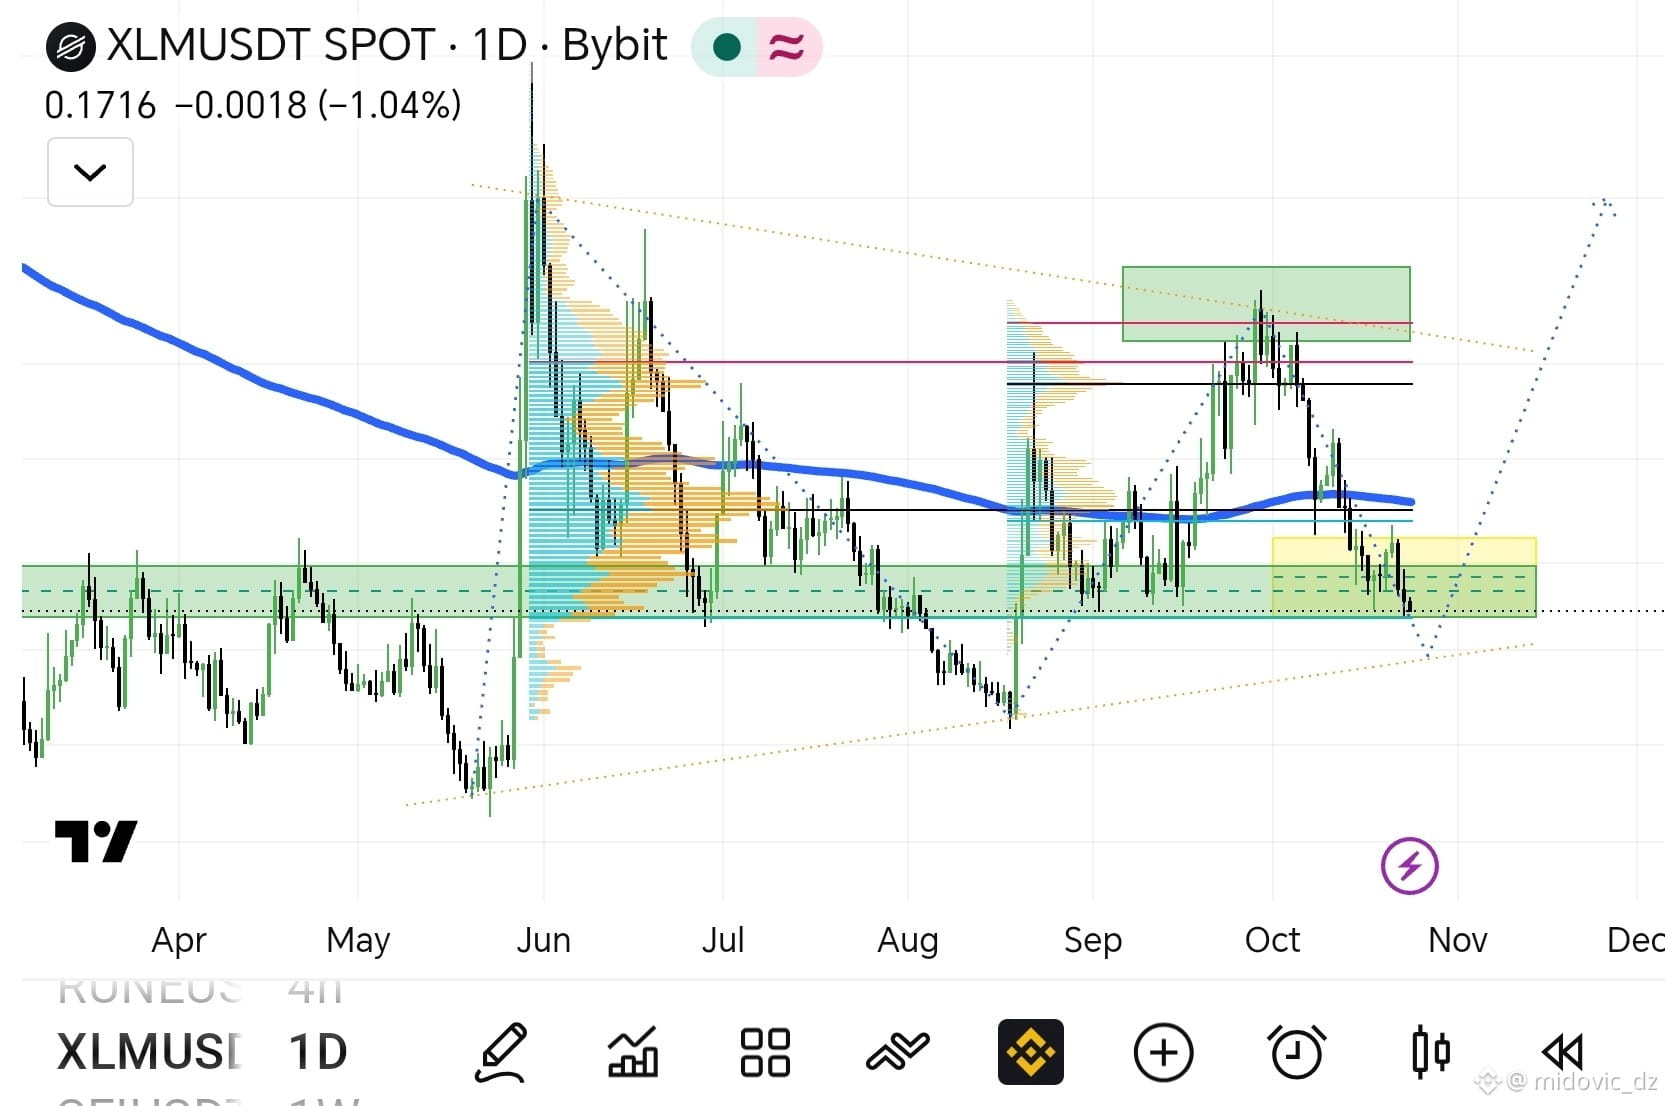
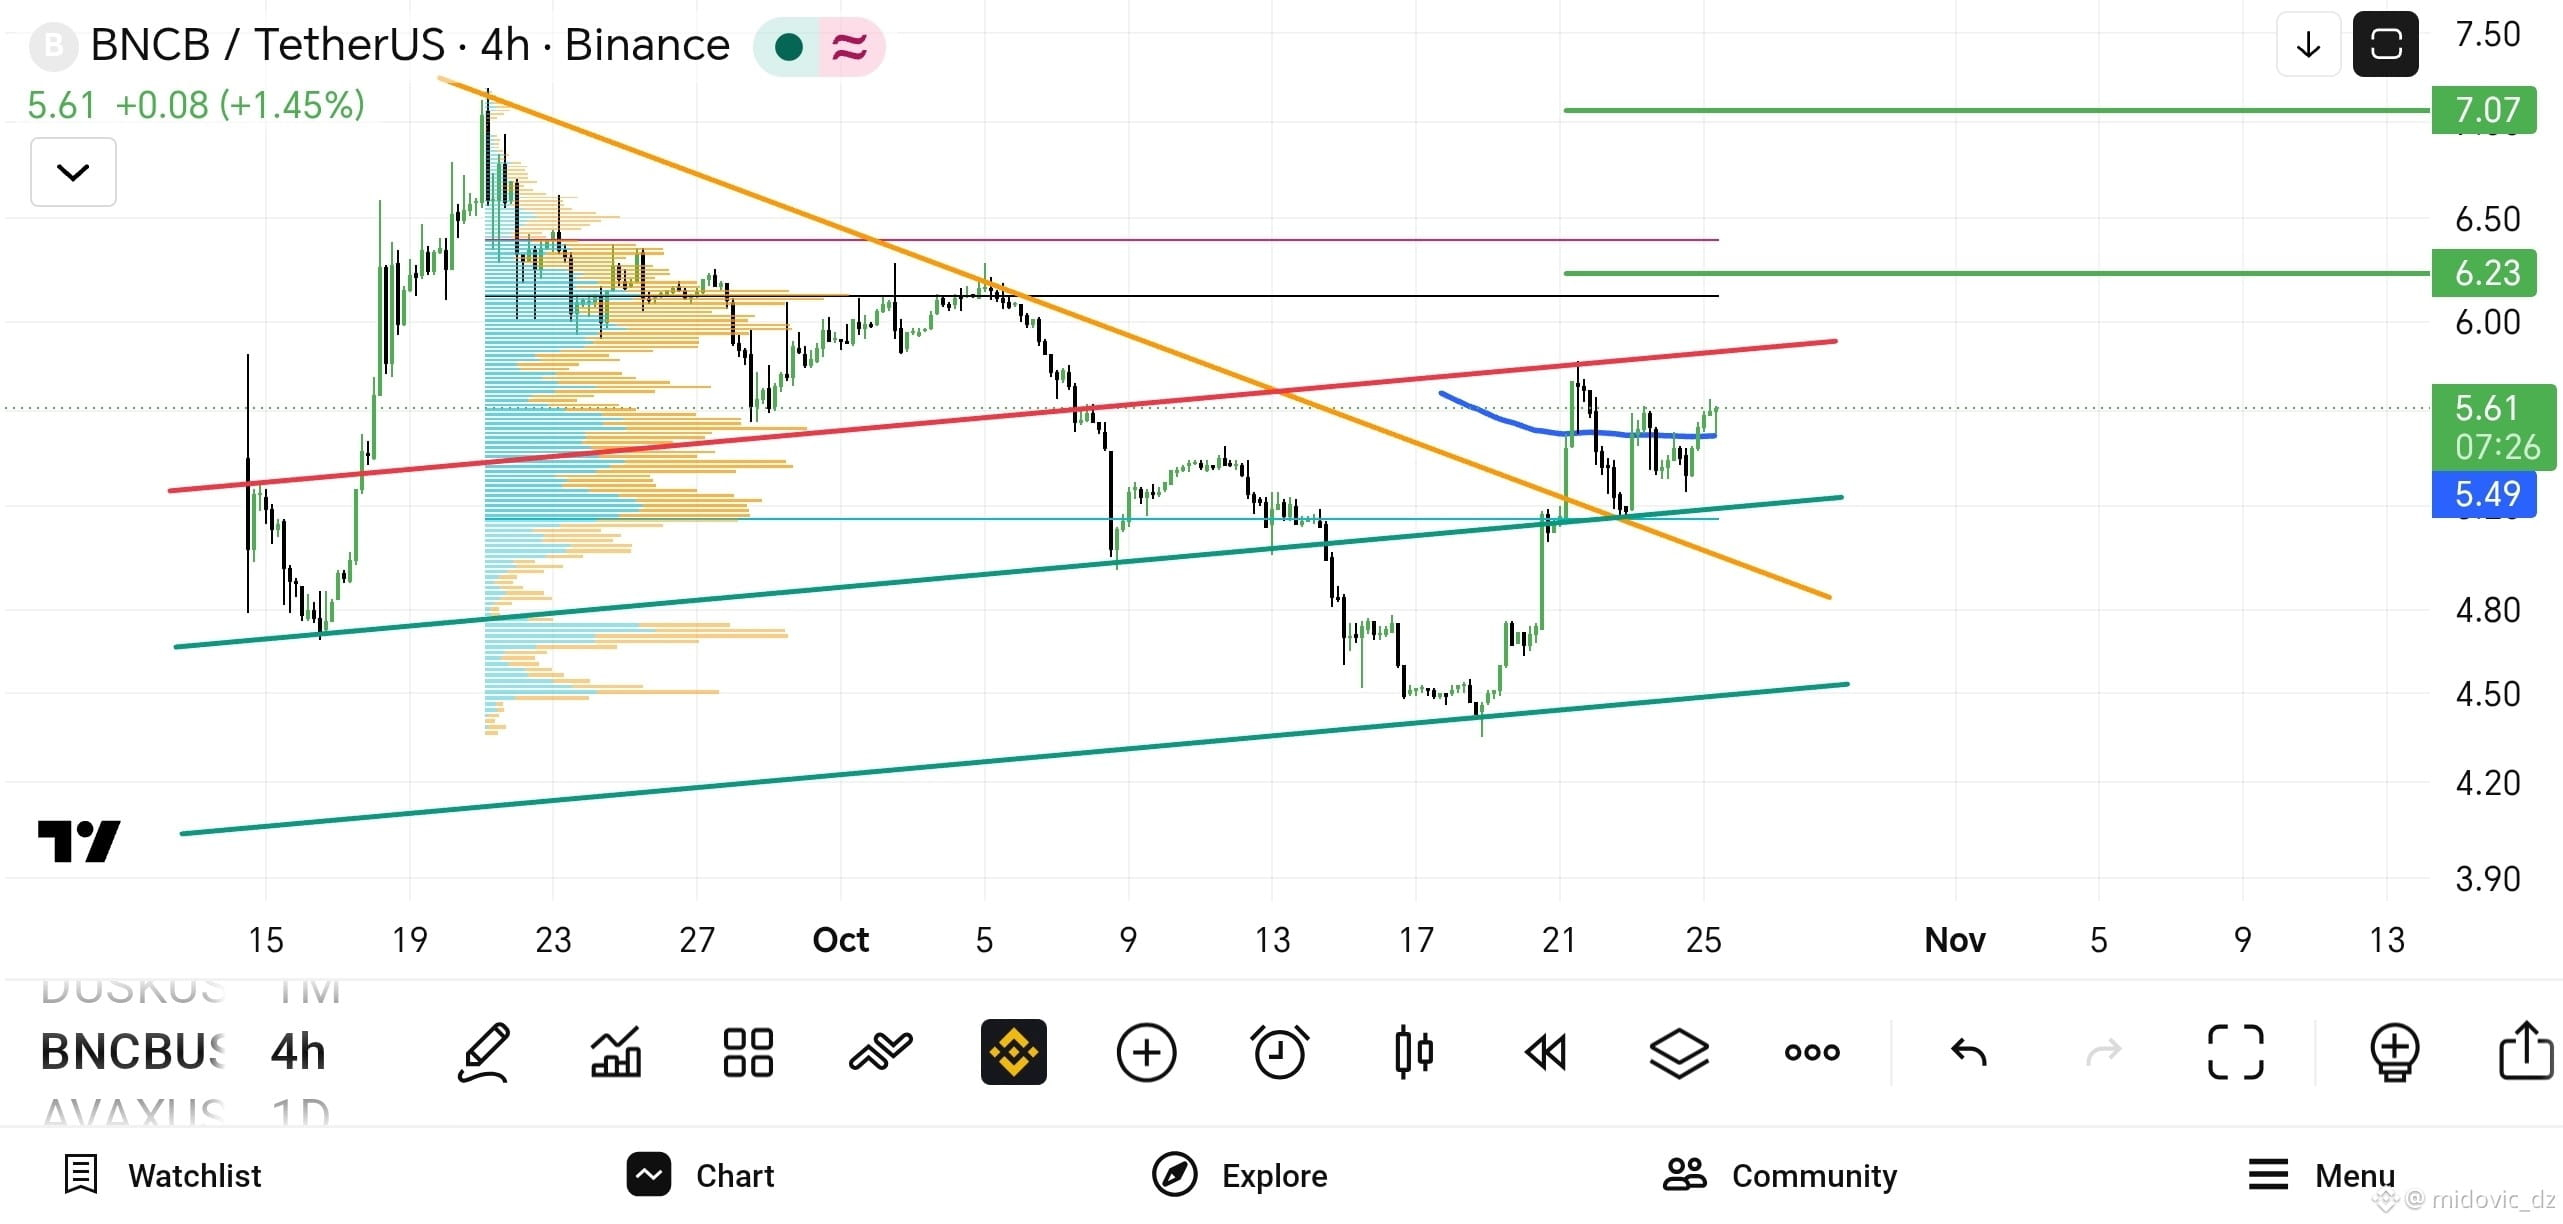
Quick analysis of coin $XLM (Daily timeframe - 1D)

The coin is currently trading around $0.1716 amid calm price action and a test of an important support zone.

Current demand zone: The price is currently testing a notable key support range (shown in the yellow and green areas below the chart), which represents a historical liquidity cluster (Order Block / Support Zone) and could be a potential bounce point.

Moving averages: The price is moving near the main moving average (blue), reflecting a period of fluctuation as the market awaits a test of the next direction.

Target levels:

📉 If support breaks: We may see a retest of lower levels within the ascending channel.

📈 If the price bounces: The first target will be to break through nearby resistance and return to the upper trading range.

#BinancePick #EarningsSeason
·
--
Bullish
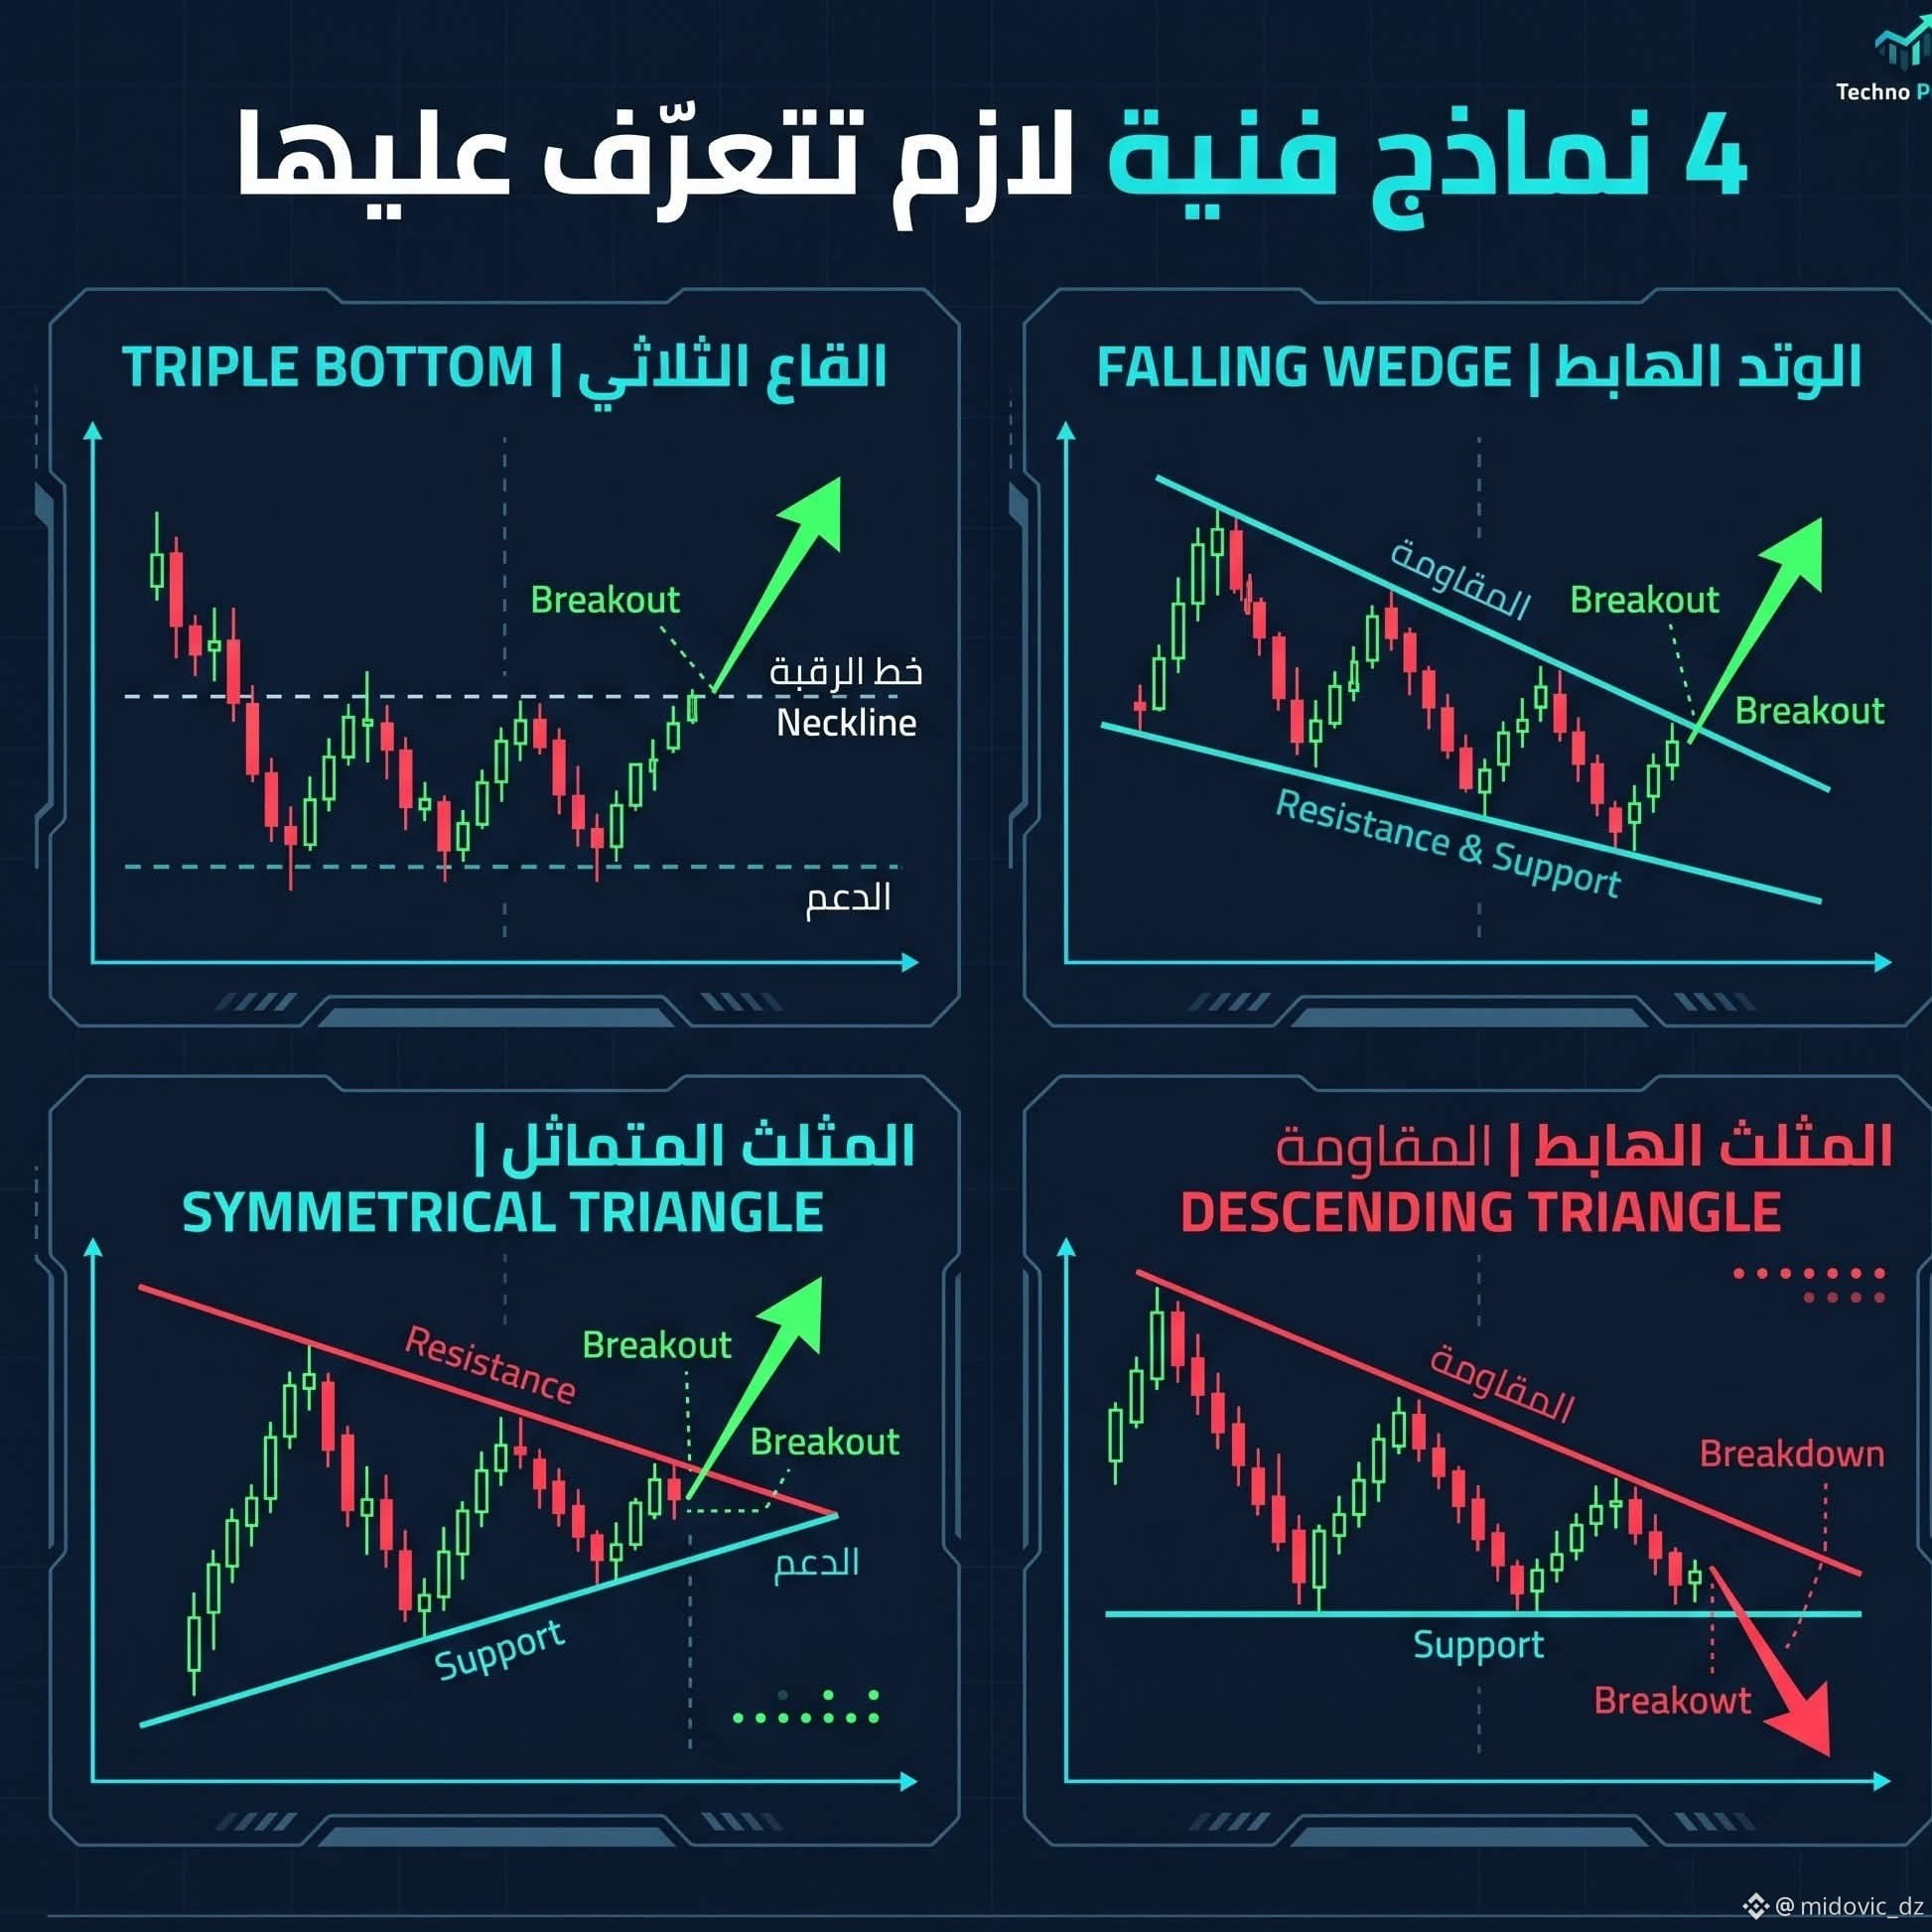
These patterns and formations belong exclusively to technical analysis in financial markets (such as stocks, cryptocurrencies, and others). Triple Bottom: A bullish reversal pattern that signals a trend change from downward to upward after testing a key support level three times. Falling Wedge: A bullish continuation or reversal pattern formed between two converging downward-sloping lines, often ending with an upside breakout above resistance. Symmetrical Triangle: A continuation pattern that shows the price range narrowing between a downward-sloping resistance line and an upward-sloping support line before a breakout occurs. Descending Triangle: A pattern that is often bearish (a bearish continuation pattern), formed by horizontal support and declining resistance that push the price downward. $BTC {spot}(BTCUSDT) $SOL {spot}(SOLUSDT) $ETH {spot}(ETHUSDT) #EarningsSeason #BinancePick
These patterns and formations belong exclusively to technical analysis in financial markets (such as stocks, cryptocurrencies, and others).

Triple Bottom: A bullish reversal pattern that signals a trend change from downward to upward after testing a key support level three times.

Falling Wedge: A bullish continuation or reversal pattern formed between two converging downward-sloping lines, often ending with an upside breakout above resistance.

Symmetrical Triangle: A continuation pattern that shows the price range narrowing between a downward-sloping resistance line and an upward-sloping support line before a breakout occurs.

Descending Triangle: A pattern that is often bearish (a bearish continuation pattern), formed by horizontal support and declining resistance that push the price downward.

$BTC
$SOL
$ETH
#EarningsSeason #BinancePick
·
--
Bullish
Quick analysis of coin $XLM (Daily timeframe - 1D) The coin is currently trading around $0.1716 amid calm price action and a test of an important support zone. Current demand zone: The price is currently testing a notable key support range (shown in the yellow and green areas below the chart), which represents a historical liquidity cluster (Order Block / Support Zone) and could be a potential bounce point. Moving averages: The price is moving near the main moving average (blue), reflecting a period of fluctuation as the market awaits a test of the next direction. Target levels: 📉 If support breaks: We may see a retest of lower levels within the ascending channel. 📈 If the price bounces: The first target will be to break through nearby resistance and return to the upper trading range. #BinancePick #EarningsSeason {spot}(XLMUSDT)
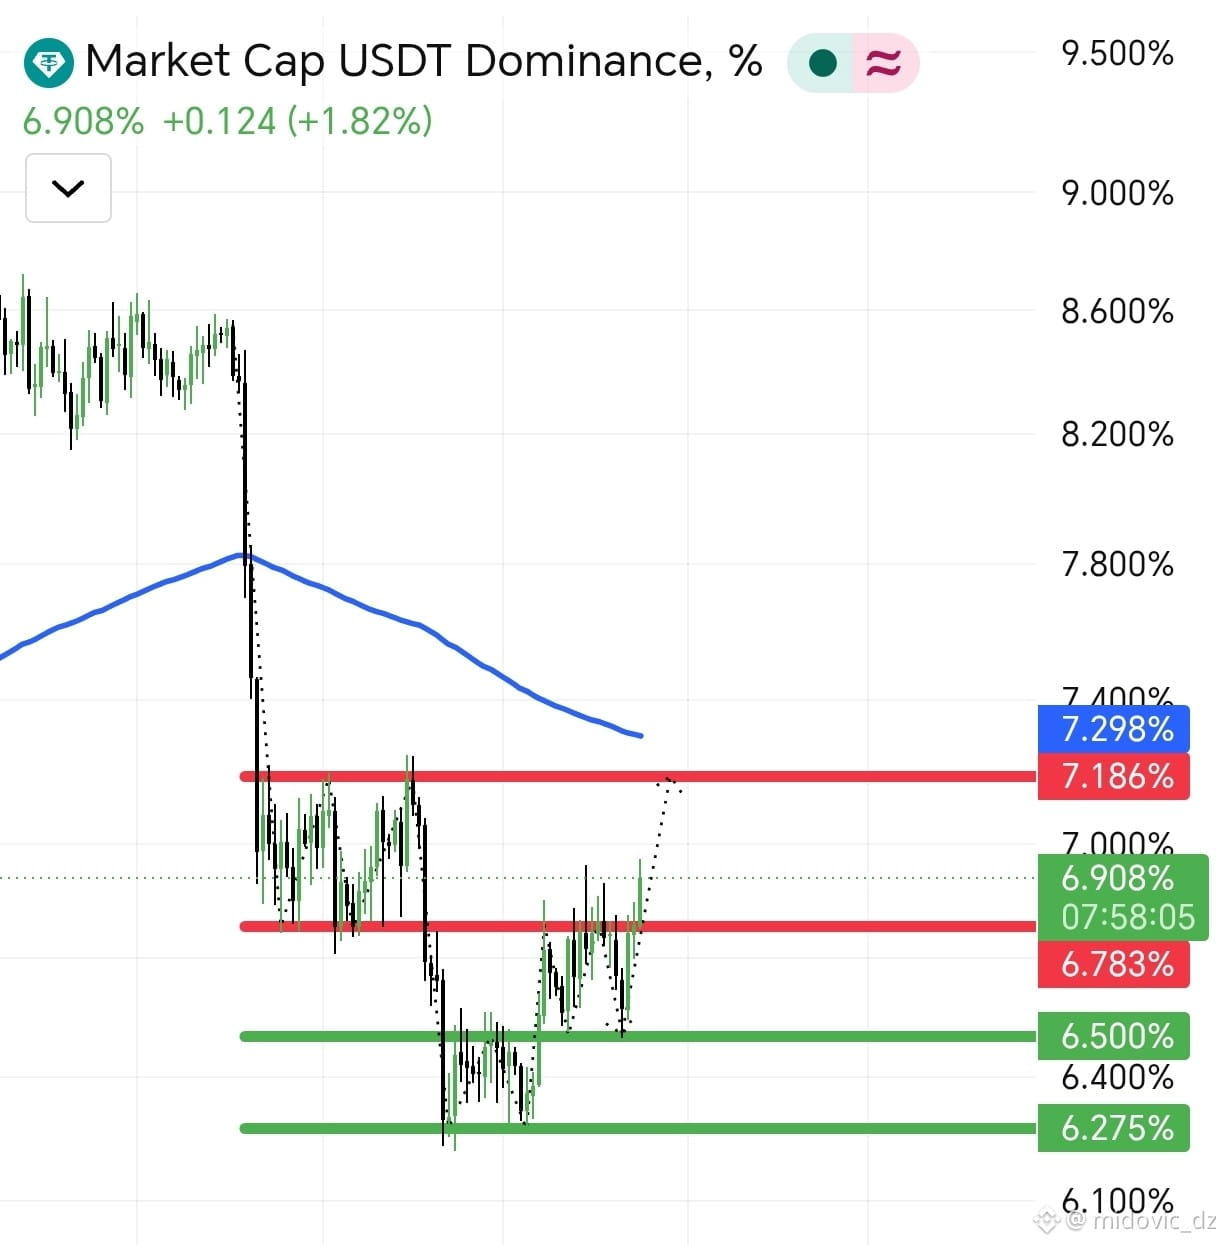
Quick analysis of coin $XLM (Daily timeframe - 1D)

The coin is currently trading around $0.1716 amid calm price action and a test of an important support zone.

Current demand zone: The price is currently testing a notable key support range (shown in the yellow and green areas below the chart), which represents a historical liquidity cluster (Order Block / Support Zone) and could be a potential bounce point.

Moving averages: The price is moving near the main moving average (blue), reflecting a period of fluctuation as the market awaits a test of the next direction.

Target levels:

📉 If support breaks: We may see a retest of lower levels within the ascending channel.

📈 If the price bounces: The first target will be to break through nearby resistance and return to the upper trading range.

#BinancePick #EarningsSeason
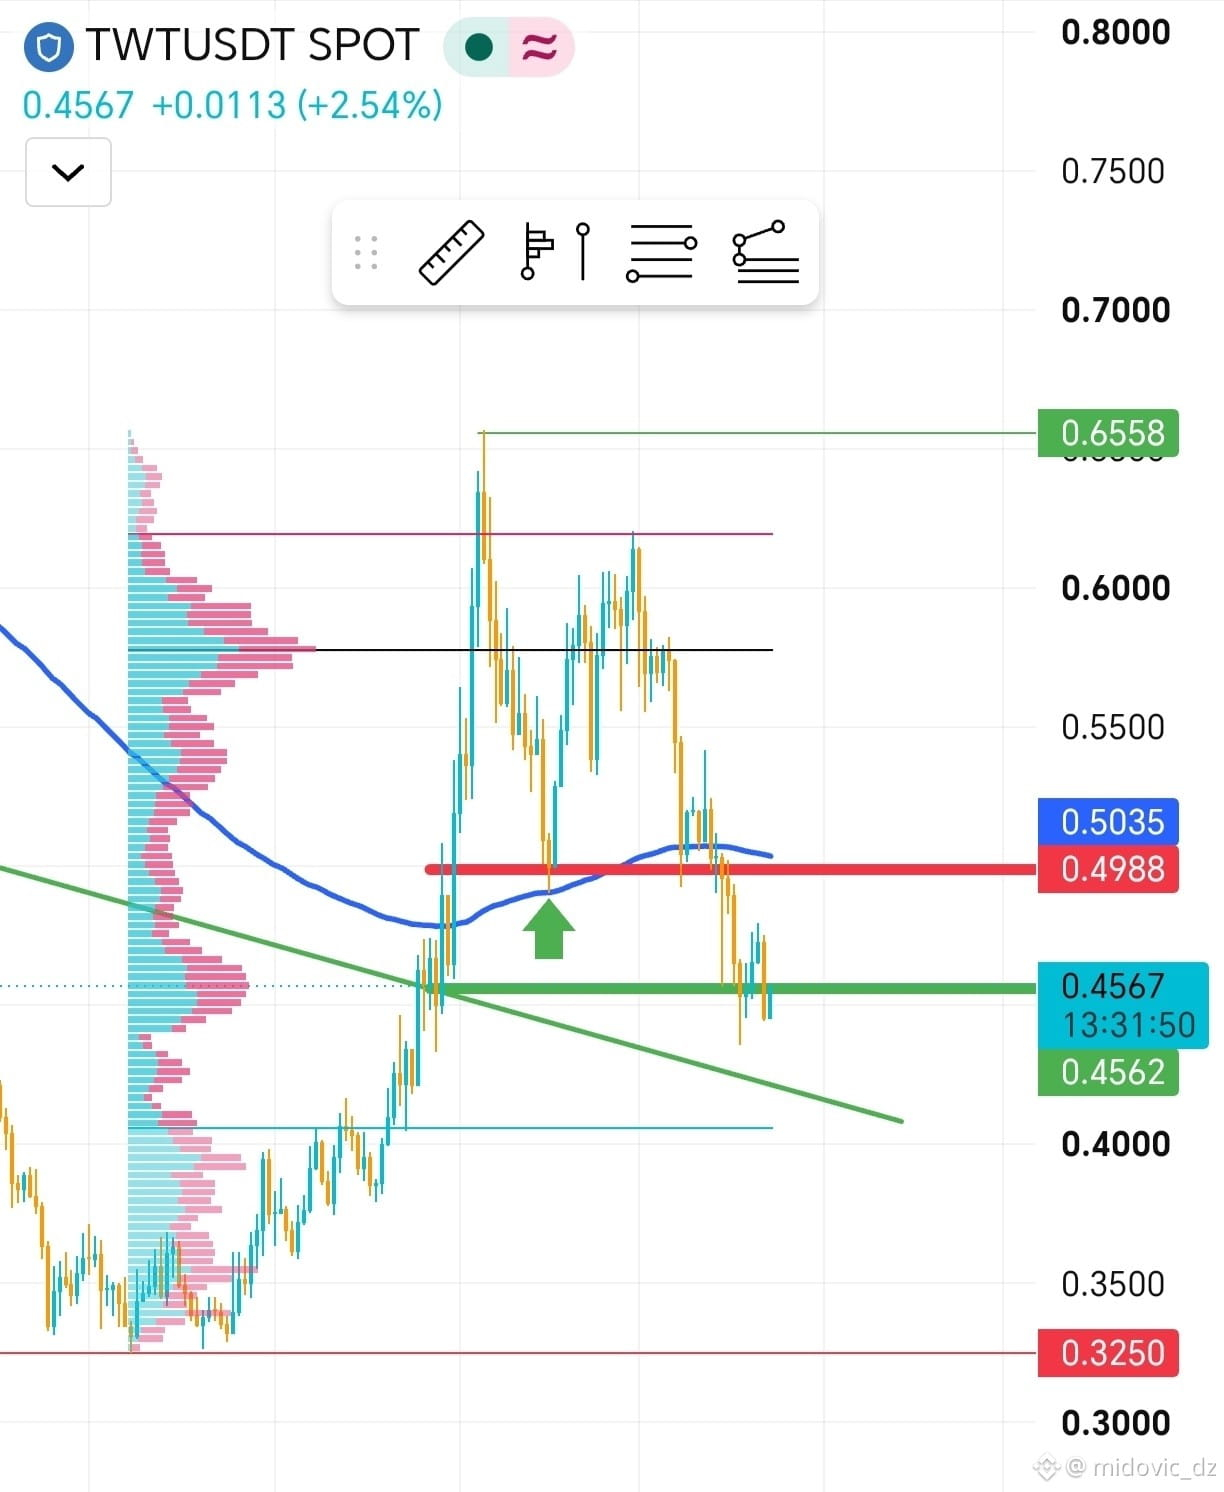
Quick technical analysis with entry zones for coin $TWT The coin is trading at current support levels around 0.4567, testing the rising trendline and an important zone. ​Suggested entry zone: Enter around the current range of 0.4562–0.4567. ​Resistance / first target: Target the 0.4988–0.5035 level. ​Main target: Aim to break above the peak and target 0.6558. ​Stop-loss / capital protection: A clear close below 0.42. ​🚀 Go To The Moon ⚡🔥
Quick technical analysis with entry zones for coin $TWT
The coin is trading at current support levels around 0.4567, testing the rising trendline and an important zone.
​Suggested entry zone: Enter around the current range of 0.4562–0.4567.
​Resistance / first target: Target the 0.4988–0.5035 level.
​Main target: Aim to break above the peak and target 0.6558.
​Stop-loss / capital protection: A clear close below 0.42.
​🚀 Go To The Moon ⚡🔥
·
--
Bullish
$TWT 🛡 The coin is currently testing the main support zone and the lower boundary of the channel/trend at 0.4562 and 0.4542. ⚡ Expected price action scenario Current support zone: Holding above 0.4562 signals a strong rebound. First resistance: A move toward breaking above the moving average and the 0.4988–0.5041 level. Main target: After breaking through the first resistance, a direct move to break above the previous high and target 0.6558. 🚀 Go To The Moon ⚡🔥 Chart notes: The current movement looks like a bounce off the lower boundary of the corrective descending pattern, suggesting a bullish rebound if the price holds the 0.4542 zone. {spot}(TWTUSDT)
$TWT 🛡
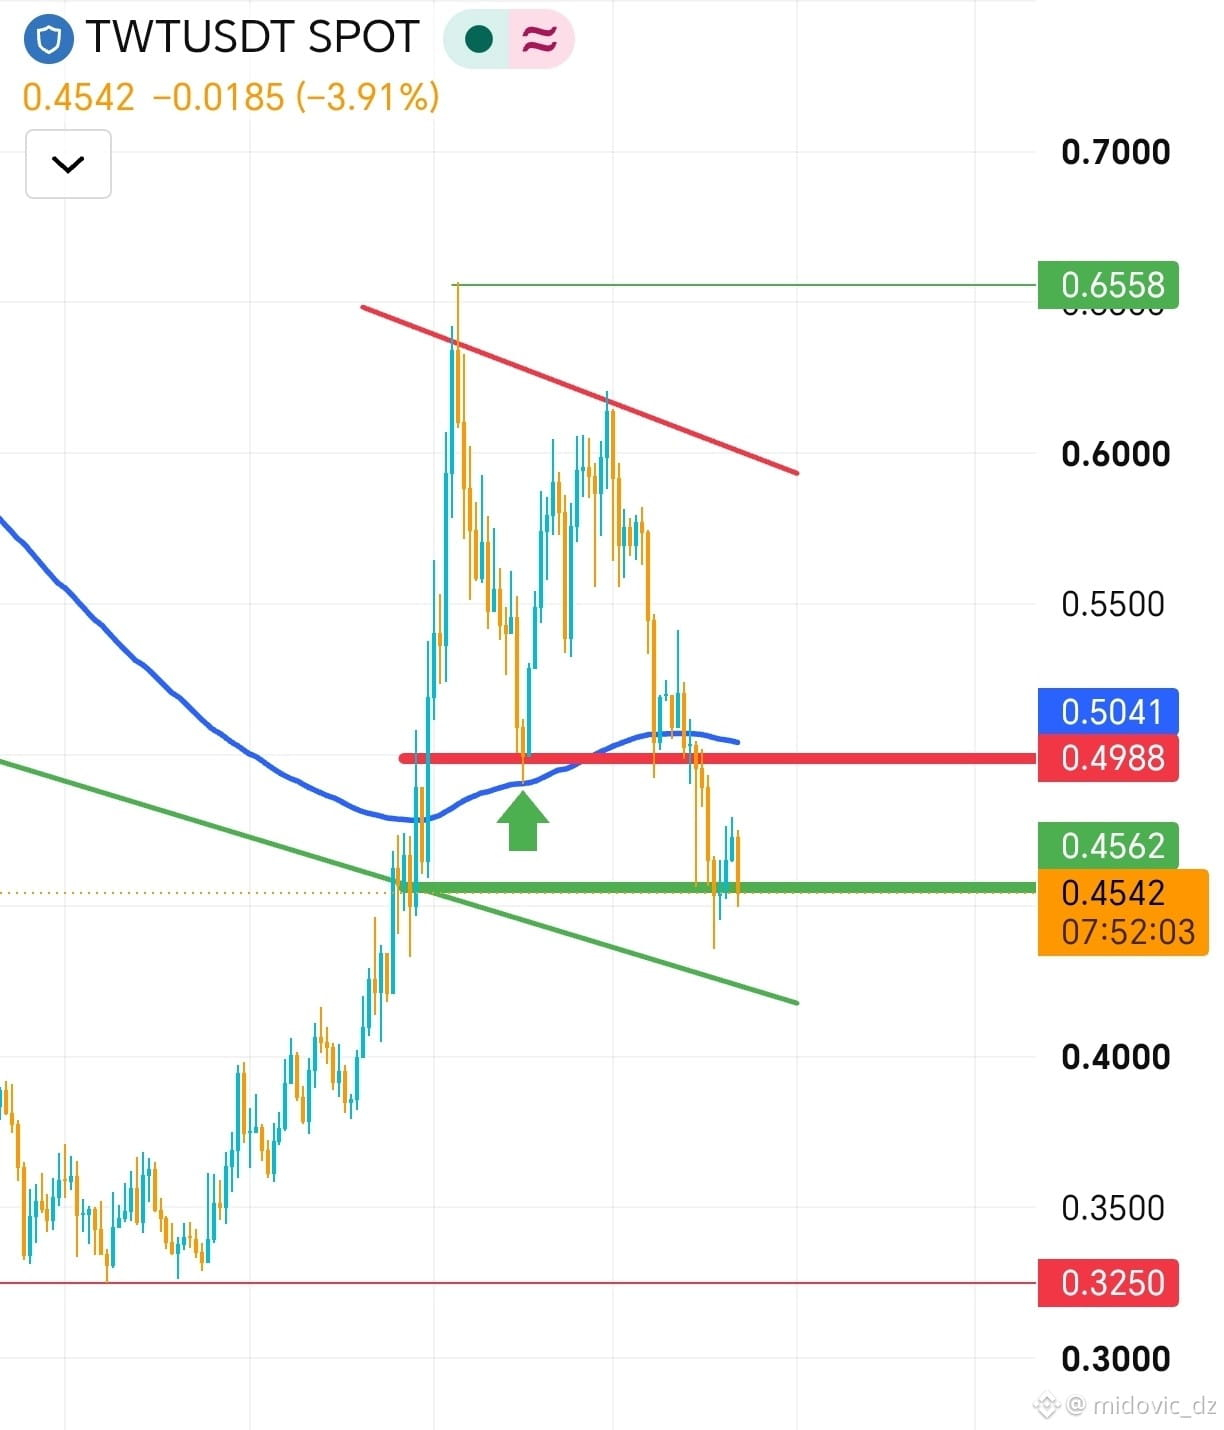
The coin is currently testing the main support zone and the lower boundary of the channel/trend at 0.4562 and 0.4542.
⚡ Expected price action scenario
Current support zone: Holding above 0.4562 signals a strong rebound.
First resistance: A move toward breaking above the moving average and the 0.4988–0.5041 level.
Main target: After breaking through the first resistance, a direct move to break above the previous high and target 0.6558.

🚀 Go To The Moon ⚡🔥
Chart notes:

The current movement looks like a bounce off the lower boundary of the corrective descending pattern, suggesting a bullish rebound if the price holds the 0.4542 zone.
Log in to explore more content
Join global crypto users on Binance Square
⚡️ Get latest and useful information about crypto.
💬 Trusted by the world’s largest crypto exchange.
👍 Discover real insights from verified creators.
Email / Phone number
Sitemap
Cookie Preferences
Platform T&Cs