
Shin-obi
409 Posts

Shin-obi
Report
Block User
👾

LSK Holder
High-Frequency Trader
5.2 Years
0 Following
68 Followers
219 Liked
Posts
All
Quotes
PINNED
·
--
Hey mates 👋
I’m not here to drop technical analysis or push any bias.The goal is simple to build a solid day trading community where we can openly share strategies, ideas, and real market thoughts.
Let’s learn, adapt, and grow together #trading #TradingCommunity
Hey mates 👋
I’m not here to drop technical analysis or push any bias.The goal is simple to build a solid day trading community where we can openly share strategies, ideas, and real market thoughts.
Let’s learn, adapt, and grow together #trading #TradingCommunity
I’m not here to drop technical analysis or push any bias.The goal is simple to build a solid day trading community where we can openly share strategies, ideas, and real market thoughts.
Let’s learn, adapt, and grow together #trading #TradingCommunity
1
62
·
--
What’s your read on $DOS right now? 👀
{future}(DOSUSDT)
What’s your read on $DOS right now? 👀
🔥 Accumulation happening
🐋 Whales playing games
🪤 Another trap loading
🍿 Just watching the chaos
21 hr(s) left
64
·
--
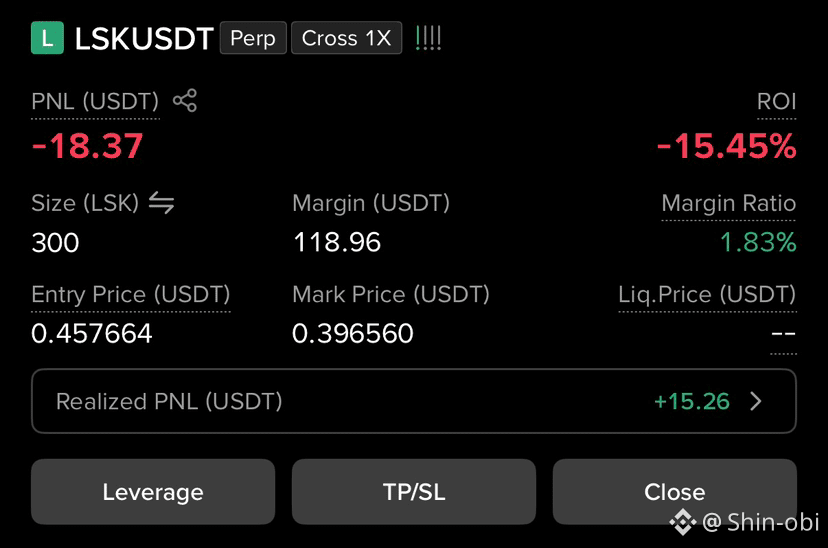
Been holding this $LSK long for a few days mostly out of curiosity 😂
Position is sitting around -$18 unrealized while realized PNL is already +$15 largely from the extreme negative funding
Shorts have been paying heavily just to maintain their positions
This doesn’t mean everyone should go long
I’m genuinely curious how long shorts can keep paying these funding rates and stay alive 😭
Been holding this $LSK long for a few days mostly out of curiosity 😂
Position is sitting around -$18 unrealized while realized PNL is already +$15 largely from the extreme negative funding
Shorts have been paying heavily just to maintain their positions
This doesn’t mean everyone should go long
I’m genuinely curious how long shorts can keep paying these funding rates and stay alive 😭
Position is sitting around -$18 unrealized while realized PNL is already +$15 largely from the extreme negative funding
Shorts have been paying heavily just to maintain their positions
This doesn’t mean everyone should go long
I’m genuinely curious how long shorts can keep paying these funding rates and stay alive 😭
386
·
--
$LSK Bearish trend + leverage flush + oversold momentum + increasingly squeeze-friendly derivatives conditions — but no confirmed reversal yet.
The $0.33–$0.37 area is the key zone. I’d pay much more attention to what price, OI and taker flow do there than to the negative funding rate alone
{future}(LSKUSDT)
$LSK Bearish trend + leverage flush + oversold momentum + increasingly squeeze-friendly derivatives conditions — but no confirmed reversal yet.
The $0.33–$0.37 area is the key zone. I’d pay much more attention to what price, OI and taker flow do there than to the negative funding rate alone
The $0.33–$0.37 area is the key zone. I’d pay much more attention to what price, OI and taker flow do there than to the negative funding rate alone
306
·
--
$LSK Market is getting interesting 😂
Huge liquidity is sitting around 0.34 and below which could become a target if the flush starts
Most traders seem to be leaning short now so a short squeeze is also possible before the real move
I’m still carrying my position from 0.47 💀
Either we flush to 0.34 or below or the market decides to squeeze every short first🦧
$LSK Market is getting interesting 😂
Huge liquidity is sitting around 0.34 and below which could become a target if the flush starts
Most traders seem to be leaning short now so a short squeeze is also possible before the real move
I’m still carrying my position from 0.47 💀
Either we flush to 0.34 or below or the market decides to squeeze every short first🦧
Huge liquidity is sitting around 0.34 and below which could become a target if the flush starts
Most traders seem to be leaning short now so a short squeeze is also possible before the real move
I’m still carrying my position from 0.47 💀
Either we flush to 0.34 or below or the market decides to squeeze every short first🦧
2
399
·
--
$LSK Update
LSK is showing serious weakness after the news driven spike
Price crashed toward $0.48607 with aggressive taker selling dominating the order flow
Open Interest dropped from 43.5M to 41.7M as leverage got flushed
Funding is deeply negative at -0.2331% while Basis sits at -0.012
Top Trader Account ratio climbed from 1.49 to 1.74 showing dip buying
But the Position ratio remains bearish at 0.93
This is an interesting divergenceRetail accounts are buying the dip while larger positions remain short biased
The key question is whether sellers can continue pushing price lower or whether crowded shorts become fuel for a squeeze
Watch OI and taker volume closelyA fresh OI increase with aggressive buying could change the structureUntil then LSK remains highly volatile
Patience over FOMO
#LSK #Crypto #BinanceSquare
{future}(LSKUSDT)
$LSK Update
LSK is showing serious weakness after the news driven spike
Price crashed toward $0.48607 with aggressive taker selling dominating the order flow
Open Interest dropped from 43.5M to 41.7M as leverage got flushed
Funding is deeply negative at -0.2331% while Basis sits at -0.012
Top Trader Account ratio climbed from 1.49 to 1.74 showing dip buying
But the Position ratio remains bearish at 0.93
This is an interesting divergenceRetail accounts are buying the dip while larger positions remain short biased
The key question is whether sellers can continue pushing price lower or whether crowded shorts become fuel for a squeeze
Watch OI and taker volume closelyA fresh OI increase with aggressive buying could change the structureUntil then LSK remains highly volatile
Patience over FOMO
#LSK #Crypto #BinanceSquare
LSK is showing serious weakness after the news driven spike
Price crashed toward $0.48607 with aggressive taker selling dominating the order flow
Open Interest dropped from 43.5M to 41.7M as leverage got flushed
Funding is deeply negative at -0.2331% while Basis sits at -0.012
Top Trader Account ratio climbed from 1.49 to 1.74 showing dip buying
But the Position ratio remains bearish at 0.93
This is an interesting divergenceRetail accounts are buying the dip while larger positions remain short biased
The key question is whether sellers can continue pushing price lower or whether crowded shorts become fuel for a squeeze
Watch OI and taker volume closelyA fresh OI increase with aggressive buying could change the structureUntil then LSK remains highly volatile
Patience over FOMO
#LSK #Crypto #BinanceSquare
339
·
--
$LSK ⚠️ Watch out for the dump. This lady is about to dump harder than my ex did. 💀
$LSK ⚠️ Watch out for the dump. This lady is about to dump harder than my ex did. 💀
338
·
--
This is the part that is frustrating me
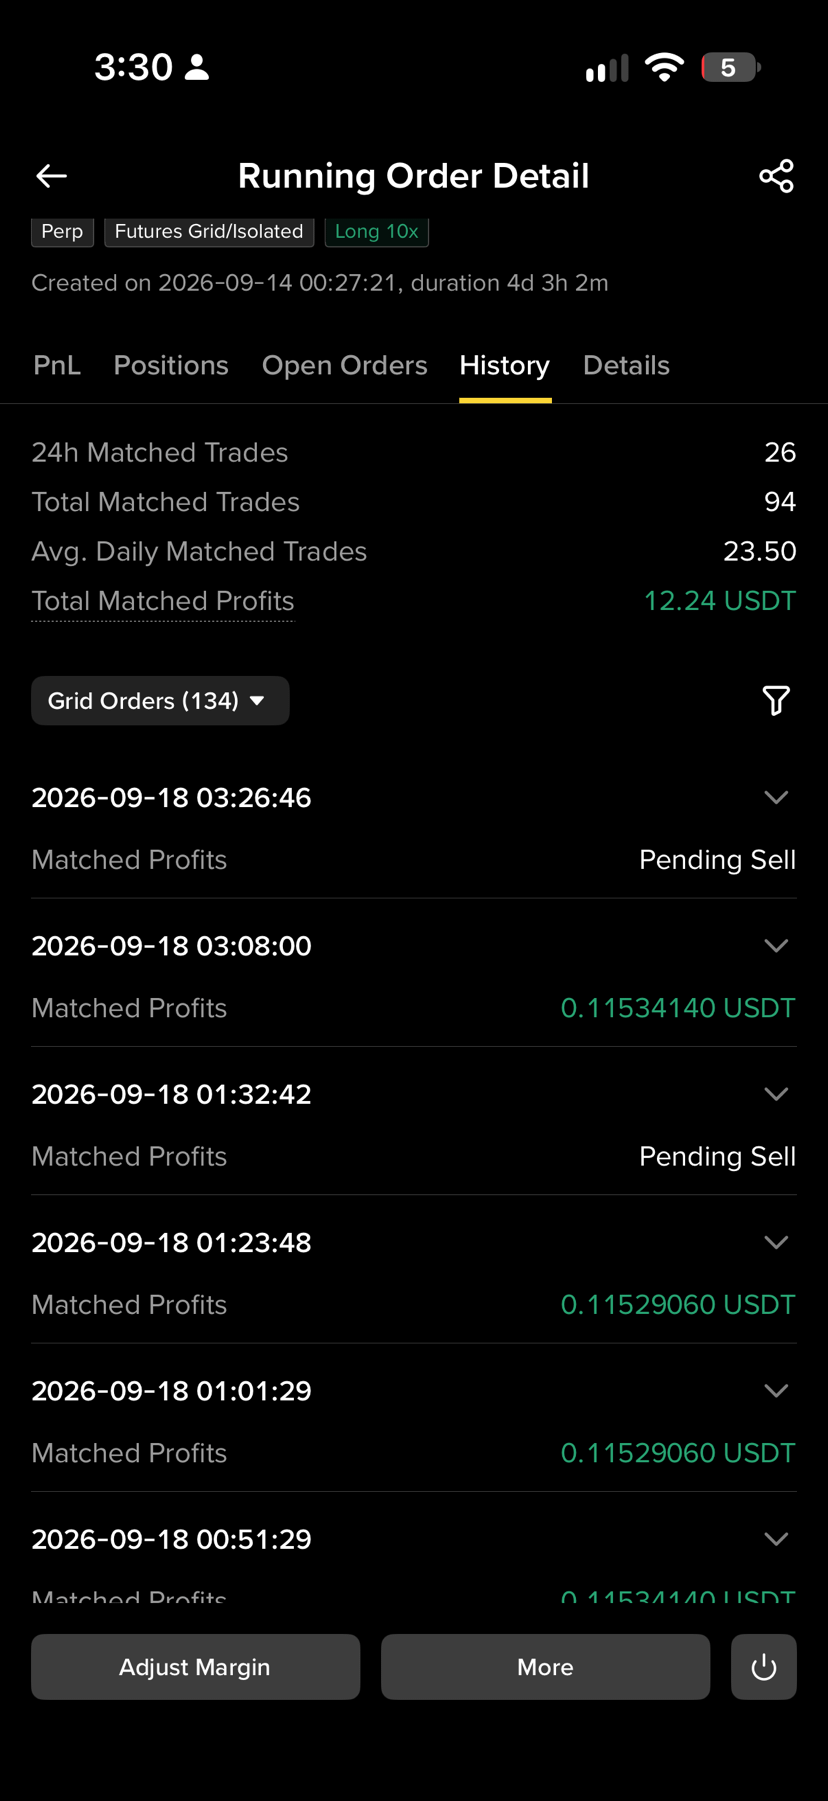
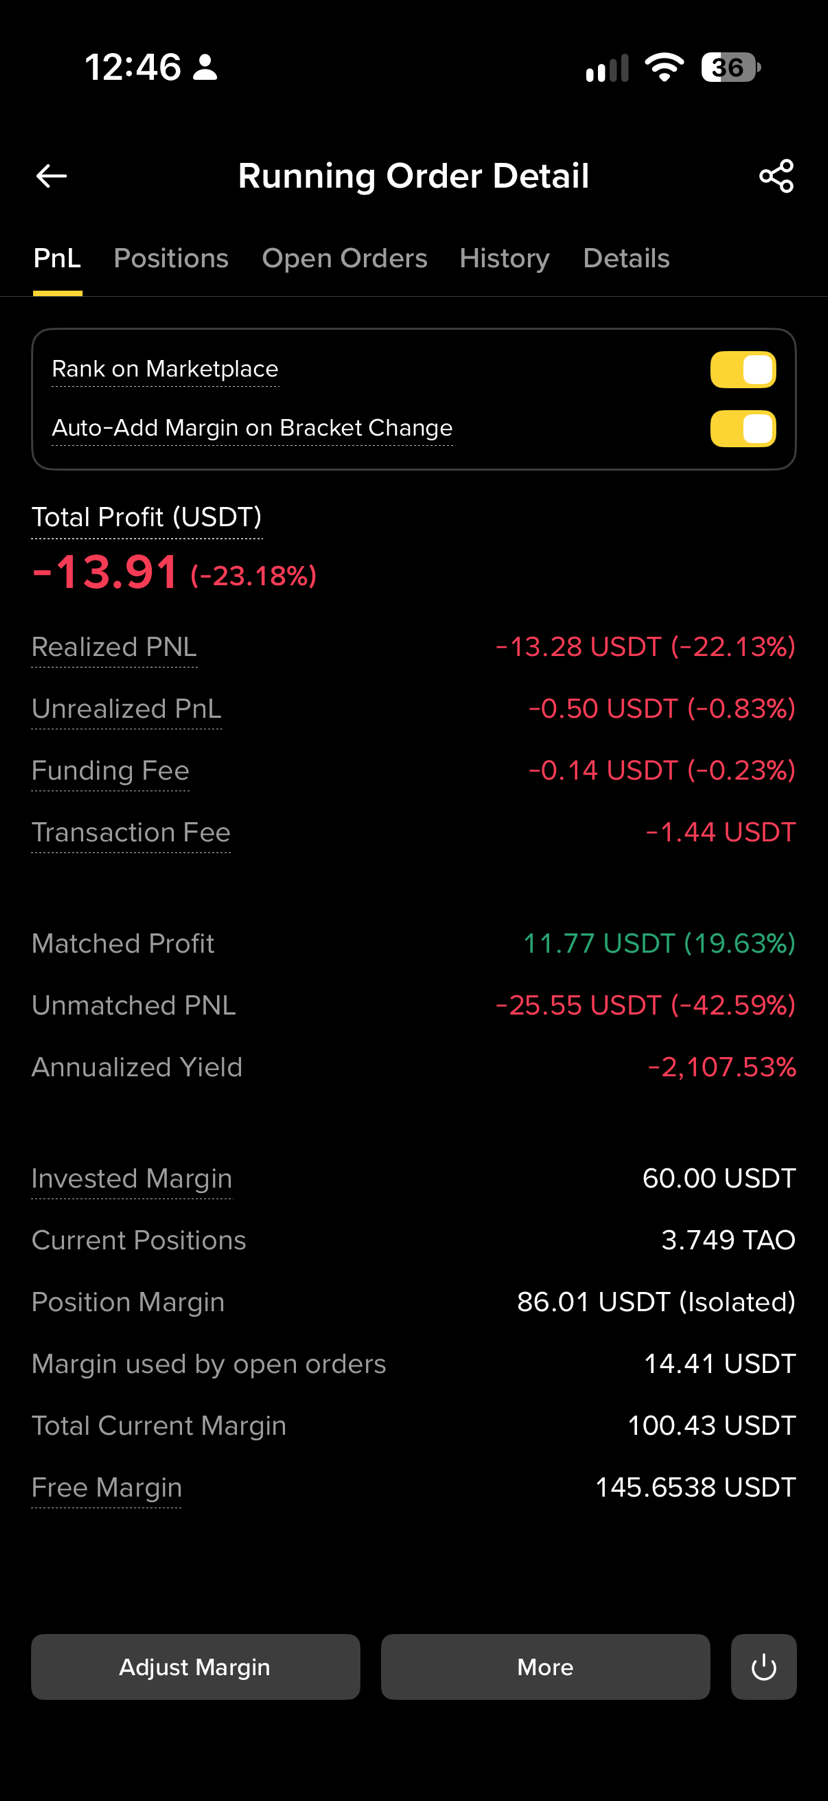
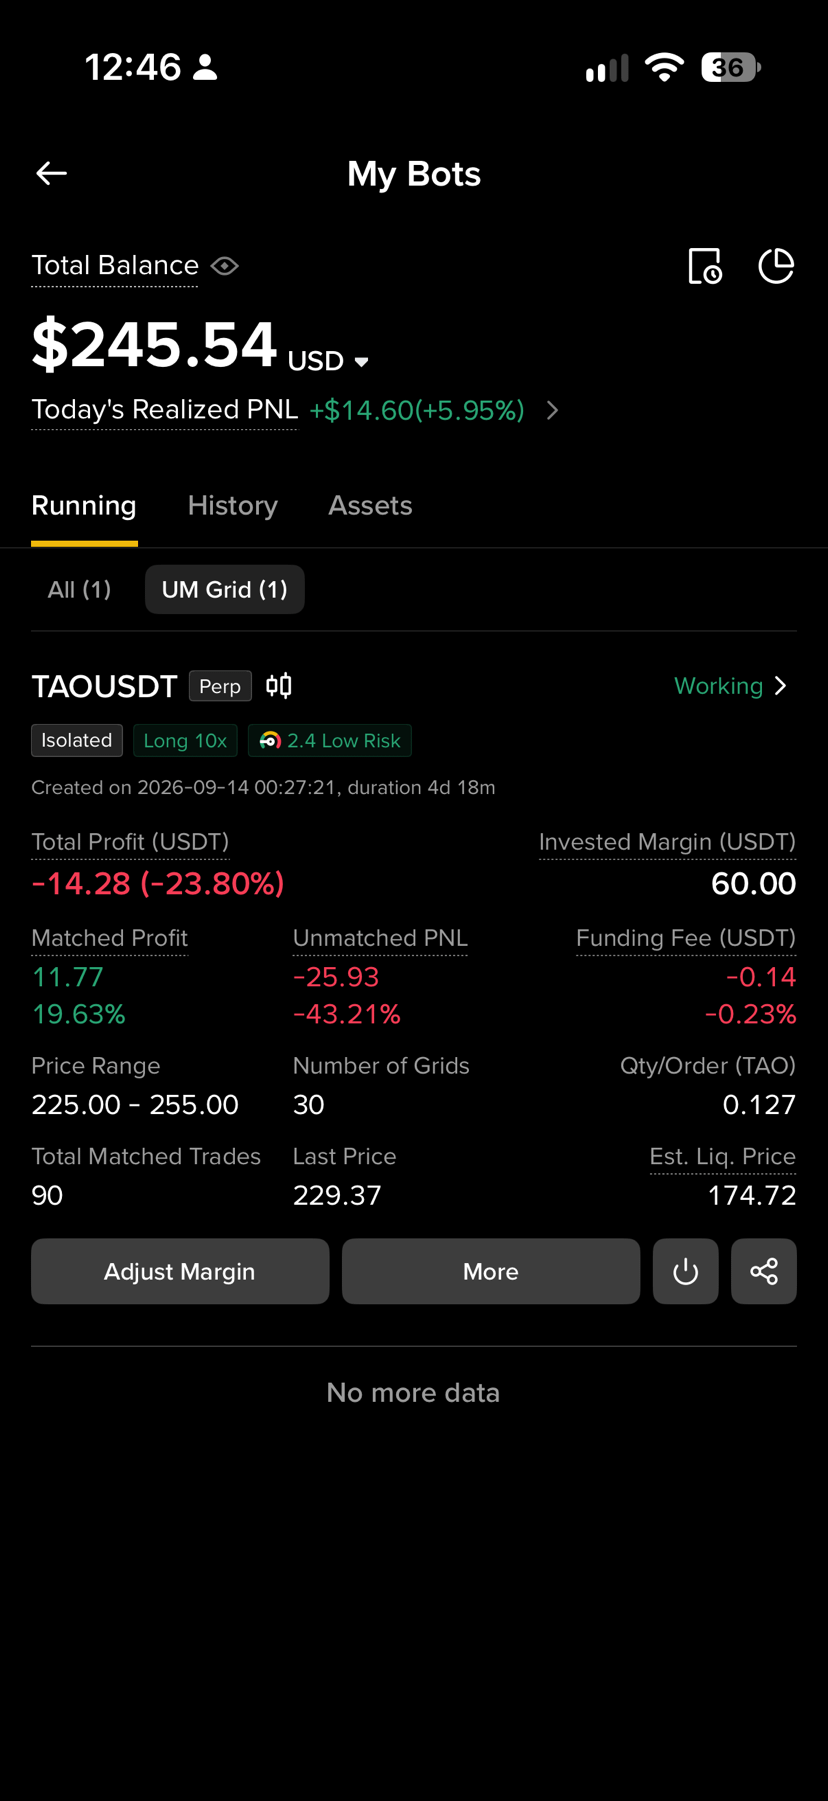
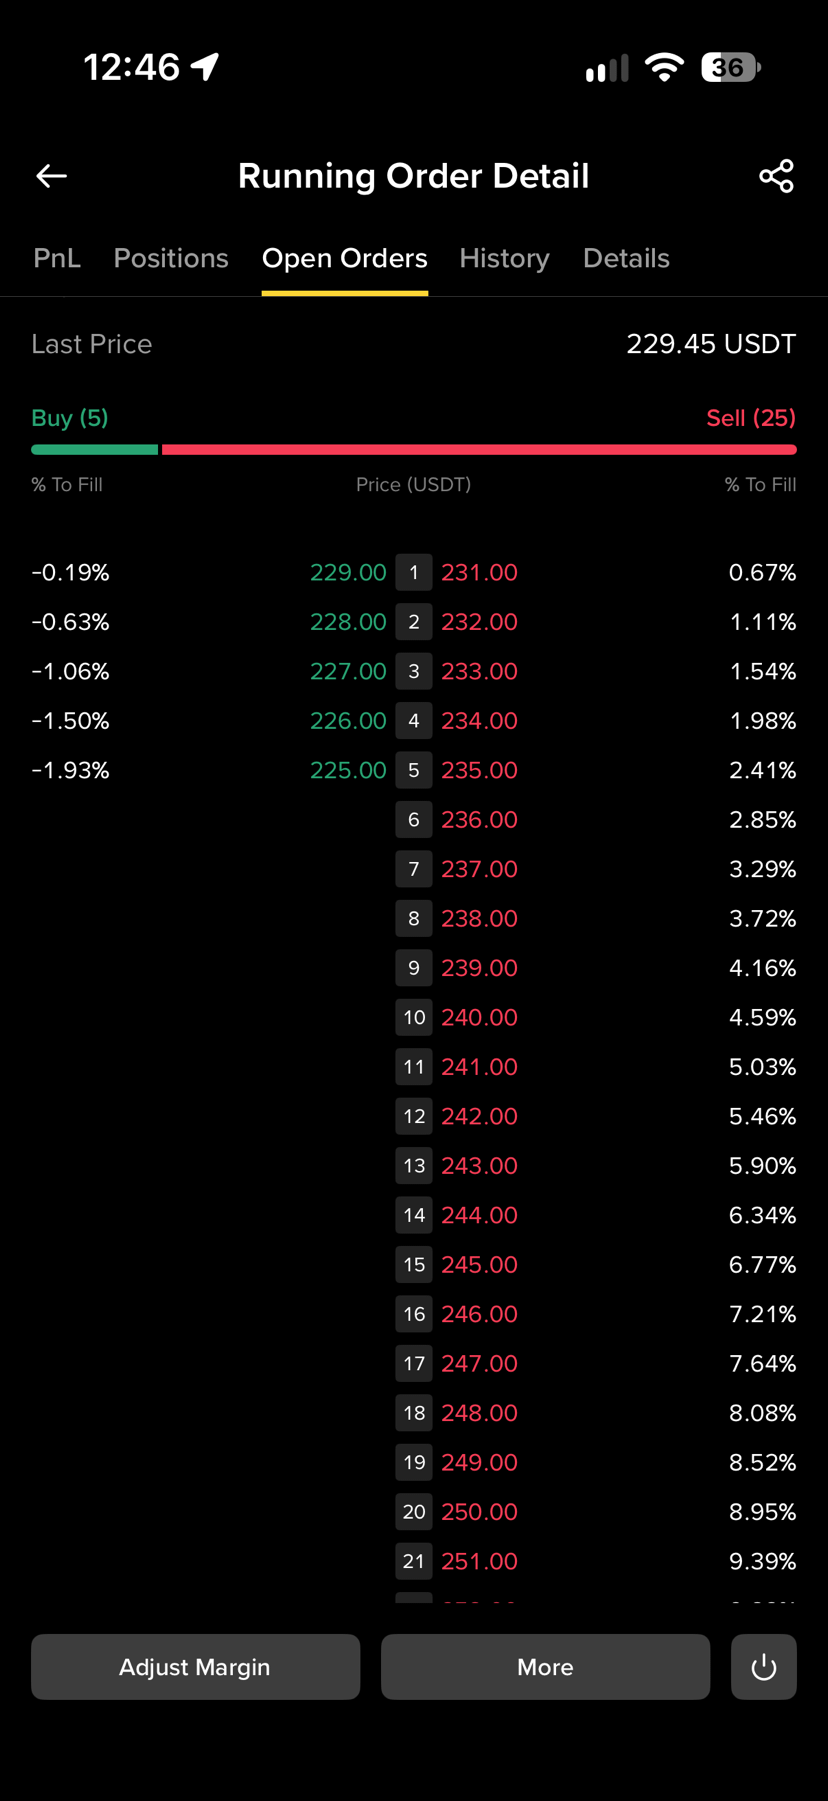
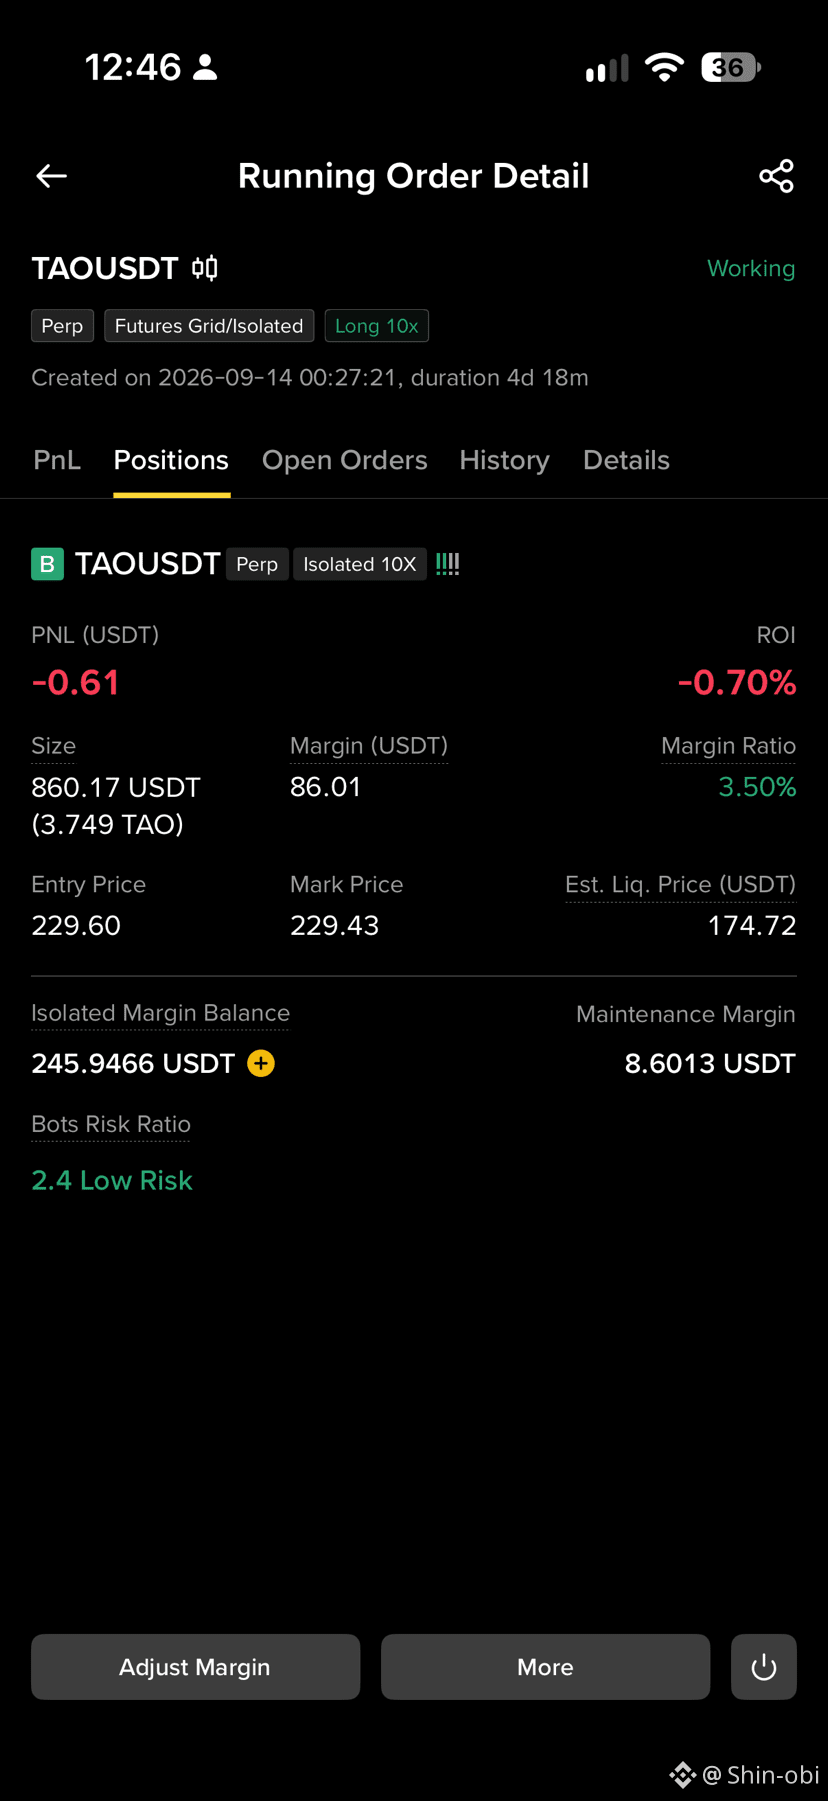
I put $260 into a Futures Grid around TAO $237 The price dropped and because I enabled Fill All Orders the bot kept accumulating TAO while also buying and selling through the dips After around 100 grid trades I had made roughly $12 in Matched Grid Profit and my position had grown to around 3.7 TAO with the displayed entry around $229 Now imagine TAO comes back to exactly where I started the bot $237 This is where I expected the strategy to make sense
If I had simply accumulated those 3.7 TAO around $229 then the move from $229 to $237 is roughly another $28 in position profit
And I already made around $12 from the grid activitySo naturally I started thinking that the strategy should have created meaningful additional valueBut the actual bot equity is starting from around $247 after the drawdown and the accounting makes the whole thing feel very differentThat’s what frustrated meI’m not asking whether the Grid made $12 It did
I’m asking whether all those buys and sells actually created more value than simply accumulating the position during the dip
Because if I start with $260 at $237 and eventually TAO comes back to the exact same $237 then I want to know what the bot actually created for me after all those trades fees and inventory changes Otherwise what exactly was the point of doing 100 trades
That’s the experiment I’m trying to understand
Not whether the bot has more features
Just whether it actually makes more money than doing the simple thing 😂
This is the part that is frustrating me
I put $260 into a Futures Grid around TAO $237 The price dropped and because I enabled Fill All Orders the bot kept accumulating TAO while also buying and selling through the dips After around 100 grid trades I had made roughly $12 in Matched Grid Profit and my position had grown to around 3.7 TAO with the displayed entry around $229 Now imagine TAO comes back to exactly where I started the bot $237 This is where I expected the strategy to make sense
If I had simply accumulated those 3.7 TAO around $229 then the move from $229 to $237 is roughly another $28 in position profit
And I already made around $12 from the grid activitySo naturally I started thinking that the strategy should have created meaningful additional valueBut the actual bot equity is starting from around $247 after the drawdown and the accounting makes the whole thing feel very differentThat’s what frustrated meI’m not asking whether the Grid made $12 It did
I’m asking whether all those buys and sells actually created more value than simply accumulating the position during the dip
Because if I start with $260 at $237 and eventually TAO comes back to the exact same $237 then I want to know what the bot actually created for me after all those trades fees and inventory changes Otherwise what exactly was the point of doing 100 trades
That’s the experiment I’m trying to understand
Not whether the bot has more features
Just whether it actually makes more money than doing the simple thing 😂
I put $260 into a Futures Grid around TAO $237 The price dropped and because I enabled Fill All Orders the bot kept accumulating TAO while also buying and selling through the dips After around 100 grid trades I had made roughly $12 in Matched Grid Profit and my position had grown to around 3.7 TAO with the displayed entry around $229 Now imagine TAO comes back to exactly where I started the bot $237 This is where I expected the strategy to make sense
If I had simply accumulated those 3.7 TAO around $229 then the move from $229 to $237 is roughly another $28 in position profit
And I already made around $12 from the grid activitySo naturally I started thinking that the strategy should have created meaningful additional valueBut the actual bot equity is starting from around $247 after the drawdown and the accounting makes the whole thing feel very differentThat’s what frustrated meI’m not asking whether the Grid made $12 It did
I’m asking whether all those buys and sells actually created more value than simply accumulating the position during the dip
Because if I start with $260 at $237 and eventually TAO comes back to the exact same $237 then I want to know what the bot actually created for me after all those trades fees and inventory changes Otherwise what exactly was the point of doing 100 trades
That’s the experiment I’m trying to understand
Not whether the bot has more features
Just whether it actually makes more money than doing the simple thing 😂
2
3
4.8k
·
--
I spent the last few days testing Binance Futures Grid because I wanted to build a second desk for myself
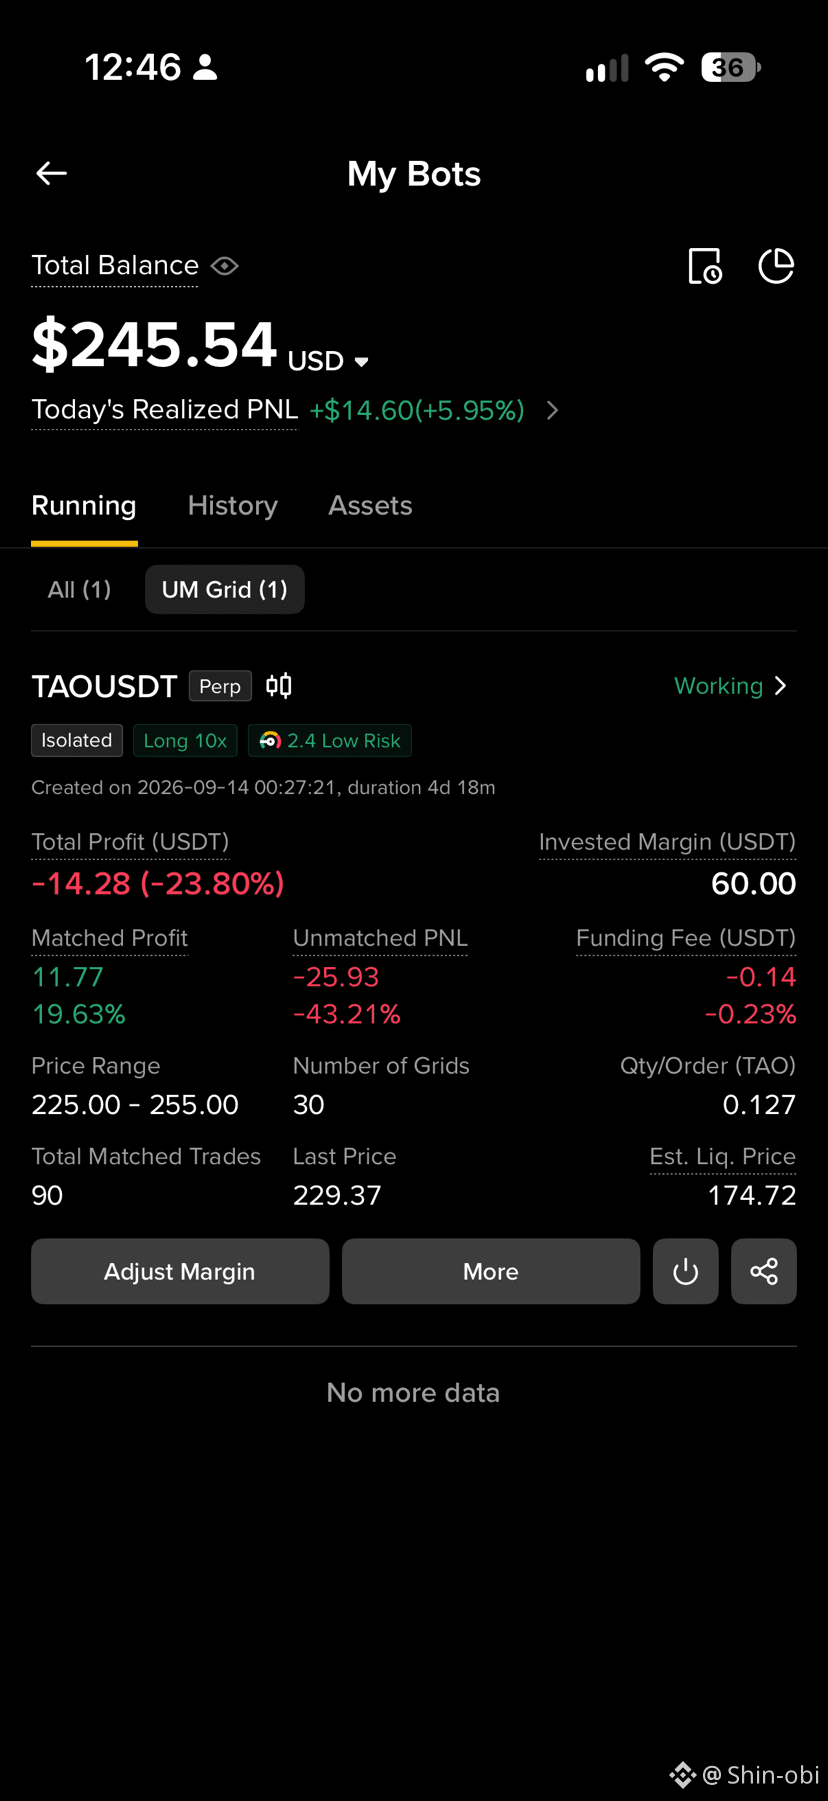
The idea was simple I already trade manually so I wanted something running in the background that could capture small moves while I focus on my main tradesI put $260 into a TAO Futures Grid and enabled Fill All Orders because I wanted the bot to keep enough TAO inventory to sell if price moved upThe bot did what it was supposed to do
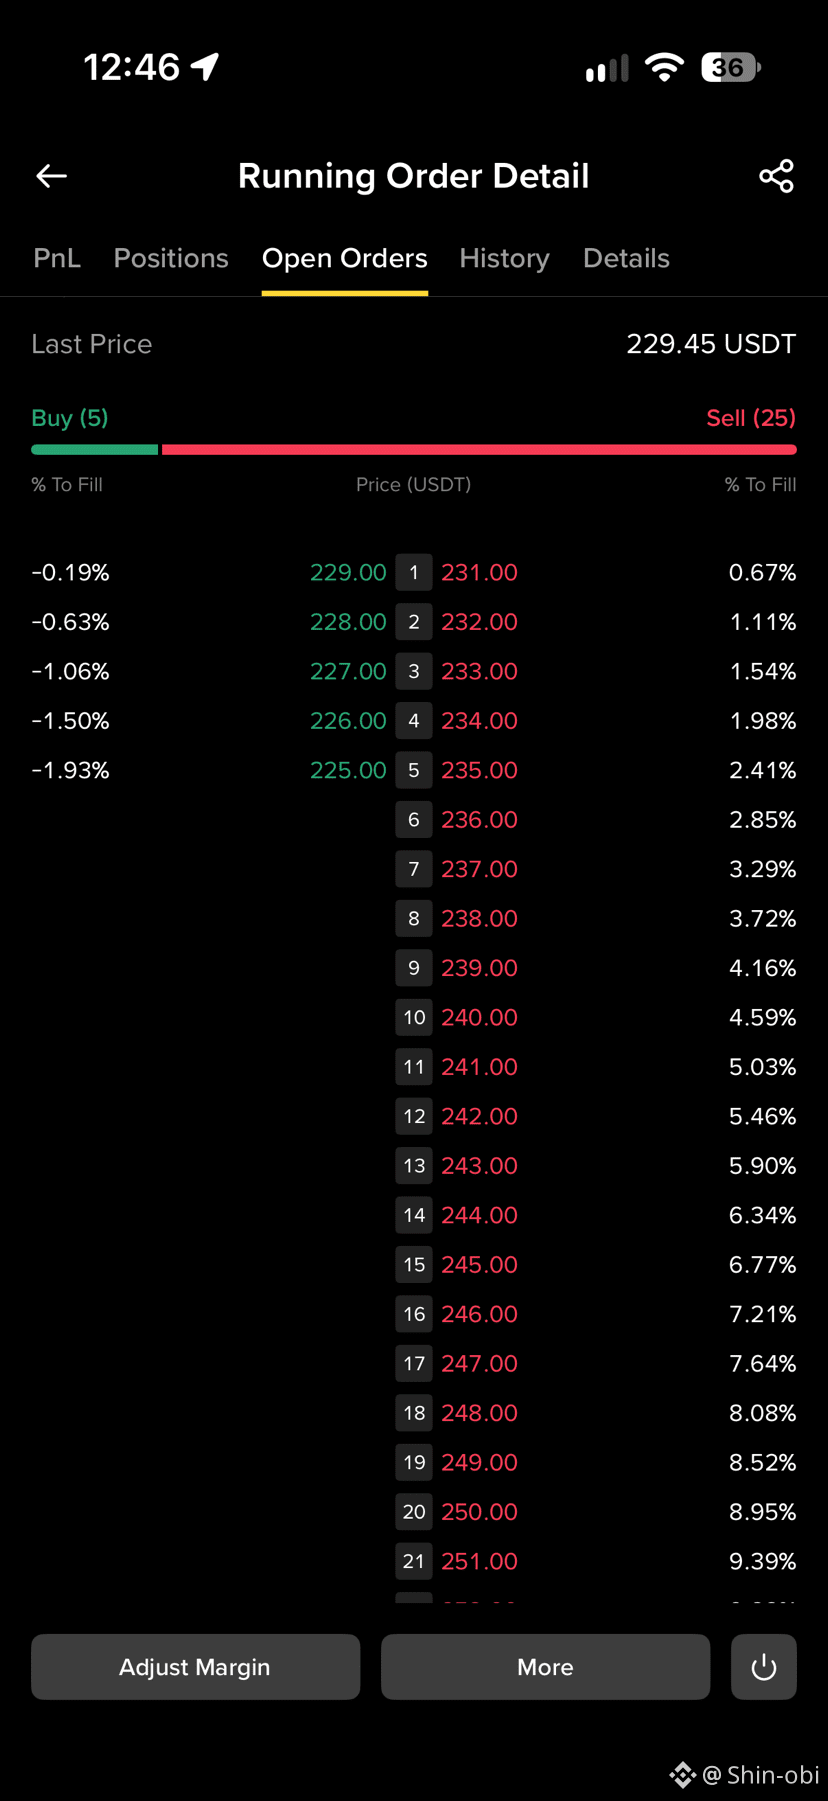
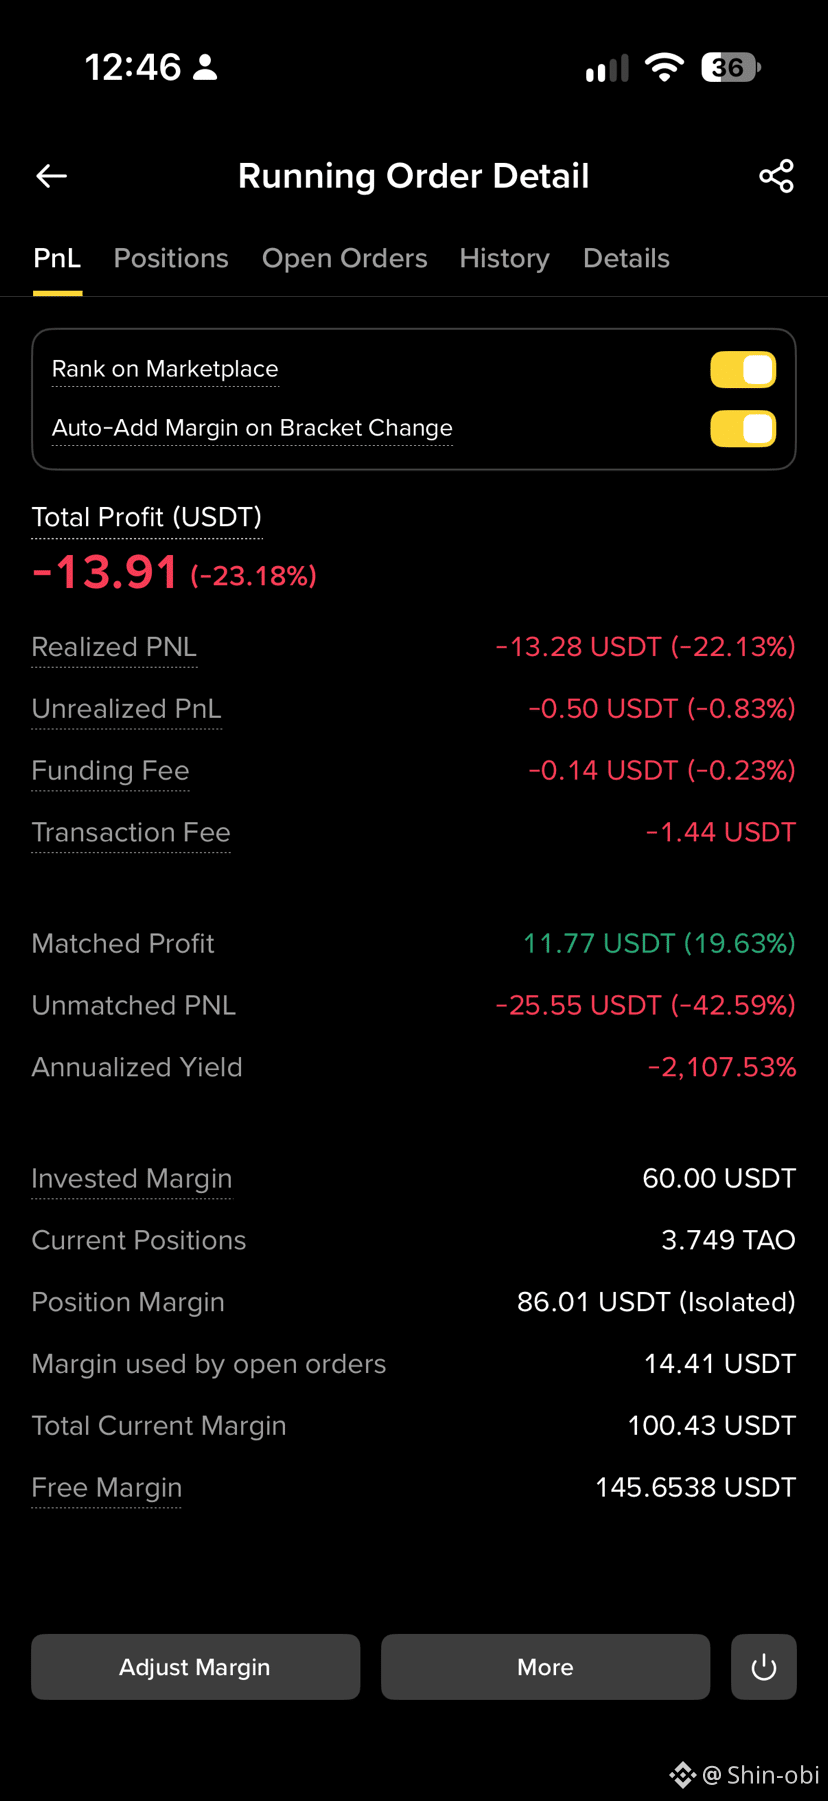
Around 100 grid trades were completed and the bot made roughly $12 in Matched Grid ProfitSounds good rightBut then I started looking deeperThe account went from around $260 to about $247 because the bot was also carrying open inventory and showing around $25 of Unmatched PNLThen I started asking the obvious questionIf the bot accumulated around 3.6 to 3.7 TAO while price dropped and the position average moved toward $229 then when TAO comes back toward $237 where exactly is the benefit from all those grid tradesAfter going back and forth with Binance support for what felt like forever I finally understood the important partThat $12 grid profit is realBut it does not automatically mean I made $12 more than I would have made by simply accumulating and holding the TAO
In a sideways market the grid can make sense because it keeps buying low and selling high
But if the market drops and then makes a strong recovery holding the accumulated position can sometimes capture more because you still have the full position And that honestly changed what I was trying to build
I wasn’t looking for a bot that just creates 100 transactions and shows me a nice Matched Profit number I wanted a second desk that actually adds value compared with simply holding a futures position So now the real question is not Did the Grid make money It did The real question is Did it make more money than simply holding the same capital That is what I need to figure out next And honestly after all those buttons features settings and calculations I am sitting here thinkingMaybe I was just looking for a simple answer to a very complicated button 😂
I spent the last few days testing Binance Futures Grid because I wanted to build a second desk for myself
The idea was simple I already trade manually so I wanted something running in the background that could capture small moves while I focus on my main tradesI put $260 into a TAO Futures Grid and enabled Fill All Orders because I wanted the bot to keep enough TAO inventory to sell if price moved upThe bot did what it was supposed to do
Around 100 grid trades were completed and the bot made roughly $12 in Matched Grid ProfitSounds good rightBut then I started looking deeperThe account went from around $260 to about $247 because the bot was also carrying open inventory and showing around $25 of Unmatched PNLThen I started asking the obvious questionIf the bot accumulated around 3.6 to 3.7 TAO while price dropped and the position average moved toward $229 then when TAO comes back toward $237 where exactly is the benefit from all those grid tradesAfter going back and forth with Binance support for what felt like forever I finally understood the important partThat $12 grid profit is realBut it does not automatically mean I made $12 more than I would have made by simply accumulating and holding the TAO
In a sideways market the grid can make sense because it keeps buying low and selling high
But if the market drops and then makes a strong recovery holding the accumulated position can sometimes capture more because you still have the full position And that honestly changed what I was trying to build
I wasn’t looking for a bot that just creates 100 transactions and shows me a nice Matched Profit number I wanted a second desk that actually adds value compared with simply holding a futures position So now the real question is not Did the Grid make money It did The real question is Did it make more money than simply holding the same capital That is what I need to figure out next And honestly after all those buttons features settings and calculations I am sitting here thinkingMaybe I was just looking for a simple answer to a very complicated button 😂
The idea was simple I already trade manually so I wanted something running in the background that could capture small moves while I focus on my main tradesI put $260 into a TAO Futures Grid and enabled Fill All Orders because I wanted the bot to keep enough TAO inventory to sell if price moved upThe bot did what it was supposed to do
Around 100 grid trades were completed and the bot made roughly $12 in Matched Grid ProfitSounds good rightBut then I started looking deeperThe account went from around $260 to about $247 because the bot was also carrying open inventory and showing around $25 of Unmatched PNLThen I started asking the obvious questionIf the bot accumulated around 3.6 to 3.7 TAO while price dropped and the position average moved toward $229 then when TAO comes back toward $237 where exactly is the benefit from all those grid tradesAfter going back and forth with Binance support for what felt like forever I finally understood the important partThat $12 grid profit is realBut it does not automatically mean I made $12 more than I would have made by simply accumulating and holding the TAO
In a sideways market the grid can make sense because it keeps buying low and selling high
But if the market drops and then makes a strong recovery holding the accumulated position can sometimes capture more because you still have the full position And that honestly changed what I was trying to build
I wasn’t looking for a bot that just creates 100 transactions and shows me a nice Matched Profit number I wanted a second desk that actually adds value compared with simply holding a futures position So now the real question is not Did the Grid make money It did The real question is Did it make more money than simply holding the same capital That is what I need to figure out next And honestly after all those buttons features settings and calculations I am sitting here thinkingMaybe I was just looking for a simple answer to a very complicated button 😂
1
6
4.7k
·
--
Verified
US import prices came in hot today. That adds inflation pressure and could keep yields and the dollar firm. BTC may stay volatile but the Fed decision is the real trigger tonight.
US import prices came in hot today. That adds inflation pressure and could keep yields and the dollar firm. BTC may stay volatile but the Fed decision is the real trigger tonight.
33
·
--
$LSK triggers a textbook Short Squeeze, Long! (↑ ↑ ↓).
Price is UP (↑): Surged vertically to $0.67096.
Open Interest is UP (↑):
Expanded aggressively to >50M contracts.
Funding Rate is DOWN (↓): Plunged to an extreme negative -0.0762%.
This exact configuration proves the market is aggressively shorting the token, but those shorts are trapped and being forced to cover, violently propelling the price upward.
This technical squeeze is backed by major structural catalysts. Lisk recently announced a strategic pivot from a Layer-2 blockchain to an enterprise stablecoin payments platform. Furthermore, the DAO approved a massive 100 million LSK token burn, permanently reducing the maximum supply from 400 million down to 300 million. With the legacy Lisk chain facing a hard shutdown on October 31, 2026, forcing a migration, this hard deadline and supply shock have collided to create explosive derivatives-driven price action. With whale positions net-short at 0.67 and trapped in a deeply negative funding regime, the coiled spring is unleashing. Read the pattern. Tradewith patience
$LSK triggers a textbook Short Squeeze, Long! (↑ ↑ ↓).
Price is UP (↑): Surged vertically to $0.67096.
Open Interest is UP (↑):
Expanded aggressively to >50M contracts.
Funding Rate is DOWN (↓): Plunged to an extreme negative -0.0762%.
This exact configuration proves the market is aggressively shorting the token, but those shorts are trapped and being forced to cover, violently propelling the price upward.
This technical squeeze is backed by major structural catalysts. Lisk recently announced a strategic pivot from a Layer-2 blockchain to an enterprise stablecoin payments platform. Furthermore, the DAO approved a massive 100 million LSK token burn, permanently reducing the maximum supply from 400 million down to 300 million. With the legacy Lisk chain facing a hard shutdown on October 31, 2026, forcing a migration, this hard deadline and supply shock have collided to create explosive derivatives-driven price action. With whale positions net-short at 0.67 and trapped in a deeply negative funding regime, the coiled spring is unleashing. Read the pattern. Tradewith patience
Price is UP (↑): Surged vertically to $0.67096.
Open Interest is UP (↑):
Expanded aggressively to >50M contracts.
Funding Rate is DOWN (↓): Plunged to an extreme negative -0.0762%.
This exact configuration proves the market is aggressively shorting the token, but those shorts are trapped and being forced to cover, violently propelling the price upward.
This technical squeeze is backed by major structural catalysts. Lisk recently announced a strategic pivot from a Layer-2 blockchain to an enterprise stablecoin payments platform. Furthermore, the DAO approved a massive 100 million LSK token burn, permanently reducing the maximum supply from 400 million down to 300 million. With the legacy Lisk chain facing a hard shutdown on October 31, 2026, forcing a migration, this hard deadline and supply shock have collided to create explosive derivatives-driven price action. With whale positions net-short at 0.67 and trapped in a deeply negative funding regime, the coiled spring is unleashing. Read the pattern. Tradewith patience
196
·
--
$LSK Don’t Marry Your Trade
One thing I want to remind every LSK trader today Don’t marry your trade. Trade your plan.
We have a lot of sitting ducks between $0.60 and $0.90. People who bought the pump and are now waiting just to break even.If price reaches those levels we could see serious selling pressure from holders looking to exit. That doesn’t mean it will happen but it’s something to watch.
The 100M Burn Reality
Yes Lisk is burning 100M LSK. That’s a real supply reduction from 400M to 300M once completed.But let’s do the math.
If the old supply was 400M and price was $0.10
Market cap = $40M
After burning 100M
300M supply × $0.10 = $30M market cap
To reach $1 with 300M supply
Market cap needs to be $300M
That’s a 10x increase from the old $30M market cap.Burning tokens doesn’t automatically create that demand.
The new Lisk business model and actual money flowing into the ecosystem matter.
⚠️ Today Watch OI
If LSK pumps and OI rises aggressively it means more leverage is entering.If price starts falling while OI stays high or increases we could see liquidations.Don’t blindly long just because you see a green candle.And if you are already in a bad long tradeIt’s okay to exit.
It’s okay to reduce exposure.It’s okay to hedge if you understand the risk.
But don’t open an opposite trade blindly. A hedge is not a magic button that saves a bad position. It can also increase your losses if managed badly.
Use the volatility. Grab a bite. Don’t try to eat the whole market.Protect your capital first.
Trade smart 🐦
#LSK #Crypto #BinanceSquare #Trading
{future}(LSKUSDT)
$LSK Don’t Marry Your Trade
One thing I want to remind every LSK trader today Don’t marry your trade. Trade your plan.
We have a lot of sitting ducks between $0.60 and $0.90. People who bought the pump and are now waiting just to break even.If price reaches those levels we could see serious selling pressure from holders looking to exit. That doesn’t mean it will happen but it’s something to watch.
The 100M Burn Reality
Yes Lisk is burning 100M LSK. That’s a real supply reduction from 400M to 300M once completed.But let’s do the math.
If the old supply was 400M and price was $0.10
Market cap = $40M
After burning 100M
300M supply × $0.10 = $30M market cap
To reach $1 with 300M supply
Market cap needs to be $300M
That’s a 10x increase from the old $30M market cap.Burning tokens doesn’t automatically create that demand.
The new Lisk business model and actual money flowing into the ecosystem matter.
⚠️ Today Watch OI
If LSK pumps and OI rises aggressively it means more leverage is entering.If price starts falling while OI stays high or increases we could see liquidations.Don’t blindly long just because you see a green candle.And if you are already in a bad long tradeIt’s okay to exit.
It’s okay to reduce exposure.It’s okay to hedge if you understand the risk.
But don’t open an opposite trade blindly. A hedge is not a magic button that saves a bad position. It can also increase your losses if managed badly.
Use the volatility. Grab a bite. Don’t try to eat the whole market.Protect your capital first.
Trade smart 🐦
#LSK #Crypto #BinanceSquare #Trading
One thing I want to remind every LSK trader today Don’t marry your trade. Trade your plan.
We have a lot of sitting ducks between $0.60 and $0.90. People who bought the pump and are now waiting just to break even.If price reaches those levels we could see serious selling pressure from holders looking to exit. That doesn’t mean it will happen but it’s something to watch.
The 100M Burn Reality
Yes Lisk is burning 100M LSK. That’s a real supply reduction from 400M to 300M once completed.But let’s do the math.
If the old supply was 400M and price was $0.10
Market cap = $40M
After burning 100M
300M supply × $0.10 = $30M market cap
To reach $1 with 300M supply
Market cap needs to be $300M
That’s a 10x increase from the old $30M market cap.Burning tokens doesn’t automatically create that demand.
The new Lisk business model and actual money flowing into the ecosystem matter.
⚠️ Today Watch OI
If LSK pumps and OI rises aggressively it means more leverage is entering.If price starts falling while OI stays high or increases we could see liquidations.Don’t blindly long just because you see a green candle.And if you are already in a bad long tradeIt’s okay to exit.
It’s okay to reduce exposure.It’s okay to hedge if you understand the risk.
But don’t open an opposite trade blindly. A hedge is not a magic button that saves a bad position. It can also increase your losses if managed badly.
Use the volatility. Grab a bite. Don’t try to eat the whole market.Protect your capital first.
Trade smart 🐦
#LSK #Crypto #BinanceSquare #Trading
190
·
--
US RETAIL SALES TODAY!
6:00 PM IST 🇺🇸
Retail Sales + Import Prices are dropping today. BTC volatility could pick up as traders watch the data ahead of the Fed decision.
Stay alert. 📊
#newscrypto #Crypto #RetailSales
US RETAIL SALES TODAY!
6:00 PM IST 🇺🇸
Retail Sales + Import Prices are dropping today. BTC volatility could pick up as traders watch the data ahead of the Fed decision.
Stay alert. 📊
#newscrypto #Crypto #RetailSales
6:00 PM IST 🇺🇸
Retail Sales + Import Prices are dropping today. BTC volatility could pick up as traders watch the data ahead of the Fed decision.
Stay alert. 📊
#newscrypto #Crypto #RetailSales
61
·
--
U.S. Debt + AI Boom: The Risk Nobody Is Watching?I’ve been looking at the U.S. debt problem and the AI boom together. The connection is interesting.
The U.S. has over $40T in debt, while annual interest payments are above $1T. Treasury yields are also near levels not seen since 2007.The difference? Debt was much lower back then. Today, even a small rise in borrowing costs becomes expensive.
Now add AI.
💰 Hundreds of billions are flowing into data centers, GPUs, electricity and cloud infrastructure.
There is real demand and real revenue. But I keep asking:How much growth is organic, and how much is being pulled forward by financing?
A tech company invests in AI. AI spends on cloud services and GPUs. Infrastructure companies earn revenue and expand further. Money keeps moving inside the same ecosystem.
That does not mean the revenue is fake. It means the financing loop deserves attention.Now both the U.S. government and AI companies need enormous amounts of capital at the same time.And when everyone wants money, the price of money matters.Higher yields can pressure government finances, corporate borrowing, AI valuations, stocks, real estate and crypto liquidity.
I’m not saying the dollar is collapsing tomorrow. I’m not saying AI is a bubble.I’m saying this combination deserves attention:Massive debt + massive AI spending + expensive capital.Eventually, somebody has to pay the interest.
What do you think?
Is AI creating a real productivity revolution, or are we watching a financing cycle that could become dangerous if yields stay high?
#us #Ai #Macro #BTC #bond
U.S. Debt + AI Boom: The Risk Nobody Is Watching?I’ve been looking at the U.S. debt problem and the AI boom together. The connection is interesting.
The U.S. has over $40T in debt, while annual interest payments are above $1T. Treasury yields are also near levels not seen since 2007.The difference? Debt was much lower back then. Today, even a small rise in borrowing costs becomes expensive.
Now add AI.
💰 Hundreds of billions are flowing into data centers, GPUs, electricity and cloud infrastructure.
There is real demand and real revenue. But I keep asking:How much growth is organic, and how much is being pulled forward by financing?
A tech company invests in AI. AI spends on cloud services and GPUs. Infrastructure companies earn revenue and expand further. Money keeps moving inside the same ecosystem.
That does not mean the revenue is fake. It means the financing loop deserves attention.Now both the U.S. government and AI companies need enormous amounts of capital at the same time.And when everyone wants money, the price of money matters.Higher yields can pressure government finances, corporate borrowing, AI valuations, stocks, real estate and crypto liquidity.
I’m not saying the dollar is collapsing tomorrow. I’m not saying AI is a bubble.I’m saying this combination deserves attention:Massive debt + massive AI spending + expensive capital.Eventually, somebody has to pay the interest.
What do you think?
Is AI creating a real productivity revolution, or are we watching a financing cycle that could become dangerous if yields stay high?
#us #Ai #Macro #BTC #bond
The U.S. has over $40T in debt, while annual interest payments are above $1T. Treasury yields are also near levels not seen since 2007.The difference? Debt was much lower back then. Today, even a small rise in borrowing costs becomes expensive.
Now add AI.
💰 Hundreds of billions are flowing into data centers, GPUs, electricity and cloud infrastructure.
There is real demand and real revenue. But I keep asking:How much growth is organic, and how much is being pulled forward by financing?
A tech company invests in AI. AI spends on cloud services and GPUs. Infrastructure companies earn revenue and expand further. Money keeps moving inside the same ecosystem.
That does not mean the revenue is fake. It means the financing loop deserves attention.Now both the U.S. government and AI companies need enormous amounts of capital at the same time.And when everyone wants money, the price of money matters.Higher yields can pressure government finances, corporate borrowing, AI valuations, stocks, real estate and crypto liquidity.
I’m not saying the dollar is collapsing tomorrow. I’m not saying AI is a bubble.I’m saying this combination deserves attention:Massive debt + massive AI spending + expensive capital.Eventually, somebody has to pay the interest.
What do you think?
Is AI creating a real productivity revolution, or are we watching a financing cycle that could become dangerous if yields stay high?
#us #Ai #Macro #BTC #bond
76
·
--
Verified
$LSK move was almost certainly a combination of a genuine corporate/ fundamental announcement and an extreme derivatives-driven short squeeze. There is also a credible, reported project-linked transfer of approximately 3.29 million LSK to Binance, but the wallet attribution is not independently confirmed.
We do not yet have enough verified data to say that Binance alone caused the pump or that the entire move was an insider operation.
{spot}(LSKUSDT)
$LSK move was almost certainly a combination of a genuine corporate/ fundamental announcement and an extreme derivatives-driven short squeeze. There is also a credible, reported project-linked transfer of approximately 3.29 million LSK to Binance, but the wallet attribution is not independently confirmed.
We do not yet have enough verified data to say that Binance alone caused the pump or that the entire move was an insider operation.
We do not yet have enough verified data to say that Binance alone caused the pump or that the entire move was an insider operation.
348
·
--
Verified
I’ve been watching $LSK closely because the price action is honestly confusing.
It pumped all the way to around $1.16, then completely reversed and dropped toward $0.42.At the same time, there’s a lot of talk saying Lisk is shutting down.But that headline is a little misleading.
Lisk isn’t simply disappearing. The legacy Lisk Layer-1 is being shut down on October 31, 2026, while the project is making a major pivot toward business finance and enterprise payments.And this is the part I think many traders are missing:
👉 The $LSK token itself isn’t simply going away.The token is moving forward on networks like Ethereum and Base, with a new focus on utility and loyalty within the project’s new direction.So then… why did it pump so hard?
One big factor is the proposed/approved 100M $LSK treasury burn.If 100M tokens are removed from a 400M supply, that’s a 25% reduction.
Then you have the other side of the trade.
A lot of traders saw “Lisk shutting down” and naturally started shorting.
When the burn narrative hit, those shorts suddenly had to buy back.
And that’s where things can get crazy.
Shorts get squeezed → price explodes → FOMO kicks in → late buyers enter → squeeze runs out of fuel → price crashes.That doesn’t automatically mean $LSK is bullish.It also doesn’t mean it’s dead.It means the market is trying to figure out what $LSK is actually worth after the entire project changes direction.
If you’re holding $LSK on an exchange, don’t panic just because you saw the word “shutdown.”
But if you’re holding/staking on the old Lisk chain, that’s a different situation. Check the official migration instructions and deadlines rather than waiting until the last minute.
Personally, I think the interesting part isn’t the pump.
It’s what happens after the hype disappears.Can this new business model actually create real demand for $LSK?Because a token burn can reduce supply but it can’t manufacture demand.That’s what I’ll be watching.
$LSK: dead coin, or one of the biggest pivots we’ve seen?
#LSK
I’ve been watching $LSK closely because the price action is honestly confusing.
It pumped all the way to around $1.16, then completely reversed and dropped toward $0.42.At the same time, there’s a lot of talk saying Lisk is shutting down.But that headline is a little misleading.
Lisk isn’t simply disappearing. The legacy Lisk Layer-1 is being shut down on October 31, 2026, while the project is making a major pivot toward business finance and enterprise payments.And this is the part I think many traders are missing:
👉 The $LSK token itself isn’t simply going away.The token is moving forward on networks like Ethereum and Base, with a new focus on utility and loyalty within the project’s new direction.So then… why did it pump so hard?
One big factor is the proposed/approved 100M $LSK treasury burn.If 100M tokens are removed from a 400M supply, that’s a 25% reduction.
Then you have the other side of the trade.
A lot of traders saw “Lisk shutting down” and naturally started shorting.
When the burn narrative hit, those shorts suddenly had to buy back.
And that’s where things can get crazy.
Shorts get squeezed → price explodes → FOMO kicks in → late buyers enter → squeeze runs out of fuel → price crashes.That doesn’t automatically mean $LSK is bullish.It also doesn’t mean it’s dead.It means the market is trying to figure out what $LSK is actually worth after the entire project changes direction.
If you’re holding $LSK on an exchange, don’t panic just because you saw the word “shutdown.”
But if you’re holding/staking on the old Lisk chain, that’s a different situation. Check the official migration instructions and deadlines rather than waiting until the last minute.
Personally, I think the interesting part isn’t the pump.
It’s what happens after the hype disappears.Can this new business model actually create real demand for $LSK?Because a token burn can reduce supply but it can’t manufacture demand.That’s what I’ll be watching.
$LSK: dead coin, or one of the biggest pivots we’ve seen?
#LSK
It pumped all the way to around $1.16, then completely reversed and dropped toward $0.42.At the same time, there’s a lot of talk saying Lisk is shutting down.But that headline is a little misleading.
Lisk isn’t simply disappearing. The legacy Lisk Layer-1 is being shut down on October 31, 2026, while the project is making a major pivot toward business finance and enterprise payments.And this is the part I think many traders are missing:
👉 The $LSK token itself isn’t simply going away.The token is moving forward on networks like Ethereum and Base, with a new focus on utility and loyalty within the project’s new direction.So then… why did it pump so hard?
One big factor is the proposed/approved 100M $LSK treasury burn.If 100M tokens are removed from a 400M supply, that’s a 25% reduction.
Then you have the other side of the trade.
A lot of traders saw “Lisk shutting down” and naturally started shorting.
When the burn narrative hit, those shorts suddenly had to buy back.
And that’s where things can get crazy.
Shorts get squeezed → price explodes → FOMO kicks in → late buyers enter → squeeze runs out of fuel → price crashes.That doesn’t automatically mean $LSK is bullish.It also doesn’t mean it’s dead.It means the market is trying to figure out what $LSK is actually worth after the entire project changes direction.
If you’re holding $LSK on an exchange, don’t panic just because you saw the word “shutdown.”
But if you’re holding/staking on the old Lisk chain, that’s a different situation. Check the official migration instructions and deadlines rather than waiting until the last minute.
Personally, I think the interesting part isn’t the pump.
It’s what happens after the hype disappears.Can this new business model actually create real demand for $LSK?Because a token burn can reduce supply but it can’t manufacture demand.That’s what I’ll be watching.
$LSK: dead coin, or one of the biggest pivots we’ve seen?
#LSK
581
·
--
$DOS liquidation data is looking pretty interesting right now 👀
Over the last 24 hours, around $97.8K in DOS liquidations have been recorded, and almost all of it is coming from longs roughly $90K longs vs $7.8K shorts. The imbalance is pretty clear.
Even looking at the shorter timeframes, the same thing is happening. Around $39.5K of longs were liquidated in both the 1H and 4H data, while short liquidations were basically negligible. On the 12H timeframe, we’re seeing about $44.2K in long liquidations vs $7.3K shorts.To me, the interesting part isn’t simply that liquidations are high. It’s that longs are getting flushed much harder than shorts. That can be a sign that leveraged longs are being cleared out and the market is getting less crowded.Now I’d mainly watch what happens next. If DOS starts stabilizing while OI comes down, followed by a strong reclaim with volume, that could become an interesting setup. If price keeps making lower lows, though, there’s no reason to rush into a long just because a lot of longs have already been liquidated.
Basically, let the liquidation flush happen first, then watch the price structure. If the sellers start running out of momentum, that’s where things could get interesting.
DOS is definitely on my watchlist right now 👀
#DOS #Binance #Altcoins #Liquidations #Trading
$DOS liquidation data is looking pretty interesting right now 👀
Over the last 24 hours, around $97.8K in DOS liquidations have been recorded, and almost all of it is coming from longs roughly $90K longs vs $7.8K shorts. The imbalance is pretty clear.
Even looking at the shorter timeframes, the same thing is happening. Around $39.5K of longs were liquidated in both the 1H and 4H data, while short liquidations were basically negligible. On the 12H timeframe, we’re seeing about $44.2K in long liquidations vs $7.3K shorts.To me, the interesting part isn’t simply that liquidations are high. It’s that longs are getting flushed much harder than shorts. That can be a sign that leveraged longs are being cleared out and the market is getting less crowded.Now I’d mainly watch what happens next. If DOS starts stabilizing while OI comes down, followed by a strong reclaim with volume, that could become an interesting setup. If price keeps making lower lows, though, there’s no reason to rush into a long just because a lot of longs have already been liquidated.
Basically, let the liquidation flush happen first, then watch the price structure. If the sellers start running out of momentum, that’s where things could get interesting.
DOS is definitely on my watchlist right now 👀
#DOS #Binance #Altcoins #Liquidations #Trading
Over the last 24 hours, around $97.8K in DOS liquidations have been recorded, and almost all of it is coming from longs roughly $90K longs vs $7.8K shorts. The imbalance is pretty clear.
Even looking at the shorter timeframes, the same thing is happening. Around $39.5K of longs were liquidated in both the 1H and 4H data, while short liquidations were basically negligible. On the 12H timeframe, we’re seeing about $44.2K in long liquidations vs $7.3K shorts.To me, the interesting part isn’t simply that liquidations are high. It’s that longs are getting flushed much harder than shorts. That can be a sign that leveraged longs are being cleared out and the market is getting less crowded.Now I’d mainly watch what happens next. If DOS starts stabilizing while OI comes down, followed by a strong reclaim with volume, that could become an interesting setup. If price keeps making lower lows, though, there’s no reason to rush into a long just because a lot of longs have already been liquidated.
Basically, let the liquidation flush happen first, then watch the price structure. If the sellers start running out of momentum, that’s where things could get interesting.
DOS is definitely on my watchlist right now 👀
#DOS #Binance #Altcoins #Liquidations #Trading
277
·
--
$CRDO I was digging into Credo’s earnings because the reaction honestly didn’t make sense at first.The headline numbers were actually strong.Revenue came in at $479M vs roughly $471–473M expected, so Credo beat revenue estimates by around 1–2%.Non-GAAP EPS was $1.20 vs $1.17 expected, around a 2.6% beat.Even Q2 guidance was strong. Credo guided for $525–535M revenue, with a $530M midpoint, above the roughly $520M analyst expectation.
So why the selloff?
I think the answer is expectations.Credo has been delivering massive growth, but the growth rate is starting to slow:
274% → 272% → 202% → 157% → 115% YoY revenue growth.115% growth is still insane. The problem is that the market may have already priced in another massive upside surprise.Previous quarters also had much bigger earnings surprises. This time, the company beat, but only by a small margin.So this doesn’t look like a case of “bad earnings.”It looks more like: the company delivered excellent numbers, but the market was expecting something even better.That’s also why I’m watching CRDOB closely. Its overnight −17% move could be pricing in a much more aggressive reaction than the actual Nasdaq market ultimately delivers.
The big question now is simple:
When Nasdaq opens, where does the actual CRDO price settle?
If CRDO opens significantly above CRDOB’s overnight price, the tokenized stock could have some serious catching up to do.Not financial advice. Just trying to understand what the market is actually pricing in.
$CRDO I was digging into Credo’s earnings because the reaction honestly didn’t make sense at first.The headline numbers were actually strong.Revenue came in at $479M vs roughly $471–473M expected, so Credo beat revenue estimates by around 1–2%.Non-GAAP EPS was $1.20 vs $1.17 expected, around a 2.6% beat.Even Q2 guidance was strong. Credo guided for $525–535M revenue, with a $530M midpoint, above the roughly $520M analyst expectation.
So why the selloff?
I think the answer is expectations.Credo has been delivering massive growth, but the growth rate is starting to slow:
274% → 272% → 202% → 157% → 115% YoY revenue growth.115% growth is still insane. The problem is that the market may have already priced in another massive upside surprise.Previous quarters also had much bigger earnings surprises. This time, the company beat, but only by a small margin.So this doesn’t look like a case of “bad earnings.”It looks more like: the company delivered excellent numbers, but the market was expecting something even better.That’s also why I’m watching CRDOB closely. Its overnight −17% move could be pricing in a much more aggressive reaction than the actual Nasdaq market ultimately delivers.
The big question now is simple:
When Nasdaq opens, where does the actual CRDO price settle?
If CRDO opens significantly above CRDOB’s overnight price, the tokenized stock could have some serious catching up to do.Not financial advice. Just trying to understand what the market is actually pricing in.
So why the selloff?
I think the answer is expectations.Credo has been delivering massive growth, but the growth rate is starting to slow:
274% → 272% → 202% → 157% → 115% YoY revenue growth.115% growth is still insane. The problem is that the market may have already priced in another massive upside surprise.Previous quarters also had much bigger earnings surprises. This time, the company beat, but only by a small margin.So this doesn’t look like a case of “bad earnings.”It looks more like: the company delivered excellent numbers, but the market was expecting something even better.That’s also why I’m watching CRDOB closely. Its overnight −17% move could be pricing in a much more aggressive reaction than the actual Nasdaq market ultimately delivers.
The big question now is simple:
When Nasdaq opens, where does the actual CRDO price settle?
If CRDO opens significantly above CRDOB’s overnight price, the tokenized stock could have some serious catching up to do.Not financial advice. Just trying to understand what the market is actually pricing in.
154
·
--
Credo’s earnings were actually strong: revenue hit $479M, +114.7% YoY, with $1.20 non-GAAP EPS. The concern was margins. Gross margin weakened slightly, and investors expected stronger profitability alongside that huge growth.The interesting part: $CRDO had already traded near $184 during the previous session before closing around $206.6. After earnings, $CRDOB kept trading 24/7 and priced in the negative reaction while Nasdaq was closed.So can it fall more when Nasdaq opens? Absolutely. The -17% overnight move does NOT guarantee the bottom is in.
If $CRDO opens around $190–200 and holds, $CRDOB could get a relief bounce. But if $CRDO opens below $184–180 and selling continues, $CRDOB could go lower.On the 1H chart, RSI is around 18.7, meaning it’s extremely oversold. I’m watching $184–176 as the key downside zone. Holding it and reclaiming $190–200 would look much healthier.
My main takeaway: this looks more like a valuation/margin reset than a fundamental collapse. The business is still growing extremely fast, but expectations were extremely high.For $CRDOB, I wouldn’t judge the bottom from the overnight -17% alone. The real test comes when Nasdaq opens and we see what the actual $CRDO stock does.
Not financial advice — just my analysis.
Credo’s earnings were actually strong: revenue hit $479M, +114.7% YoY, with $1.20 non-GAAP EPS. The concern was margins. Gross margin weakened slightly, and investors expected stronger profitability alongside that huge growth.The interesting part: $CRDO had already traded near $184 during the previous session before closing around $206.6. After earnings, $CRDOB kept trading 24/7 and priced in the negative reaction while Nasdaq was closed.So can it fall more when Nasdaq opens? Absolutely. The -17% overnight move does NOT guarantee the bottom is in.
If $CRDO opens around $190–200 and holds, $CRDOB could get a relief bounce. But if $CRDO opens below $184–180 and selling continues, $CRDOB could go lower.On the 1H chart, RSI is around 18.7, meaning it’s extremely oversold. I’m watching $184–176 as the key downside zone. Holding it and reclaiming $190–200 would look much healthier.
My main takeaway: this looks more like a valuation/margin reset than a fundamental collapse. The business is still growing extremely fast, but expectations were extremely high.For $CRDOB, I wouldn’t judge the bottom from the overnight -17% alone. The real test comes when Nasdaq opens and we see what the actual $CRDO stock does.
Not financial advice — just my analysis.
If $CRDO opens around $190–200 and holds, $CRDOB could get a relief bounce. But if $CRDO opens below $184–180 and selling continues, $CRDOB could go lower.On the 1H chart, RSI is around 18.7, meaning it’s extremely oversold. I’m watching $184–176 as the key downside zone. Holding it and reclaiming $190–200 would look much healthier.
My main takeaway: this looks more like a valuation/margin reset than a fundamental collapse. The business is still growing extremely fast, but expectations were extremely high.For $CRDOB, I wouldn’t judge the bottom from the overnight -17% alone. The real test comes when Nasdaq opens and we see what the actual $CRDO stock does.
Not financial advice — just my analysis.
152
Log in to explore more content
Join global crypto users on Binance Square
⚡️ Get latest and useful information about crypto.
💬 Trusted by the world’s largest crypto exchange.
👍 Discover real insights from verified creators.
Email / Phone number
Trending Topics
BOJRaisesRatesTo31YearHigh
58,309 views
1,035 Discussing
#bojraisesratesto31yearhigh
🌏 BOJ JUST SHOCKED MARKETS: RATES HIT A 31-YEAR HIGH 🌏
For decades, Japan was the land of cheap money.
Now the tide is turning, and global capital is listening.
The Bank of Japan raised its policy rate from 1% to 1.25%, the highest level since 1995. The 7-2 decision reflects growing concern that inflation could move above the BOJ’s 2% target.
The bigger story is not the 25-basis-point hike itself. Japan is moving further away from the ultra-low-rate environment that made the yen a major global funding currency.
My Take: This matters beyond Japan. Higher Japanese yields can gradually change where capital seeks returns, potentially affecting global bonds, currencies, equities and risk assets, including crypto.
Yet the immediate reaction was unusual. Instead of strengthening, the yen weakened after the decision, partly because two policymakers opposed the hike and markets saw the move as less aggressive than some had expected.
That distinction matters. A rate hike does not automatically mean tighter financial conditions everywhere overnight. The pace of future increases, inflation, oil prices and the yen’s response may matter more than this single decision.
The era of effortless cheap money is slowly becoming a different story.
❓Could Japan’s tightening cycle become an overlooked driver of global crypto liquidity?
Disclaimer: This is market analysis, not financial advice.
#BOJ #CryptoMarket #GrowWithSAC $AR $G $STRK
#BOJRaisesRatesTo31YearHigh
SAC-King-你真棒-带我走
·3 Likes
·2.9k views
BuffettStepsDownAsBerkshireChairman
24,155 views
473 Discussing
XRPExchangeReservesHitSevenYearLow
30,589 views
449 Discussing