

James_BNB
Trader || Community Builder || BNB Holder || @JamestraderBNB
High-Frequency Trader
4 Years
119 Following
17.3K+ Followers
67.2K+ Liked
Posts
All
Quotes
Videos
PINNED



James_BNB
·
--
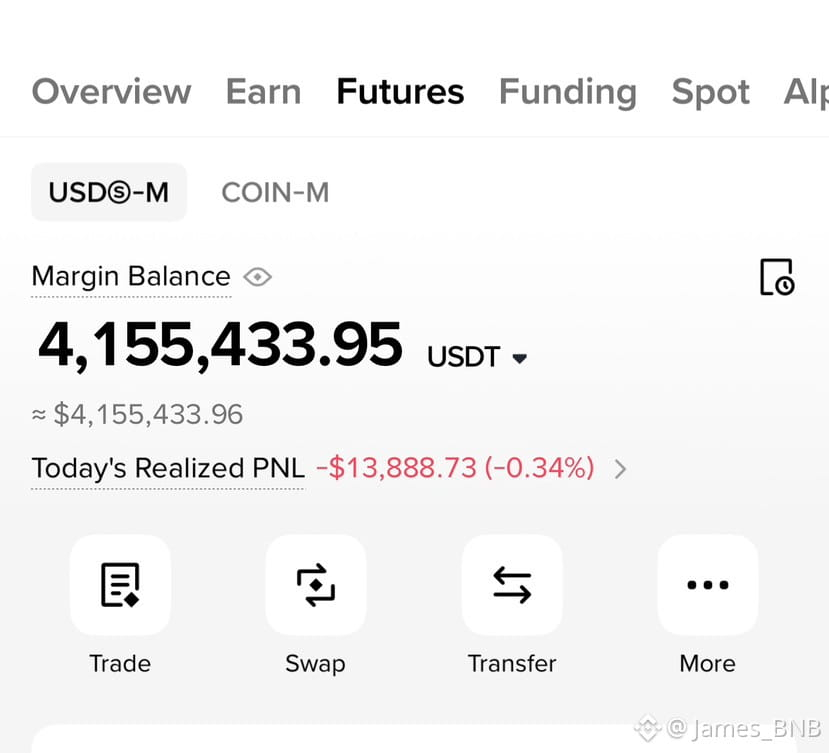
BullishDAY 1 — $500 TO $10,000. LET’S MAKE THIS HAPPEN! 🚀
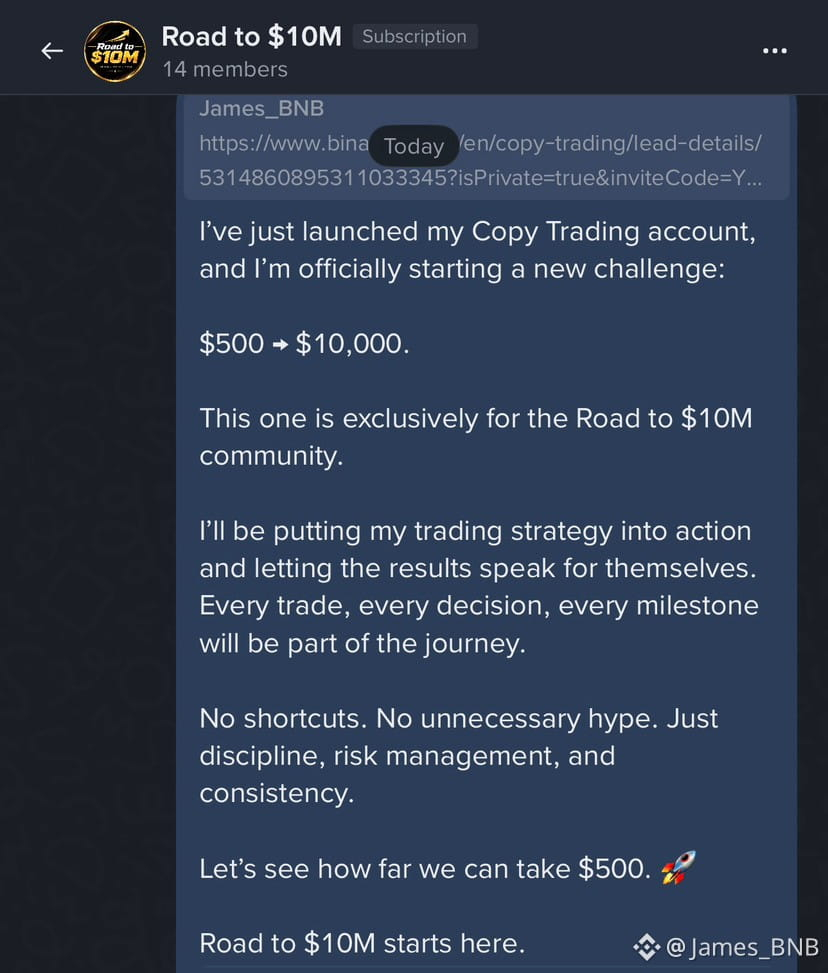
Alright guys, we’re starting a new challenge, and this time we’re doing it exclusively for our "Road to $10M" group!
The mission is simple: Start with $500 and turn it into $10,000. That’s a 20X journey.
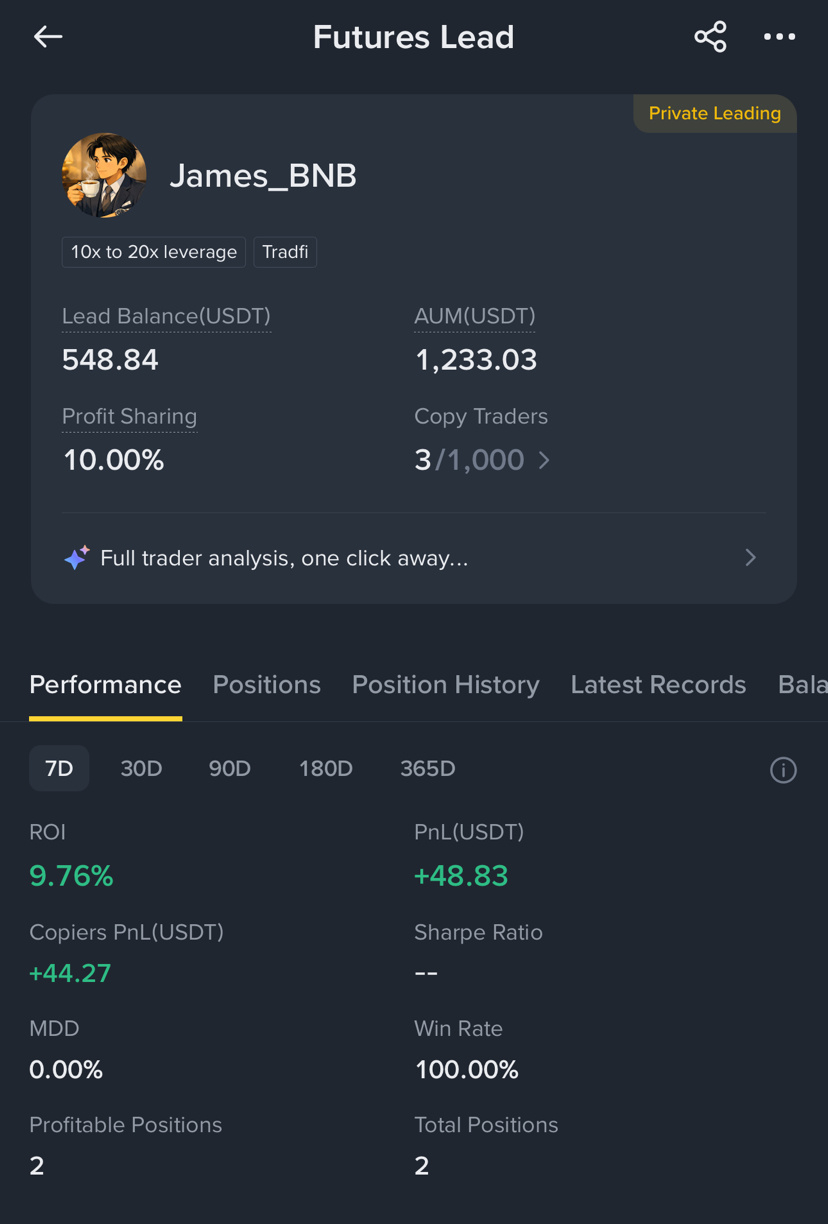
I’ve just launched my Copy Trading account specifically for this challenge, so our "Road to $10M" members can follow the journey and experience the process together.
I’m not going to promise an easy ride. There will be wins, losses, unexpected market moves, and moments when the market tests our patience.
I’ll share the journey as transparently as possible, including the trades that don’t go our way. No hiding losses, no unrealistic promises. Just real trading, discipline, and risk management.
This challenge is exclusively for Road to $10M members. Let’s see what we can accomplish together!
DAY 1 starts now. Who’s ready to be part of this journey? 💙
Alright guys, we’re starting a new challenge, and this time we’re doing it exclusively for our "Road to $10M" group!
The mission is simple: Start with $500 and turn it into $10,000. That’s a 20X journey.
I’ve just launched my Copy Trading account specifically for this challenge, so our "Road to $10M" members can follow the journey and experience the process together.
I’m not going to promise an easy ride. There will be wins, losses, unexpected market moves, and moments when the market tests our patience.
I’ll share the journey as transparently as possible, including the trades that don’t go our way. No hiding losses, no unrealistic promises. Just real trading, discipline, and risk management.
This challenge is exclusively for Road to $10M members. Let’s see what we can accomplish together!
DAY 1 starts now. Who’s ready to be part of this journey? 💙

James_BNB
·
--
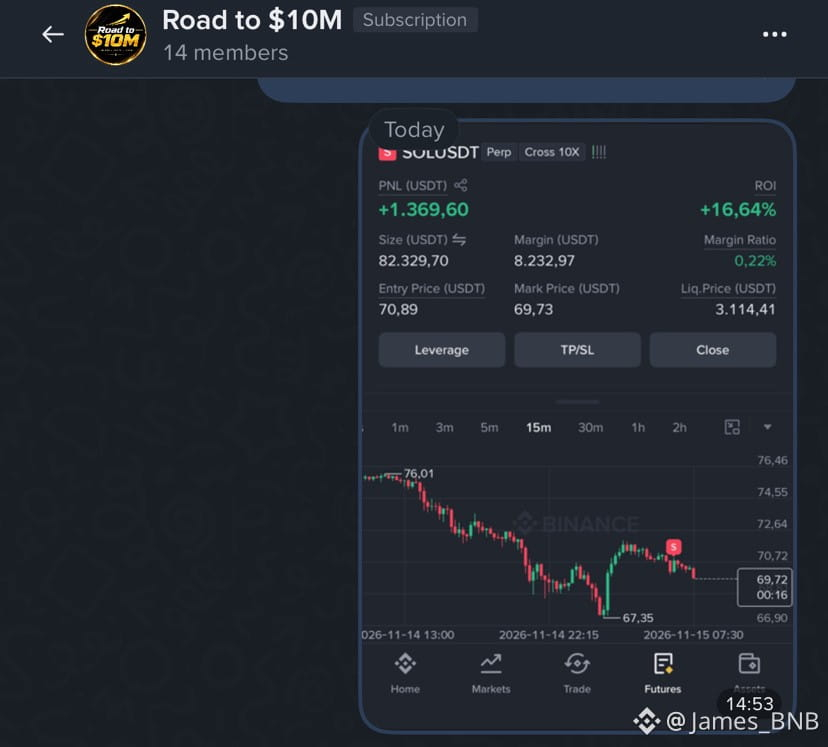
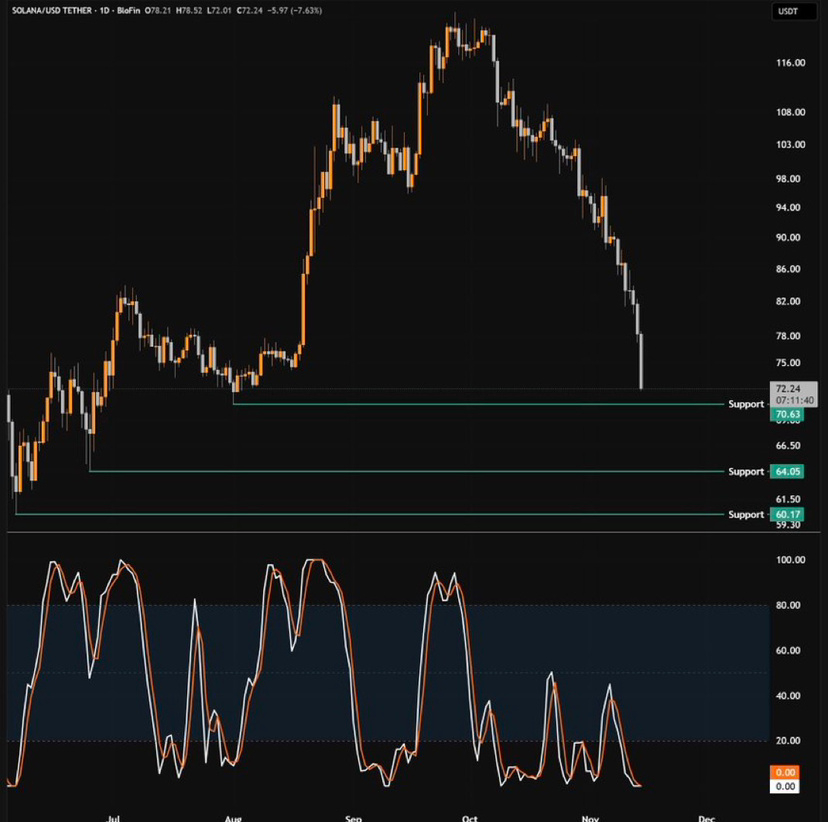
Bearish$ETH big short round 2 now, buy Bugatti later
entry 1790-1850
short $ETH 👇
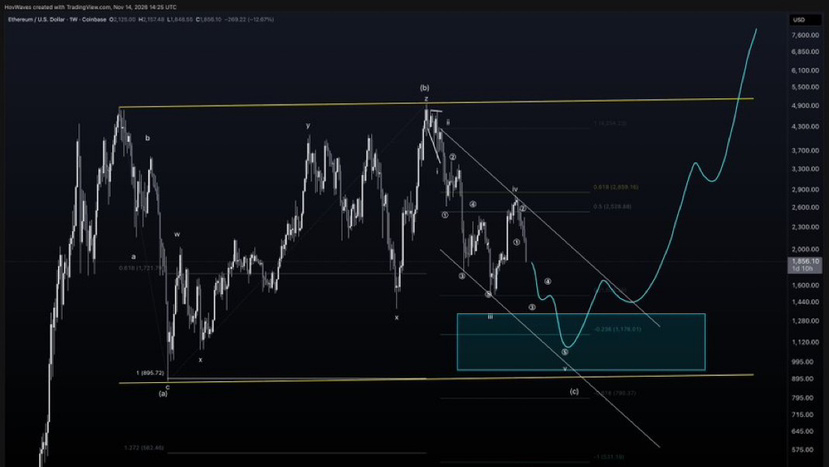
$ETH Bears Taking Control?
In my previous update, I asked whether you wanted to see the bearish alternative scenario.
Here it is.
I’ve actually been mapping out this Elliott Wave count for months, and the downside target remains unchanged.
The scenario suggests a macro flat-style correction that could eventually push ETH below $1,200, potentially extending toward the $900 region.
Does that mean our preferred bullish count is invalidated?
Not even close.
$BTC and several stronger altcoins are finally approaching the higher-timeframe support zones we’ve been tracking for months.
And we’re seeing exactly what I warned about:
Bulls are panicking.
Bears are celebrating.
Lower and lower price targets are suddenly flooding the timeline.
This is often what major opportunities look like when price finally reaches the levels everyone has been waiting for.
I still lean toward $BTC and stronger altcoins defending their larger-degree support.
But having a bullish bias doesn’t mean we ignore the bearish alternative.
The objective isn’t to become emotionally attached to a particular wave count.
It’s about identifying high-value areas, defining invalidation levels, managing risk, and allowing price action to confirm the setup.
Stick to the plan.
I told you this part of the market would be uncomfortable. Don’t let emotions make your decisions for you.
entry 1790-1850
short $ETH 👇
$ETH Bears Taking Control?
In my previous update, I asked whether you wanted to see the bearish alternative scenario.
Here it is.
I’ve actually been mapping out this Elliott Wave count for months, and the downside target remains unchanged.
The scenario suggests a macro flat-style correction that could eventually push ETH below $1,200, potentially extending toward the $900 region.
Does that mean our preferred bullish count is invalidated?
Not even close.
$BTC and several stronger altcoins are finally approaching the higher-timeframe support zones we’ve been tracking for months.
And we’re seeing exactly what I warned about:
Bulls are panicking.
Bears are celebrating.
Lower and lower price targets are suddenly flooding the timeline.
This is often what major opportunities look like when price finally reaches the levels everyone has been waiting for.
I still lean toward $BTC and stronger altcoins defending their larger-degree support.
But having a bullish bias doesn’t mean we ignore the bearish alternative.
The objective isn’t to become emotionally attached to a particular wave count.
It’s about identifying high-value areas, defining invalidation levels, managing risk, and allowing price action to confirm the setup.
Stick to the plan.
I told you this part of the market would be uncomfortable. Don’t let emotions make your decisions for you.

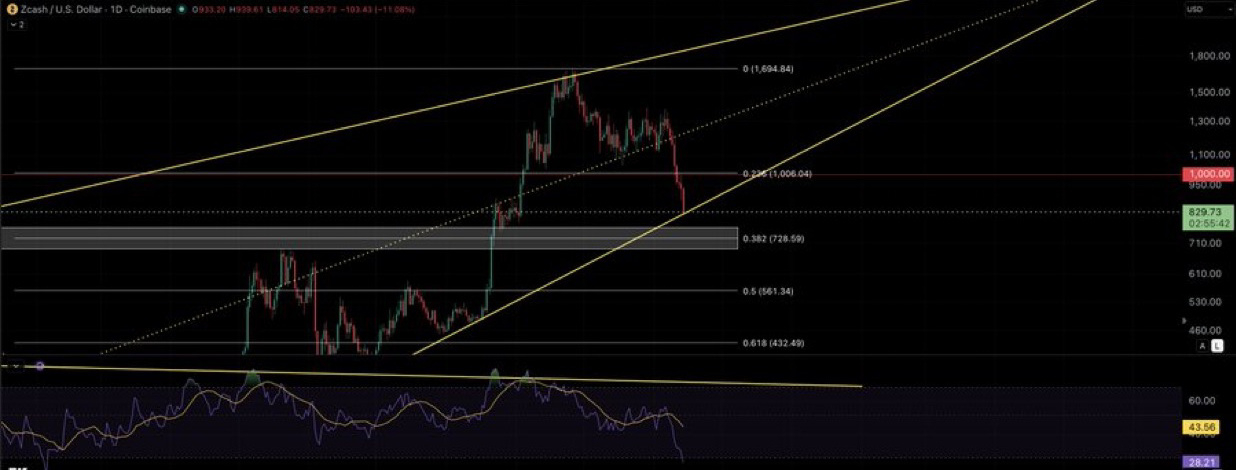
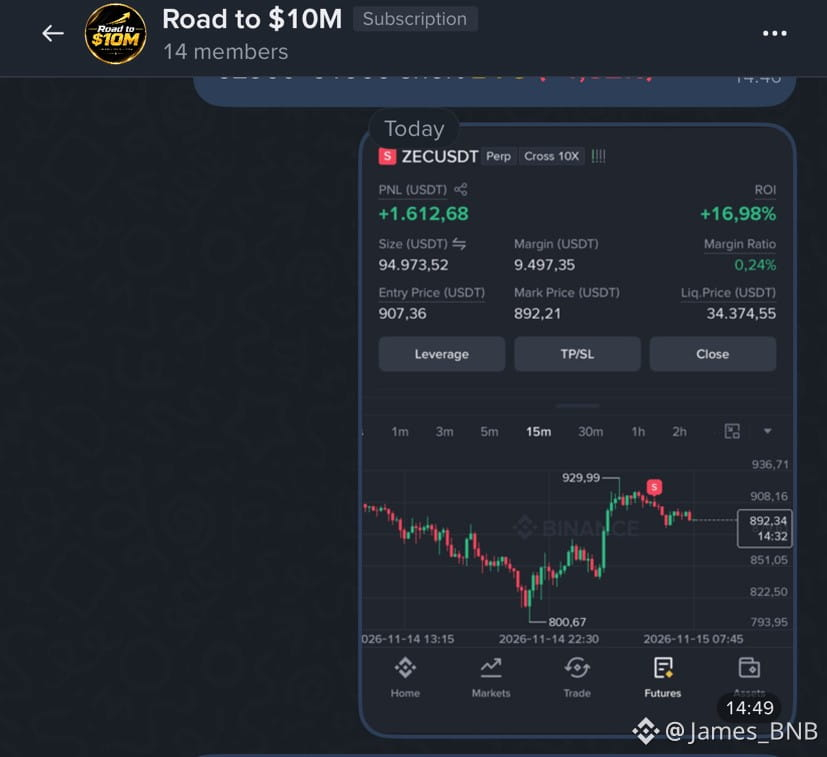
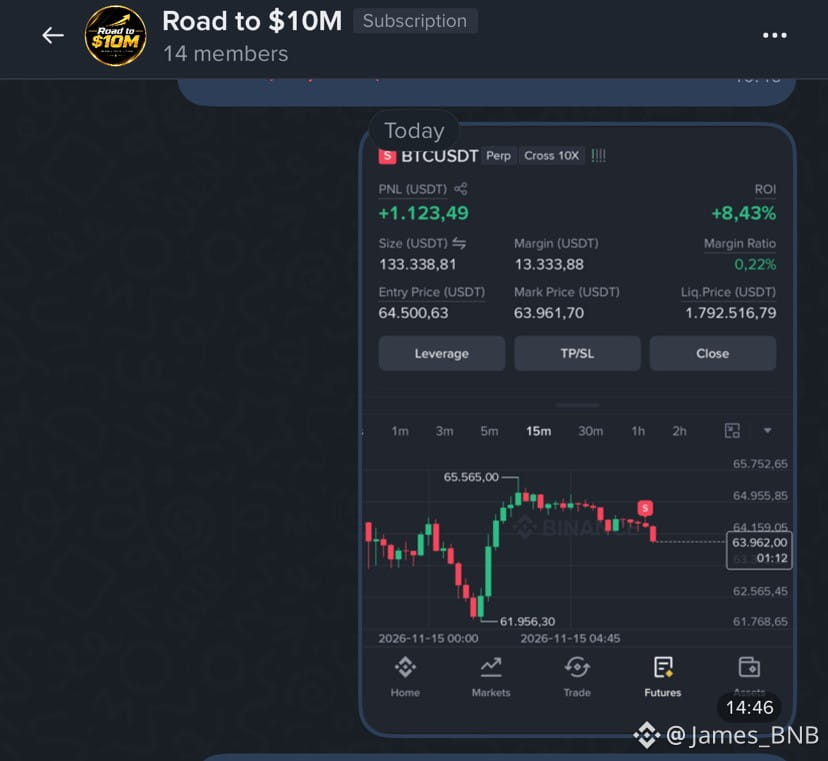
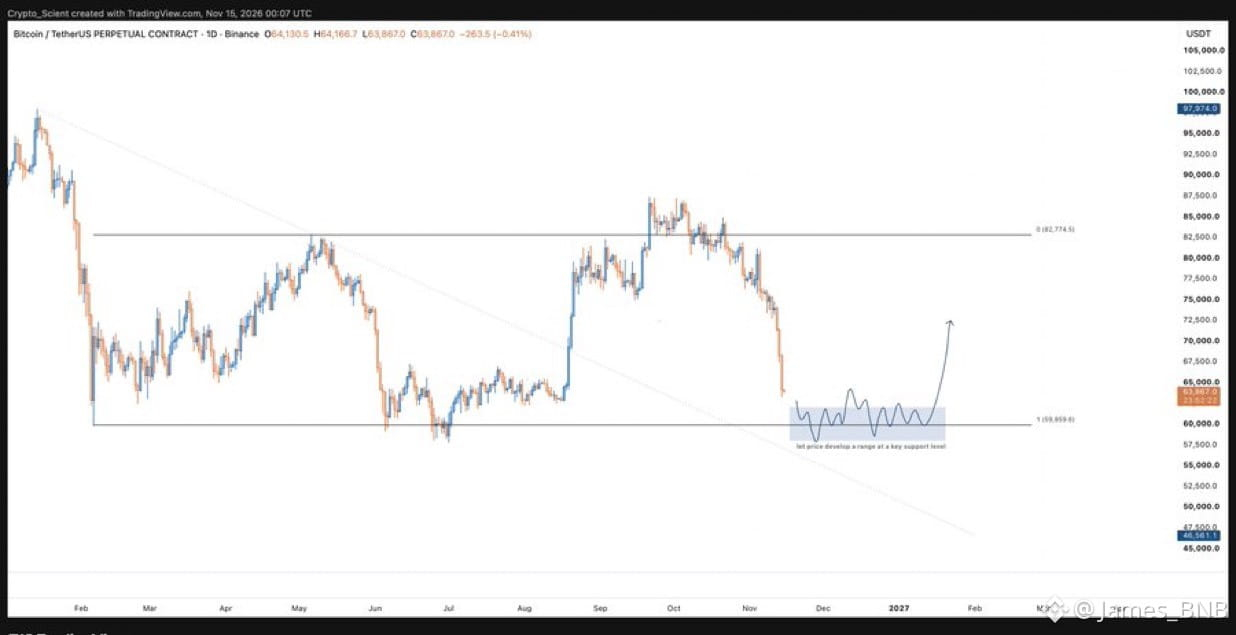
James_BNB
·
--
Bullish$BTC pay attention, big long now, thanks me later
entry 64600-63600
long $BTC 👇
$BTC looks like it has simply repeated the same pattern once again, only at a much slower pace.
A strong move higher, a breakout above previous highs, followed by a failure to sustain momentum and a sharp rejection.
Initially, during this downtrend, this type of price action consistently led to fresh lows. However, this time we managed to establish a higher high.
That puts Bitcoin in an interesting position.
Technically, the weekly structure has now printed a higher high, meaning the current area could still develop into a higher low and preserve the possibility of a broader structural recovery.
That said, the chart remains extremely messy, and there is very little clarity in the current price action.
What we need now is a period of consolidation to allow the market to establish direction and reveal where the next major move is likely to develop.
One level I’m watching particularly closely is the weekly 200MA/EMA, currently sitting around $68K.
This is a major support confluence, and bulls need to defend it as soon as possible.
Losing that level would significantly weaken the current recovery structure. Holding above it could give Bitcoin the foundation it needs for another attempt higher.
entry 64600-63600
long $BTC 👇
$BTC looks like it has simply repeated the same pattern once again, only at a much slower pace.
A strong move higher, a breakout above previous highs, followed by a failure to sustain momentum and a sharp rejection.
Initially, during this downtrend, this type of price action consistently led to fresh lows. However, this time we managed to establish a higher high.
That puts Bitcoin in an interesting position.
Technically, the weekly structure has now printed a higher high, meaning the current area could still develop into a higher low and preserve the possibility of a broader structural recovery.
That said, the chart remains extremely messy, and there is very little clarity in the current price action.
What we need now is a period of consolidation to allow the market to establish direction and reveal where the next major move is likely to develop.
One level I’m watching particularly closely is the weekly 200MA/EMA, currently sitting around $68K.
This is a major support confluence, and bulls need to defend it as soon as possible.
Losing that level would significantly weaken the current recovery structure. Holding above it could give Bitcoin the foundation it needs for another attempt higher.
James_BNB
·
--
Bearish$ETH pay attention, open big short now, buy new Porsche later with me
entry 1906-1945
short $ETH 👇
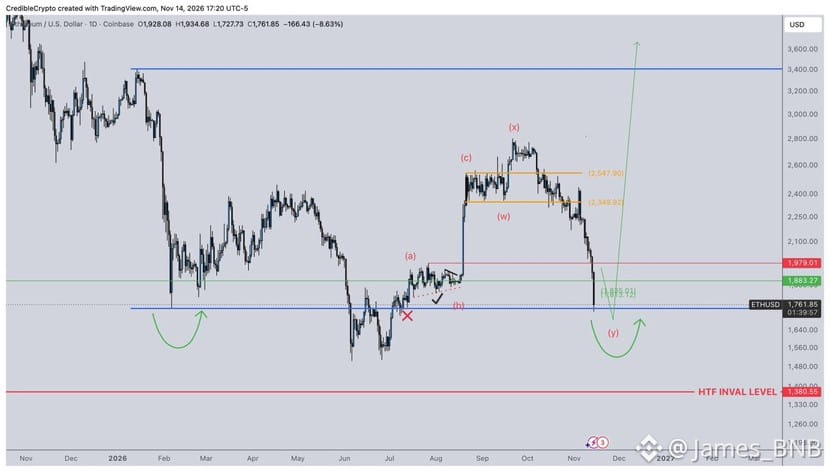
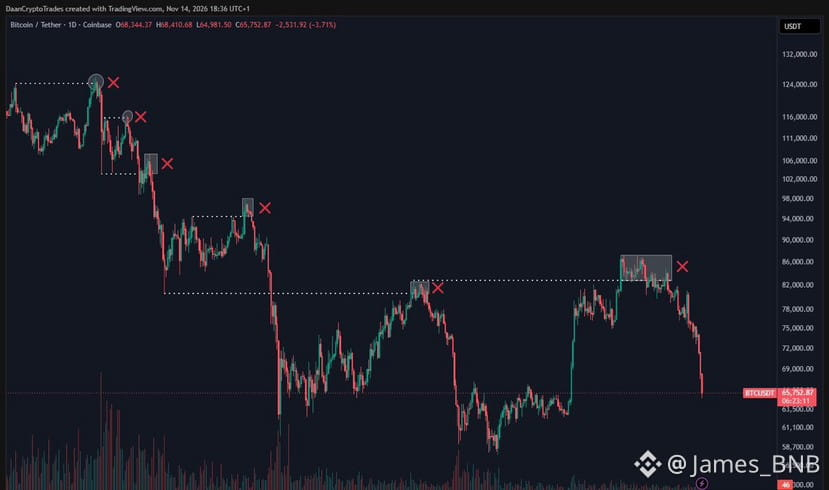
You guys should remember that the last time $ETH was trading around these levels, I was specifically looking for a sweep of the accumulated liquidity below the lows marked with the RED X’s on the left side of the chart.
We never got that sweep. Instead, we saw a massive short squeeze that pushed price significantly higher.
Now, it looks like we’re finally coming back to clean up those untouched lows while simultaneously retesting the lows of the broader range.
Here’s why this matters.
If the previous move had been a completed bullish impulse, with a clear five-wave structure to the upside, there would have been much less reason to expect price to return for those untapped lows.
But that wasn’t the structure we got. And now here we are lol.
This is exactly why I’m almost ALWAYS looking for the market to clean up unfinished business before committing to a major move.
Clearing these liquidity pockets and filling the remaining inefficiencies now would remove some of the downside magnets that could otherwise pull price back later.
More importantly, sweeping all these lows would bring us directly into the broader range lows, potentially creating the missing third tap and completing the base formation I’ve been watching.
entry 1906-1945
short $ETH 👇
You guys should remember that the last time $ETH was trading around these levels, I was specifically looking for a sweep of the accumulated liquidity below the lows marked with the RED X’s on the left side of the chart.
We never got that sweep. Instead, we saw a massive short squeeze that pushed price significantly higher.
Now, it looks like we’re finally coming back to clean up those untouched lows while simultaneously retesting the lows of the broader range.
Here’s why this matters.
If the previous move had been a completed bullish impulse, with a clear five-wave structure to the upside, there would have been much less reason to expect price to return for those untapped lows.
But that wasn’t the structure we got. And now here we are lol.
This is exactly why I’m almost ALWAYS looking for the market to clean up unfinished business before committing to a major move.
Clearing these liquidity pockets and filling the remaining inefficiencies now would remove some of the downside magnets that could otherwise pull price back later.
More importantly, sweeping all these lows would bring us directly into the broader range lows, potentially creating the missing third tap and completing the base formation I’ve been watching.
James_BNB
·
--
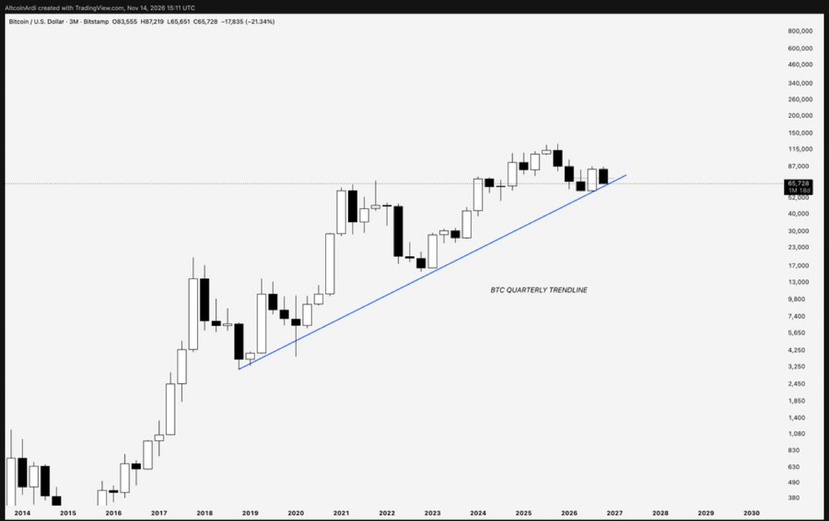
Almost nobody seems to be talking about this, but this could be one of the most important technical charts for $BTC right now.
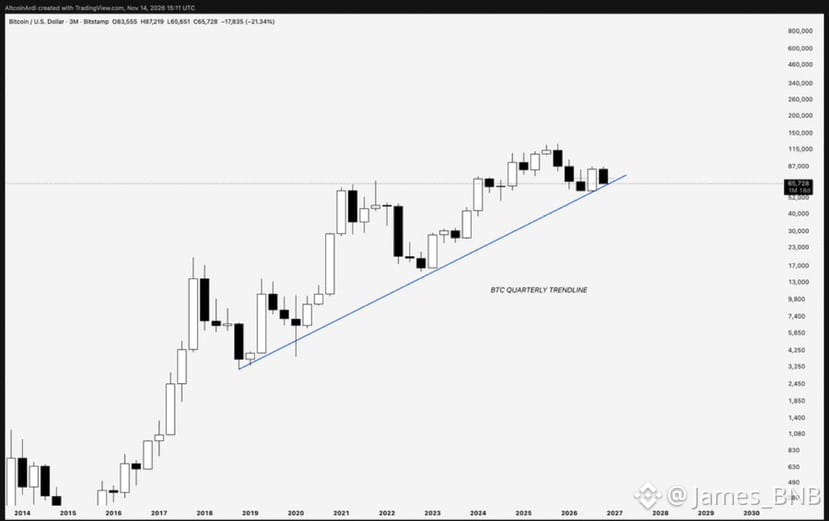
An eight-year trendline dating back to when Bitcoin was trading around $3,000.
It connects the bear market lows of 2018 and 2022, and now we’re testing it again on both the monthly and quarterly timeframes.
The implications are massive.
If Bitcoin loses this trendline, bulls need to reclaim it quickly. Otherwise, we could be looking at a much deeper correction, potentially pushing BTC below $57K.
Remember:
The higher the timeframe, the bigger the breakdown.
This is a level the market simply cannot afford to ignore.
An eight-year trendline dating back to when Bitcoin was trading around $3,000.
It connects the bear market lows of 2018 and 2022, and now we’re testing it again on both the monthly and quarterly timeframes.
The implications are massive.
If Bitcoin loses this trendline, bulls need to reclaim it quickly. Otherwise, we could be looking at a much deeper correction, potentially pushing BTC below $57K.
Remember:
The higher the timeframe, the bigger the breakdown.
This is a level the market simply cannot afford to ignore.
James_BNB
·
--
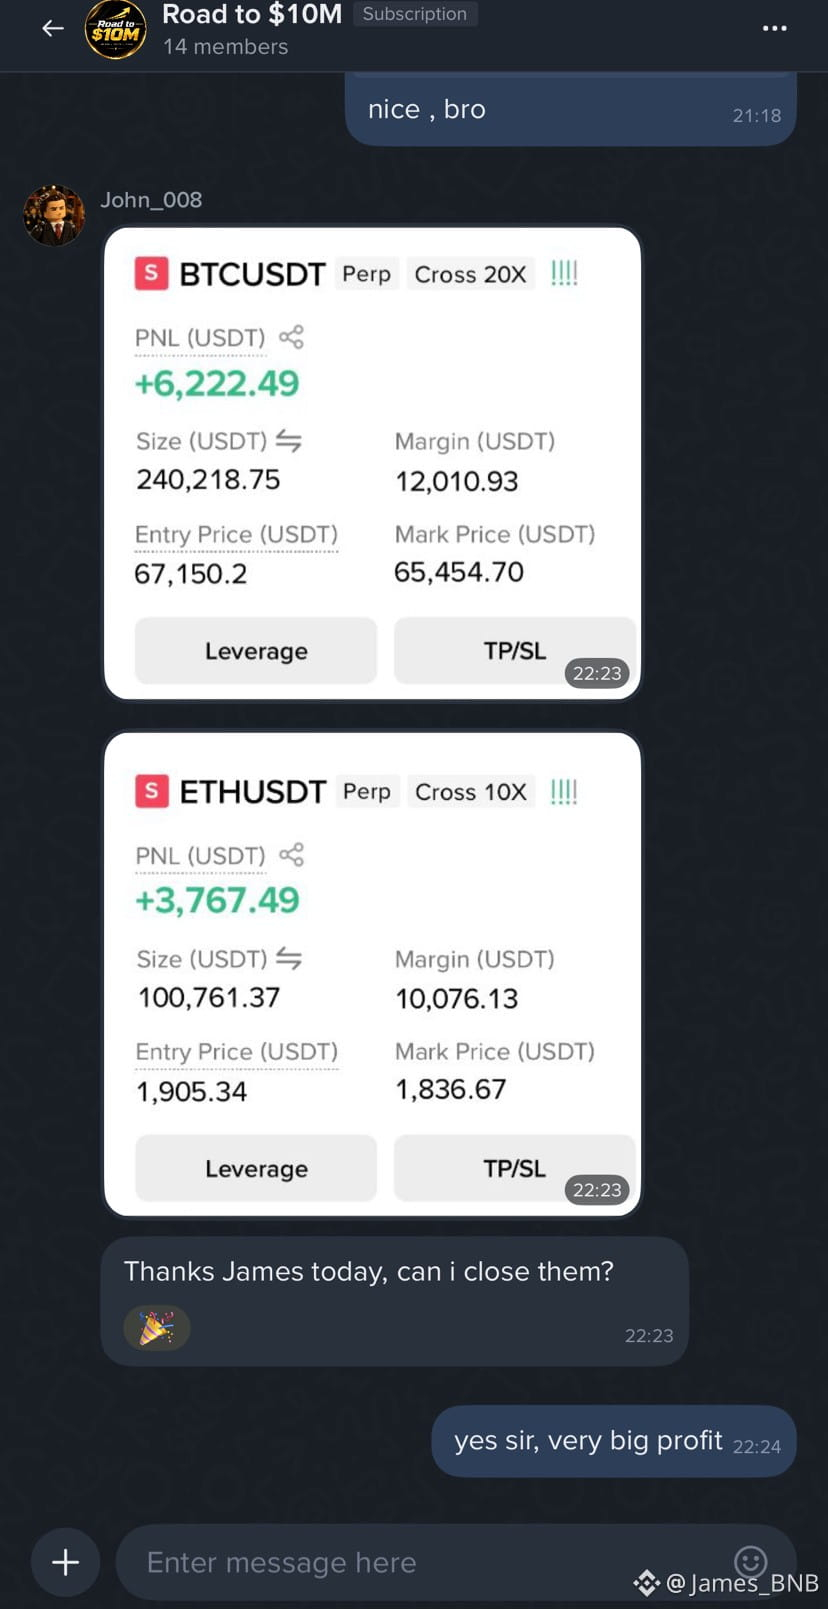
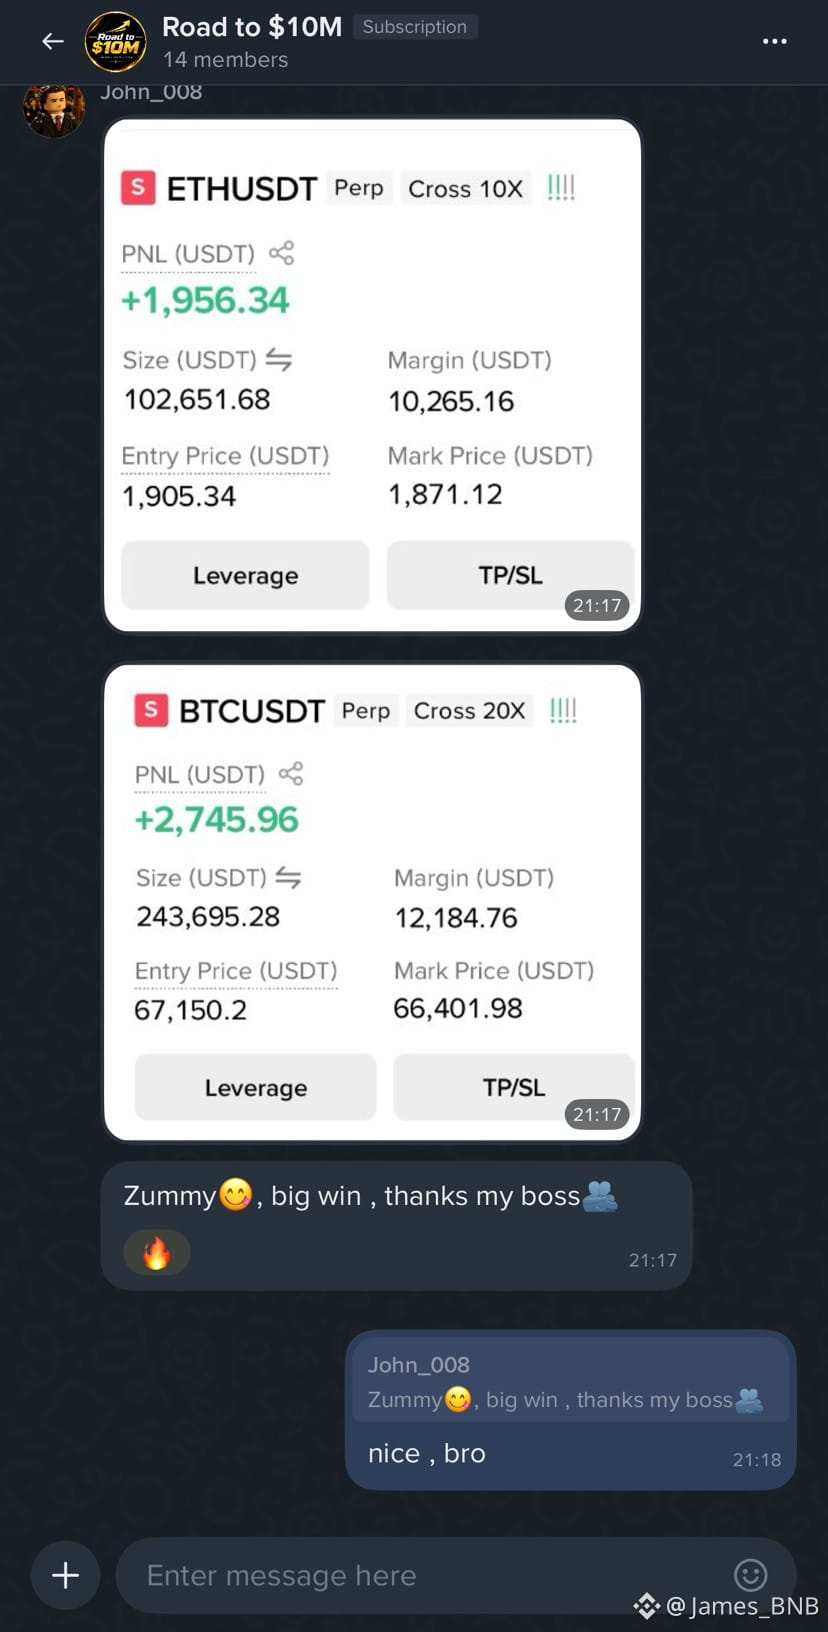
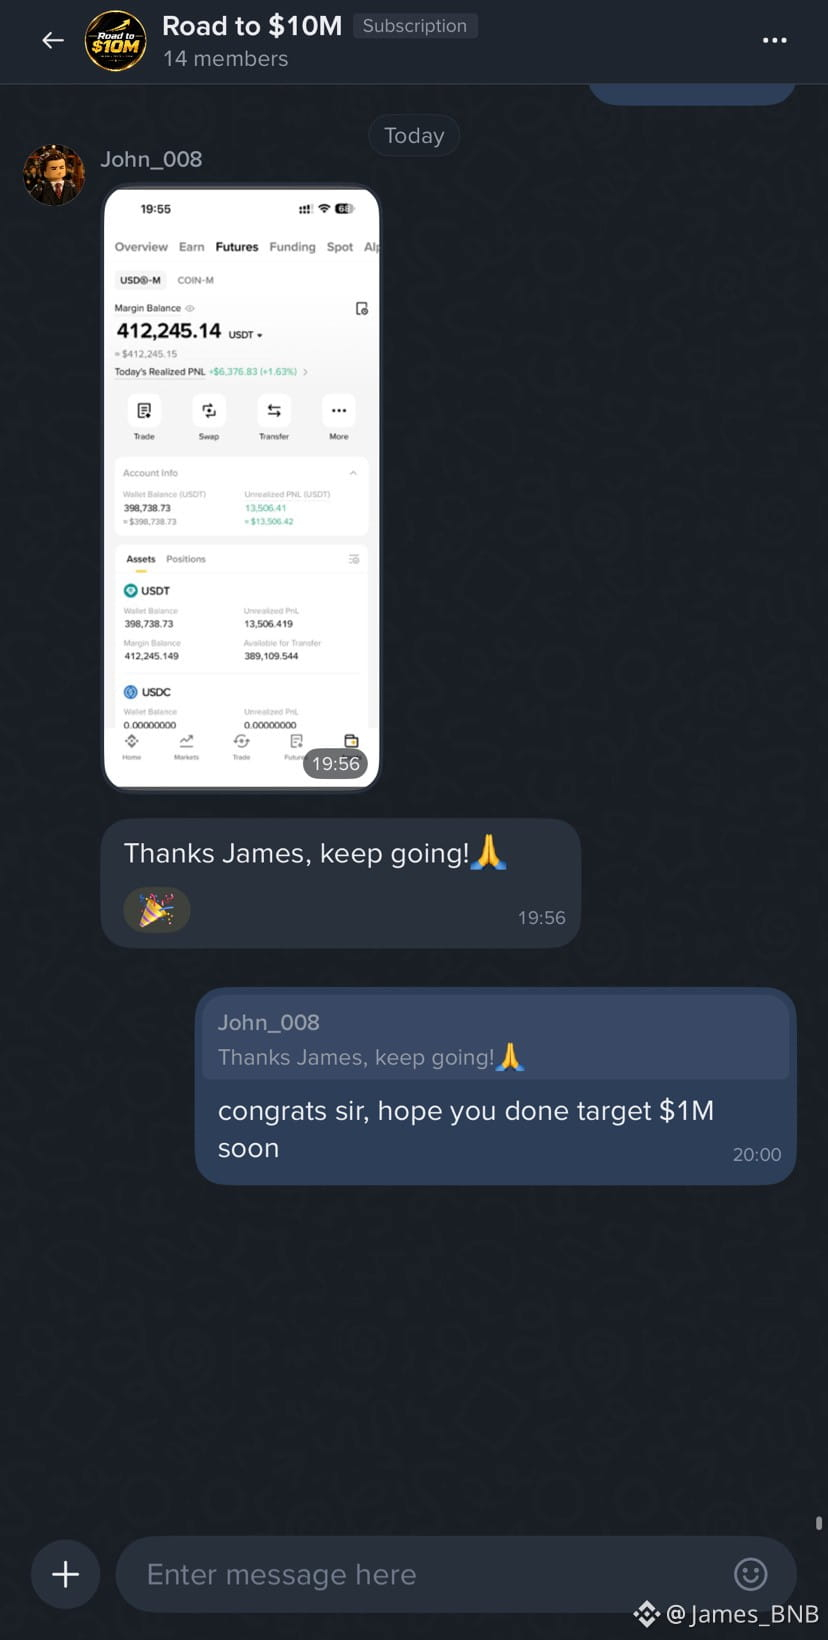
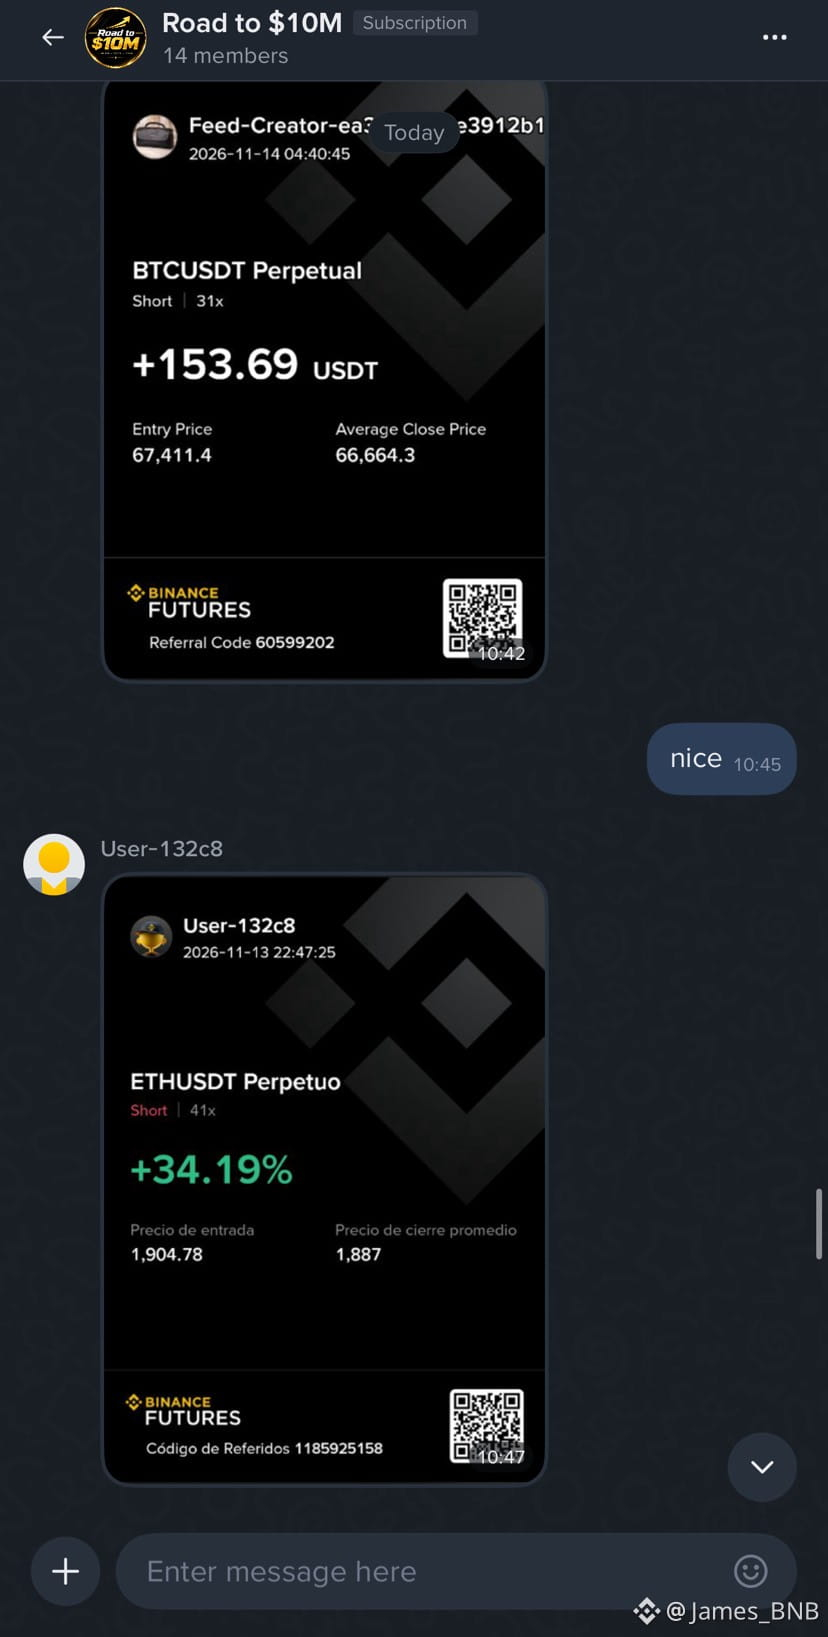
BullishDay 13 of the trading journey.
Winning for 1–2 days could simply be luck. But maintaining a winning streak for 13 consecutive days? That’s where Road to $10M stands apart. 🤭
My members continue to generate profits day after day, and watching them grow alongside us is the best reward. 🤑
Consistency isn’t an accident. It’s built through discipline, execution, and a proven strategy.
Want to be part of this journey?
Comment “YES” if you want to join Road to $10M and build something extraordinary with us. 🚀
Winning for 1–2 days could simply be luck. But maintaining a winning streak for 13 consecutive days? That’s where Road to $10M stands apart. 🤭
My members continue to generate profits day after day, and watching them grow alongside us is the best reward. 🤑
Consistency isn’t an accident. It’s built through discipline, execution, and a proven strategy.
Want to be part of this journey?
Comment “YES” if you want to join Road to $10M and build something extraordinary with us. 🚀
James_BNB
·
--
Bearish$BTC big short round 2 today now guys, buy Rolls Royce later
entry 67150-67900
short $BTC 👇
$BTC pumps are still opportunities to look for short entries until price reaches weekly demand and sweeps the range lows. That’s where I’ll start looking to build swing long positions.
One thing I don’t want you to overlook: don’t automatically assume that $BTC trading at $65K means altcoins are going to suffer another 30-40% correction.
If $BTC.D starts losing momentum and bleeding lower, most altcoins may only have another 10-15% downside before a much bigger market-wide move begins.
The key is understanding where liquidity is rotating, not blindly following Bitcoin’s direction.
Stay patient. Don’t let short-term volatility shake you out of fundamentally good spot positions.
entry 67150-67900
short $BTC 👇
$BTC pumps are still opportunities to look for short entries until price reaches weekly demand and sweeps the range lows. That’s where I’ll start looking to build swing long positions.
One thing I don’t want you to overlook: don’t automatically assume that $BTC trading at $65K means altcoins are going to suffer another 30-40% correction.
If $BTC.D starts losing momentum and bleeding lower, most altcoins may only have another 10-15% downside before a much bigger market-wide move begins.
The key is understanding where liquidity is rotating, not blindly following Bitcoin’s direction.
Stay patient. Don’t let short-term volatility shake you out of fundamentally good spot positions.
James_BNB
·
--
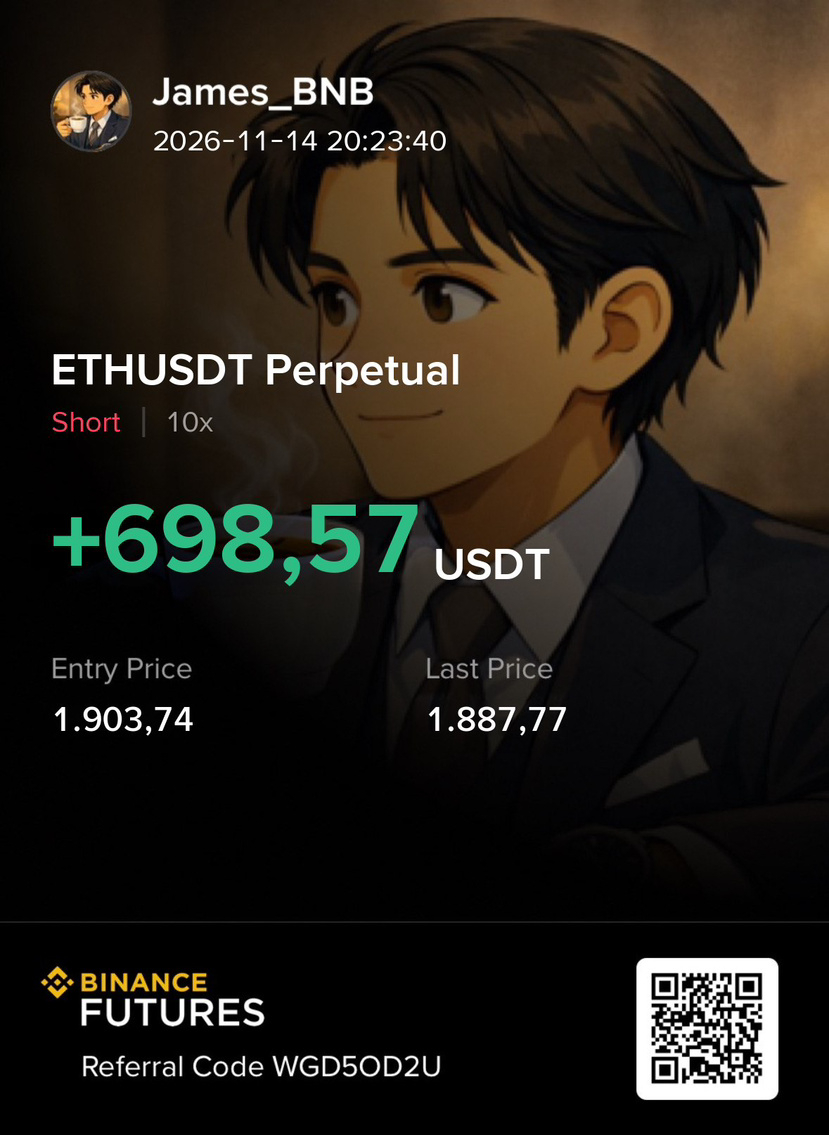
Bearish$ETH listen carefull, big short round 2 now, big profit coming
entry 1900-1950
short $ETH 👇
entry 1900-1950
short $ETH 👇

Log in to explore more content