
cryptozidezi - Adrian
4.1k Posts

cryptozidezi - Adrian
 Square Verified+
Report
Block User
• The road to $1,000,000 is open to everyone!
Open Trade

BMT Holder
Frequent Trader
4.8 Years
0 Following
59.6K+ Followers
44.1K+ Liked
Posts
Portfolio
All
Quotes
Videos
Live
PINNED

Article
My challenge to grow capital from 1000 USDT to 512,000 USDT in 10 years!It is a challenge that will mark my life! Do you have the patience for 10 years to develop a single idea that will mark your life? I do! Some members of my Binance Square channel remember my copy-trading account, because that is where my challenge started! Today is 19.03.26 and I am creating this post which I will highlight until 18.12.2026! I have many thoughts and I try to tell them to you. So my strategy is CONSERVATIVE TRADER! It helps me to accumulate the position gradually! It helps me to get through market impulses! To get through emotions easily! All positions I open on isolated system, I add margin to the position in such a way that only if there will be a major anomaly on the market, then it will liquidate me! This way helps me to be calm when I make decisions, and if I buy something and automatically go into minus, that is no longer a problem for me. Now you know that I started with 1000 USDT! The objective was and remains to gain 100% increase to capital for 12 months! Does it seem little or much? Does it seem easy or hard?
Well let me try to explain! As you can see in the screenshots, in 12 months I generated 686 USDT, that is 68.41% increase to capital! Curious how many people will appreciate this post! So +68.41% in 12 months, ok, but how much money did I lose, namely commissions, liquidations! I fixed 152 USDT in 12 months of activity, that is -15.28% relative to capital! So the real profit is +534 USDT, that is +53% increase to capital in 12 months! If I had capital of 1M, exactly the same results would be, the strategy does not change, only the numbers change proportionally! I think you understand what I mean! I fixed on plus 221 positions and I fixed on minus only 7 positions on my copy-trading account in 12 months! Would you have the patience to work 12 months for +53% increase to capital? The second year of the challenge started on 18.12.25, but already in rotation there are 1534 USDT! On 18.12.26 I aim to have in rotation 3000 USDT! At the moment I am stuck in minus on all open positions! I hold 28 positions in LONG as ALSEZON was expected! I am patient and optimistic and I respect the strategy! If success costs 10 years, then I will go through it patiently, as big investors have plans for 100-500 years ahead! CRYPTO is the future I believe! Salaries are already being paid in crypto! The classic financial system migrates year by year into the CRYPTO system! I support that all those who are seriously willing to study the CRYPTO world will become millionaires in the coming decades! I have emotions writing this article, but honestly I wanted to express myself, and to create something new on my channel! To tell you honestly I am a little afraid that the article will gather 5k views and 10 likes! But if you don’t take risks you have no way to find out anything! I hope there will be peace in the world and to go through the next 9 years the same way I went through 2024-25! I wish you success in all activities you have and which you will start! Believe in yourselves to the MAXIMUM! Be courageous! Respect the plan day by day! Binance Square is the platform where proposed objectives can become reality! Thank you for your attention! You are welcome in my community! Success to everyone!
#cryptozidezi
My challenge to grow capital from 1000 USDT to 512,000 USDT in 10 years!
It is a challenge that will mark my life! Do you have the patience for 10 years to develop a single idea that will mark your life? I do! Some members of my Binance Square channel remember my copy-trading account, because that is where my challenge started! Today is 19.03.26 and I am creating this post which I will highlight until 18.12.2026! I have many thoughts and I try to tell them to you. So my strategy is CONSERVATIVE TRADER! It helps me to accumulate the position gradually! It helps me to get through market impulses! To get through emotions easily! All positions I open on isolated system, I add margin to the position in such a way that only if there will be a major anomaly on the market, then it will liquidate me! This way helps me to be calm when I make decisions, and if I buy something and automatically go into minus, that is no longer a problem for me. Now you know that I started with 1000 USDT! The objective was and remains to gain 100% increase to capital for 12 months! Does it seem little or much? Does it seem easy or hard?
Well let me try to explain! As you can see in the screenshots, in 12 months I generated 686 USDT, that is 68.41% increase to capital! Curious how many people will appreciate this post! So +68.41% in 12 months, ok, but how much money did I lose, namely commissions, liquidations! I fixed 152 USDT in 12 months of activity, that is -15.28% relative to capital! So the real profit is +534 USDT, that is +53% increase to capital in 12 months! If I had capital of 1M, exactly the same results would be, the strategy does not change, only the numbers change proportionally! I think you understand what I mean! I fixed on plus 221 positions and I fixed on minus only 7 positions on my copy-trading account in 12 months! Would you have the patience to work 12 months for +53% increase to capital? The second year of the challenge started on 18.12.25, but already in rotation there are 1534 USDT! On 18.12.26 I aim to have in rotation 3000 USDT! At the moment I am stuck in minus on all open positions! I hold 28 positions in LONG as ALSEZON was expected! I am patient and optimistic and I respect the strategy! If success costs 10 years, then I will go through it patiently, as big investors have plans for 100-500 years ahead! CRYPTO is the future I believe! Salaries are already being paid in crypto! The classic financial system migrates year by year into the CRYPTO system! I support that all those who are seriously willing to study the CRYPTO world will become millionaires in the coming decades! I have emotions writing this article, but honestly I wanted to express myself, and to create something new on my channel! To tell you honestly I am a little afraid that the article will gather 5k views and 10 likes! But if you don’t take risks you have no way to find out anything! I hope there will be peace in the world and to go through the next 9 years the same way I went through 2024-25! I wish you success in all activities you have and which you will start! Believe in yourselves to the MAXIMUM! Be courageous! Respect the plan day by day! Binance Square is the platform where proposed objectives can become reality! Thank you for your attention! You are welcome in my community! Success to everyone!
#cryptozidezi
Well let me try to explain! As you can see in the screenshots, in 12 months I generated 686 USDT, that is 68.41% increase to capital! Curious how many people will appreciate this post! So +68.41% in 12 months, ok, but how much money did I lose, namely commissions, liquidations! I fixed 152 USDT in 12 months of activity, that is -15.28% relative to capital! So the real profit is +534 USDT, that is +53% increase to capital in 12 months! If I had capital of 1M, exactly the same results would be, the strategy does not change, only the numbers change proportionally! I think you understand what I mean! I fixed on plus 221 positions and I fixed on minus only 7 positions on my copy-trading account in 12 months! Would you have the patience to work 12 months for +53% increase to capital? The second year of the challenge started on 18.12.25, but already in rotation there are 1534 USDT! On 18.12.26 I aim to have in rotation 3000 USDT! At the moment I am stuck in minus on all open positions! I hold 28 positions in LONG as ALSEZON was expected! I am patient and optimistic and I respect the strategy! If success costs 10 years, then I will go through it patiently, as big investors have plans for 100-500 years ahead! CRYPTO is the future I believe! Salaries are already being paid in crypto! The classic financial system migrates year by year into the CRYPTO system! I support that all those who are seriously willing to study the CRYPTO world will become millionaires in the coming decades! I have emotions writing this article, but honestly I wanted to express myself, and to create something new on my channel! To tell you honestly I am a little afraid that the article will gather 5k views and 10 likes! But if you don’t take risks you have no way to find out anything! I hope there will be peace in the world and to go through the next 9 years the same way I went through 2024-25! I wish you success in all activities you have and which you will start! Believe in yourselves to the MAXIMUM! Be courageous! Respect the plan day by day! Binance Square is the platform where proposed objectives can become reality! Thank you for your attention! You are welcome in my community! Success to everyone!
#cryptozidezi
79
21
262
9.3k
Article
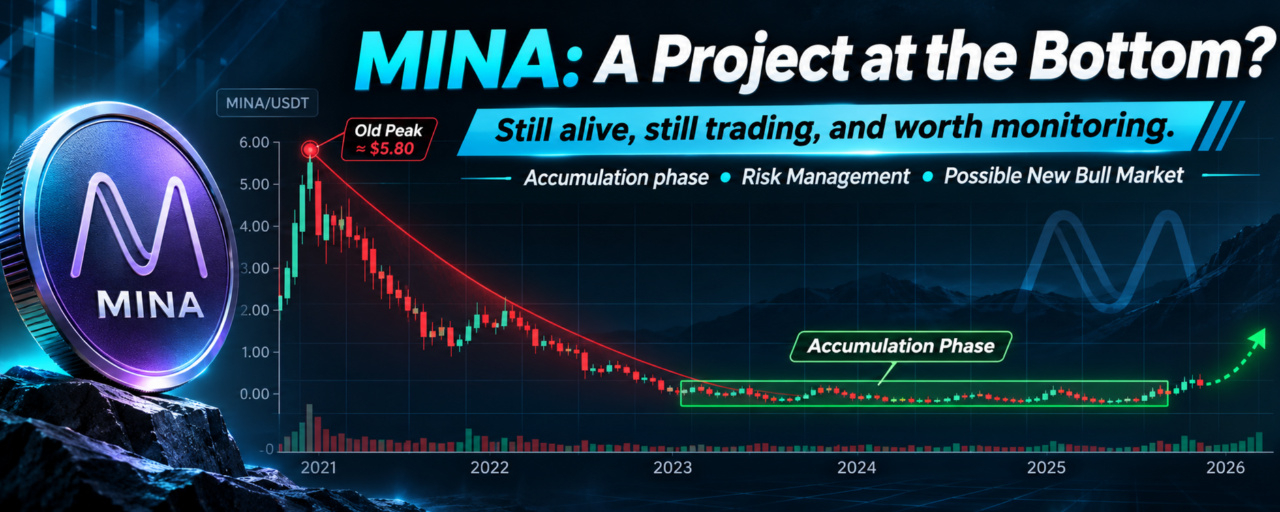
MINA: 6 Years Without a New All-Time High – Is the Bottom Finally In or Is More Pain Ahead?The $MINA project is currently at a rather interesting stage. It looked like it was finally about to take off, but after barely lifting off the ground, it quickly came crashing back down!
As for my current position, I genuinely believed I had secured an excellent entry price during the week I opened it. But look at it now — my position is in the red, and the project continues to lose value.
Image No. 1
Can you imagine? During its very first month of trading, the MINA token reached a price of nearly $19 per coin! And what’s particularly interesting is how dramatically its price collapsed afterward.
Image No. 2
MINA experienced a 1,700% increase, which is extremely modest compared to other crypto projects that have surged by 39,000% or even more!
The project has been active for 6 years, and it has also been approximately 6 years since it last renewed its GLOBAL ALL-TIME HIGH or GLOBAL RESISTANCE LEVEL.
Can you imagine how long the team behind this project is making investors wait, especially those who remain trapped in positions opened at prices of $10 or below?
Without averaging down their positions, I honestly have no idea when these investors will even be able to break even and recover their initial capital!
Image No. 3
The MINA project has already lost almost as much value as one could imagine. I’m personally curious to see what the future holds for this project. Will it really continue falling until it reaches the lowest possible price level?
The important thing is that the project is still alive and breathing! It continues to be actively traded, and there are currently no warnings indicating that it is about to be delisted, has been hacked, or is shutting down!
Image No. 4
The MINA project is approaching two years of trading at extremely low price levels, with increasingly limited room for further downward movement. It seems as though it has finally hit the wall or reached the very bottom!
In my opinion, this could be an interesting opportunity to buy and closely monitor the project’s future price movements!
Image No. 5
I cannot influence the market with the size of my positions, but I can certainly observe and admire how the big players create candlesticks and shape market trends that can last for many years.
I also hold another position in MINA, but at a more favorable entry price. I sincerely hope that within the next six months, we will witness a new BULL MARKET for this project!
Image No. 6
In conclusion, as I always say, a trading strategy must work hand in hand with Risk Management and Money Management.
Crypto projects come and go, but capital must always be diversified. You cannot place more trust in one project than in all the others!
I wish everyone continued success!
As for me, I will continue managing my positions according to my strategy, because I am a Conservative Trader, and patience, discipline, and proper capital management remain my priorities.
Best regards,
Adrian (cryptozidezi)
#cryptozidezi $MINA
{future}(MINAUSDT)
MINA: 6 Years Without a New All-Time High – Is the Bottom Finally In or Is More Pain Ahead?
The $MINA project is currently at a rather interesting stage. It looked like it was finally about to take off, but after barely lifting off the ground, it quickly came crashing back down!
As for my current position, I genuinely believed I had secured an excellent entry price during the week I opened it. But look at it now — my position is in the red, and the project continues to lose value.
Image No. 1
Can you imagine? During its very first month of trading, the MINA token reached a price of nearly $19 per coin! And what’s particularly interesting is how dramatically its price collapsed afterward.
Image No. 2
MINA experienced a 1,700% increase, which is extremely modest compared to other crypto projects that have surged by 39,000% or even more!
The project has been active for 6 years, and it has also been approximately 6 years since it last renewed its GLOBAL ALL-TIME HIGH or GLOBAL RESISTANCE LEVEL.
Can you imagine how long the team behind this project is making investors wait, especially those who remain trapped in positions opened at prices of $10 or below?
Without averaging down their positions, I honestly have no idea when these investors will even be able to break even and recover their initial capital!
Image No. 3
The MINA project has already lost almost as much value as one could imagine. I’m personally curious to see what the future holds for this project. Will it really continue falling until it reaches the lowest possible price level?
The important thing is that the project is still alive and breathing! It continues to be actively traded, and there are currently no warnings indicating that it is about to be delisted, has been hacked, or is shutting down!
Image No. 4
The MINA project is approaching two years of trading at extremely low price levels, with increasingly limited room for further downward movement. It seems as though it has finally hit the wall or reached the very bottom!
In my opinion, this could be an interesting opportunity to buy and closely monitor the project’s future price movements!
Image No. 5
I cannot influence the market with the size of my positions, but I can certainly observe and admire how the big players create candlesticks and shape market trends that can last for many years.
I also hold another position in MINA, but at a more favorable entry price. I sincerely hope that within the next six months, we will witness a new BULL MARKET for this project!
Image No. 6
In conclusion, as I always say, a trading strategy must work hand in hand with Risk Management and Money Management.
Crypto projects come and go, but capital must always be diversified. You cannot place more trust in one project than in all the others!
I wish everyone continued success!
As for me, I will continue managing my positions according to my strategy, because I am a Conservative Trader, and patience, discipline, and proper capital management remain my priorities.
Best regards,
Adrian (cryptozidezi)
#cryptozidezi $MINA
As for my current position, I genuinely believed I had secured an excellent entry price during the week I opened it. But look at it now — my position is in the red, and the project continues to lose value.
Image No. 1
Can you imagine? During its very first month of trading, the MINA token reached a price of nearly $19 per coin! And what’s particularly interesting is how dramatically its price collapsed afterward.
Image No. 2
MINA experienced a 1,700% increase, which is extremely modest compared to other crypto projects that have surged by 39,000% or even more!
The project has been active for 6 years, and it has also been approximately 6 years since it last renewed its GLOBAL ALL-TIME HIGH or GLOBAL RESISTANCE LEVEL.
Can you imagine how long the team behind this project is making investors wait, especially those who remain trapped in positions opened at prices of $10 or below?
Without averaging down their positions, I honestly have no idea when these investors will even be able to break even and recover their initial capital!
Image No. 3
The MINA project has already lost almost as much value as one could imagine. I’m personally curious to see what the future holds for this project. Will it really continue falling until it reaches the lowest possible price level?
The important thing is that the project is still alive and breathing! It continues to be actively traded, and there are currently no warnings indicating that it is about to be delisted, has been hacked, or is shutting down!
Image No. 4
The MINA project is approaching two years of trading at extremely low price levels, with increasingly limited room for further downward movement. It seems as though it has finally hit the wall or reached the very bottom!
In my opinion, this could be an interesting opportunity to buy and closely monitor the project’s future price movements!
Image No. 5
I cannot influence the market with the size of my positions, but I can certainly observe and admire how the big players create candlesticks and shape market trends that can last for many years.
I also hold another position in MINA, but at a more favorable entry price. I sincerely hope that within the next six months, we will witness a new BULL MARKET for this project!
Image No. 6
In conclusion, as I always say, a trading strategy must work hand in hand with Risk Management and Money Management.
Crypto projects come and go, but capital must always be diversified. You cannot place more trust in one project than in all the others!
I wish everyone continued success!
As for me, I will continue managing my positions according to my strategy, because I am a Conservative Trader, and patience, discipline, and proper capital management remain my priorities.
Best regards,
Adrian (cryptozidezi)
#cryptozidezi $MINA
530
Article
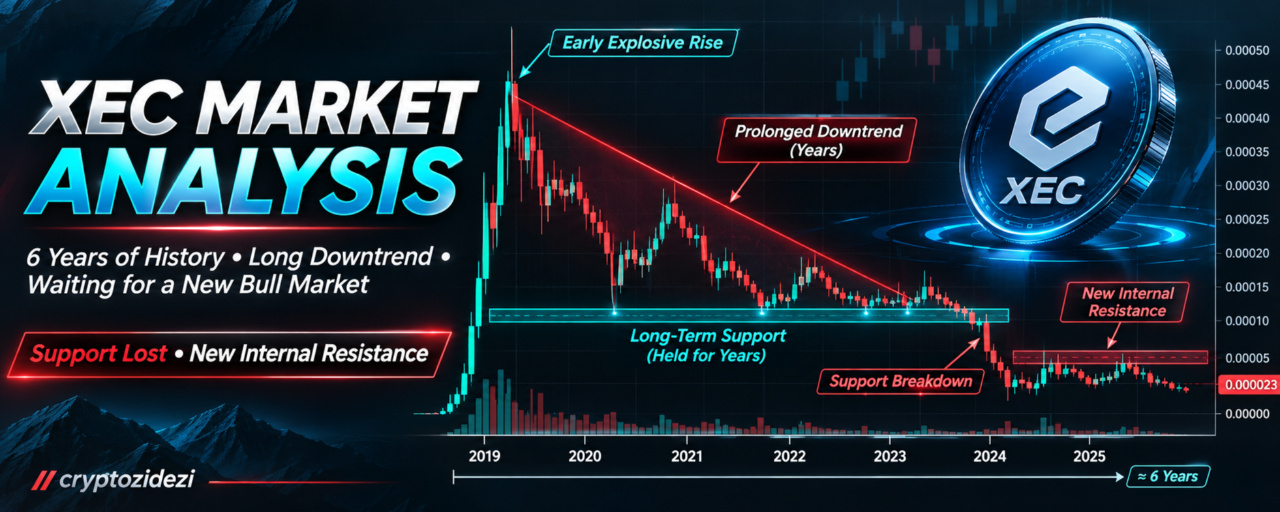
XEC MARKET ANALYSIS – 6 Years of Decline, Lost Historical Support, and the Wait for a New BULL MARKEThe XEC project also has a fairly solid infrastructure, but did you know that it has already been operating for almost 6 years?
Or that its value has been declining for approximately 6 years? Year after year, XEC keeps getting cheaper and cheaper, and its GLOBAL RESISTANCE has never been broken!
Can you imagine how investors who have been waiting for a strong BULL MARKET for the past 5 years must feel?
Take a look at Image 1.
And do you know what one of the most interesting moments in this project's history is?
During its first two months of existence, the project recorded an incredible 39,000% increase!
This means that the early investors who supported the project before its launch must have found it extremely difficult not to sell their tokens at such an attractive price.
You can calculate it yourselves: how much would you have earned if you had invested $100 or $1,000 and achieved a 39,000% return on your initial capital?
This could explain why the project keeps losing value year after year.
In my opinion, it is possible that the early investors reached some kind of agreement not to sell all their tokens at once, as doing so could have caused the project to collapse within just 24 hours.
Of course, this is only my personal theory, but if such coordination actually took place, it would suggest a highly professional approach to gradually distributing their holdings.
Take a look at Image 2.
The next interesting point is that, over a period of 3 years, an ARTIFICIAL SUPPORT level appears to have been established to attract retail investors, only for the price to collapse afterward, potentially allowing other investors to gradually withdraw their funds in a controlled and protected manner.
On May 19, 2025, the project established a new INTERNAL RESISTANCE zone, suggesting that the support level which had held for 3 years was now completely broken.
All those who purchased XEC during that period are currently facing losses of more than 80% of their invested capital.
Take a look at Image 3.
I opened my first position in the support zone, and at this point, all I can do is continue managing my position and averaging down until the day a new BULL MARKET arrives!
I currently hold two positions. I decided that averaging down my first position was not worth it, as I could potentially generate profits by opening a new position on a separate account.
And that is exactly what happened! I managed to take profits several times, and I now have a better entry price.
However, if the price continues to collapse, I may need to open another position on a different account, as averaging down existing positions is much more expensive than opening a new one!
In conclusion, for all of us ordinary traders and investors who do not have enough capital to influence the market, the best we can do is continue following our trading strategies while strictly respecting MONEY MANAGEMENT and RISK MANAGEMENT principles.
After all, there is a lot of mathematics involved in the world of cryptocurrencies, and I believe that those who have patience and a solid strategy are the ones who ultimately succeed!
I wish you all continued success!
Best regards,
Adrian (cryptozidezi)
#cryptozidezi
[Access is available for 3 years!](https://app.binance.com/uni-qr/4GBarouP)
XEC MARKET ANALYSIS – 6 Years of Decline, Lost Historical Support, and the Wait for a New BULL MARKE
The XEC project also has a fairly solid infrastructure, but did you know that it has already been operating for almost 6 years?
Or that its value has been declining for approximately 6 years? Year after year, XEC keeps getting cheaper and cheaper, and its GLOBAL RESISTANCE has never been broken!
Can you imagine how investors who have been waiting for a strong BULL MARKET for the past 5 years must feel?
Take a look at Image 1.
And do you know what one of the most interesting moments in this project's history is?
During its first two months of existence, the project recorded an incredible 39,000% increase!
This means that the early investors who supported the project before its launch must have found it extremely difficult not to sell their tokens at such an attractive price.
You can calculate it yourselves: how much would you have earned if you had invested $100 or $1,000 and achieved a 39,000% return on your initial capital?
This could explain why the project keeps losing value year after year.
In my opinion, it is possible that the early investors reached some kind of agreement not to sell all their tokens at once, as doing so could have caused the project to collapse within just 24 hours.
Of course, this is only my personal theory, but if such coordination actually took place, it would suggest a highly professional approach to gradually distributing their holdings.
Take a look at Image 2.
The next interesting point is that, over a period of 3 years, an ARTIFICIAL SUPPORT level appears to have been established to attract retail investors, only for the price to collapse afterward, potentially allowing other investors to gradually withdraw their funds in a controlled and protected manner.
On May 19, 2025, the project established a new INTERNAL RESISTANCE zone, suggesting that the support level which had held for 3 years was now completely broken.
All those who purchased XEC during that period are currently facing losses of more than 80% of their invested capital.
Take a look at Image 3.
I opened my first position in the support zone, and at this point, all I can do is continue managing my position and averaging down until the day a new BULL MARKET arrives!
I currently hold two positions. I decided that averaging down my first position was not worth it, as I could potentially generate profits by opening a new position on a separate account.
And that is exactly what happened! I managed to take profits several times, and I now have a better entry price.
However, if the price continues to collapse, I may need to open another position on a different account, as averaging down existing positions is much more expensive than opening a new one!
In conclusion, for all of us ordinary traders and investors who do not have enough capital to influence the market, the best we can do is continue following our trading strategies while strictly respecting MONEY MANAGEMENT and RISK MANAGEMENT principles.
After all, there is a lot of mathematics involved in the world of cryptocurrencies, and I believe that those who have patience and a solid strategy are the ones who ultimately succeed!
I wish you all continued success!
Best regards,
Adrian (cryptozidezi)
#cryptozidezi
Access is available for 3 years!
Or that its value has been declining for approximately 6 years? Year after year, XEC keeps getting cheaper and cheaper, and its GLOBAL RESISTANCE has never been broken!
Can you imagine how investors who have been waiting for a strong BULL MARKET for the past 5 years must feel?
Take a look at Image 1.
And do you know what one of the most interesting moments in this project's history is?
During its first two months of existence, the project recorded an incredible 39,000% increase!
This means that the early investors who supported the project before its launch must have found it extremely difficult not to sell their tokens at such an attractive price.
You can calculate it yourselves: how much would you have earned if you had invested $100 or $1,000 and achieved a 39,000% return on your initial capital?
This could explain why the project keeps losing value year after year.
In my opinion, it is possible that the early investors reached some kind of agreement not to sell all their tokens at once, as doing so could have caused the project to collapse within just 24 hours.
Of course, this is only my personal theory, but if such coordination actually took place, it would suggest a highly professional approach to gradually distributing their holdings.
Take a look at Image 2.
The next interesting point is that, over a period of 3 years, an ARTIFICIAL SUPPORT level appears to have been established to attract retail investors, only for the price to collapse afterward, potentially allowing other investors to gradually withdraw their funds in a controlled and protected manner.
On May 19, 2025, the project established a new INTERNAL RESISTANCE zone, suggesting that the support level which had held for 3 years was now completely broken.
All those who purchased XEC during that period are currently facing losses of more than 80% of their invested capital.
Take a look at Image 3.
I opened my first position in the support zone, and at this point, all I can do is continue managing my position and averaging down until the day a new BULL MARKET arrives!
I currently hold two positions. I decided that averaging down my first position was not worth it, as I could potentially generate profits by opening a new position on a separate account.
And that is exactly what happened! I managed to take profits several times, and I now have a better entry price.
However, if the price continues to collapse, I may need to open another position on a different account, as averaging down existing positions is much more expensive than opening a new one!
In conclusion, for all of us ordinary traders and investors who do not have enough capital to influence the market, the best we can do is continue following our trading strategies while strictly respecting MONEY MANAGEMENT and RISK MANAGEMENT principles.
After all, there is a lot of mathematics involved in the world of cryptocurrencies, and I believe that those who have patience and a solid strategy are the ones who ultimately succeed!
I wish you all continued success!
Best regards,
Adrian (cryptozidezi)
#cryptozidezi
Access is available for 3 years!
1
1
5
2k
·
--
Bullish
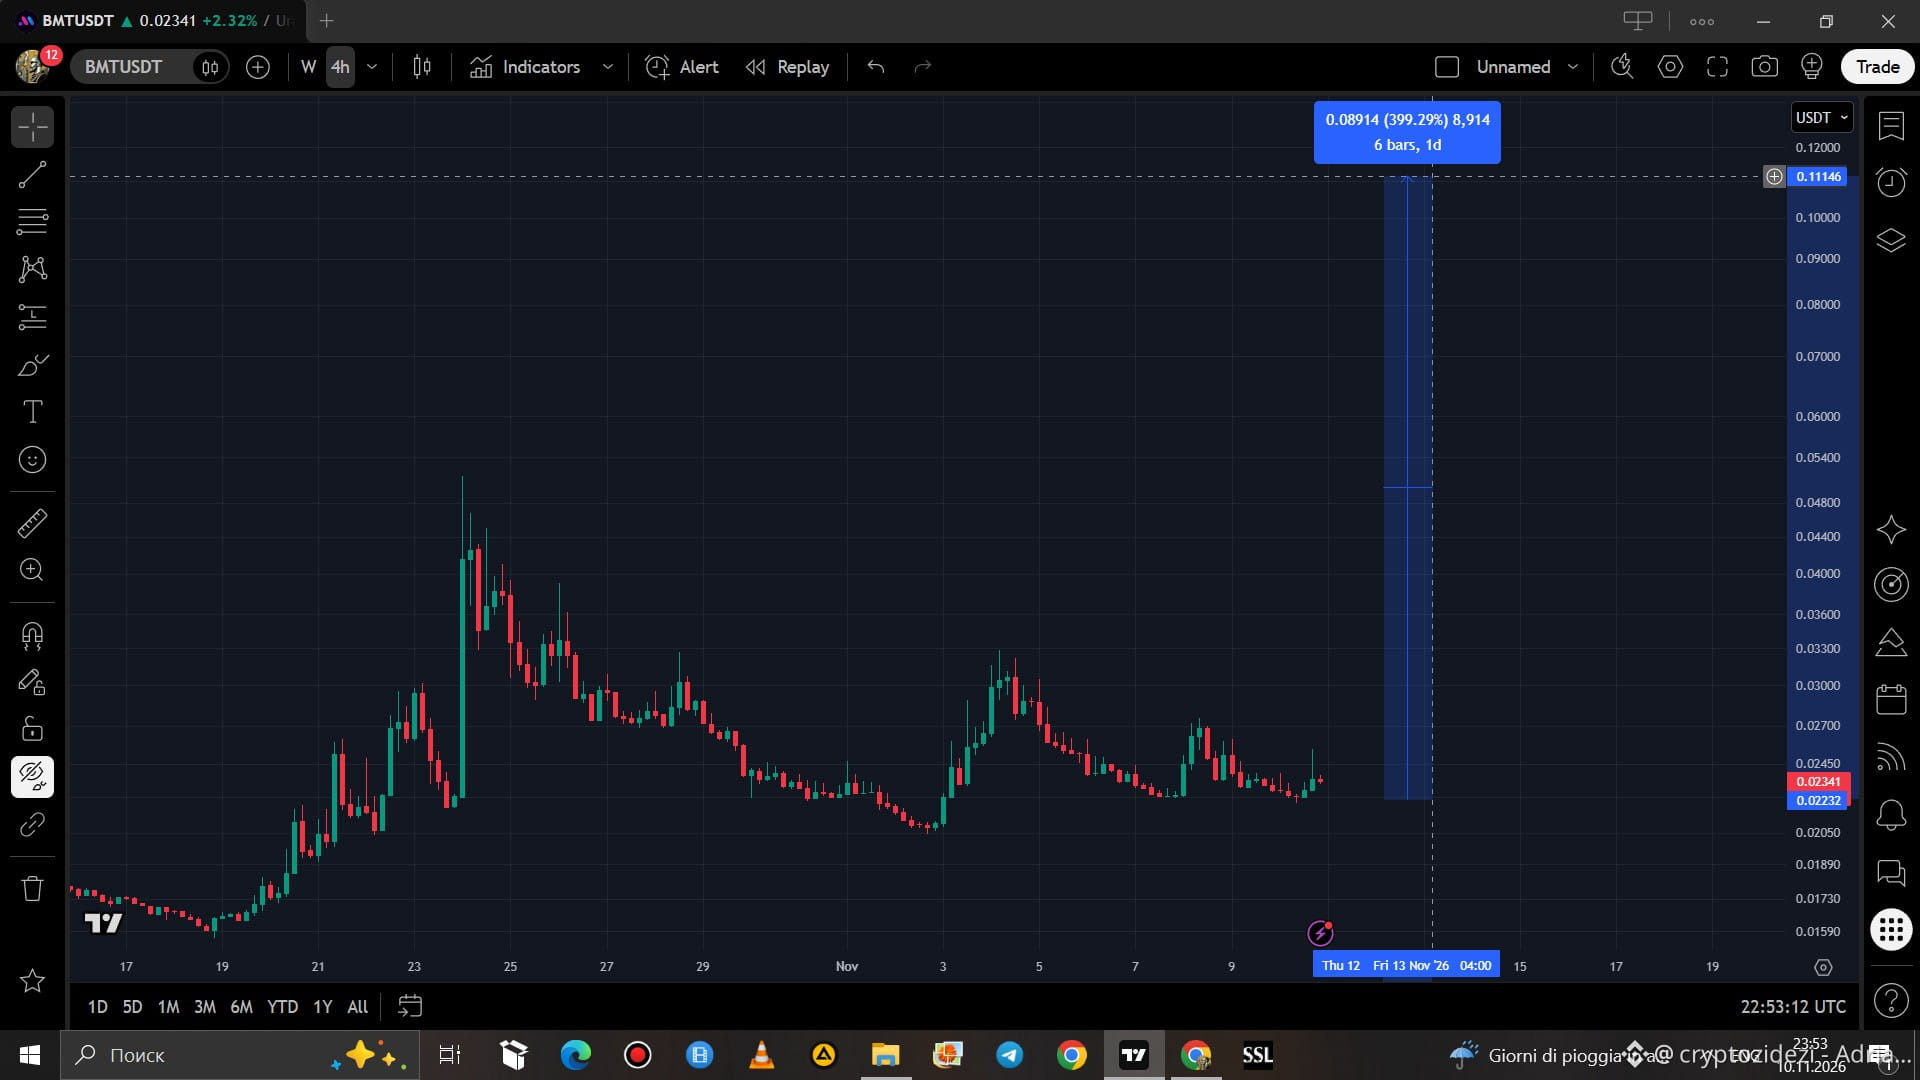
It's already 11:54 PM here, and I'm still monitoring $BMT . Have you noticed the interesting chart formation we're seeing right now?
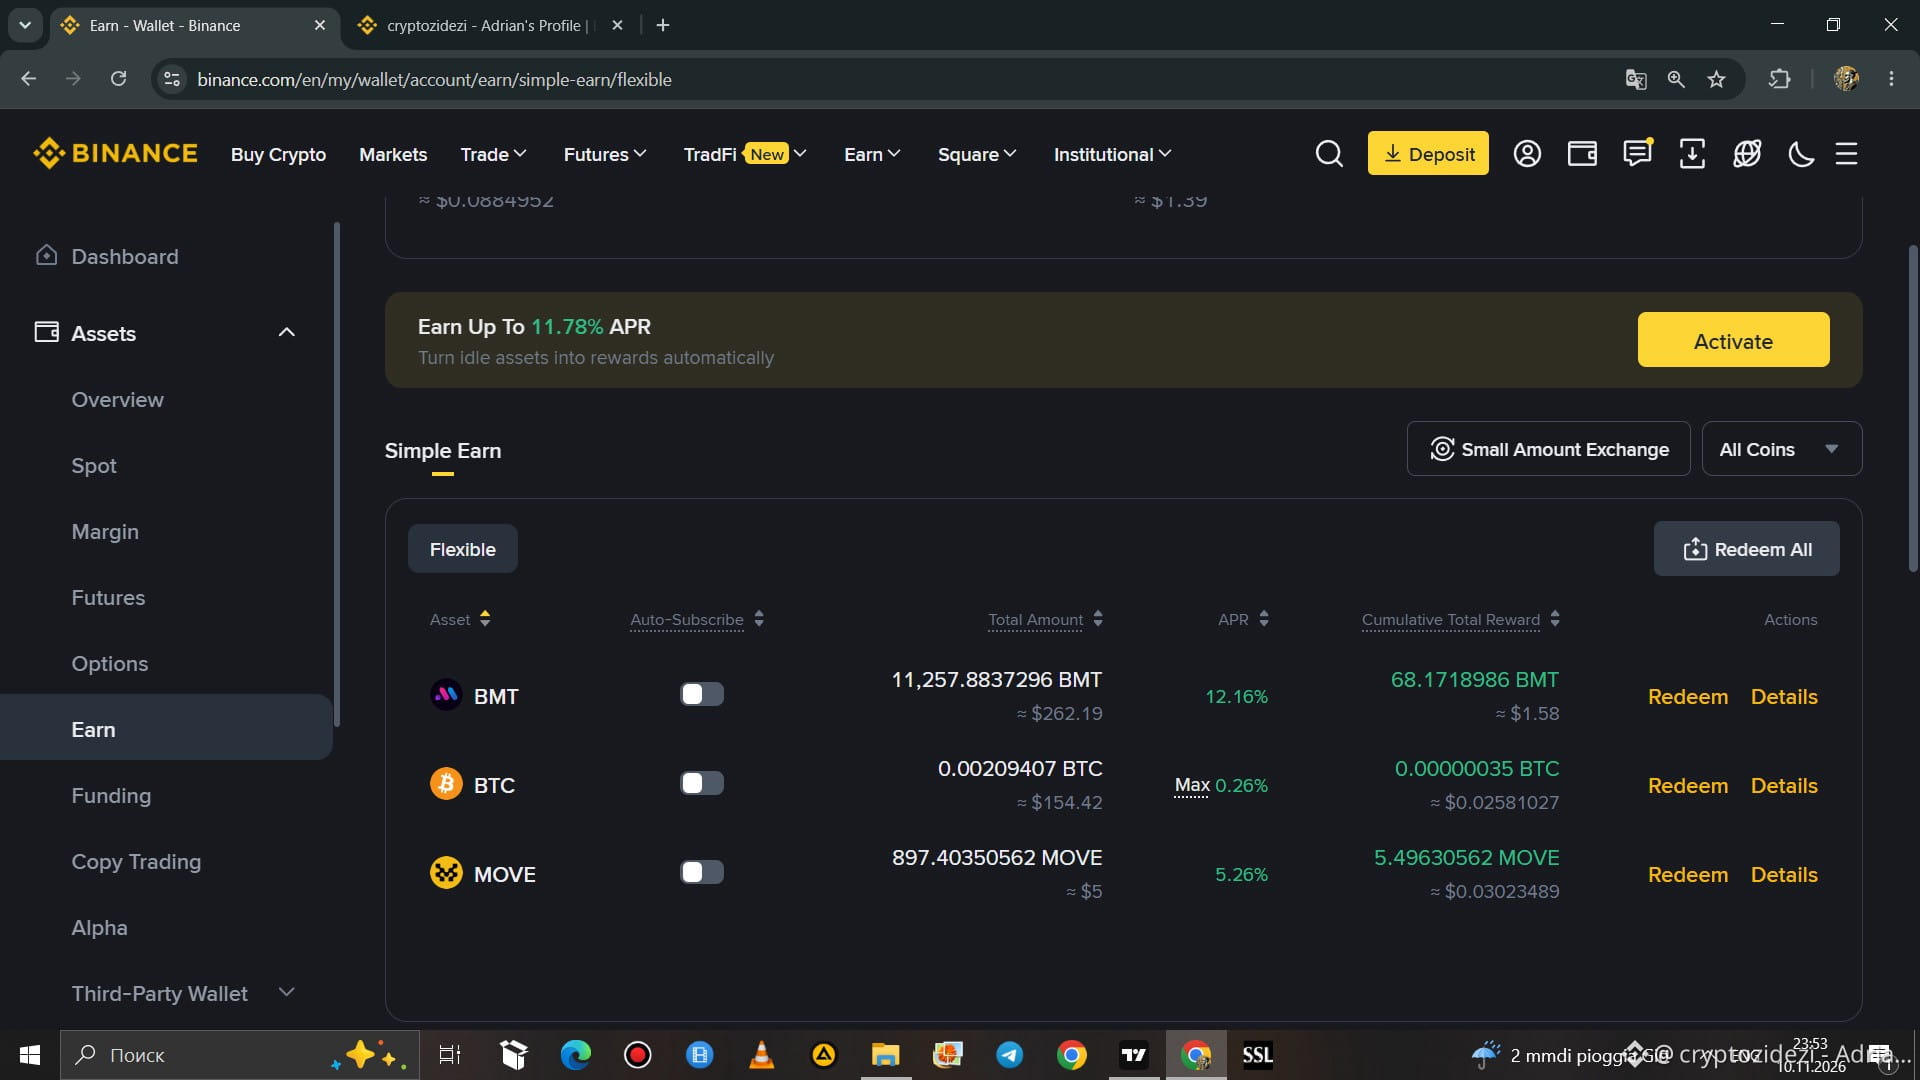
I currently hold 11,257 BMT tokens, and I believe we could see a 400% price increase in the near future.
Furthermore, I believe this project has the potential to enter a massive BULL MARKET, with gains exceeding 10,000% over the next 3–5 months!
Whenever I create a post, video, or article, I always present something real — my actual positions on FUTURES or SPOT.
I wouldn't feel comfortable sharing my opinion about a crypto project if I didn't personally hold it in my portfolio.
These are my personal expectations, not guaranteed outcomes.
I wish everyone success!
Best regards,
Adrian (cryptozidezi)
#cryptozidezi
It's already 11:54 PM here, and I'm still monitoring $BMT . Have you noticed the interesting chart formation we're seeing right now?
I currently hold 11,257 BMT tokens, and I believe we could see a 400% price increase in the near future.
Furthermore, I believe this project has the potential to enter a massive BULL MARKET, with gains exceeding 10,000% over the next 3–5 months!
Whenever I create a post, video, or article, I always present something real — my actual positions on FUTURES or SPOT.
I wouldn't feel comfortable sharing my opinion about a crypto project if I didn't personally hold it in my portfolio.
These are my personal expectations, not guaranteed outcomes.
I wish everyone success!
Best regards,
Adrian (cryptozidezi)
#cryptozidezi
I currently hold 11,257 BMT tokens, and I believe we could see a 400% price increase in the near future.
Furthermore, I believe this project has the potential to enter a massive BULL MARKET, with gains exceeding 10,000% over the next 3–5 months!
Whenever I create a post, video, or article, I always present something real — my actual positions on FUTURES or SPOT.
I wouldn't feel comfortable sharing my opinion about a crypto project if I didn't personally hold it in my portfolio.
These are my personal expectations, not guaranteed outcomes.
I wish everyone success!
Best regards,
Adrian (cryptozidezi)
#cryptozidezi
2
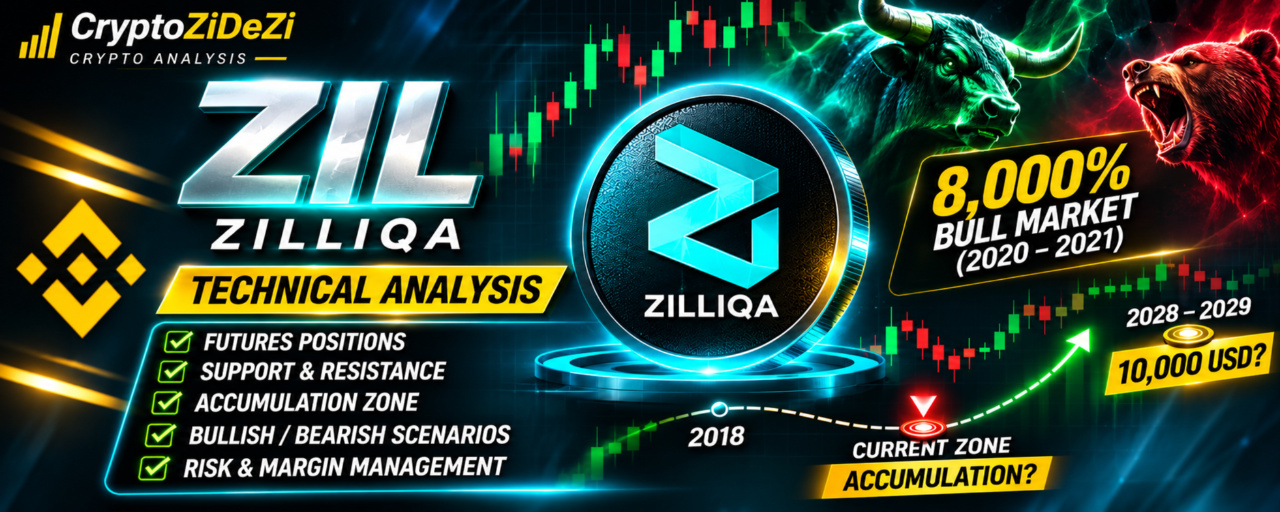
1.4k
Article
ZIL – Analysis of My Futures LONG Positions and the Project's Outlook for 2027–2029The $ZIL (Zilliqa) project was trading at a fairly attractive price when I started accumulating my first LONG position.
But here's something interesting: no matter how attractive an entry price may seem, it does not necessarily mean you will make a profit in the coming months.
A low price does not automatically guarantee a profitable investment!
Image No. 1
Today, I want to discuss my Futures positions in ZIL, as I currently hold two LONG positions!
Some time after opening my first position, I decided to buy again, but this time using a different trading account.
From my perspective, this decision made strategic sense. Instead of increasing my first position to reduce its average entry price, I preferred to open a second LONG position at an even more attractive price.
As a result, I now have two separate positions with different entry prices, which I can manage independently.
At the moment, both positions remain open, with no additional adjustments.
Of course, this approach does not eliminate the risks associated with Futures trading.
Image No. 2
What Do We Know About ZIL/USDT?
The Zilliqa project began its journey in January 2018, giving it a history of almost nine years.
During this period, ZIL has experienced several market cycles, accumulation phases, spectacular rallies, and extremely sharp corrections.
Image No. 3
ZIL's Golden Era
One of the most fascinating periods for me remains 2020–2021, when ZIL entered a spectacular BULL MARKET, recording an increase of more than 8,000%, according to my chart analysis.
I believe many investors made significant profits during that period, while others probably lost money by buying at excessively high prices.
In my opinion, that was ZIL's true golden era!
And here's the interesting part: since then, the project has never managed to repeat such an extraordinary performance.
We can observe similar behavior in many other cryptocurrency projects. After experiencing their first spectacular BULL MARKET, some never manage to achieve the same percentage gains again.
This leads me to believe that, over time, their market cycles become somewhat easier to analyze, even though future price movements remain unpredictable.
Image No. 4
Five Years of Declining Prices. Are We Approaching the End?
For approximately five years, ZIL has continued to lose value.
However, I have noticed an interesting detail: over the past two years, the pace of decline appears to have slowed compared to the earlier stages of this BEAR MARKET.
From my perspective, this behavior could suggest that we are approaching an important stage in the current market cycle.
But there are two completely different scenarios to consider!
Scenario One: ZIL enters a long-term accumulation zone where its price stabilizes before eventually beginning another BULL MARKET. In an extremely optimistic scenario, we could even witness gains of 3,000% or 8,000%.
Scenario Two: The project continues to lose value, investor interest gradually declines, liquidity disappears, and ZIL faces the risk of being delisted or losing its relevance.
In other words, we may either be witnessing the preparation for another spectacular market cycle or approaching the end of a story that began in 2018.
Both possibilities must be taken seriously!
Image No. 5
Global Support, Internal Resistance, and Historical Price Levels
For more than four years, ZIL has continued moving farther away from its INTERNAL RESISTANCE zone.
At the same time, GLOBAL SUPPORT has represented an important price level for several years.
However, if you carefully examine the current chart, you will notice that ZIL is trading very close to its historical lows.
Essentially, we are approaching what I symbolically call the "factory price."
From my perspective, this area deserves attention as a potential SPOT accumulation opportunity, provided that risks are properly managed.
However, being close to historical lows does not mean the price cannot fall even further.
If the project eventually enters a new BULL MARKET, it is possible that five or eight years from now, we may look back at today's prices as a historical opportunity.
Of course, that would only be possible if ZIL continues to exist and remains actively traded in the market!
Image No. 6
My SPOT Investment and Outlook for 2028–2029
To conclude, I can say that this project has already given me a unique experience.
I have rarely had the opportunity to closely observe a cryptocurrency that was once worth so much gradually return, after years of declining prices, to levels near its earliest trading prices.
Personally, I have also decided to purchase ZIL tokens on the SPOT market, investing approximately $100.
Perhaps by 2028 or 2029, this investment could be worth $10,000!
That would represent a 100x return on my initial investment—an extremely optimistic scenario, but certainly not a guaranteed outcome.
However, my strategy does not necessarily involve holding these tokens without taking any action.
If the project begins to recover and I observe, for example, a 300% price increase, I will evaluate the possibility of taking profits.
Afterward, if the market provides another opportunity, I may buy again at lower prices and continue applying trading strategies to take advantage of price movements.
My objective is to benefit from the project's volatility rather than blindly wait for an extraordinary rally.
Of course, everything depends on market liquidity, the project's development, and whether ZIL remains listed and active over the coming years.
My Final Thoughts
For me, ZIL represents an interesting experiment in long-term investing and position management.
I do not know whether the project will experience another spectacular BULL MARKET or continue losing value.
What I do know is that I will continue monitoring the charts, analyzing price movements, and adjusting my strategy according to market conditions.
Patience, capital management, and discipline remain essential parts of my trading approach.
I wish everyone success and all the best!
Best regards,
Adrian (CryptoZiDeZi)
#cryptozidezi
18+ | Financial Risk Warning
This content is provided for educational and informational purposes only and does not constitute financial advice. Cryptocurrency trading, especially leveraged Futures trading, involves substantial risk, including the potential loss of your entire invested capital.
ZIL – Analysis of My Futures LONG Positions and the Project's Outlook for 2027–2029
The $ZIL (Zilliqa) project was trading at a fairly attractive price when I started accumulating my first LONG position.
But here's something interesting: no matter how attractive an entry price may seem, it does not necessarily mean you will make a profit in the coming months.
A low price does not automatically guarantee a profitable investment!
Image No. 1
Today, I want to discuss my Futures positions in ZIL, as I currently hold two LONG positions!
Some time after opening my first position, I decided to buy again, but this time using a different trading account.
From my perspective, this decision made strategic sense. Instead of increasing my first position to reduce its average entry price, I preferred to open a second LONG position at an even more attractive price.
As a result, I now have two separate positions with different entry prices, which I can manage independently.
At the moment, both positions remain open, with no additional adjustments.
Of course, this approach does not eliminate the risks associated with Futures trading.
Image No. 2
What Do We Know About ZIL/USDT?
The Zilliqa project began its journey in January 2018, giving it a history of almost nine years.
During this period, ZIL has experienced several market cycles, accumulation phases, spectacular rallies, and extremely sharp corrections.
Image No. 3
ZIL's Golden Era
One of the most fascinating periods for me remains 2020–2021, when ZIL entered a spectacular BULL MARKET, recording an increase of more than 8,000%, according to my chart analysis.
I believe many investors made significant profits during that period, while others probably lost money by buying at excessively high prices.
In my opinion, that was ZIL's true golden era!
And here's the interesting part: since then, the project has never managed to repeat such an extraordinary performance.
We can observe similar behavior in many other cryptocurrency projects. After experiencing their first spectacular BULL MARKET, some never manage to achieve the same percentage gains again.
This leads me to believe that, over time, their market cycles become somewhat easier to analyze, even though future price movements remain unpredictable.
Image No. 4
Five Years of Declining Prices. Are We Approaching the End?
For approximately five years, ZIL has continued to lose value.
However, I have noticed an interesting detail: over the past two years, the pace of decline appears to have slowed compared to the earlier stages of this BEAR MARKET.
From my perspective, this behavior could suggest that we are approaching an important stage in the current market cycle.
But there are two completely different scenarios to consider!
Scenario One: ZIL enters a long-term accumulation zone where its price stabilizes before eventually beginning another BULL MARKET. In an extremely optimistic scenario, we could even witness gains of 3,000% or 8,000%.
Scenario Two: The project continues to lose value, investor interest gradually declines, liquidity disappears, and ZIL faces the risk of being delisted or losing its relevance.
In other words, we may either be witnessing the preparation for another spectacular market cycle or approaching the end of a story that began in 2018.
Both possibilities must be taken seriously!
Image No. 5
Global Support, Internal Resistance, and Historical Price Levels
For more than four years, ZIL has continued moving farther away from its INTERNAL RESISTANCE zone.
At the same time, GLOBAL SUPPORT has represented an important price level for several years.
However, if you carefully examine the current chart, you will notice that ZIL is trading very close to its historical lows.
Essentially, we are approaching what I symbolically call the "factory price."
From my perspective, this area deserves attention as a potential SPOT accumulation opportunity, provided that risks are properly managed.
However, being close to historical lows does not mean the price cannot fall even further.
If the project eventually enters a new BULL MARKET, it is possible that five or eight years from now, we may look back at today's prices as a historical opportunity.
Of course, that would only be possible if ZIL continues to exist and remains actively traded in the market!
Image No. 6
My SPOT Investment and Outlook for 2028–2029
To conclude, I can say that this project has already given me a unique experience.
I have rarely had the opportunity to closely observe a cryptocurrency that was once worth so much gradually return, after years of declining prices, to levels near its earliest trading prices.
Personally, I have also decided to purchase ZIL tokens on the SPOT market, investing approximately $100.
Perhaps by 2028 or 2029, this investment could be worth $10,000!
That would represent a 100x return on my initial investment—an extremely optimistic scenario, but certainly not a guaranteed outcome.
However, my strategy does not necessarily involve holding these tokens without taking any action.
If the project begins to recover and I observe, for example, a 300% price increase, I will evaluate the possibility of taking profits.
Afterward, if the market provides another opportunity, I may buy again at lower prices and continue applying trading strategies to take advantage of price movements.
My objective is to benefit from the project's volatility rather than blindly wait for an extraordinary rally.
Of course, everything depends on market liquidity, the project's development, and whether ZIL remains listed and active over the coming years.
My Final Thoughts
For me, ZIL represents an interesting experiment in long-term investing and position management.
I do not know whether the project will experience another spectacular BULL MARKET or continue losing value.
What I do know is that I will continue monitoring the charts, analyzing price movements, and adjusting my strategy according to market conditions.
Patience, capital management, and discipline remain essential parts of my trading approach.
I wish everyone success and all the best!
Best regards,
Adrian (CryptoZiDeZi)
#cryptozidezi
18+ | Financial Risk Warning
This content is provided for educational and informational purposes only and does not constitute financial advice. Cryptocurrency trading, especially leveraged Futures trading, involves substantial risk, including the potential loss of your entire invested capital.
But here's something interesting: no matter how attractive an entry price may seem, it does not necessarily mean you will make a profit in the coming months.
A low price does not automatically guarantee a profitable investment!
Image No. 1
Today, I want to discuss my Futures positions in ZIL, as I currently hold two LONG positions!
Some time after opening my first position, I decided to buy again, but this time using a different trading account.
From my perspective, this decision made strategic sense. Instead of increasing my first position to reduce its average entry price, I preferred to open a second LONG position at an even more attractive price.
As a result, I now have two separate positions with different entry prices, which I can manage independently.
At the moment, both positions remain open, with no additional adjustments.
Of course, this approach does not eliminate the risks associated with Futures trading.
Image No. 2
What Do We Know About ZIL/USDT?
The Zilliqa project began its journey in January 2018, giving it a history of almost nine years.
During this period, ZIL has experienced several market cycles, accumulation phases, spectacular rallies, and extremely sharp corrections.
Image No. 3
ZIL's Golden Era
One of the most fascinating periods for me remains 2020–2021, when ZIL entered a spectacular BULL MARKET, recording an increase of more than 8,000%, according to my chart analysis.
I believe many investors made significant profits during that period, while others probably lost money by buying at excessively high prices.
In my opinion, that was ZIL's true golden era!
And here's the interesting part: since then, the project has never managed to repeat such an extraordinary performance.
We can observe similar behavior in many other cryptocurrency projects. After experiencing their first spectacular BULL MARKET, some never manage to achieve the same percentage gains again.
This leads me to believe that, over time, their market cycles become somewhat easier to analyze, even though future price movements remain unpredictable.
Image No. 4
Five Years of Declining Prices. Are We Approaching the End?
For approximately five years, ZIL has continued to lose value.
However, I have noticed an interesting detail: over the past two years, the pace of decline appears to have slowed compared to the earlier stages of this BEAR MARKET.
From my perspective, this behavior could suggest that we are approaching an important stage in the current market cycle.
But there are two completely different scenarios to consider!
Scenario One: ZIL enters a long-term accumulation zone where its price stabilizes before eventually beginning another BULL MARKET. In an extremely optimistic scenario, we could even witness gains of 3,000% or 8,000%.
Scenario Two: The project continues to lose value, investor interest gradually declines, liquidity disappears, and ZIL faces the risk of being delisted or losing its relevance.
In other words, we may either be witnessing the preparation for another spectacular market cycle or approaching the end of a story that began in 2018.
Both possibilities must be taken seriously!
Image No. 5
Global Support, Internal Resistance, and Historical Price Levels
For more than four years, ZIL has continued moving farther away from its INTERNAL RESISTANCE zone.
At the same time, GLOBAL SUPPORT has represented an important price level for several years.
However, if you carefully examine the current chart, you will notice that ZIL is trading very close to its historical lows.
Essentially, we are approaching what I symbolically call the "factory price."
From my perspective, this area deserves attention as a potential SPOT accumulation opportunity, provided that risks are properly managed.
However, being close to historical lows does not mean the price cannot fall even further.
If the project eventually enters a new BULL MARKET, it is possible that five or eight years from now, we may look back at today's prices as a historical opportunity.
Of course, that would only be possible if ZIL continues to exist and remains actively traded in the market!
Image No. 6
My SPOT Investment and Outlook for 2028–2029
To conclude, I can say that this project has already given me a unique experience.
I have rarely had the opportunity to closely observe a cryptocurrency that was once worth so much gradually return, after years of declining prices, to levels near its earliest trading prices.
Personally, I have also decided to purchase ZIL tokens on the SPOT market, investing approximately $100.
Perhaps by 2028 or 2029, this investment could be worth $10,000!
That would represent a 100x return on my initial investment—an extremely optimistic scenario, but certainly not a guaranteed outcome.
However, my strategy does not necessarily involve holding these tokens without taking any action.
If the project begins to recover and I observe, for example, a 300% price increase, I will evaluate the possibility of taking profits.
Afterward, if the market provides another opportunity, I may buy again at lower prices and continue applying trading strategies to take advantage of price movements.
My objective is to benefit from the project's volatility rather than blindly wait for an extraordinary rally.
Of course, everything depends on market liquidity, the project's development, and whether ZIL remains listed and active over the coming years.
My Final Thoughts
For me, ZIL represents an interesting experiment in long-term investing and position management.
I do not know whether the project will experience another spectacular BULL MARKET or continue losing value.
What I do know is that I will continue monitoring the charts, analyzing price movements, and adjusting my strategy according to market conditions.
Patience, capital management, and discipline remain essential parts of my trading approach.
I wish everyone success and all the best!
Best regards,
Adrian (CryptoZiDeZi)
#cryptozidezi
18+ | Financial Risk Warning
This content is provided for educational and informational purposes only and does not constitute financial advice. Cryptocurrency trading, especially leveraged Futures trading, involves substantial risk, including the potential loss of your entire invested capital.
1
6
2.2k
$ZIL Technical Analysis: Exploring key support and resistance levels, my LONG Futures position, accumulation zones, and possible bullish or bearish scenarios. Educational content only. Not financial advice.#cryptozidezi
$ZIL Technical Analysis: Exploring key support and resistance levels, my LONG Futures position, accumulation zones, and possible bullish or bearish scenarios. Educational content only. Not financial advice.#cryptozidezi
2
1
10
2k
Article
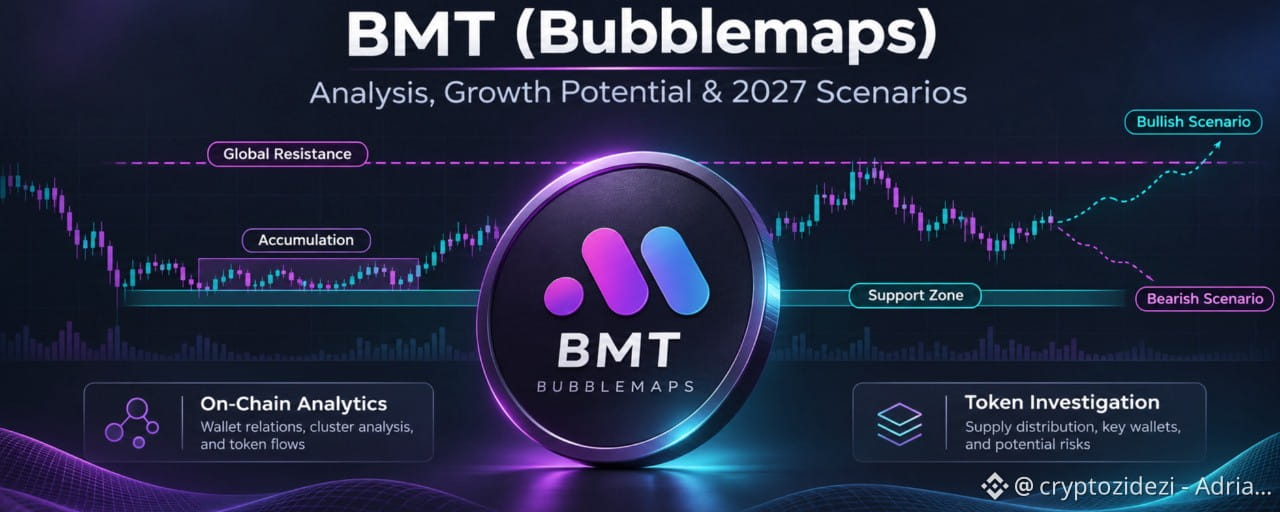
BMT (Bubblemaps) – From a 98% Crash to a Potential Bull Market ?Yesterday, I published an explanatory video about $BMT (Bubblemaps), and today I would like to document my personal opinion in more detail and explain how I see the potential development of this project over the coming months and even years.
First, I want to mention that I already hold a certain amount of BMT tokens. However, my journey with this project did not begin with the volume I currently hold.
Everything started with an initial investment of 150 USDT. Through trading and capital rotation, I managed to increase that amount to 314 USDT, effectively more than doubling my initial capital.
From my perspective, this result demonstrates the importance of capital management, patience, and discipline when trading a volatile crypto project.
More details in Image No. 1.
In March 2027, the BMT token will celebrate its second anniversary.
Looking at its historical chart, we can observe that during its first year, the project experienced a severe BEAR MARKET, losing approximately 98% of its value.
This type of price movement is not unusual in the cryptocurrency industry. Over recent years, numerous projects have experienced extremely aggressive corrections after their initial launches.
Later, the chart began showing attempts at price recovery, including upward movements toward the GLOBAL RESISTANCE LEVEL.
In my opinion, these movements could represent early signs of a potential trend reversal. However, confirming a genuine BULL MARKET requires more than a few bullish price movements.
More details in Image No. 2.
I would like to draw your attention to June and July 2026.
During that period, according to my technical analysis, the price began respecting an important support zone, which was subsequently tested and confirmed.
And this is where things become particularly interesting!
If BMT manages to recover toward its GLOBAL RESISTANCE LEVEL, the theoretical price increase from that support zone could reach approximately 5,000%.
Can you imagine the potential opportunity for market participants who accumulated tokens at extremely low prices?
Of course, this is a technical projection, not a guaranteed return. Such a scenario would require favorable market conditions, sufficient liquidity, and strong buying demand.
A potential BULL MARKET could last up to 12 months, or possibly even less. Everything would depend on market dynamics and investor interest.
More details in Image No. 3.
Now, let's discuss the fundamental side of the project.
Behind the BMT token stands Bubblemaps, a platform specializing in blockchain data analysis and visualization.
The platform allows users to analyze token distributions, connections between wallets, and on-chain activities, including those associated with newly launched crypto projects.
One of its most interesting features is the ability to identify potentially suspicious behavior, large token concentrations, and connections between wallets that may require further investigation.
In practical terms, we could compare part of the platform's functionality to that of a professional investigator who carefully examines available information before reaching conclusions.
These tools can help identify potential risks, although they cannot completely eliminate fraud or guarantee that a project is safe.
And that's not all!
BMT also has utility within the Bubblemaps ecosystem, including access to advanced analytical features and participation in community investigations through Intel Desk.
However, what interests me most is that the platform is already operational and provides real services. It is not simply an idea waiting to be launched.
Naturally, having a functioning product does not automatically guarantee that its token will appreciate in value.
More details in Image No. 4.
To maintain a balanced analysis, we must also consider less favorable scenarios.
It is entirely possible that BMT will fail to break its global resistance and enter another BEAR MARKET.
Another possibility is that the project enters an extended period of hibernation, during which the price continues respecting its last major global support zone while fluctuating within a relatively stable range.
In other words, we could experience a FLAT / SIDEWAYS MARKET, where the price repeatedly moves between support and resistance levels.
Such a period could last one year, two years, or even three years.
For investors expecting quick results, this scenario could become a serious test of patience.
However, we must understand that the market is under no obligation to move according to our expectations.
Regardless of whether BMT enters a new BULL MARKET, continues declining, or remains in a prolonged accumulation phase, I believe we must respect two fundamental principles:
RISK MANAGEMENT and MONEY MANAGEMENT.
Every trader must understand their financial limits, recognize the risks they are taking, and manage their capital according to their personal trading strategy.
We should never abandon a strategy that has consistently delivered results simply because another project appears to offer extraordinary profit potential.
The cryptocurrency market offers opportunities, but it also carries considerable risks.
And an impressive percentage increase on a chart does not automatically translate into realized profits in a trading account.
Personally, I will continue monitoring BMT, analyzing its chart development, and managing my positions according to market conditions.
Patience, discipline, and capital protection remain my priorities.
I wish everyone success!
Respectfully,
Adrian (CryptoZiDeZi)
#cryptozidezi
BMT (Bubblemaps) – From a 98% Crash to a Potential Bull Market ?
Yesterday, I published an explanatory video about $BMT (Bubblemaps), and today I would like to document my personal opinion in more detail and explain how I see the potential development of this project over the coming months and even years.
First, I want to mention that I already hold a certain amount of BMT tokens. However, my journey with this project did not begin with the volume I currently hold.
Everything started with an initial investment of 150 USDT. Through trading and capital rotation, I managed to increase that amount to 314 USDT, effectively more than doubling my initial capital.
From my perspective, this result demonstrates the importance of capital management, patience, and discipline when trading a volatile crypto project.
More details in Image No. 1.
In March 2027, the BMT token will celebrate its second anniversary.
Looking at its historical chart, we can observe that during its first year, the project experienced a severe BEAR MARKET, losing approximately 98% of its value.
This type of price movement is not unusual in the cryptocurrency industry. Over recent years, numerous projects have experienced extremely aggressive corrections after their initial launches.
Later, the chart began showing attempts at price recovery, including upward movements toward the GLOBAL RESISTANCE LEVEL.
In my opinion, these movements could represent early signs of a potential trend reversal. However, confirming a genuine BULL MARKET requires more than a few bullish price movements.
More details in Image No. 2.
I would like to draw your attention to June and July 2026.
During that period, according to my technical analysis, the price began respecting an important support zone, which was subsequently tested and confirmed.
And this is where things become particularly interesting!
If BMT manages to recover toward its GLOBAL RESISTANCE LEVEL, the theoretical price increase from that support zone could reach approximately 5,000%.
Can you imagine the potential opportunity for market participants who accumulated tokens at extremely low prices?
Of course, this is a technical projection, not a guaranteed return. Such a scenario would require favorable market conditions, sufficient liquidity, and strong buying demand.
A potential BULL MARKET could last up to 12 months, or possibly even less. Everything would depend on market dynamics and investor interest.
More details in Image No. 3.
Now, let's discuss the fundamental side of the project.
Behind the BMT token stands Bubblemaps, a platform specializing in blockchain data analysis and visualization.
The platform allows users to analyze token distributions, connections between wallets, and on-chain activities, including those associated with newly launched crypto projects.
One of its most interesting features is the ability to identify potentially suspicious behavior, large token concentrations, and connections between wallets that may require further investigation.
In practical terms, we could compare part of the platform's functionality to that of a professional investigator who carefully examines available information before reaching conclusions.
These tools can help identify potential risks, although they cannot completely eliminate fraud or guarantee that a project is safe.
And that's not all!
BMT also has utility within the Bubblemaps ecosystem, including access to advanced analytical features and participation in community investigations through Intel Desk.
However, what interests me most is that the platform is already operational and provides real services. It is not simply an idea waiting to be launched.
Naturally, having a functioning product does not automatically guarantee that its token will appreciate in value.
More details in Image No. 4.
To maintain a balanced analysis, we must also consider less favorable scenarios.
It is entirely possible that BMT will fail to break its global resistance and enter another BEAR MARKET.
Another possibility is that the project enters an extended period of hibernation, during which the price continues respecting its last major global support zone while fluctuating within a relatively stable range.
In other words, we could experience a FLAT / SIDEWAYS MARKET, where the price repeatedly moves between support and resistance levels.
Such a period could last one year, two years, or even three years.
For investors expecting quick results, this scenario could become a serious test of patience.
However, we must understand that the market is under no obligation to move according to our expectations.
Regardless of whether BMT enters a new BULL MARKET, continues declining, or remains in a prolonged accumulation phase, I believe we must respect two fundamental principles:
RISK MANAGEMENT and MONEY MANAGEMENT.
Every trader must understand their financial limits, recognize the risks they are taking, and manage their capital according to their personal trading strategy.
We should never abandon a strategy that has consistently delivered results simply because another project appears to offer extraordinary profit potential.
The cryptocurrency market offers opportunities, but it also carries considerable risks.
And an impressive percentage increase on a chart does not automatically translate into realized profits in a trading account.
Personally, I will continue monitoring BMT, analyzing its chart development, and managing my positions according to market conditions.
Patience, discipline, and capital protection remain my priorities.
I wish everyone success!
Respectfully,
Adrian (CryptoZiDeZi)
#cryptozidezi
First, I want to mention that I already hold a certain amount of BMT tokens. However, my journey with this project did not begin with the volume I currently hold.
Everything started with an initial investment of 150 USDT. Through trading and capital rotation, I managed to increase that amount to 314 USDT, effectively more than doubling my initial capital.
From my perspective, this result demonstrates the importance of capital management, patience, and discipline when trading a volatile crypto project.
More details in Image No. 1.
In March 2027, the BMT token will celebrate its second anniversary.
Looking at its historical chart, we can observe that during its first year, the project experienced a severe BEAR MARKET, losing approximately 98% of its value.
This type of price movement is not unusual in the cryptocurrency industry. Over recent years, numerous projects have experienced extremely aggressive corrections after their initial launches.
Later, the chart began showing attempts at price recovery, including upward movements toward the GLOBAL RESISTANCE LEVEL.
In my opinion, these movements could represent early signs of a potential trend reversal. However, confirming a genuine BULL MARKET requires more than a few bullish price movements.
More details in Image No. 2.
I would like to draw your attention to June and July 2026.
During that period, according to my technical analysis, the price began respecting an important support zone, which was subsequently tested and confirmed.
And this is where things become particularly interesting!
If BMT manages to recover toward its GLOBAL RESISTANCE LEVEL, the theoretical price increase from that support zone could reach approximately 5,000%.
Can you imagine the potential opportunity for market participants who accumulated tokens at extremely low prices?
Of course, this is a technical projection, not a guaranteed return. Such a scenario would require favorable market conditions, sufficient liquidity, and strong buying demand.
A potential BULL MARKET could last up to 12 months, or possibly even less. Everything would depend on market dynamics and investor interest.
More details in Image No. 3.
Now, let's discuss the fundamental side of the project.
Behind the BMT token stands Bubblemaps, a platform specializing in blockchain data analysis and visualization.
The platform allows users to analyze token distributions, connections between wallets, and on-chain activities, including those associated with newly launched crypto projects.
One of its most interesting features is the ability to identify potentially suspicious behavior, large token concentrations, and connections between wallets that may require further investigation.
In practical terms, we could compare part of the platform's functionality to that of a professional investigator who carefully examines available information before reaching conclusions.
These tools can help identify potential risks, although they cannot completely eliminate fraud or guarantee that a project is safe.
And that's not all!
BMT also has utility within the Bubblemaps ecosystem, including access to advanced analytical features and participation in community investigations through Intel Desk.
However, what interests me most is that the platform is already operational and provides real services. It is not simply an idea waiting to be launched.
Naturally, having a functioning product does not automatically guarantee that its token will appreciate in value.
More details in Image No. 4.
To maintain a balanced analysis, we must also consider less favorable scenarios.
It is entirely possible that BMT will fail to break its global resistance and enter another BEAR MARKET.
Another possibility is that the project enters an extended period of hibernation, during which the price continues respecting its last major global support zone while fluctuating within a relatively stable range.
In other words, we could experience a FLAT / SIDEWAYS MARKET, where the price repeatedly moves between support and resistance levels.
Such a period could last one year, two years, or even three years.
For investors expecting quick results, this scenario could become a serious test of patience.
However, we must understand that the market is under no obligation to move according to our expectations.
Regardless of whether BMT enters a new BULL MARKET, continues declining, or remains in a prolonged accumulation phase, I believe we must respect two fundamental principles:
RISK MANAGEMENT and MONEY MANAGEMENT.
Every trader must understand their financial limits, recognize the risks they are taking, and manage their capital according to their personal trading strategy.
We should never abandon a strategy that has consistently delivered results simply because another project appears to offer extraordinary profit potential.
The cryptocurrency market offers opportunities, but it also carries considerable risks.
And an impressive percentage increase on a chart does not automatically translate into realized profits in a trading account.
Personally, I will continue monitoring BMT, analyzing its chart development, and managing my positions according to market conditions.
Patience, discipline, and capital protection remain my priorities.
I wish everyone success!
Respectfully,
Adrian (CryptoZiDeZi)
#cryptozidezi
1
5
2.2k
Today, I’m analyzing $BMT (Bubblemaps), exploring key support and resistance levels, potential bullish and bearish scenarios, and my LONG Futures position. I also discuss accumulation, margin management, and trading risks.#cryptozidezi
18+ | Educational content only. Not financial advice.[Inviting you to join my group CryptoZiDeZi SPOT](https://app.binance.com/uni-qr/PBtxfQND)
Today, I’m analyzing $BMT (Bubblemaps), exploring key support and resistance levels, potential bullish and bearish scenarios, and my LONG Futures position. I also discuss accumulation, margin management, and trading risks.#cryptozidezi
18+ | Educational content only. Not financial advice.Inviting you to join my group CryptoZiDeZi SPOT
18+ | Educational content only. Not financial advice.Inviting you to join my group CryptoZiDeZi SPOT
4
2k
Article
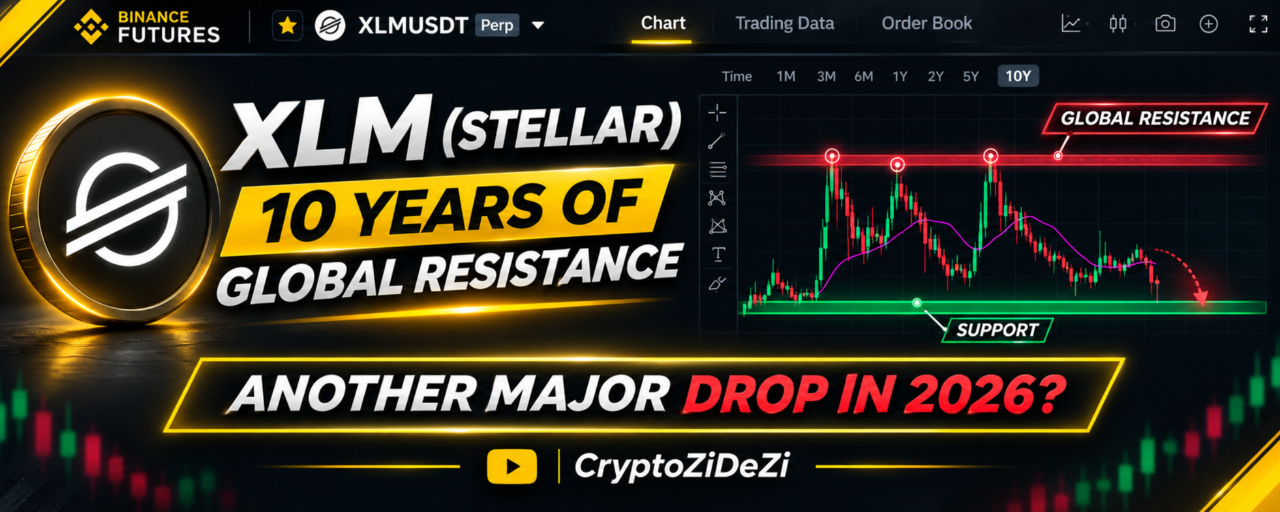
XLM (Stellar): 10 Years of Unbroken Global Resistance – Is Another Major Collapse Coming in 2026?I hold $XLM (Stellar) in my portfolio, and today I’d like to share a few observations and opinions!
First of all, I’m not sure if you knew that this project has been active for over 12 years. That fact alone says a lot about the project! (See Image 1)
Now, something even more interesting: XLM has been unable to break through its GLOBAL RESISTANCE for 10 years! This genuinely surprised me. Doesn’t it surprise you too?
Can you imagine? For 10 years, the price has repeatedly approached GLOBAL RESISTANCE, only to collapse afterward! (See Image 2)
And there’s something else worth mentioning. For 8 years, the support level established in 2019 has continued to hold. Unfortunately, the concerning part is that it now looks like we might experience another significant decline this year.
Just imagine defending a support zone for eight years! During this entire period, the price has generally maintained a considerable distance from that support level rather than repeatedly testing it. (See Image 3)
In 2023, a new INTERNAL SUPPORT level was established. Over the following two years, this zone accumulated enough strength to push the price back toward GLOBAL RESISTANCE.
Interestingly, in 2019, it took less than 12 months for the price to make a similar move toward GLOBAL RESISTANCE. (See Image 4)
Finally, in February 2026, another INTERNAL SUPPORT level was established. However, this support appears relatively fragile, and the current price action suggests a potential decline toward the 2023 SUPPORT level.
This time, the market did not generate enough buying momentum to push XLM anywhere near its GLOBAL RESISTANCE. (See Image 5)
I had too much faith in this project when I first bought it. I genuinely believed we were heading to the moon, especially considering its massive market capitalization and enormous trading volume.
But over time, everything slowly faded away, like a fire running out of wood to burn. (See Image 6)
Later, I purchased this project again on another account, this time at a much more favorable price. And yet, the reality is that XLM now appears to be heading toward another significant decline!
Of course, these are just my personal opinions, based on what I can observe with my own eyes on the chart.
For now, I am determined to continue managing my positions until the very end, as I do not believe this project will be delisted.
Risk Management and Money Management are absolutely essential, regardless of the trading strategy you follow.
I wish you all success!
Best regards,
Adrian (CryptoZiDeZi)
#cryptozidezi
[Access is available for 3 years!](https://app.binance.com/uni-qr/7mdp2c9z)
XLM (Stellar): 10 Years of Unbroken Global Resistance – Is Another Major Collapse Coming in 2026?
I hold $XLM (Stellar) in my portfolio, and today I’d like to share a few observations and opinions!
First of all, I’m not sure if you knew that this project has been active for over 12 years. That fact alone says a lot about the project! (See Image 1)
Now, something even more interesting: XLM has been unable to break through its GLOBAL RESISTANCE for 10 years! This genuinely surprised me. Doesn’t it surprise you too?
Can you imagine? For 10 years, the price has repeatedly approached GLOBAL RESISTANCE, only to collapse afterward! (See Image 2)
And there’s something else worth mentioning. For 8 years, the support level established in 2019 has continued to hold. Unfortunately, the concerning part is that it now looks like we might experience another significant decline this year.
Just imagine defending a support zone for eight years! During this entire period, the price has generally maintained a considerable distance from that support level rather than repeatedly testing it. (See Image 3)
In 2023, a new INTERNAL SUPPORT level was established. Over the following two years, this zone accumulated enough strength to push the price back toward GLOBAL RESISTANCE.
Interestingly, in 2019, it took less than 12 months for the price to make a similar move toward GLOBAL RESISTANCE. (See Image 4)
Finally, in February 2026, another INTERNAL SUPPORT level was established. However, this support appears relatively fragile, and the current price action suggests a potential decline toward the 2023 SUPPORT level.
This time, the market did not generate enough buying momentum to push XLM anywhere near its GLOBAL RESISTANCE. (See Image 5)
I had too much faith in this project when I first bought it. I genuinely believed we were heading to the moon, especially considering its massive market capitalization and enormous trading volume.
But over time, everything slowly faded away, like a fire running out of wood to burn. (See Image 6)
Later, I purchased this project again on another account, this time at a much more favorable price. And yet, the reality is that XLM now appears to be heading toward another significant decline!
Of course, these are just my personal opinions, based on what I can observe with my own eyes on the chart.
For now, I am determined to continue managing my positions until the very end, as I do not believe this project will be delisted.
Risk Management and Money Management are absolutely essential, regardless of the trading strategy you follow.
I wish you all success!
Best regards,
Adrian (CryptoZiDeZi)
#cryptozidezi
Access is available for 3 years!
First of all, I’m not sure if you knew that this project has been active for over 12 years. That fact alone says a lot about the project! (See Image 1)
Now, something even more interesting: XLM has been unable to break through its GLOBAL RESISTANCE for 10 years! This genuinely surprised me. Doesn’t it surprise you too?
Can you imagine? For 10 years, the price has repeatedly approached GLOBAL RESISTANCE, only to collapse afterward! (See Image 2)
And there’s something else worth mentioning. For 8 years, the support level established in 2019 has continued to hold. Unfortunately, the concerning part is that it now looks like we might experience another significant decline this year.
Just imagine defending a support zone for eight years! During this entire period, the price has generally maintained a considerable distance from that support level rather than repeatedly testing it. (See Image 3)
In 2023, a new INTERNAL SUPPORT level was established. Over the following two years, this zone accumulated enough strength to push the price back toward GLOBAL RESISTANCE.
Interestingly, in 2019, it took less than 12 months for the price to make a similar move toward GLOBAL RESISTANCE. (See Image 4)
Finally, in February 2026, another INTERNAL SUPPORT level was established. However, this support appears relatively fragile, and the current price action suggests a potential decline toward the 2023 SUPPORT level.
This time, the market did not generate enough buying momentum to push XLM anywhere near its GLOBAL RESISTANCE. (See Image 5)
I had too much faith in this project when I first bought it. I genuinely believed we were heading to the moon, especially considering its massive market capitalization and enormous trading volume.
But over time, everything slowly faded away, like a fire running out of wood to burn. (See Image 6)
Later, I purchased this project again on another account, this time at a much more favorable price. And yet, the reality is that XLM now appears to be heading toward another significant decline!
Of course, these are just my personal opinions, based on what I can observe with my own eyes on the chart.
For now, I am determined to continue managing my positions until the very end, as I do not believe this project will be delisted.
Risk Management and Money Management are absolutely essential, regardless of the trading strategy you follow.
I wish you all success!
Best regards,
Adrian (CryptoZiDeZi)
#cryptozidezi
Access is available for 3 years!
9
21
11.8k
In this video, I analyze $XLM (Stellar) on Binance Futures, exploring historical support and resistance levels, market trends, and potential bullish and bearish scenarios. I also discuss my LONG position, accumulation strategy, and risk management approach.
CryptoZiDeZi | Conservative Trading
⚠️ Educational content only. Not financial advice.
#Stellar
In this video, I analyze $XLM (Stellar) on Binance Futures, exploring historical support and resistance levels, market trends, and potential bullish and bearish scenarios. I also discuss my LONG position, accumulation strategy, and risk management approach.
CryptoZiDeZi | Conservative Trading
⚠️ Educational content only. Not financial advice.
#Stellar
CryptoZiDeZi | Conservative Trading
⚠️ Educational content only. Not financial advice.
#Stellar
2
5
2k
Cardano ($ADA ) Technical Analysis! 📊
In this video, I analyze ADA’s price history, key support and resistance levels, market trends, and my real Binance Futures positions. I also explain my Conservative Trading strategy, position management, and risk control.
⚠️ 18+ | Not financial advice.
#cryptozidezi
Cardano ($ADA ) Technical Analysis! 📊
In this video, I analyze ADA’s price history, key support and resistance levels, market trends, and my real Binance Futures positions. I also explain my Conservative Trading strategy, position management, and risk control.
⚠️ 18+ | Not financial advice.
#cryptozidezi
In this video, I analyze ADA’s price history, key support and resistance levels, market trends, and my real Binance Futures positions. I also explain my Conservative Trading strategy, position management, and risk control.
⚠️ 18+ | Not financial advice.
#cryptozidezi
1
2
2k
$TURBO /USDT Technical Analysis! Explore key support and resistance levels, my real Binance Futures LONG position, and my Conservative Trading strategy. Discover how I manage risk, leverage, and margin while preparing for potential market movements. Not financial advice.#cryptozidezi
$TURBO /USDT Technical Analysis! Explore key support and resistance levels, my real Binance Futures LONG position, and my Conservative Trading strategy. Discover how I manage risk, leverage, and margin while preparing for potential market movements. Not financial advice.#cryptozidezi
1
2
2k
$DOGE /USDT Technical Analysis! Explore key support and resistance levels, my real Futures LONG positions, and how I manage risk, margin, and funding fees. Discover my Conservative Trading strategy and market outlook.
⚠️ 18+ | Not financial advice.#cryptozidezi
$DOGE /USDT Technical Analysis! Explore key support and resistance levels, my real Futures LONG positions, and how I manage risk, margin, and funding fees. Discover my Conservative Trading strategy and market outlook.
⚠️ 18+ | Not financial advice.#cryptozidezi
⚠️ 18+ | Not financial advice.#cryptozidezi
2
6
2.7k
In this video, I analyze $SUI /USDT, exploring key support and resistance levels, my real Futures positions, and my Conservative Trading strategy. Discover how I manage risk, accumulate positions, and prepare for potential market reversals.
18+ | Not Financial Advice.#cryptozidezi
In this video, I analyze $SUI /USDT, exploring key support and resistance levels, my real Futures positions, and my Conservative Trading strategy. Discover how I manage risk, accumulate positions, and prepare for potential market reversals.
18+ | Not Financial Advice.#cryptozidezi
18+ | Not Financial Advice.#cryptozidezi
2
5
2.3k
$SEI /USDT – Updated Technical Analysis!
We analyze key support and resistance levels, my real LONG Futures positions, and my risk management strategy. Is SEI preparing for a new BULL MARKET?
CryptoZiDeZi | Conservative Trading
⚠️ 18+ | Not financial advice.
#cryptozidezi
$SEI /USDT – Updated Technical Analysis!
We analyze key support and resistance levels, my real LONG Futures positions, and my risk management strategy. Is SEI preparing for a new BULL MARKET?
CryptoZiDeZi | Conservative Trading
⚠️ 18+ | Not financial advice.
#cryptozidezi
We analyze key support and resistance levels, my real LONG Futures positions, and my risk management strategy. Is SEI preparing for a new BULL MARKET?
CryptoZiDeZi | Conservative Trading
⚠️ 18+ | Not financial advice.
#cryptozidezi
1
6
1.8k
$DOT /USDT Technical Analysis 2026!
I share my real Futures position, key support and resistance levels, and my Conservative Trading strategy.
📈 Is DOT preparing for a massive Bull Market?
⚠️ 18+ | Personal opinions, not financial advice.
#cryptozidezi
$DOT /USDT Technical Analysis 2026!
I share my real Futures position, key support and resistance levels, and my Conservative Trading strategy.
📈 Is DOT preparing for a massive Bull Market?
⚠️ 18+ | Personal opinions, not financial advice.
#cryptozidezi
I share my real Futures position, key support and resistance levels, and my Conservative Trading strategy.
📈 Is DOT preparing for a massive Bull Market?
⚠️ 18+ | Personal opinions, not financial advice.
#cryptozidezi
1
7
3.1k
$ARB /USDT – Technical Analysis & Futures Update!
In this video, I share my real Futures positions, analyze key support and resistance levels, and explain my Conservative Trading strategy.
📈 Is ARB ready for a new Bull Market?
⚠️ 18+ | Not Financial Advice.
#ARB
$ARB /USDT – Technical Analysis & Futures Update!
In this video, I share my real Futures positions, analyze key support and resistance levels, and explain my Conservative Trading strategy.
📈 Is ARB ready for a new Bull Market?
⚠️ 18+ | Not Financial Advice.
#ARB
In this video, I share my real Futures positions, analyze key support and resistance levels, and explain my Conservative Trading strategy.
📈 Is ARB ready for a new Bull Market?
⚠️ 18+ | Not Financial Advice.
#ARB
1
3
2.2k
$VET /USDT – Technical Analysis | Bull Market Soon?
In this video, I share my personal analysis of VeChain (VET), review key support and resistance levels, and explain how I manage my real Futures position using my Conservative Trading strategy.
Will VET recover and enter a new Bull Market? Let's explore the possibilities!
18+ Only | Not Financial Advice. This video reflects my personal opinions. Always follow your own risk and money management strategy.
CryptoZiDeZi | Conservative Trading
$VET /USDT – Technical Analysis | Bull Market Soon?
In this video, I share my personal analysis of VeChain (VET), review key support and resistance levels, and explain how I manage my real Futures position using my Conservative Trading strategy.
Will VET recover and enter a new Bull Market? Let's explore the possibilities!
18+ Only | Not Financial Advice. This video reflects my personal opinions. Always follow your own risk and money management strategy.
CryptoZiDeZi | Conservative Trading
In this video, I share my personal analysis of VeChain (VET), review key support and resistance levels, and explain how I manage my real Futures position using my Conservative Trading strategy.
Will VET recover and enter a new Bull Market? Let's explore the possibilities!
18+ Only | Not Financial Advice. This video reflects my personal opinions. Always follow your own risk and money management strategy.
CryptoZiDeZi | Conservative Trading
2
5
2.9k

Article
CryptoZiDeZi | EXCLUSIVE TRADING COMMUNITYOnly 48 spots remaining out of 50!
I invite you to become part of a private community dedicated to individuals interested in cryptocurrency markets, financial education, and developing a disciplined approach to trading.
💎 What Will You Gain Over the Next 3 Years?
✅ SPOT & FUTURES Trading – The opportunity to follow and analyze real trades alongside me, including trading decisions and position management techniques.
✅ Daily Access to Private Chat – Discussions about market conditions, potential opportunities, trading strategies, and risk management.
✅ Educational Video Content – Practical explanations covering trading techniques, market analysis, and capital management.
✅ Participation in Binance Square Campaigns – Opportunities to participate together in events, campaigns, and special initiatives organized on the platform.
✅ Access to My Personal CONSERVATIVE TRADING Strategy – An opportunity to study the trading methodology I have been practicing and refining for over 3 years.
✅ Exclusive Excel Trading Tracker – Access to a dedicated spreadsheet designed to monitor purchases, open positions, and transaction history throughout the entire 3-year period.
✅ My Personal Excel Position Management Formulas – Access to the formulas I personally use to calculate, monitor, and manage my trading positions.
✅ Networking & Direct Communication – An opportunity to build professional relationships, exchange experiences, develop mutual trust, and perhaps even become friends!
📅 Enrollment Deadline: November 11, 2026
50 Total Spots | 2 Taken | 48 Available
This enrollment offer is valid until November 11, 2026, subject to availability.
🎯 My Vision
My goal is to build a focused, transparent, and collaborative community designed for long-term development.
Every member will have the opportunity to gain access to practical trading experience, analytical tools, and an environment that encourages continuous learning, discipline, and personal growth in the cryptocurrency industry.
CryptoZiDeZi – 3 Years of Trading, Education & Growth Together!
Disclaimer: SPOT and FUTURES trading involves financial risks, including the potential loss of capital. Community membership does not guarantee profits. Every participant remains fully responsible for their own investment and trading decisions.
[Inviting you to join my group Private Trading Room](https://app.binance.com/uni-qr/4NPXwCHQ)
CryptoZiDeZi | EXCLUSIVE TRADING COMMUNITY
Only 48 spots remaining out of 50!
I invite you to become part of a private community dedicated to individuals interested in cryptocurrency markets, financial education, and developing a disciplined approach to trading.
💎 What Will You Gain Over the Next 3 Years?
✅ SPOT & FUTURES Trading – The opportunity to follow and analyze real trades alongside me, including trading decisions and position management techniques.
✅ Daily Access to Private Chat – Discussions about market conditions, potential opportunities, trading strategies, and risk management.
✅ Educational Video Content – Practical explanations covering trading techniques, market analysis, and capital management.
✅ Participation in Binance Square Campaigns – Opportunities to participate together in events, campaigns, and special initiatives organized on the platform.
✅ Access to My Personal CONSERVATIVE TRADING Strategy – An opportunity to study the trading methodology I have been practicing and refining for over 3 years.
✅ Exclusive Excel Trading Tracker – Access to a dedicated spreadsheet designed to monitor purchases, open positions, and transaction history throughout the entire 3-year period.
✅ My Personal Excel Position Management Formulas – Access to the formulas I personally use to calculate, monitor, and manage my trading positions.
✅ Networking & Direct Communication – An opportunity to build professional relationships, exchange experiences, develop mutual trust, and perhaps even become friends!
📅 Enrollment Deadline: November 11, 2026
50 Total Spots | 2 Taken | 48 Available
This enrollment offer is valid until November 11, 2026, subject to availability.
🎯 My Vision
My goal is to build a focused, transparent, and collaborative community designed for long-term development.
Every member will have the opportunity to gain access to practical trading experience, analytical tools, and an environment that encourages continuous learning, discipline, and personal growth in the cryptocurrency industry.
CryptoZiDeZi – 3 Years of Trading, Education & Growth Together!
Disclaimer: SPOT and FUTURES trading involves financial risks, including the potential loss of capital. Community membership does not guarantee profits. Every participant remains fully responsible for their own investment and trading decisions.
Inviting you to join my group Private Trading Room
I invite you to become part of a private community dedicated to individuals interested in cryptocurrency markets, financial education, and developing a disciplined approach to trading.
💎 What Will You Gain Over the Next 3 Years?
✅ SPOT & FUTURES Trading – The opportunity to follow and analyze real trades alongside me, including trading decisions and position management techniques.
✅ Daily Access to Private Chat – Discussions about market conditions, potential opportunities, trading strategies, and risk management.
✅ Educational Video Content – Practical explanations covering trading techniques, market analysis, and capital management.
✅ Participation in Binance Square Campaigns – Opportunities to participate together in events, campaigns, and special initiatives organized on the platform.
✅ Access to My Personal CONSERVATIVE TRADING Strategy – An opportunity to study the trading methodology I have been practicing and refining for over 3 years.
✅ Exclusive Excel Trading Tracker – Access to a dedicated spreadsheet designed to monitor purchases, open positions, and transaction history throughout the entire 3-year period.
✅ My Personal Excel Position Management Formulas – Access to the formulas I personally use to calculate, monitor, and manage my trading positions.
✅ Networking & Direct Communication – An opportunity to build professional relationships, exchange experiences, develop mutual trust, and perhaps even become friends!
📅 Enrollment Deadline: November 11, 2026
50 Total Spots | 2 Taken | 48 Available
This enrollment offer is valid until November 11, 2026, subject to availability.
🎯 My Vision
My goal is to build a focused, transparent, and collaborative community designed for long-term development.
Every member will have the opportunity to gain access to practical trading experience, analytical tools, and an environment that encourages continuous learning, discipline, and personal growth in the cryptocurrency industry.
CryptoZiDeZi – 3 Years of Trading, Education & Growth Together!
Disclaimer: SPOT and FUTURES trading involves financial risks, including the potential loss of capital. Community membership does not guarantee profits. Every participant remains fully responsible for their own investment and trading decisions.
Inviting you to join my group Private Trading Room
1
1
4
2k
$MARSCOIN /USDT - LISTED ON BINANCE – IS A BULL MARKET COMING?
$MARSCOIN /USDT - LISTED ON BINANCE – IS A BULL MARKET COMING?
1
1
6
2.1k
Log in to explore more content
Join global crypto users on Binance Square
⚡️ Get latest and useful information about crypto.
💬 Trusted by the world’s largest crypto exchange.
👍 Discover real insights from verified creators.
Email / Phone number
Trending Topics
HuangExitNvidiaStrategyInFocus
8,019 views
279 Discussing
STOCKS | Nvidia’s Jensen Huang Resigns, Colette Kress Named as Interim CEO
Binance News
·4 Likes
·8.3k views
AnthropicRejectsIPODelayValuationinQuestion
564,957 views
4,676 Discussing
BitMineReports$6.3BNetLossForFiscal2026
1,533 views
67 Discussing