
CryptoZeno
6k Posts

CryptoZeno
Report
Block User
Verified Creator on #BinanceSquare #CoinMarketCap and #CryptoQuant | On Chain Research and Market Insights with Smart Trading Signals

NES Holder
High-Frequency Trader
5.4 Years
29 Following
8.7K+ Followers
34.8K+ Liked
Posts
All
Quotes
Videos
PINNED
·
--
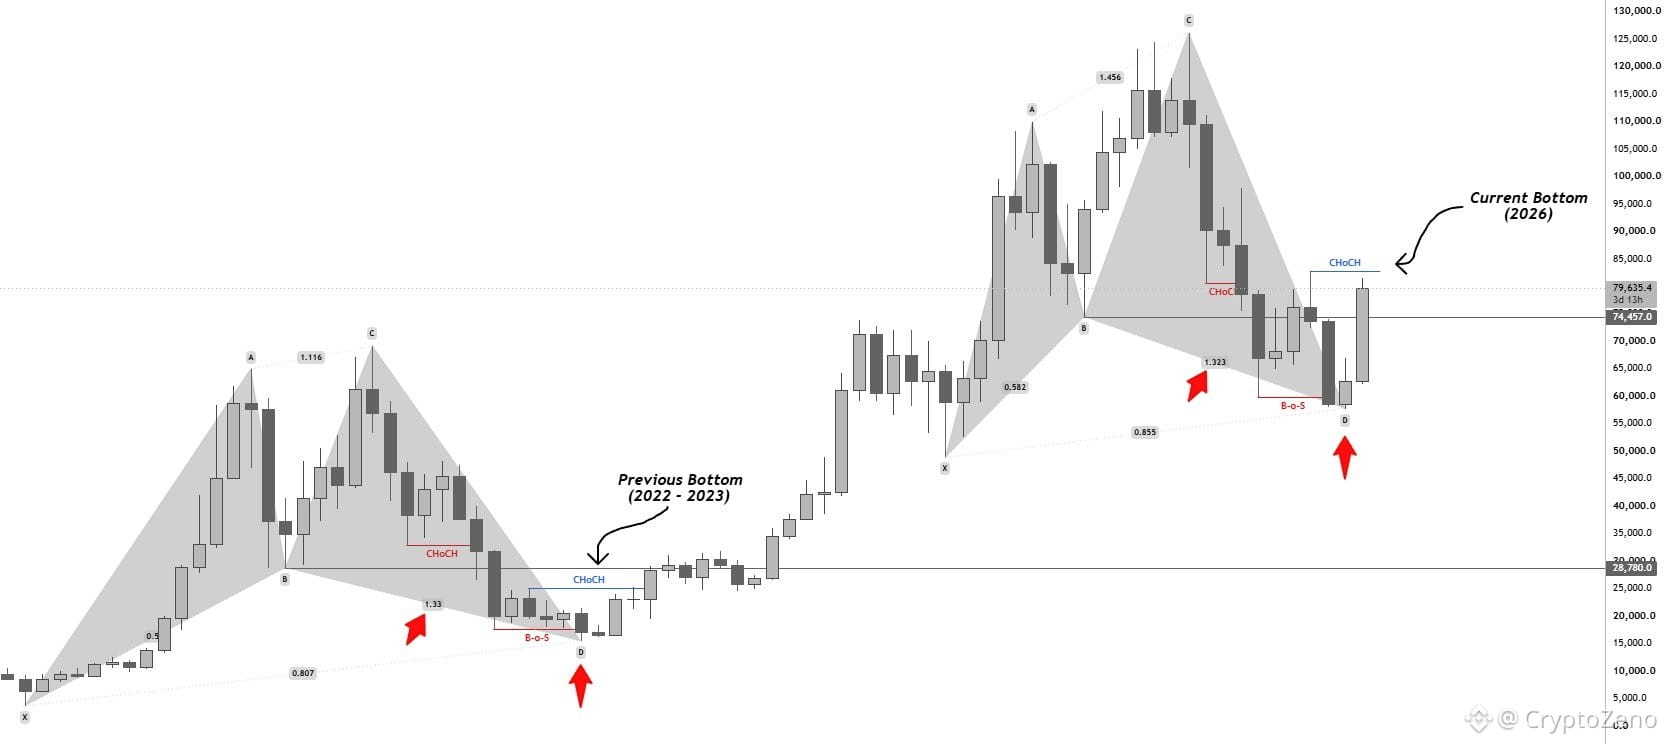
$BTC Same Structure. Same Bottom.
Yet people made the same mistake they’ve made EVERY. SINGLE. TIME we get a dip.
They waited for lower.
Suddenly, everyone had a new reason why Bitcoin was going to 54K.
Funny how that works.
{future}(BTCUSDT)
$BTC Same Structure. Same Bottom.
Yet people made the same mistake they’ve made EVERY. SINGLE. TIME we get a dip.
They waited for lower.
Suddenly, everyone had a new reason why Bitcoin was going to 54K.
Funny how that works.
Yet people made the same mistake they’ve made EVERY. SINGLE. TIME we get a dip.
They waited for lower.
Suddenly, everyone had a new reason why Bitcoin was going to 54K.
Funny how that works.
10
2
48
76.6k
PINNED
·
--
Article
The Breakout Trading Strategy I Use to Catch Big MovesI’ve longed resistance and shorted support for 9 years… This is the exact opposite of what every trader tries to do.
In this article, I will share my entire strategy so you can skip years of testing and losses.
This is something you will want to bookmark, take notes on, and set time aside to think about.
Lesson 1: The Only 2 Trading Strategies
Before you can identify good momentum setups, you need to understand what momentum trading actually is.
Momentum and mean reversion are opposite strategies based on opposite assumptions.
The Two Trading Styles
Momentum (where you take a trade betting on a continuation of the current trend)Mean Reversion (where you take a trade betting on a reversal of the current trend)
One assumes strength continues; the other assumes strength exhausts.
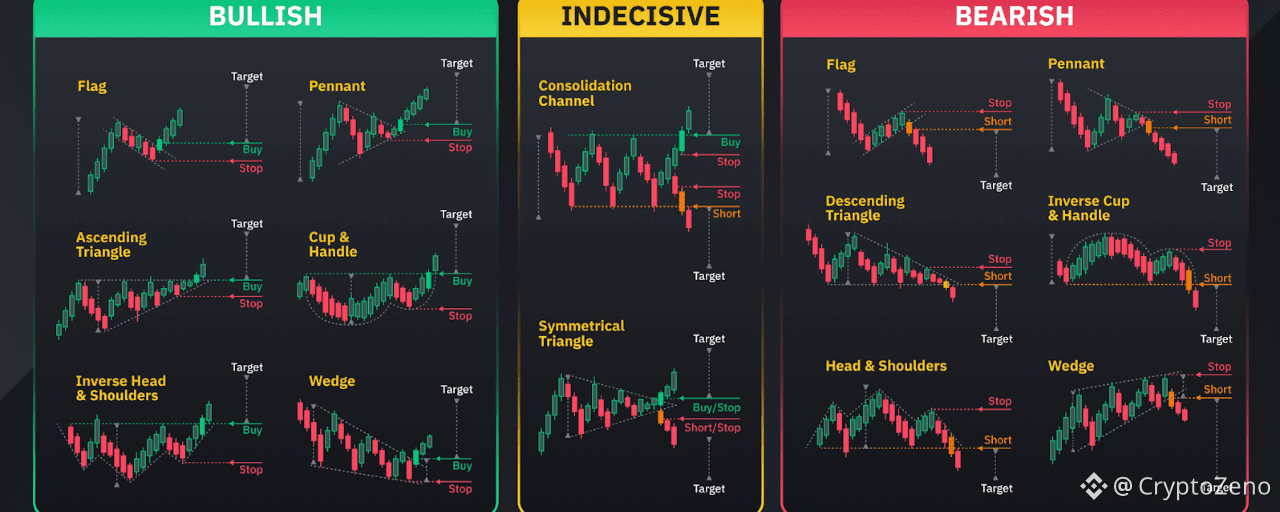
Let’s consider this through a visual example.
Suppose price is approaching a resistance level (in other words, a level where there was previously selling pressure, preventing the price from moving higher).
Momentum assumes the level will break.
You’re betting on continuation.Price approaches resistance, you buy, expecting it to push through and keep running.The level becomes support once broken.
Mean reversion assumes the level will hold.
You’re betting on rejection.Price approaches resistance, you short, expecting it to bounce back down.The level acts as a ceiling.
Same chart. Same resistance level. Opposite strategies.
There is no right or wrong. The key is to understand when you are in a momentum trade environment, such that momentum strategies are highly aligned.
The next section shows you exactly how to identify when the environment favours momentum (my best strategy).
Lesson 1 Summary
There are 2 trading styles: momentum and mean reversionMean reversion bets levels will hold; momentum bets levels will breakOne is not better than the other; it depends entirely on the trade environment
Lesson 2: Optimal Trade Environment
Just opening a long every time price hits resistance won't make us any money.
Without the right conditions, momentum dies immediately after the breakout.
You enter. It reverses. You're stopped out.
That's not bad luck, that's a bad trading environment.
The Rowing Analogy
Imagine you’re rowing a boat.
You either row against or with the current.
One makes it easier to row while the other takes a lot more effort.
Your boat, or rowing technique, didn’t change… Only your environment did.
Trading is the same.
Your strategy is your boat.
Your optimal trade environment is the current.
Now use this 3-filter checklist to ensure you only take trades where a breakout is likely (with the current).
Filter 1: How Did Price Approach the Level?
What you WANT:
A slow, grinding staircase pattern approaching resistance.Each candle makes incremental progress.Higher lows are stacking up.Controlled, deliberate movement.
What you DON’T want:
A fast vertical spike into resistance.Price shoots up in one or two large candles.After a spike, buyers' strength is depleted and price typically consolidates or reverses.This is exhaustion, not momentum.
The staircase pattern shows sustained buying pressure building gradually. When this breaks through resistance, buyers are still engaged and ready to push further.
Common mistake: Traders see a strong candle break resistance and assume momentum is strong. But these fast moves often reverse quickly.
→ Do this instead: Take momentum trades when price approaches resistance in a slow, grinding staircase over multiple candles.
Real Trade Example:
Slow clear grind into resistance showing an optimal ‘price approach to level’ for momentum.
Filter 1: slow grindy staircase ✅
Filter 2: What Did Volume Look Like?
Volume confirms whether the price movement has conviction behind it.
What you WANT:
Gradual increase in volume as price approaches resistanceThis pattern shows controlled, sustainable momentum.
What you DON’T want:
Flat volume (no conviction) or sudden volume spikes (exhaustion).Flat volume means the move lacks participation.Volume spikes often mark climax points where momentum exhausts.Decreasing volume (why would price break out of resistance now, if volume was lower than before?)
Volume should mirror the price pattern, steady and building, not erratic.
This strategy works because momentum continuation is most likely when participation is sustained, supply is absorbed gradually, and structure remains intact.
Real Trade Example:
Around the time the grindy staircase begins to emerge, we see a slow, consistent increase in volume.
Filter 1: slow grindy staircase ✅Filter 2: clearly increasing volume ✅
Lastly,
Filter 3: Moving Average Crossovers
This filter distinguishes trending markets (good for momentum) from choppy, indecisive markets (bad for momentum).
What you WANT to see: Moving averages with minimal crossovers. This indicates a directional trend.
What you DON’T want to see: Frequent crossovers. This signals chop and indecision.
Fewer crossovers = cleaner trend or range = better momentum continuation.
Use the 30SMMA (Smoothed Moving Average).
✍️Quick Actionable Step:
To add the 30SMMA on your charts:
Search for the Smoothed Moving Average Indicator in TradingViewAdd it to your chartGo into settings and change the "Length" to "30"
Real Trade Example:
Filter 1 (Price Action): slow grindy staircase ✅
Filter 2 (Volume): clearly increasing volume ✅
Filter 3 (Crossovers): minimal MA crossovers ✅
🎓Lesson 2 Summary
Slow grinding staircase approaches have better follow-through than fast spikesVolume should be gradual (increasing or decreasing), not flat or spikingFewer MA crossovers indicate cleaner directional conditions for momentum
Lesson 3: Identifying Setups
Now you know what momentum is.
You also know the optimal conditions for it.
Next, you need to know where to execute these trades.
Step 1: Draw Support and Resistance Levels
Momentum trades happen at these key levels. You need to identify them consistently.
I've already written an in-depth masterclass on how to set these levels. I'll link it at the end of this article.
Common mistake: Traders draw levels randomly or inconsistently, leading to missed setups or false signals.
Do this instead: Use my step-by-step approach at the end of this article.
Step 2: Await Your Entry Trigger on the 1-Minute Chart
Once you’ve identified a resistance level on your primary timeframe, switch to the 1-minute chart for precise entry timing.
Why 1-minute chart?
You learn faster.
More trades, more chart exposure and more oppurtunities to practice psychology.
I’ve added a bonus guide on why you should be trading the 1-minute chart at the end of this article.
Real Trade Example:
Step 3: Three Filters
Before entering, check the three filters from Section 2:
Is price approaching resistance in a slow staircase pattern?Is volume gradually increasing or decreasing (not flat or spiking)?Are there minimal MA crossovers (not choppy)?
If any filter fails, reduce your risk on the trade. Only take full risk on A-grade setups, not forcing trades in poor conditions.
🎓Lesson 3 Summary
Draw levels using the ZCT masterclass approach at the end of this articleUse your entry trigger on the 1-minute timeframe: 2 candle closes above for confirmationCheck all three filters before entering, allocate risk and size accordingly
Lesson 4: Strategy Logic: Stop Loss, and Take Profit
You've drawn your levels. You've confirmed the setup aligns with optimal momentum conditions.
Now you need precise execution.
Entry timing, stop placement, and profit targets determine whether you capture the momentum move or get stopped out on a good setup.
This is where most traders lose, not in analysis, but in execution.
Step 4: Entry Trigger
We have established to wait for two consecutive 1-minute candles to close fully above the resistance level. This confirms the level broke and momentum is continuing.
Critical execution detail: After the second candle closes above resistance, place a limit order AT the resistance level (now acting as support), not above it. Price often pulls back slightly after breaking out. Your limit order gets filled on the pullback without chasing.
Common mistake: Traders wait for confirmation, then market-buy above resistance as price runs away. They enter late with a wider stop and worse risk/reward.
→ Do this instead: Preset your limit order AT resistance after the second candle closes. Let price come back to you.
Real Trade Example:
Step 5: Stop Loss
A swing low is:
the lowest wick in a pullback.
Your stop loss goes at the most recent swing low before the breakout.
Common mistake: Traders place stops at the nearest swing low, even if it’s only 0.3% away, leading to frequent stop-outs from normal volatility
Do this instead: Always measure the distance of your stop loss using the ruler tool on TradingView. If it’s less than 1%, use the next swing low down.
Step 6: Take Profit 1R (Equal Distance to Stop)
Your take profit target is 1R, the same distance as your stop loss, but in the profit direction
If your stop loss is 1.982% away from entry, your target is also 1.982% away, but on the upside. This gives you a 1:1 risk/reward ratio.
Why 1R? It’s conservative and achievable. Momentum trades often hit 1R quickly because the breakout has follow-through. You’re not trying to catch the entire move, you’re taking a high-probability piece of it.
Over time, as you get data in your journal, you can start extending your profit targets when you see how far your average winning trades go beyond 1R. This way, you’re not guessing where to take profits, but following a systematic approach.
Real Trade Example:
🎓Lesson 4 summary
Enter after two 1-minute candle closes above resistance, using a limit order at prior resistance (now support) to avoid chasing price.Place stop losses at the most recent valid swing low, ensuring enough distance to avoid normal volatility and minor stop hunts.Set initial profit targets at 1R to capture high-probability momentum continuation in a repeatable, systematic way.
Immediate Next Steps✍️:
Read the Support and Resistance Masterclass to learn how to draw levels (shared at end of article)Look at 3 charts using the 3 filter checklist to identify a momentum trade environmentUse the strategy steps to enter your tradeGather 30 trades using this method, journalled and reviewed against the criteria
🎓 Final Summary
Lesson 1: Momentum vs Mean Reversion
Momentum trades bet that price will continue through a level, while mean reversion trades bet that a level will hold and reject price.Both strategies are valid, but performance depends entirely on matching the strategy to the correct trade environment.
Understanding this distinction prevents applying breakout logic in conditions where it has no edge.
Lesson 2: Optimal Trade Environment
High-quality breakouts form when price approaches resistance in a slow, grinding staircase rather than fast vertical spikes.Volume should build gradually to confirm sustained participation, not remain flat or spike from exhaustion.Minimal moving average crossovers indicate cleaner directional conditions where momentum continuation is more likely.
Lesson 3: Identifying Setups
Momentum trades should be executed at consistently drawn support and resistance levels.Entries are triggered on the 1-minute chart using two consecutive candle closes above resistance for confirmation.All three environment filters must align before taking full risk; weaker conditions require reduced sizing or passing the trade.
Lesson 4: Stop Loss and Take Profit
Enter using a limit order at prior resistance (now support) after two confirmed 1-minute candle closes to avoid chasing price.Stop losses should be placed at the most recent valid swing low with enough distance to avoid normal volatility and minor stop hunts.Initial profit targets are set at 1R to capture high-probability momentum continuation in a repeatable way.
🎓What Changes From Here
The next time price approaches resistance, you won’t have to guess if it will break out.
You’ll know when a breakout has real momentum, when volume confirms it, and when conditions support follow-through.
You’ll also execute with defined entries, stops, and targets.
#CryptoZeno #tradingStrategy
The Breakout Trading Strategy I Use to Catch Big Moves
I’ve longed resistance and shorted support for 9 years… This is the exact opposite of what every trader tries to do.
In this article, I will share my entire strategy so you can skip years of testing and losses.
This is something you will want to bookmark, take notes on, and set time aside to think about.
Lesson 1: The Only 2 Trading Strategies
Before you can identify good momentum setups, you need to understand what momentum trading actually is.
Momentum and mean reversion are opposite strategies based on opposite assumptions.
The Two Trading Styles
Momentum (where you take a trade betting on a continuation of the current trend)Mean Reversion (where you take a trade betting on a reversal of the current trend)
One assumes strength continues; the other assumes strength exhausts.
Let’s consider this through a visual example.
Suppose price is approaching a resistance level (in other words, a level where there was previously selling pressure, preventing the price from moving higher).
Momentum assumes the level will break.
You’re betting on continuation.Price approaches resistance, you buy, expecting it to push through and keep running.The level becomes support once broken.
Mean reversion assumes the level will hold.
You’re betting on rejection.Price approaches resistance, you short, expecting it to bounce back down.The level acts as a ceiling.
Same chart. Same resistance level. Opposite strategies.
There is no right or wrong. The key is to understand when you are in a momentum trade environment, such that momentum strategies are highly aligned.
The next section shows you exactly how to identify when the environment favours momentum (my best strategy).
Lesson 1 Summary
There are 2 trading styles: momentum and mean reversionMean reversion bets levels will hold; momentum bets levels will breakOne is not better than the other; it depends entirely on the trade environment
Lesson 2: Optimal Trade Environment
Just opening a long every time price hits resistance won't make us any money.
Without the right conditions, momentum dies immediately after the breakout.
You enter. It reverses. You're stopped out.
That's not bad luck, that's a bad trading environment.
The Rowing Analogy
Imagine you’re rowing a boat.
You either row against or with the current.
One makes it easier to row while the other takes a lot more effort.
Your boat, or rowing technique, didn’t change… Only your environment did.
Trading is the same.
Your strategy is your boat.
Your optimal trade environment is the current.
Now use this 3-filter checklist to ensure you only take trades where a breakout is likely (with the current).
Filter 1: How Did Price Approach the Level?
What you WANT:
A slow, grinding staircase pattern approaching resistance.Each candle makes incremental progress.Higher lows are stacking up.Controlled, deliberate movement.
What you DON’T want:
A fast vertical spike into resistance.Price shoots up in one or two large candles.After a spike, buyers' strength is depleted and price typically consolidates or reverses.This is exhaustion, not momentum.
The staircase pattern shows sustained buying pressure building gradually. When this breaks through resistance, buyers are still engaged and ready to push further.
Common mistake: Traders see a strong candle break resistance and assume momentum is strong. But these fast moves often reverse quickly.
→ Do this instead: Take momentum trades when price approaches resistance in a slow, grinding staircase over multiple candles.
Real Trade Example:
Slow clear grind into resistance showing an optimal ‘price approach to level’ for momentum.
Filter 1: slow grindy staircase ✅
Filter 2: What Did Volume Look Like?
Volume confirms whether the price movement has conviction behind it.
What you WANT:
Gradual increase in volume as price approaches resistanceThis pattern shows controlled, sustainable momentum.
What you DON’T want:
Flat volume (no conviction) or sudden volume spikes (exhaustion).Flat volume means the move lacks participation.Volume spikes often mark climax points where momentum exhausts.Decreasing volume (why would price break out of resistance now, if volume was lower than before?)
Volume should mirror the price pattern, steady and building, not erratic.
This strategy works because momentum continuation is most likely when participation is sustained, supply is absorbed gradually, and structure remains intact.
Real Trade Example:
Around the time the grindy staircase begins to emerge, we see a slow, consistent increase in volume.
Filter 1: slow grindy staircase ✅Filter 2: clearly increasing volume ✅
Lastly,
Filter 3: Moving Average Crossovers
This filter distinguishes trending markets (good for momentum) from choppy, indecisive markets (bad for momentum).
What you WANT to see: Moving averages with minimal crossovers. This indicates a directional trend.
What you DON’T want to see: Frequent crossovers. This signals chop and indecision.
Fewer crossovers = cleaner trend or range = better momentum continuation.
Use the 30SMMA (Smoothed Moving Average).
✍️Quick Actionable Step:
To add the 30SMMA on your charts:
Search for the Smoothed Moving Average Indicator in TradingViewAdd it to your chartGo into settings and change the "Length" to "30"
Real Trade Example:
Filter 1 (Price Action): slow grindy staircase ✅
Filter 2 (Volume): clearly increasing volume ✅
Filter 3 (Crossovers): minimal MA crossovers ✅
🎓Lesson 2 Summary
Slow grinding staircase approaches have better follow-through than fast spikesVolume should be gradual (increasing or decreasing), not flat or spikingFewer MA crossovers indicate cleaner directional conditions for momentum
Lesson 3: Identifying Setups
Now you know what momentum is.
You also know the optimal conditions for it.
Next, you need to know where to execute these trades.
Step 1: Draw Support and Resistance Levels
Momentum trades happen at these key levels. You need to identify them consistently.
I've already written an in-depth masterclass on how to set these levels. I'll link it at the end of this article.
Common mistake: Traders draw levels randomly or inconsistently, leading to missed setups or false signals.
Do this instead: Use my step-by-step approach at the end of this article.
Step 2: Await Your Entry Trigger on the 1-Minute Chart
Once you’ve identified a resistance level on your primary timeframe, switch to the 1-minute chart for precise entry timing.
Why 1-minute chart?
You learn faster.
More trades, more chart exposure and more oppurtunities to practice psychology.
I’ve added a bonus guide on why you should be trading the 1-minute chart at the end of this article.
Real Trade Example:
Step 3: Three Filters
Before entering, check the three filters from Section 2:
Is price approaching resistance in a slow staircase pattern?Is volume gradually increasing or decreasing (not flat or spiking)?Are there minimal MA crossovers (not choppy)?
If any filter fails, reduce your risk on the trade. Only take full risk on A-grade setups, not forcing trades in poor conditions.
🎓Lesson 3 Summary
Draw levels using the ZCT masterclass approach at the end of this articleUse your entry trigger on the 1-minute timeframe: 2 candle closes above for confirmationCheck all three filters before entering, allocate risk and size accordingly
Lesson 4: Strategy Logic: Stop Loss, and Take Profit
You've drawn your levels. You've confirmed the setup aligns with optimal momentum conditions.
Now you need precise execution.
Entry timing, stop placement, and profit targets determine whether you capture the momentum move or get stopped out on a good setup.
This is where most traders lose, not in analysis, but in execution.
Step 4: Entry Trigger
We have established to wait for two consecutive 1-minute candles to close fully above the resistance level. This confirms the level broke and momentum is continuing.
Critical execution detail: After the second candle closes above resistance, place a limit order AT the resistance level (now acting as support), not above it. Price often pulls back slightly after breaking out. Your limit order gets filled on the pullback without chasing.
Common mistake: Traders wait for confirmation, then market-buy above resistance as price runs away. They enter late with a wider stop and worse risk/reward.
→ Do this instead: Preset your limit order AT resistance after the second candle closes. Let price come back to you.
Real Trade Example:
Step 5: Stop Loss
A swing low is:
the lowest wick in a pullback.
Your stop loss goes at the most recent swing low before the breakout.
Common mistake: Traders place stops at the nearest swing low, even if it’s only 0.3% away, leading to frequent stop-outs from normal volatility
Do this instead: Always measure the distance of your stop loss using the ruler tool on TradingView. If it’s less than 1%, use the next swing low down.
Step 6: Take Profit 1R (Equal Distance to Stop)
Your take profit target is 1R, the same distance as your stop loss, but in the profit direction
If your stop loss is 1.982% away from entry, your target is also 1.982% away, but on the upside. This gives you a 1:1 risk/reward ratio.
Why 1R? It’s conservative and achievable. Momentum trades often hit 1R quickly because the breakout has follow-through. You’re not trying to catch the entire move, you’re taking a high-probability piece of it.
Over time, as you get data in your journal, you can start extending your profit targets when you see how far your average winning trades go beyond 1R. This way, you’re not guessing where to take profits, but following a systematic approach.
Real Trade Example:
🎓Lesson 4 summary
Enter after two 1-minute candle closes above resistance, using a limit order at prior resistance (now support) to avoid chasing price.Place stop losses at the most recent valid swing low, ensuring enough distance to avoid normal volatility and minor stop hunts.Set initial profit targets at 1R to capture high-probability momentum continuation in a repeatable, systematic way.
Immediate Next Steps✍️:
Read the Support and Resistance Masterclass to learn how to draw levels (shared at end of article)Look at 3 charts using the 3 filter checklist to identify a momentum trade environmentUse the strategy steps to enter your tradeGather 30 trades using this method, journalled and reviewed against the criteria
🎓 Final Summary
Lesson 1: Momentum vs Mean Reversion
Momentum trades bet that price will continue through a level, while mean reversion trades bet that a level will hold and reject price.Both strategies are valid, but performance depends entirely on matching the strategy to the correct trade environment.
Understanding this distinction prevents applying breakout logic in conditions where it has no edge.
Lesson 2: Optimal Trade Environment
High-quality breakouts form when price approaches resistance in a slow, grinding staircase rather than fast vertical spikes.Volume should build gradually to confirm sustained participation, not remain flat or spike from exhaustion.Minimal moving average crossovers indicate cleaner directional conditions where momentum continuation is more likely.
Lesson 3: Identifying Setups
Momentum trades should be executed at consistently drawn support and resistance levels.Entries are triggered on the 1-minute chart using two consecutive candle closes above resistance for confirmation.All three environment filters must align before taking full risk; weaker conditions require reduced sizing or passing the trade.
Lesson 4: Stop Loss and Take Profit
Enter using a limit order at prior resistance (now support) after two confirmed 1-minute candle closes to avoid chasing price.Stop losses should be placed at the most recent valid swing low with enough distance to avoid normal volatility and minor stop hunts.Initial profit targets are set at 1R to capture high-probability momentum continuation in a repeatable way.
🎓What Changes From Here
The next time price approaches resistance, you won’t have to guess if it will break out.
You’ll know when a breakout has real momentum, when volume confirms it, and when conditions support follow-through.
You’ll also execute with defined entries, stops, and targets.
#CryptoZeno #tradingStrategy
In this article, I will share my entire strategy so you can skip years of testing and losses.
This is something you will want to bookmark, take notes on, and set time aside to think about.
Lesson 1: The Only 2 Trading Strategies
Before you can identify good momentum setups, you need to understand what momentum trading actually is.
Momentum and mean reversion are opposite strategies based on opposite assumptions.
The Two Trading Styles
Momentum (where you take a trade betting on a continuation of the current trend)Mean Reversion (where you take a trade betting on a reversal of the current trend)
One assumes strength continues; the other assumes strength exhausts.
Let’s consider this through a visual example.
Suppose price is approaching a resistance level (in other words, a level where there was previously selling pressure, preventing the price from moving higher).
Momentum assumes the level will break.
You’re betting on continuation.Price approaches resistance, you buy, expecting it to push through and keep running.The level becomes support once broken.
Mean reversion assumes the level will hold.
You’re betting on rejection.Price approaches resistance, you short, expecting it to bounce back down.The level acts as a ceiling.
Same chart. Same resistance level. Opposite strategies.
There is no right or wrong. The key is to understand when you are in a momentum trade environment, such that momentum strategies are highly aligned.
The next section shows you exactly how to identify when the environment favours momentum (my best strategy).
Lesson 1 Summary
There are 2 trading styles: momentum and mean reversionMean reversion bets levels will hold; momentum bets levels will breakOne is not better than the other; it depends entirely on the trade environment
Lesson 2: Optimal Trade Environment
Just opening a long every time price hits resistance won't make us any money.
Without the right conditions, momentum dies immediately after the breakout.
You enter. It reverses. You're stopped out.
That's not bad luck, that's a bad trading environment.
The Rowing Analogy
Imagine you’re rowing a boat.
You either row against or with the current.
One makes it easier to row while the other takes a lot more effort.
Your boat, or rowing technique, didn’t change… Only your environment did.
Trading is the same.
Your strategy is your boat.
Your optimal trade environment is the current.
Now use this 3-filter checklist to ensure you only take trades where a breakout is likely (with the current).
Filter 1: How Did Price Approach the Level?
What you WANT:
A slow, grinding staircase pattern approaching resistance.Each candle makes incremental progress.Higher lows are stacking up.Controlled, deliberate movement.
What you DON’T want:
A fast vertical spike into resistance.Price shoots up in one or two large candles.After a spike, buyers' strength is depleted and price typically consolidates or reverses.This is exhaustion, not momentum.
The staircase pattern shows sustained buying pressure building gradually. When this breaks through resistance, buyers are still engaged and ready to push further.
Common mistake: Traders see a strong candle break resistance and assume momentum is strong. But these fast moves often reverse quickly.
→ Do this instead: Take momentum trades when price approaches resistance in a slow, grinding staircase over multiple candles.
Real Trade Example:
Slow clear grind into resistance showing an optimal ‘price approach to level’ for momentum.
Filter 1: slow grindy staircase ✅
Filter 2: What Did Volume Look Like?
Volume confirms whether the price movement has conviction behind it.
What you WANT:
Gradual increase in volume as price approaches resistanceThis pattern shows controlled, sustainable momentum.
What you DON’T want:
Flat volume (no conviction) or sudden volume spikes (exhaustion).Flat volume means the move lacks participation.Volume spikes often mark climax points where momentum exhausts.Decreasing volume (why would price break out of resistance now, if volume was lower than before?)
Volume should mirror the price pattern, steady and building, not erratic.
This strategy works because momentum continuation is most likely when participation is sustained, supply is absorbed gradually, and structure remains intact.
Real Trade Example:
Around the time the grindy staircase begins to emerge, we see a slow, consistent increase in volume.
Filter 1: slow grindy staircase ✅Filter 2: clearly increasing volume ✅
Lastly,
Filter 3: Moving Average Crossovers
This filter distinguishes trending markets (good for momentum) from choppy, indecisive markets (bad for momentum).
What you WANT to see: Moving averages with minimal crossovers. This indicates a directional trend.
What you DON’T want to see: Frequent crossovers. This signals chop and indecision.
Fewer crossovers = cleaner trend or range = better momentum continuation.
Use the 30SMMA (Smoothed Moving Average).
✍️Quick Actionable Step:
To add the 30SMMA on your charts:
Search for the Smoothed Moving Average Indicator in TradingViewAdd it to your chartGo into settings and change the "Length" to "30"
Real Trade Example:
Filter 1 (Price Action): slow grindy staircase ✅
Filter 2 (Volume): clearly increasing volume ✅
Filter 3 (Crossovers): minimal MA crossovers ✅
🎓Lesson 2 Summary
Slow grinding staircase approaches have better follow-through than fast spikesVolume should be gradual (increasing or decreasing), not flat or spikingFewer MA crossovers indicate cleaner directional conditions for momentum
Lesson 3: Identifying Setups
Now you know what momentum is.
You also know the optimal conditions for it.
Next, you need to know where to execute these trades.
Step 1: Draw Support and Resistance Levels
Momentum trades happen at these key levels. You need to identify them consistently.
I've already written an in-depth masterclass on how to set these levels. I'll link it at the end of this article.
Common mistake: Traders draw levels randomly or inconsistently, leading to missed setups or false signals.
Do this instead: Use my step-by-step approach at the end of this article.
Step 2: Await Your Entry Trigger on the 1-Minute Chart
Once you’ve identified a resistance level on your primary timeframe, switch to the 1-minute chart for precise entry timing.
Why 1-minute chart?
You learn faster.
More trades, more chart exposure and more oppurtunities to practice psychology.
I’ve added a bonus guide on why you should be trading the 1-minute chart at the end of this article.
Real Trade Example:
Step 3: Three Filters
Before entering, check the three filters from Section 2:
Is price approaching resistance in a slow staircase pattern?Is volume gradually increasing or decreasing (not flat or spiking)?Are there minimal MA crossovers (not choppy)?
If any filter fails, reduce your risk on the trade. Only take full risk on A-grade setups, not forcing trades in poor conditions.
🎓Lesson 3 Summary
Draw levels using the ZCT masterclass approach at the end of this articleUse your entry trigger on the 1-minute timeframe: 2 candle closes above for confirmationCheck all three filters before entering, allocate risk and size accordingly
Lesson 4: Strategy Logic: Stop Loss, and Take Profit
You've drawn your levels. You've confirmed the setup aligns with optimal momentum conditions.
Now you need precise execution.
Entry timing, stop placement, and profit targets determine whether you capture the momentum move or get stopped out on a good setup.
This is where most traders lose, not in analysis, but in execution.
Step 4: Entry Trigger
We have established to wait for two consecutive 1-minute candles to close fully above the resistance level. This confirms the level broke and momentum is continuing.
Critical execution detail: After the second candle closes above resistance, place a limit order AT the resistance level (now acting as support), not above it. Price often pulls back slightly after breaking out. Your limit order gets filled on the pullback without chasing.
Common mistake: Traders wait for confirmation, then market-buy above resistance as price runs away. They enter late with a wider stop and worse risk/reward.
→ Do this instead: Preset your limit order AT resistance after the second candle closes. Let price come back to you.
Real Trade Example:
Step 5: Stop Loss
A swing low is:
the lowest wick in a pullback.
Your stop loss goes at the most recent swing low before the breakout.
Common mistake: Traders place stops at the nearest swing low, even if it’s only 0.3% away, leading to frequent stop-outs from normal volatility
Do this instead: Always measure the distance of your stop loss using the ruler tool on TradingView. If it’s less than 1%, use the next swing low down.
Step 6: Take Profit 1R (Equal Distance to Stop)
Your take profit target is 1R, the same distance as your stop loss, but in the profit direction
If your stop loss is 1.982% away from entry, your target is also 1.982% away, but on the upside. This gives you a 1:1 risk/reward ratio.
Why 1R? It’s conservative and achievable. Momentum trades often hit 1R quickly because the breakout has follow-through. You’re not trying to catch the entire move, you’re taking a high-probability piece of it.
Over time, as you get data in your journal, you can start extending your profit targets when you see how far your average winning trades go beyond 1R. This way, you’re not guessing where to take profits, but following a systematic approach.
Real Trade Example:
🎓Lesson 4 summary
Enter after two 1-minute candle closes above resistance, using a limit order at prior resistance (now support) to avoid chasing price.Place stop losses at the most recent valid swing low, ensuring enough distance to avoid normal volatility and minor stop hunts.Set initial profit targets at 1R to capture high-probability momentum continuation in a repeatable, systematic way.
Immediate Next Steps✍️:
Read the Support and Resistance Masterclass to learn how to draw levels (shared at end of article)Look at 3 charts using the 3 filter checklist to identify a momentum trade environmentUse the strategy steps to enter your tradeGather 30 trades using this method, journalled and reviewed against the criteria
🎓 Final Summary
Lesson 1: Momentum vs Mean Reversion
Momentum trades bet that price will continue through a level, while mean reversion trades bet that a level will hold and reject price.Both strategies are valid, but performance depends entirely on matching the strategy to the correct trade environment.
Understanding this distinction prevents applying breakout logic in conditions where it has no edge.
Lesson 2: Optimal Trade Environment
High-quality breakouts form when price approaches resistance in a slow, grinding staircase rather than fast vertical spikes.Volume should build gradually to confirm sustained participation, not remain flat or spike from exhaustion.Minimal moving average crossovers indicate cleaner directional conditions where momentum continuation is more likely.
Lesson 3: Identifying Setups
Momentum trades should be executed at consistently drawn support and resistance levels.Entries are triggered on the 1-minute chart using two consecutive candle closes above resistance for confirmation.All three environment filters must align before taking full risk; weaker conditions require reduced sizing or passing the trade.
Lesson 4: Stop Loss and Take Profit
Enter using a limit order at prior resistance (now support) after two confirmed 1-minute candle closes to avoid chasing price.Stop losses should be placed at the most recent valid swing low with enough distance to avoid normal volatility and minor stop hunts.Initial profit targets are set at 1R to capture high-probability momentum continuation in a repeatable way.
🎓What Changes From Here
The next time price approaches resistance, you won’t have to guess if it will break out.
You’ll know when a breakout has real momentum, when volume confirms it, and when conditions support follow-through.
You’ll also execute with defined entries, stops, and targets.
#CryptoZeno #tradingStrategy
40
15
117
75.3k
·
--
$BTC We’ve seen this kind of behavior before.
{future}(BTCUSDT)
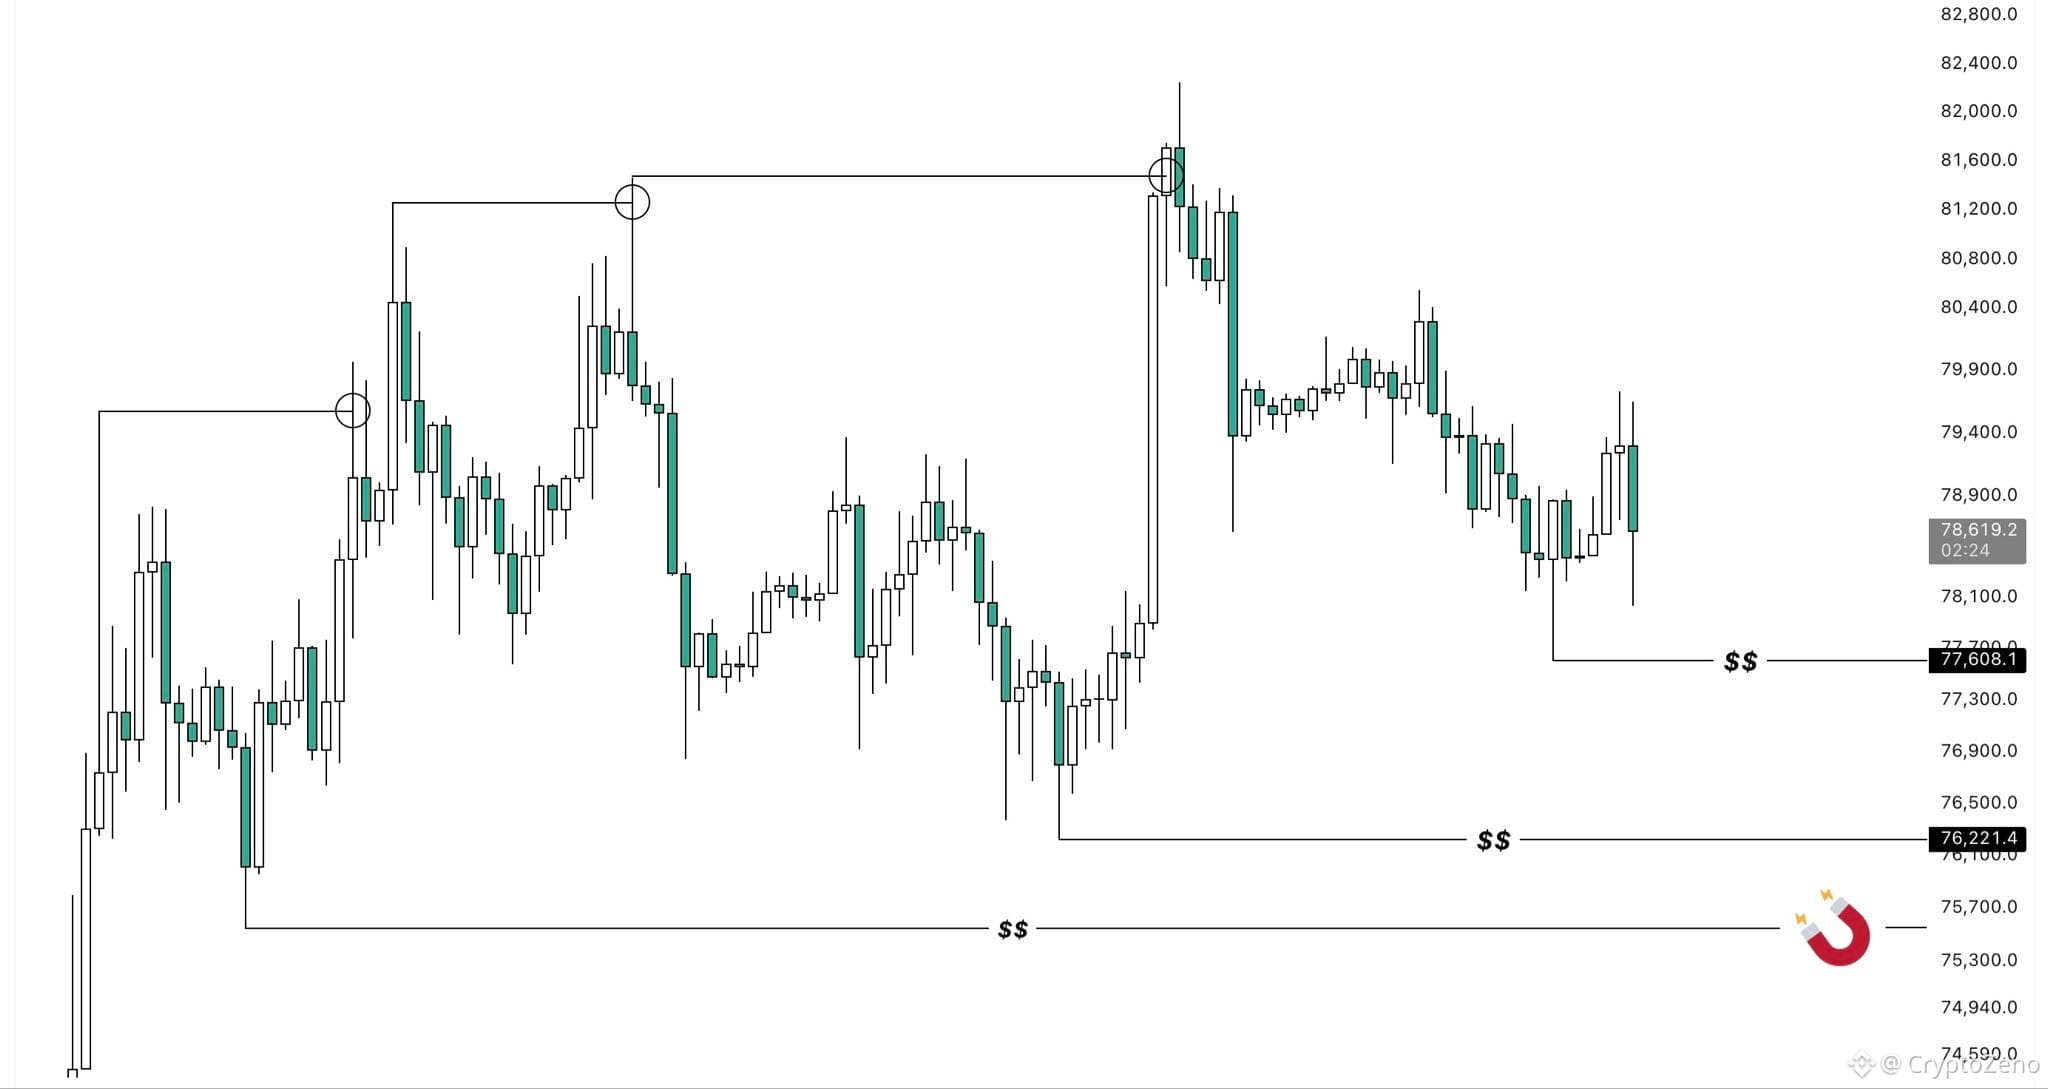
Highs are repeatedly getting swept while the lows stay untouched.
While shorts keep getting squeezed out of the market, downside liquidity quietly keeps building up.
But in the end, it always plays out the same way.
Sooner or later, we’ll see an aggressive selloff where these lows finally get swept.
$BTC We’ve seen this kind of behavior before.
Highs are repeatedly getting swept while the lows stay untouched.
While shorts keep getting squeezed out of the market, downside liquidity quietly keeps building up.
But in the end, it always plays out the same way.
Sooner or later, we’ll see an aggressive selloff where these lows finally get swept.
Highs are repeatedly getting swept while the lows stay untouched.
While shorts keep getting squeezed out of the market, downside liquidity quietly keeps building up.
But in the end, it always plays out the same way.
Sooner or later, we’ll see an aggressive selloff where these lows finally get swept.
3
5
3.5k
·
--
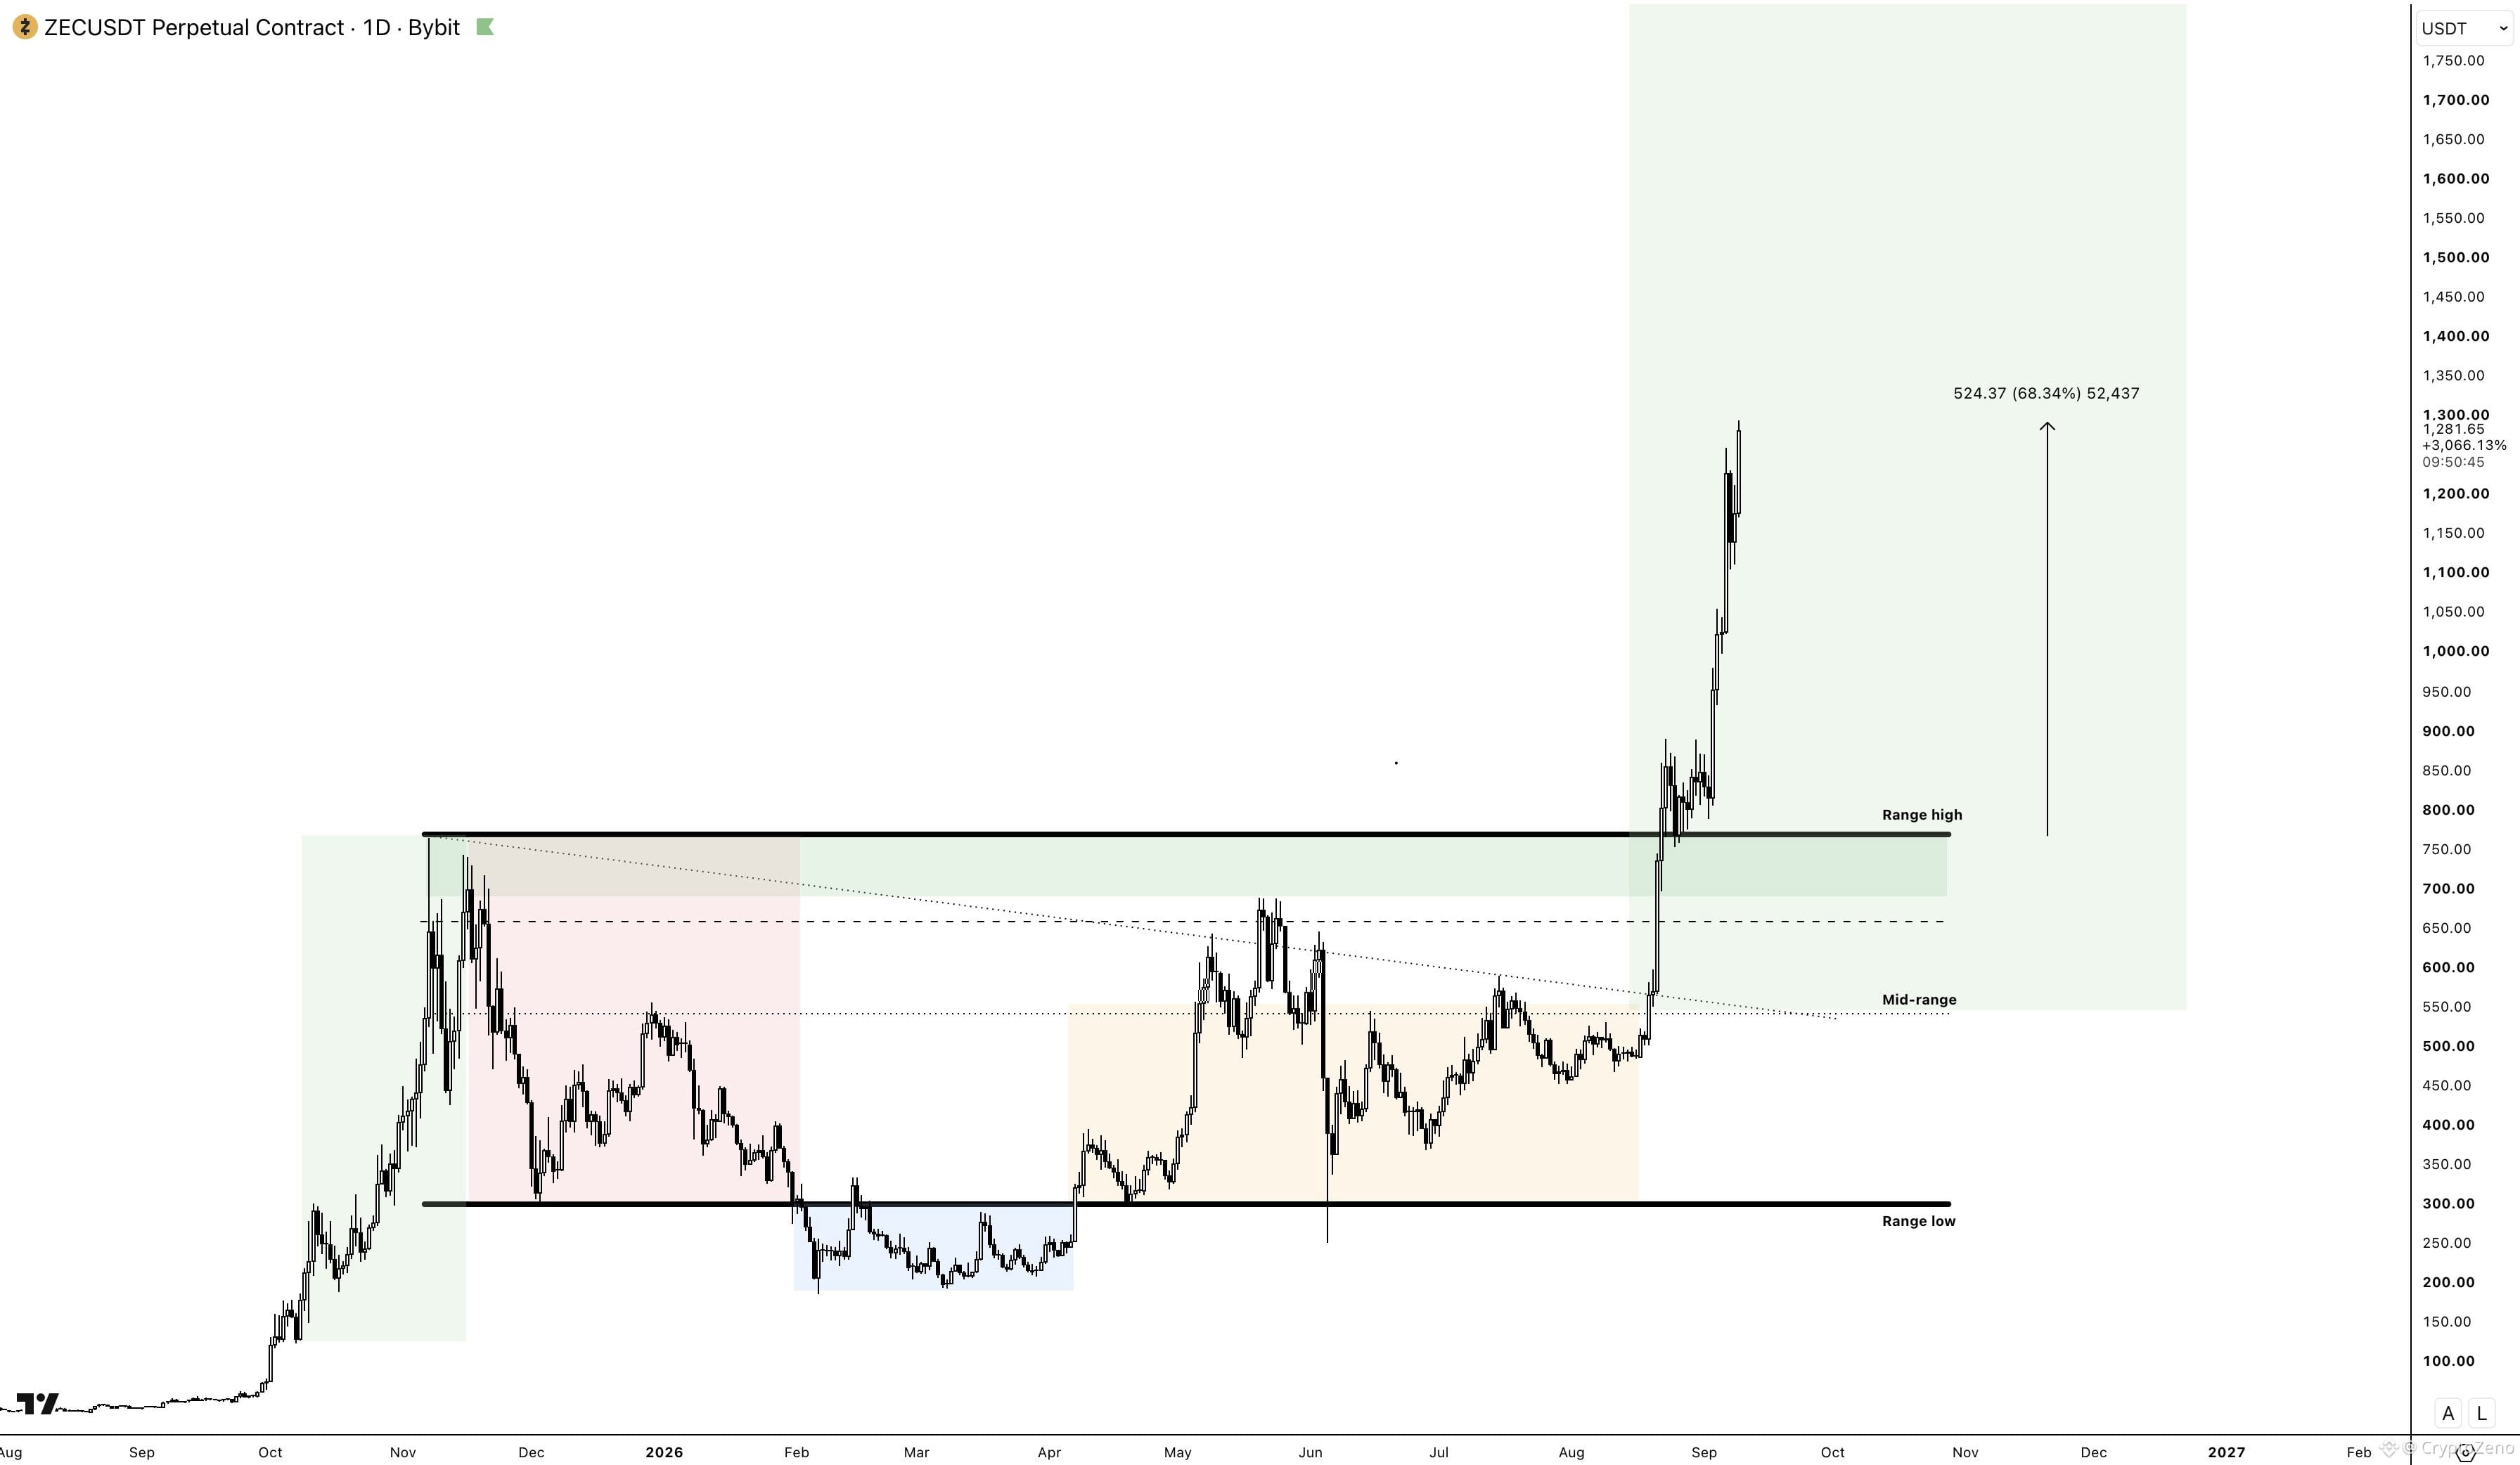
$ZEC +68%
{future}(ZECUSDT)
Up in a straight line since getting in.
Not selling. I think we’ll go much higher later.
$ZEC +68%
Up in a straight line since getting in.
Not selling. I think we’ll go much higher later.
Up in a straight line since getting in.
Not selling. I think we’ll go much higher later.
1
3
1.9k
·
--
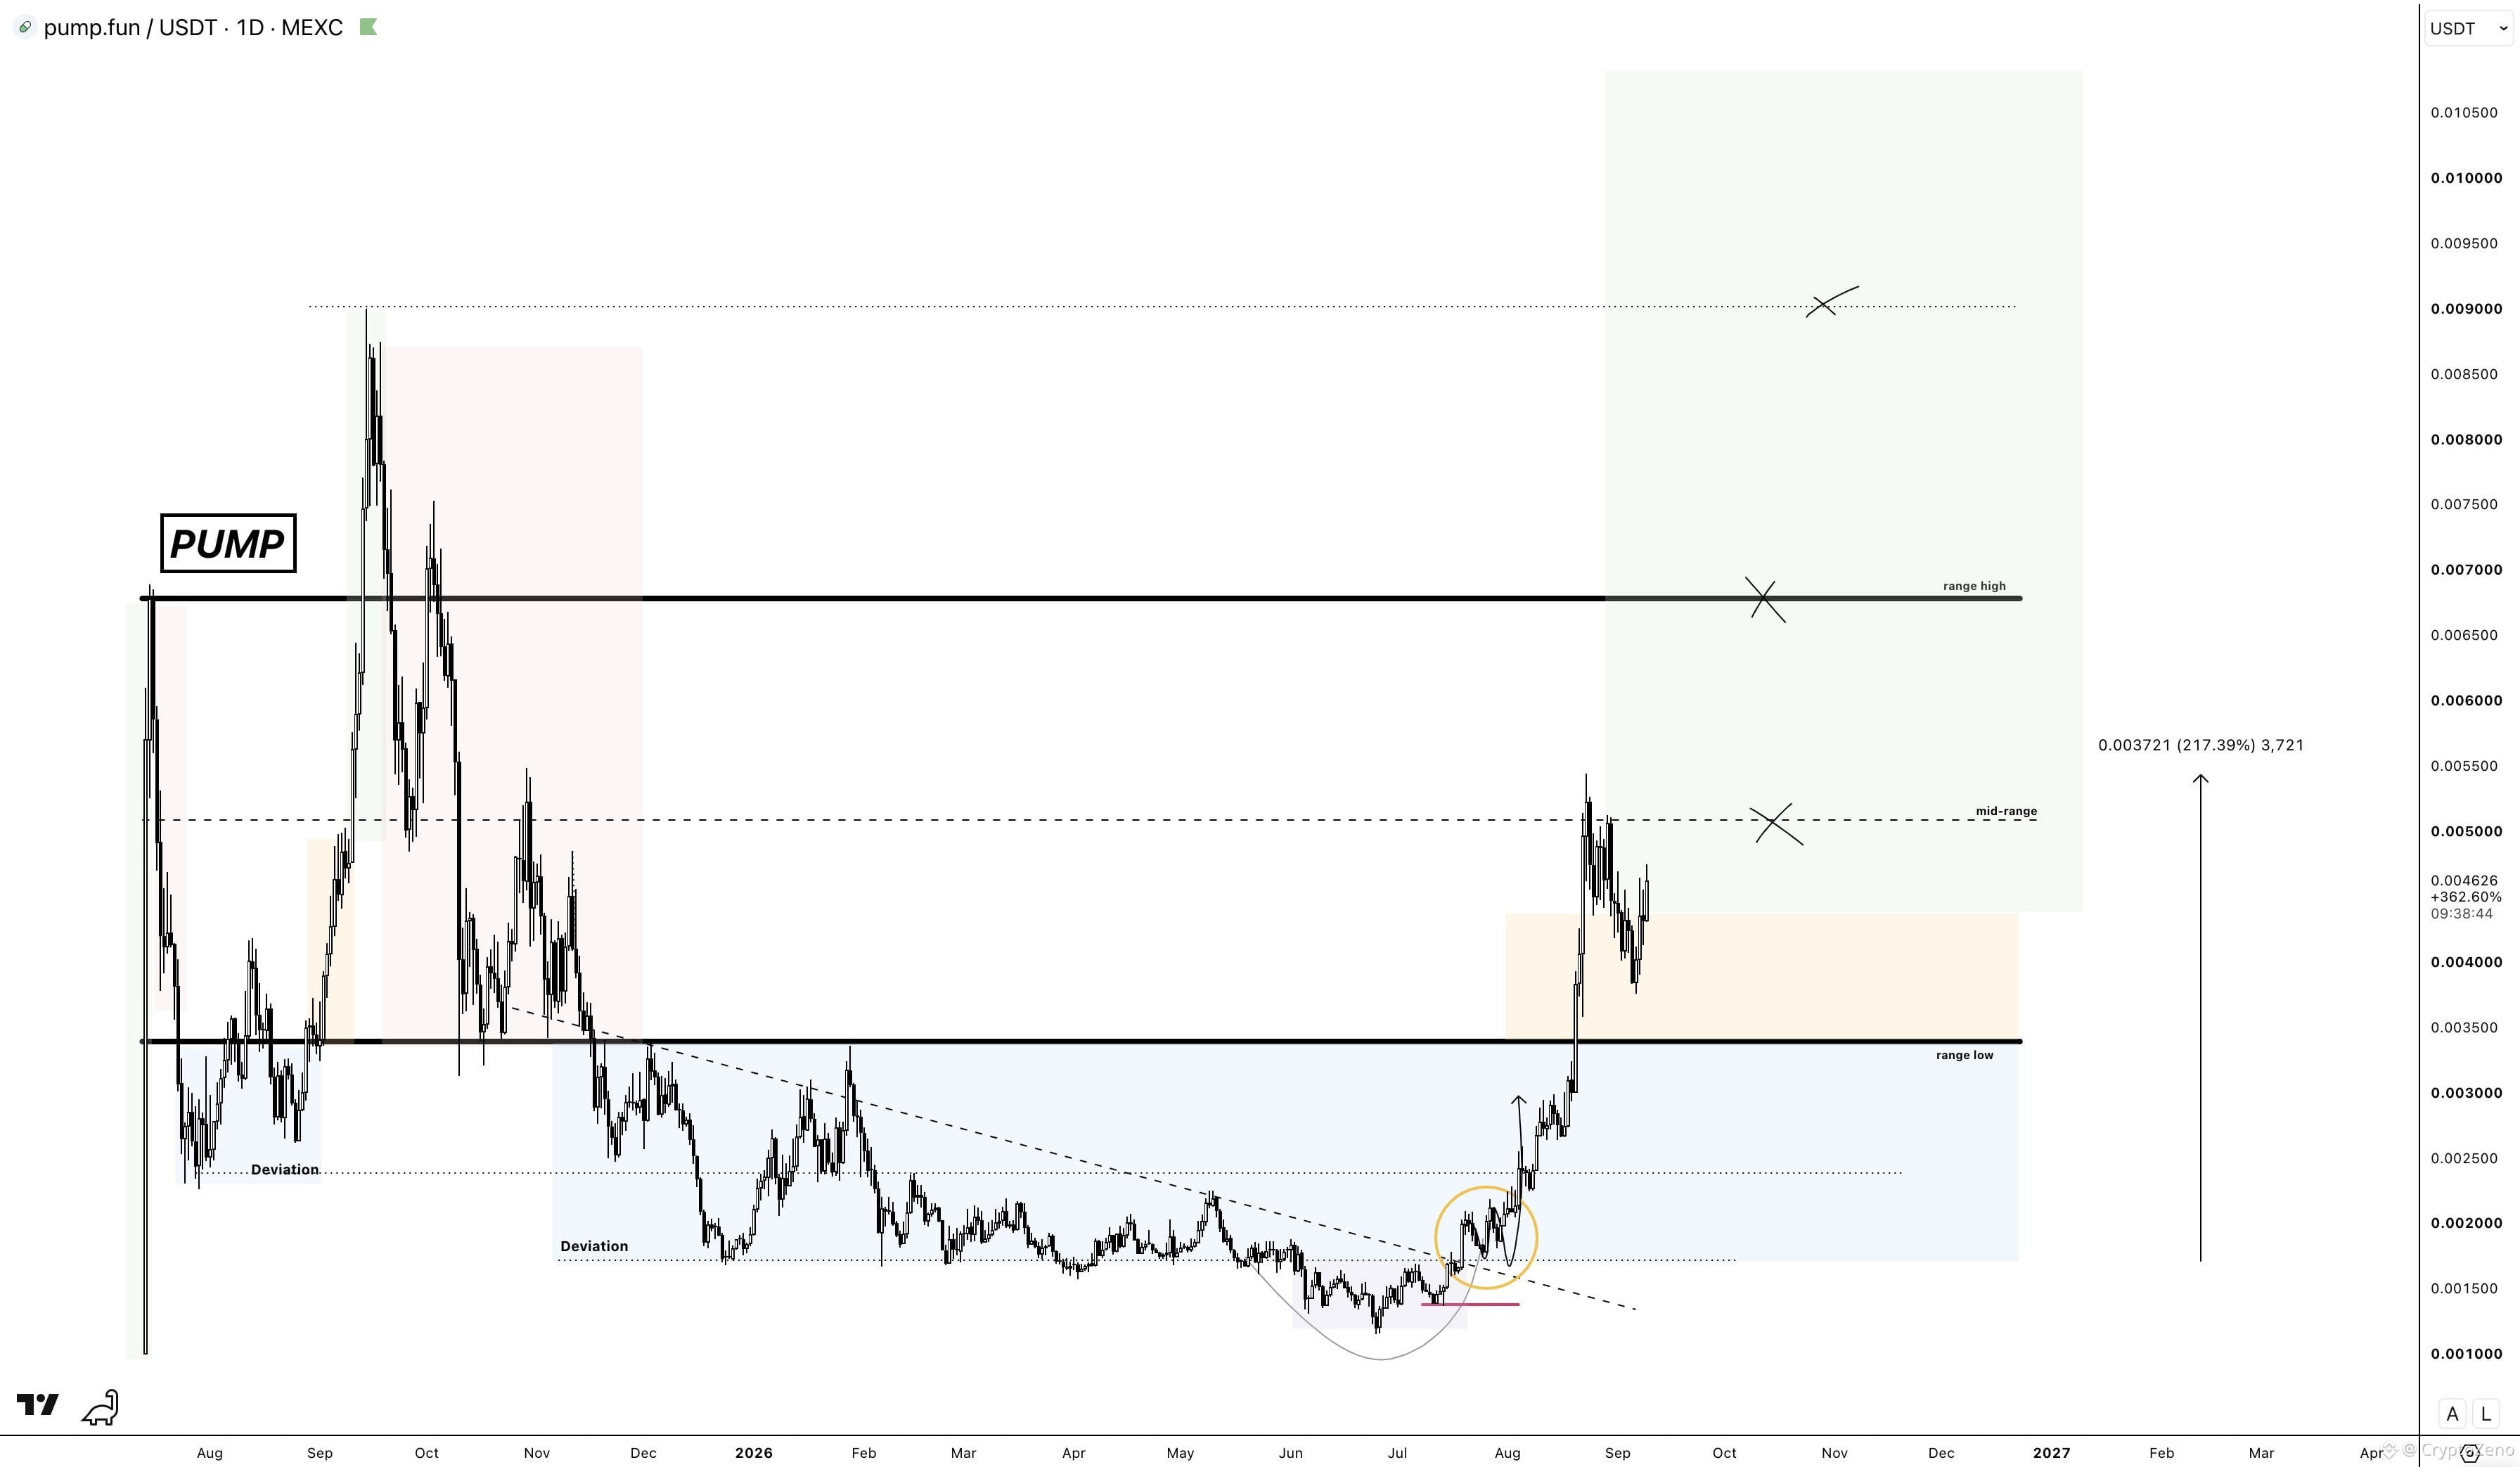
$PUMP Had a healthy dip during the STONK pump, but I think it'll bottom in the yellow box.
Still in my full position. One of my most comfortable spot positions.
Might add if we get more dips into the yellow.
{future}(PUMPUSDT)
$PUMP Had a healthy dip during the STONK pump, but I think it'll bottom in the yellow box.
Still in my full position. One of my most comfortable spot positions.
Might add if we get more dips into the yellow.
Still in my full position. One of my most comfortable spot positions.
Might add if we get more dips into the yellow.
1
1
2.4k
·
--
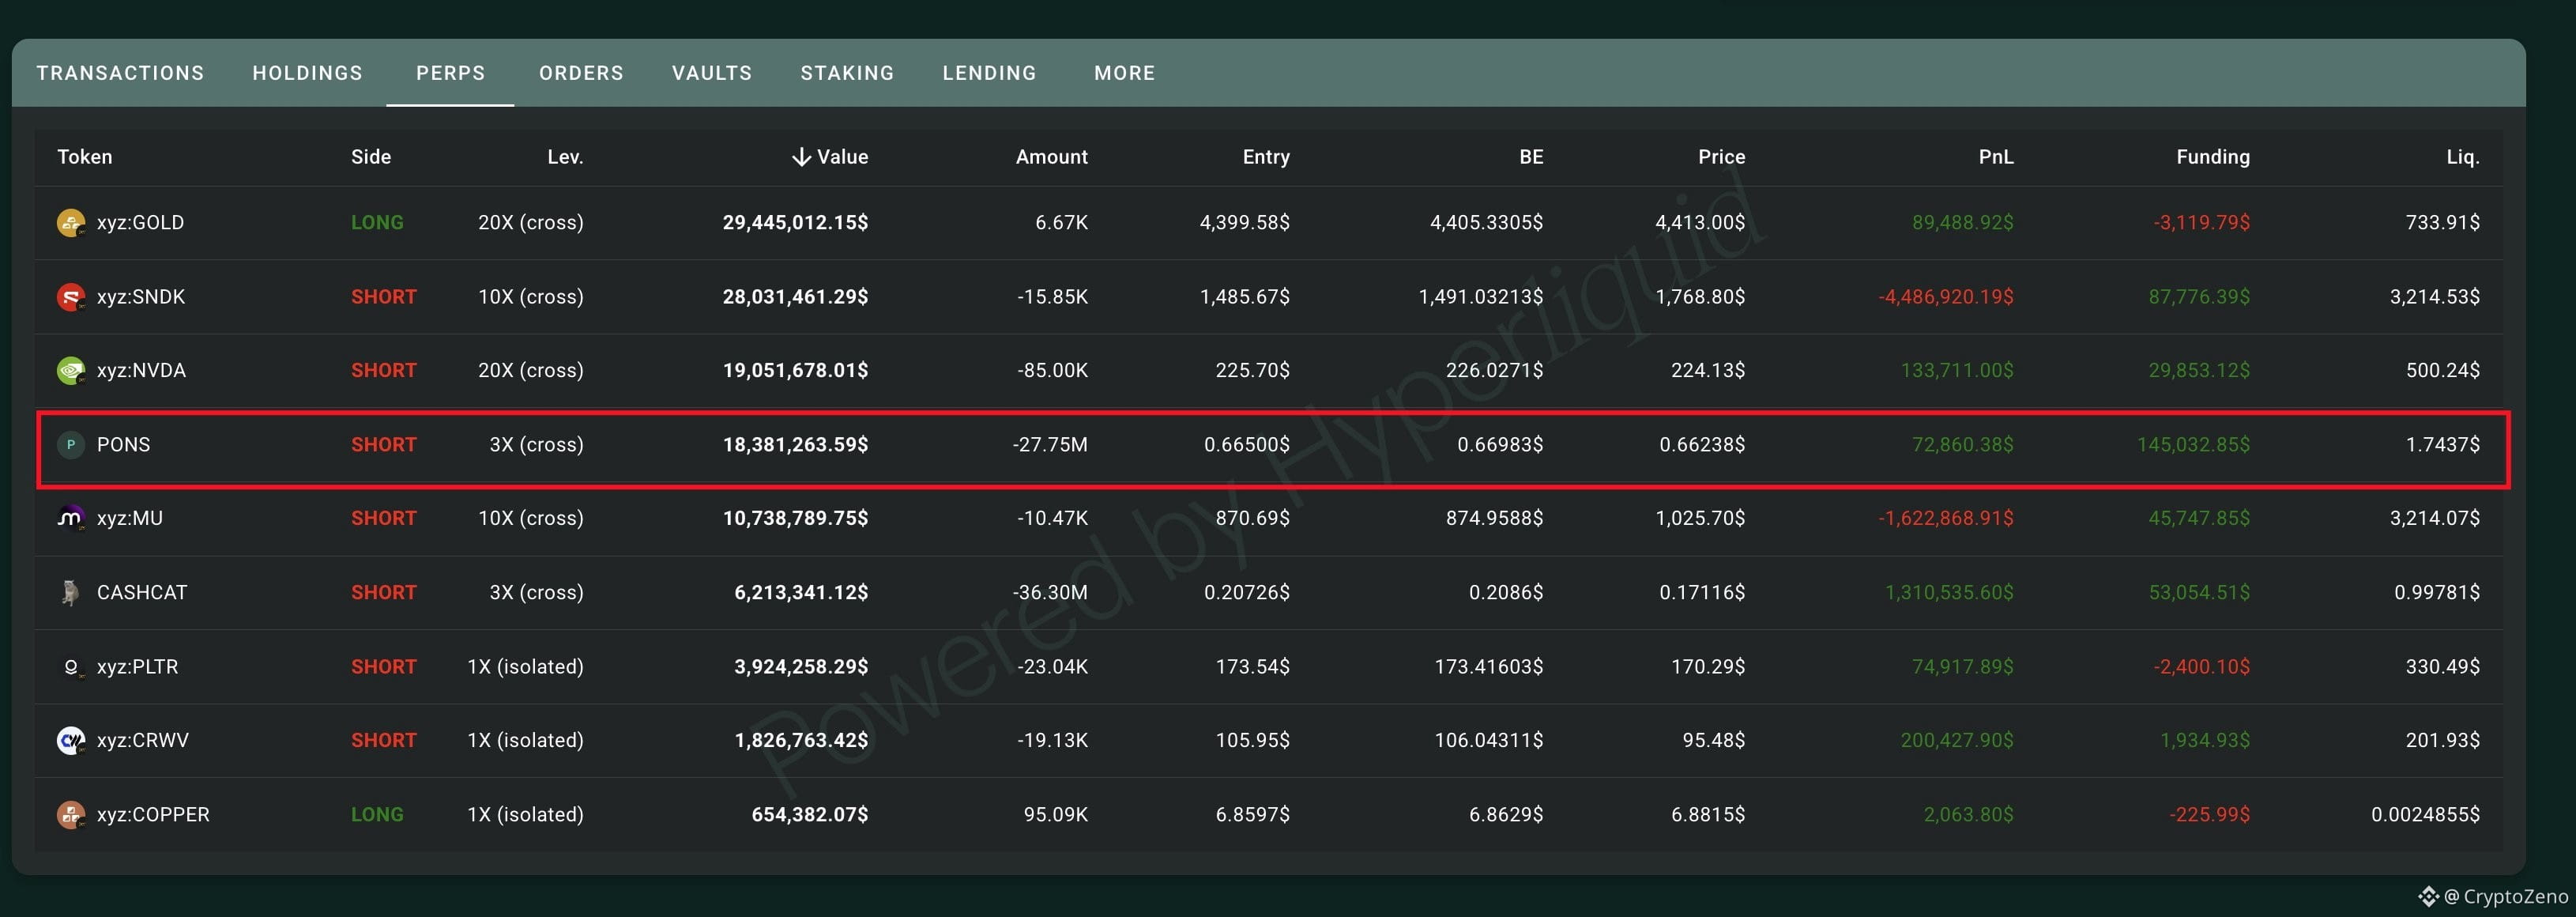
THIS IS INSANE
LORACLE'S $PONS SHORT IS NOW IN PROFIT AFTER -$8,000,000 uPnL
{future}(PONSUSDT)
What a crazy run
THIS IS INSANE
LORACLE'S $PONS SHORT IS NOW IN PROFIT AFTER -$8,000,000 uPnL
What a crazy run
LORACLE'S $PONS SHORT IS NOW IN PROFIT AFTER -$8,000,000 uPnL
What a crazy run
2
1
3.2k
·
--
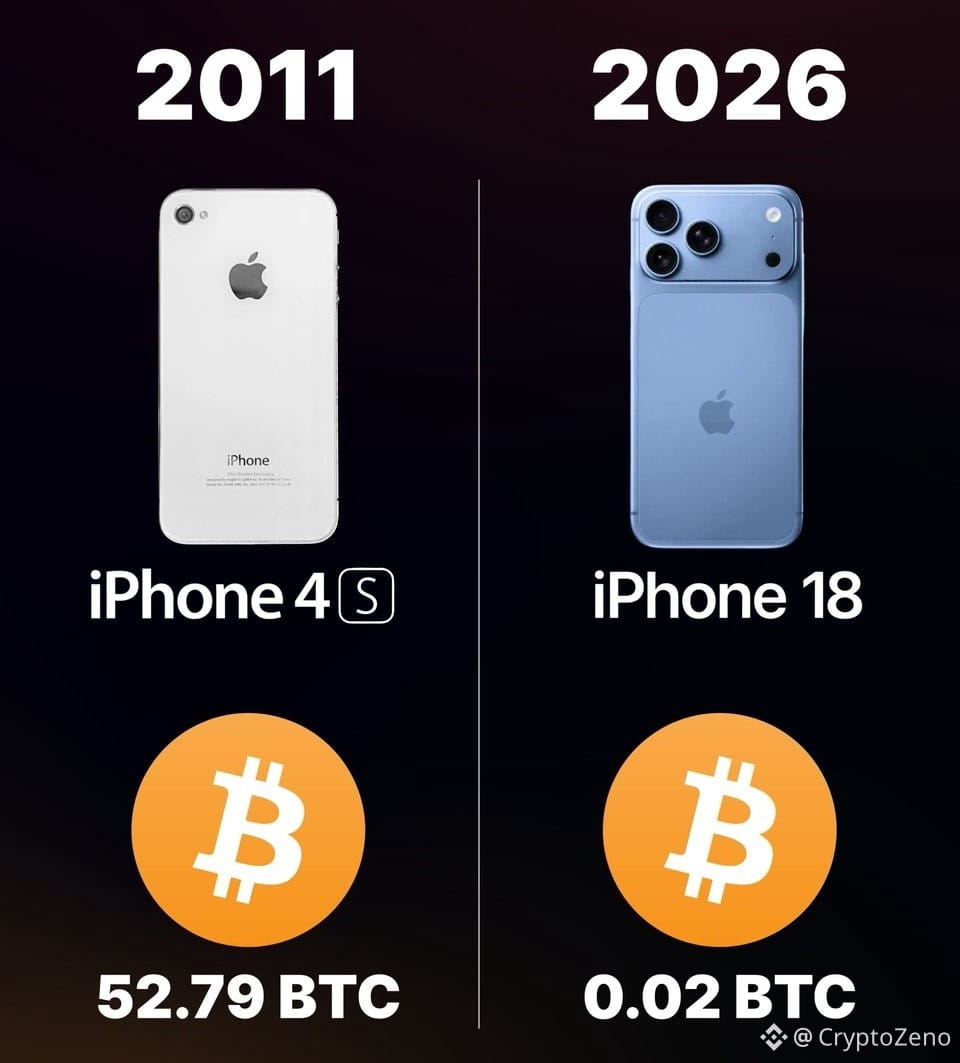
When the iPhone 4 launched in 2010, it cost 52.79 $BTC to buy one.
Today, it only costs 0.02 BTC to buy the new iPhone 18.
{future}(BTCUSDT)
When the iPhone 4 launched in 2010, it cost 52.79 $BTC to buy one.
Today, it only costs 0.02 BTC to buy the new iPhone 18.
Today, it only costs 0.02 BTC to buy the new iPhone 18.
1
2
1.4k
·
--
Verified
THIS IS INSANE
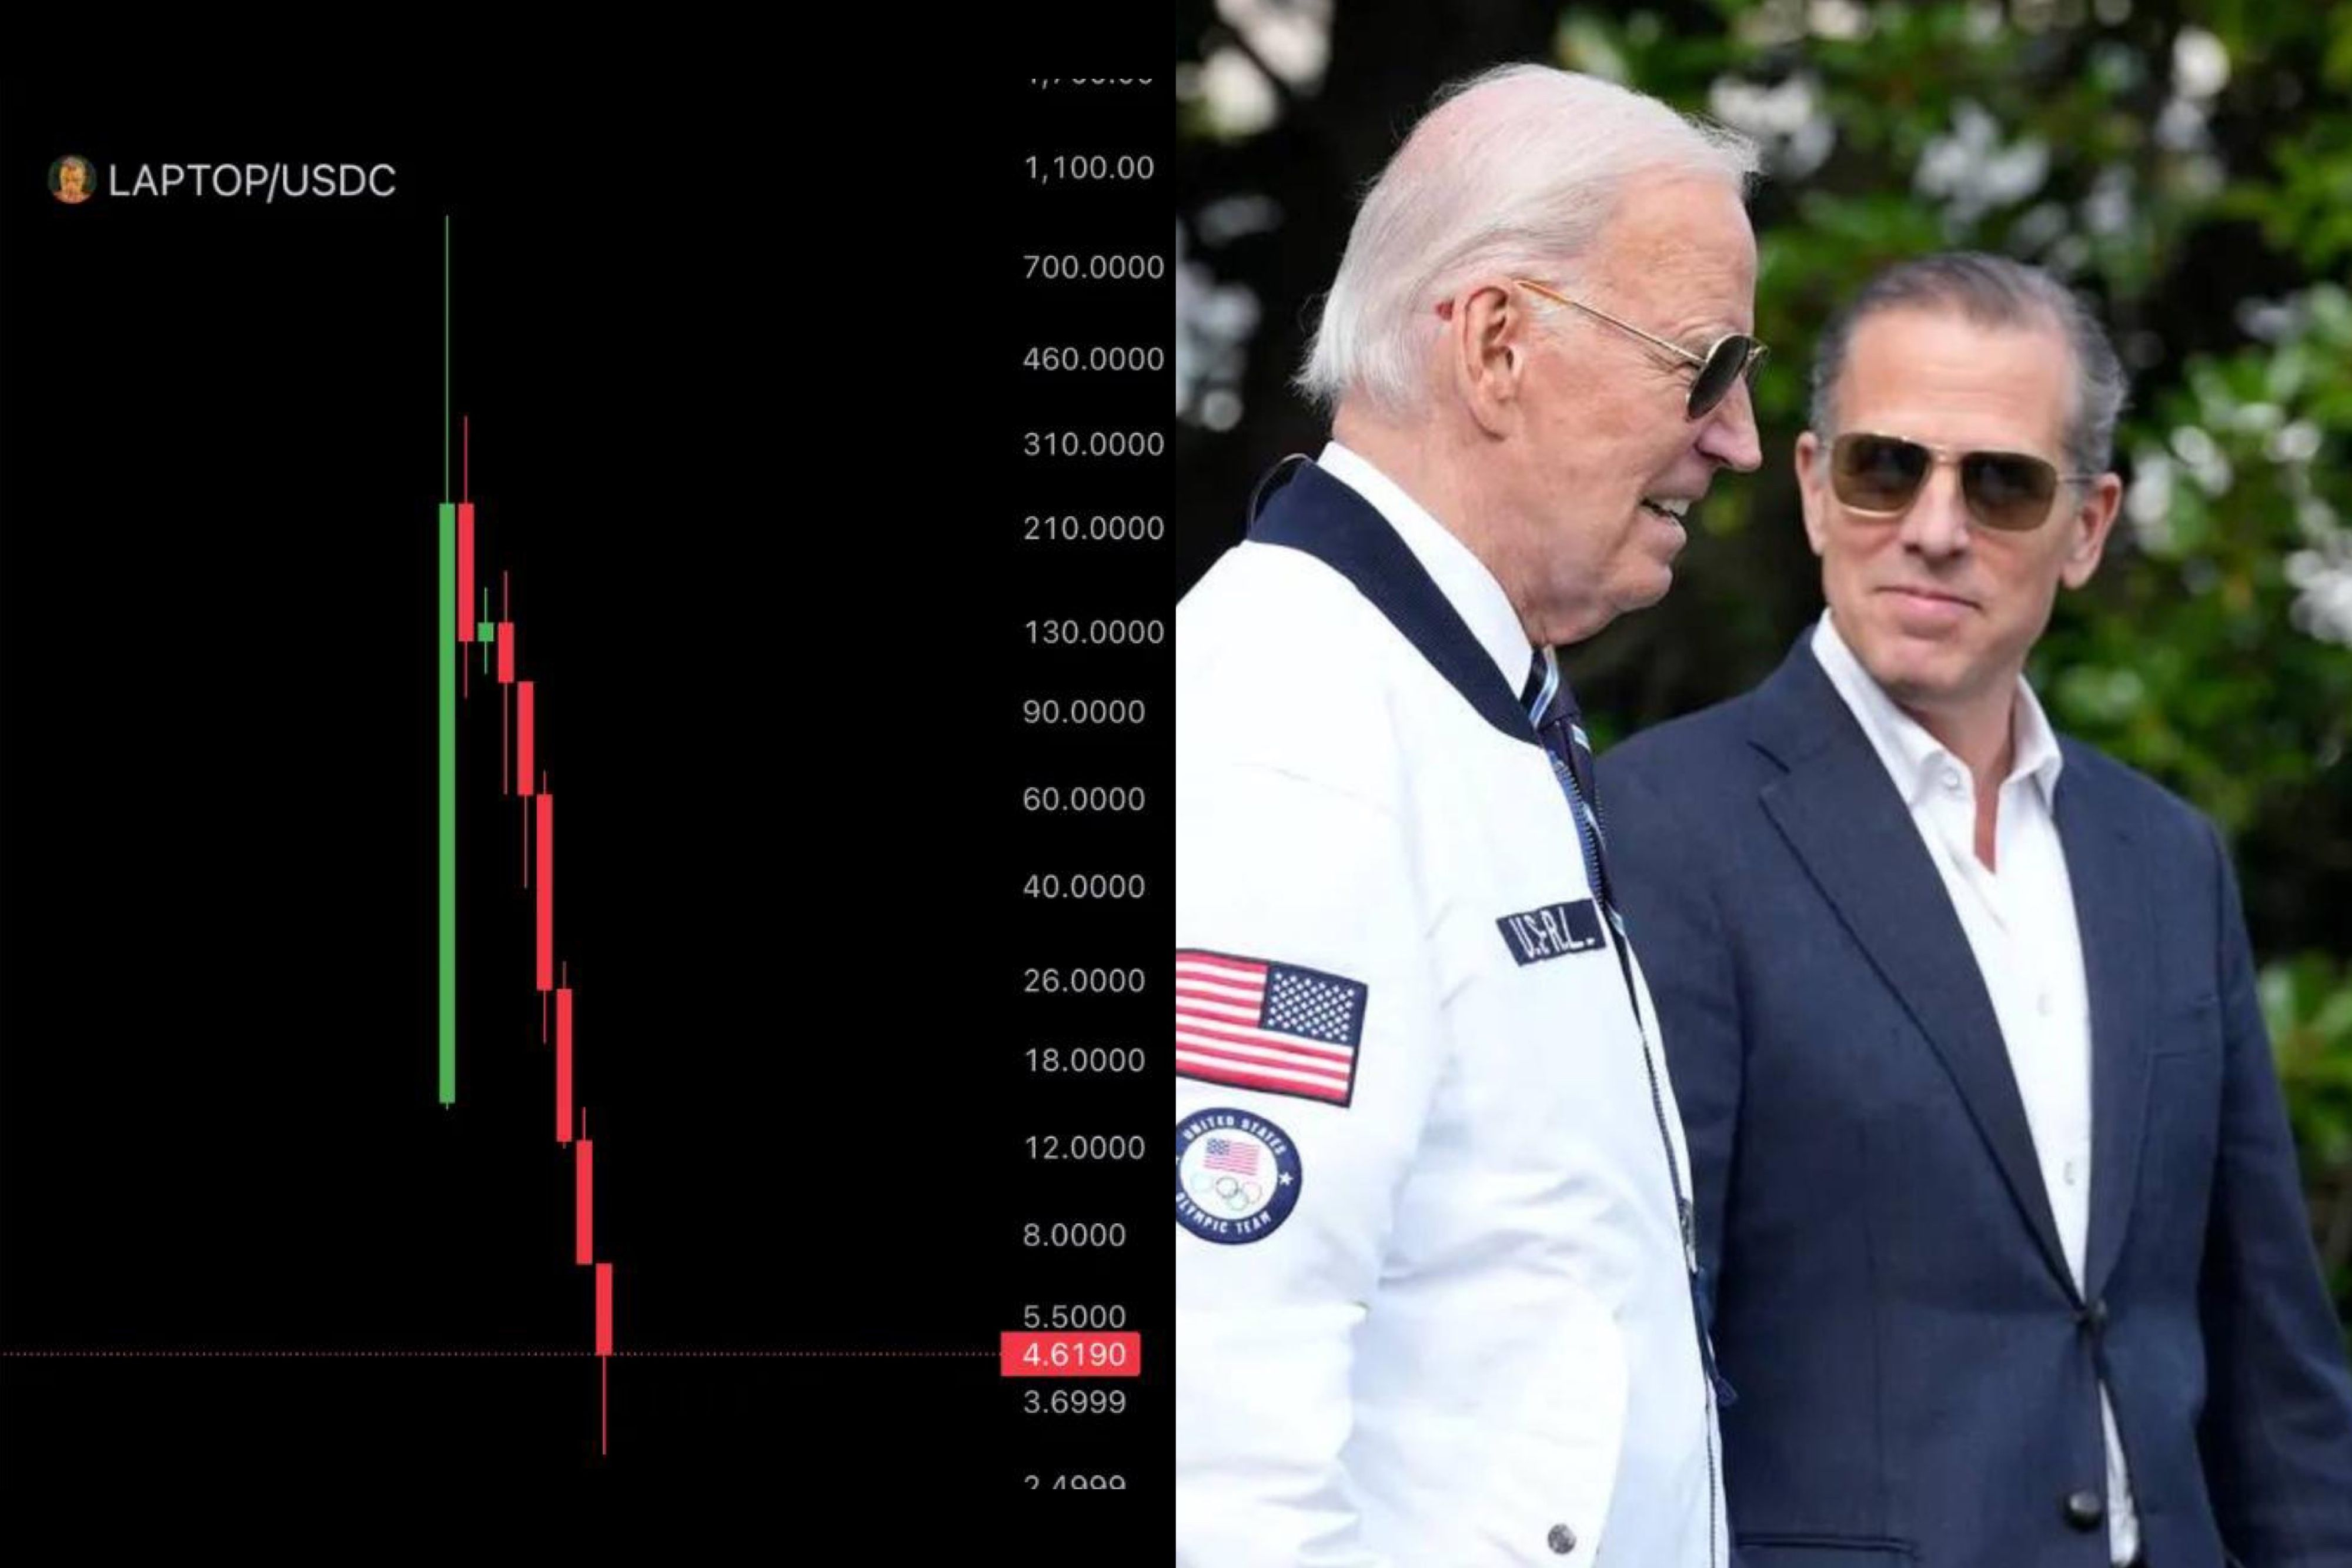
Hunter Biden's memecoin, $LAPTOP crashed 98% within minutes of its launch.
It was supposed to compensate the $TRUMP losers
{future}(TRUMPUSDT)
THIS IS INSANE
Hunter Biden's memecoin, $LAPTOP crashed 98% within minutes of its launch.
It was supposed to compensate the $TRUMP losers
Hunter Biden's memecoin, $LAPTOP crashed 98% within minutes of its launch.
It was supposed to compensate the $TRUMP losers
3
8
12.1k
·
--
Don't FOMO!
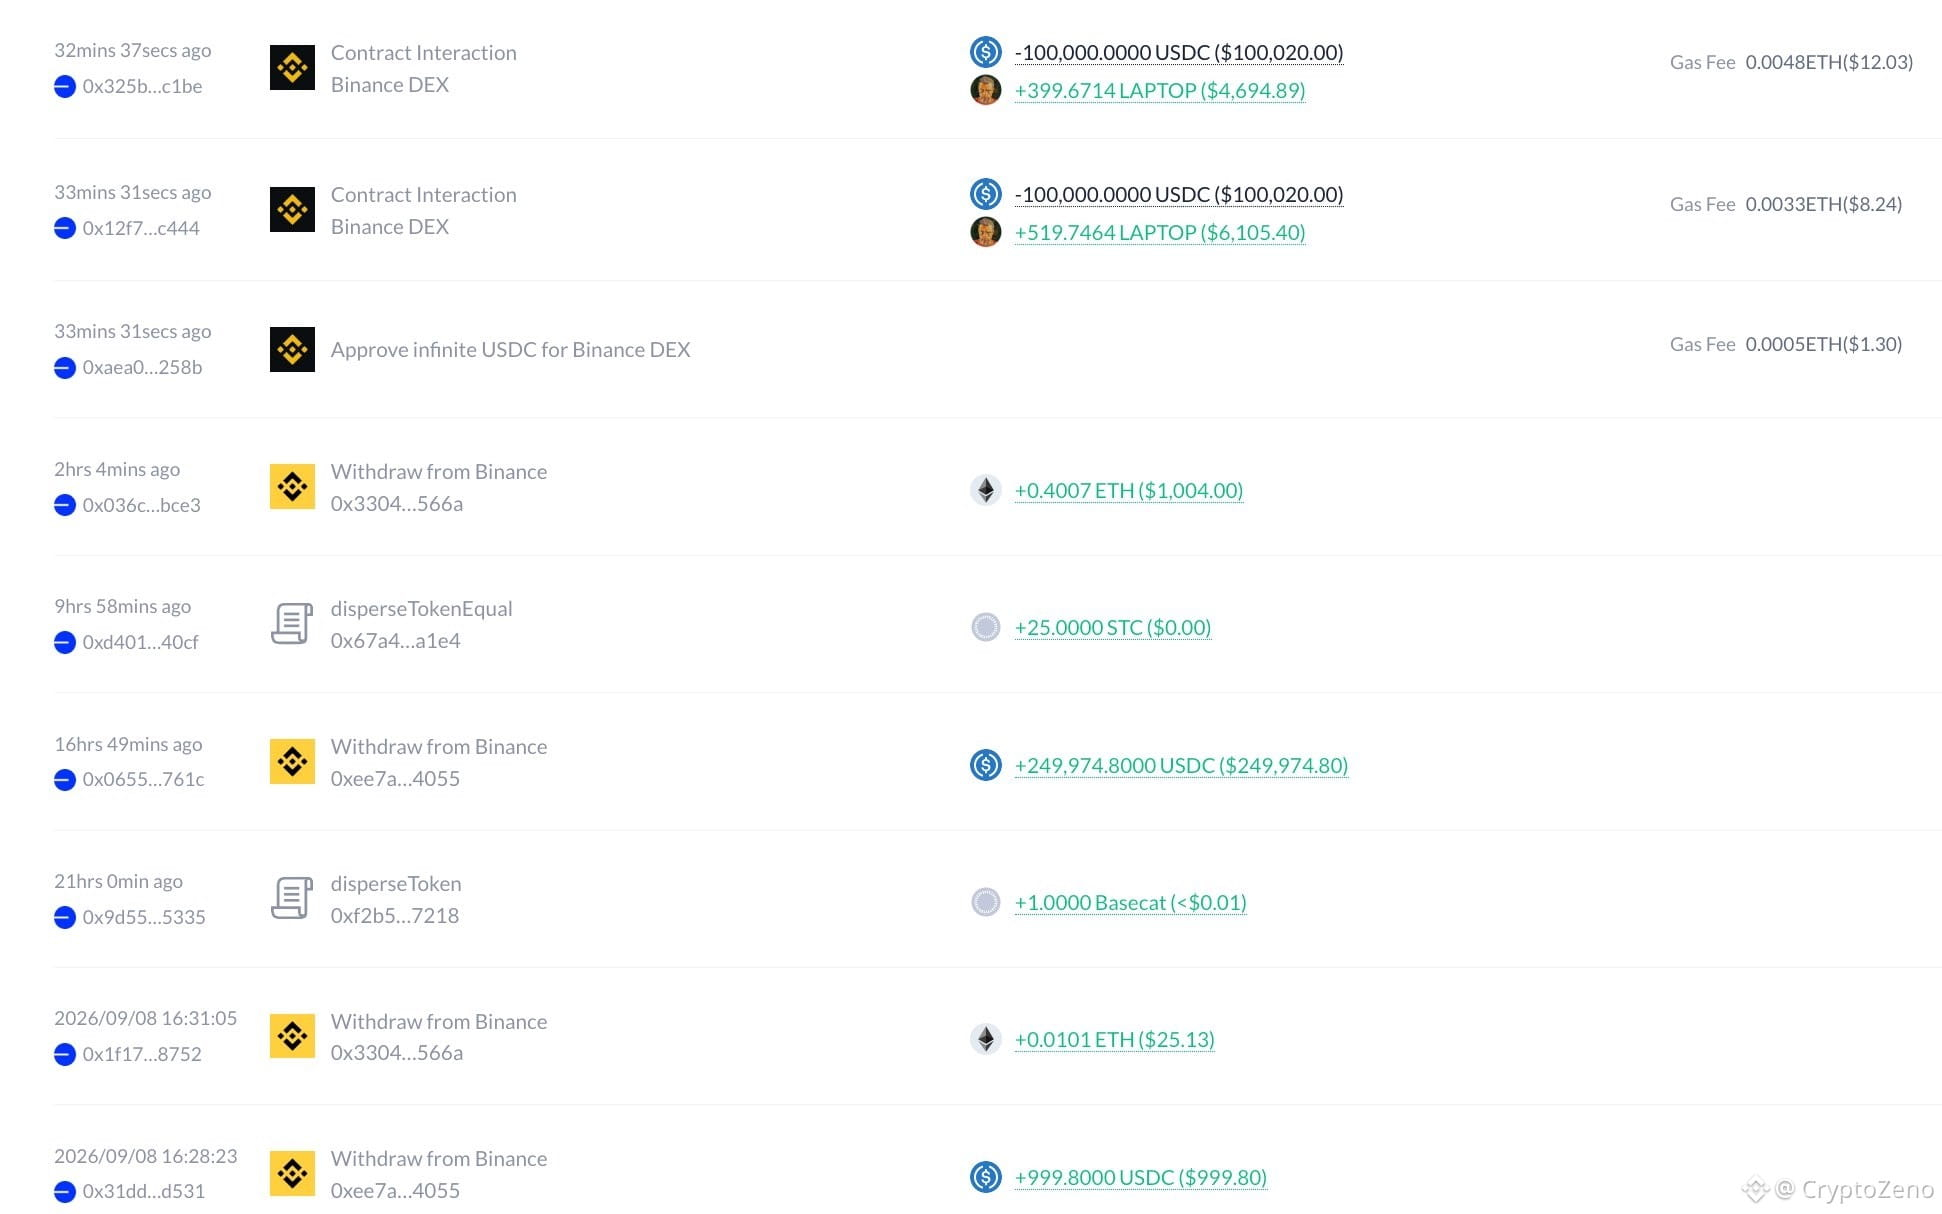
This guy turned $200K into just $3K by FOMOing into HunterBiden $LAPTOP.
He withdrew $250K from Binance in advance to buy LAPTOP as soon as it launched.
He ended up spending $200K to buy 919 LAPTOP at a high price of $218, which is now worth only $3K.
{future}(TRUMPUSDT)
Don't FOMO!
This guy turned $200K into just $3K by FOMOing into HunterBiden $LAPTOP.
He withdrew $250K from Binance in advance to buy LAPTOP as soon as it launched.
He ended up spending $200K to buy 919 LAPTOP at a high price of $218, which is now worth only $3K.
This guy turned $200K into just $3K by FOMOing into HunterBiden $LAPTOP.
He withdrew $250K from Binance in advance to buy LAPTOP as soon as it launched.
He ended up spending $200K to buy 919 LAPTOP at a high price of $218, which is now worth only $3K.
6
2
6.2k
·
--
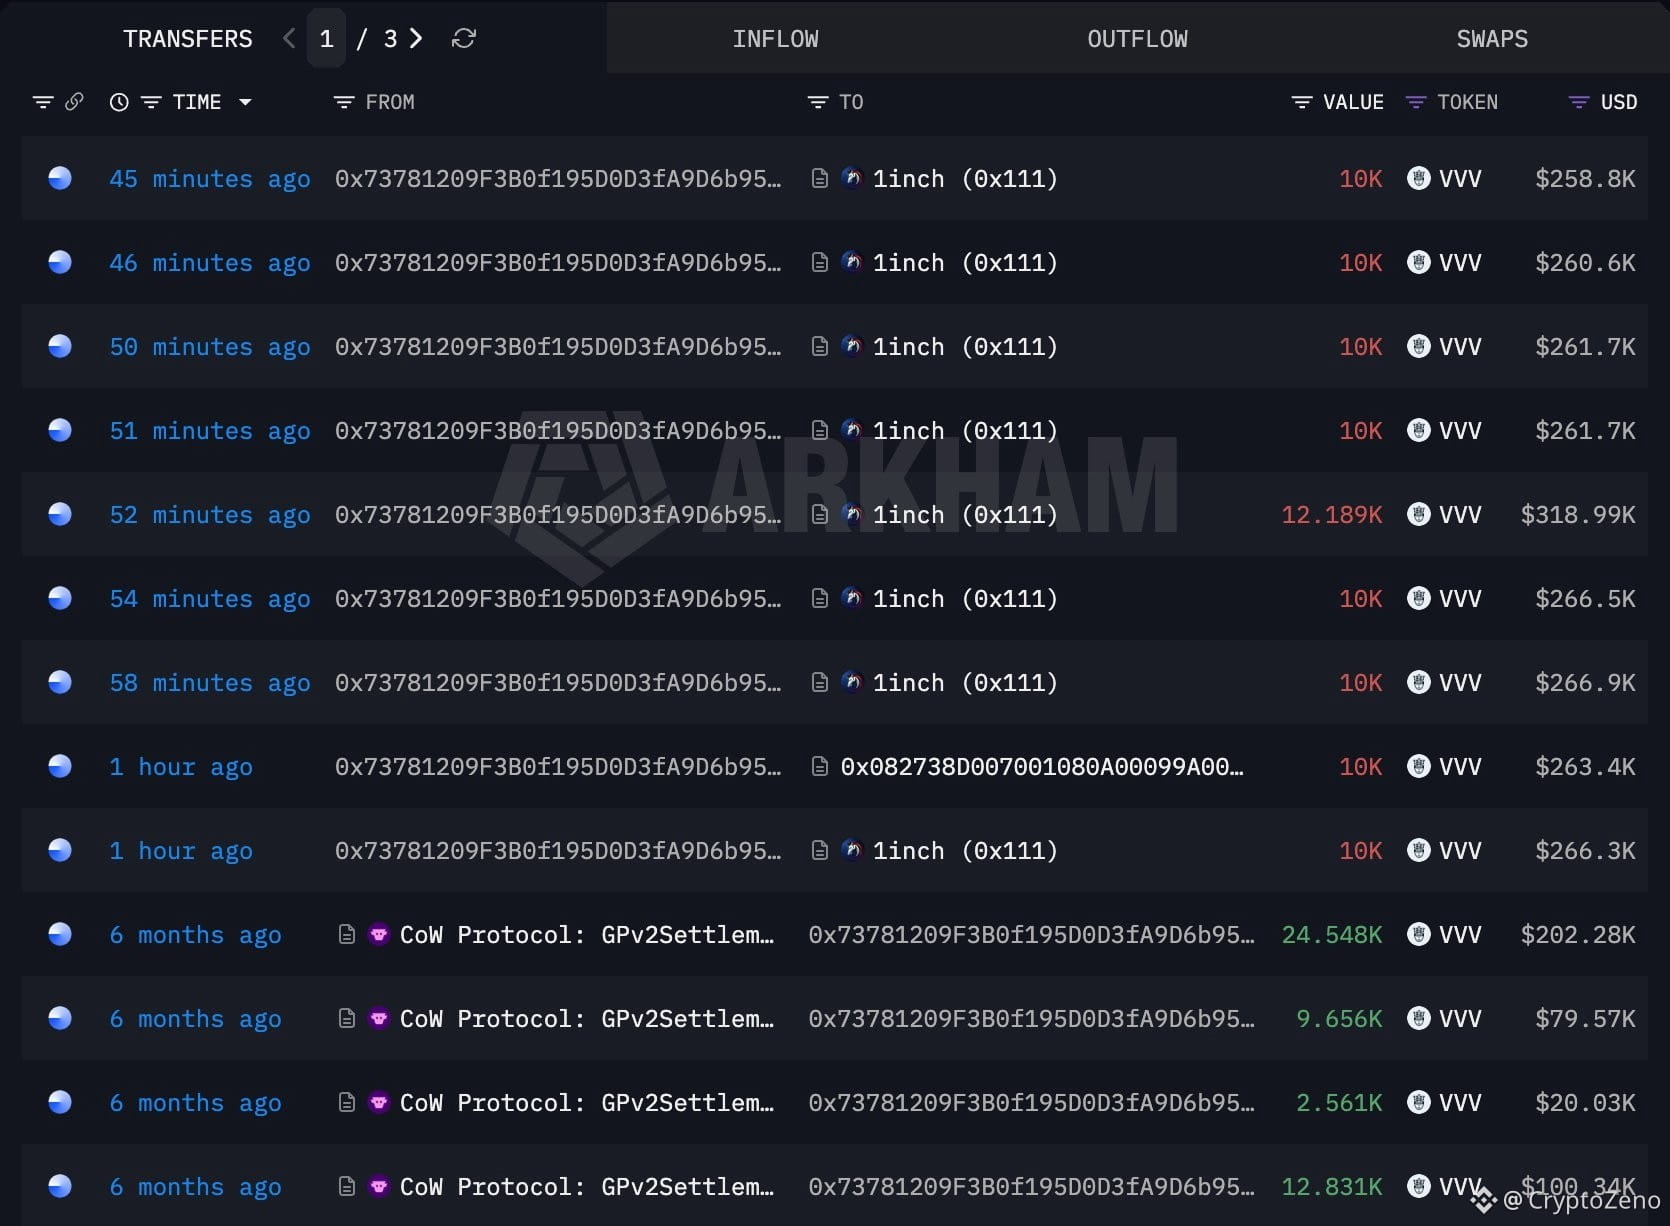
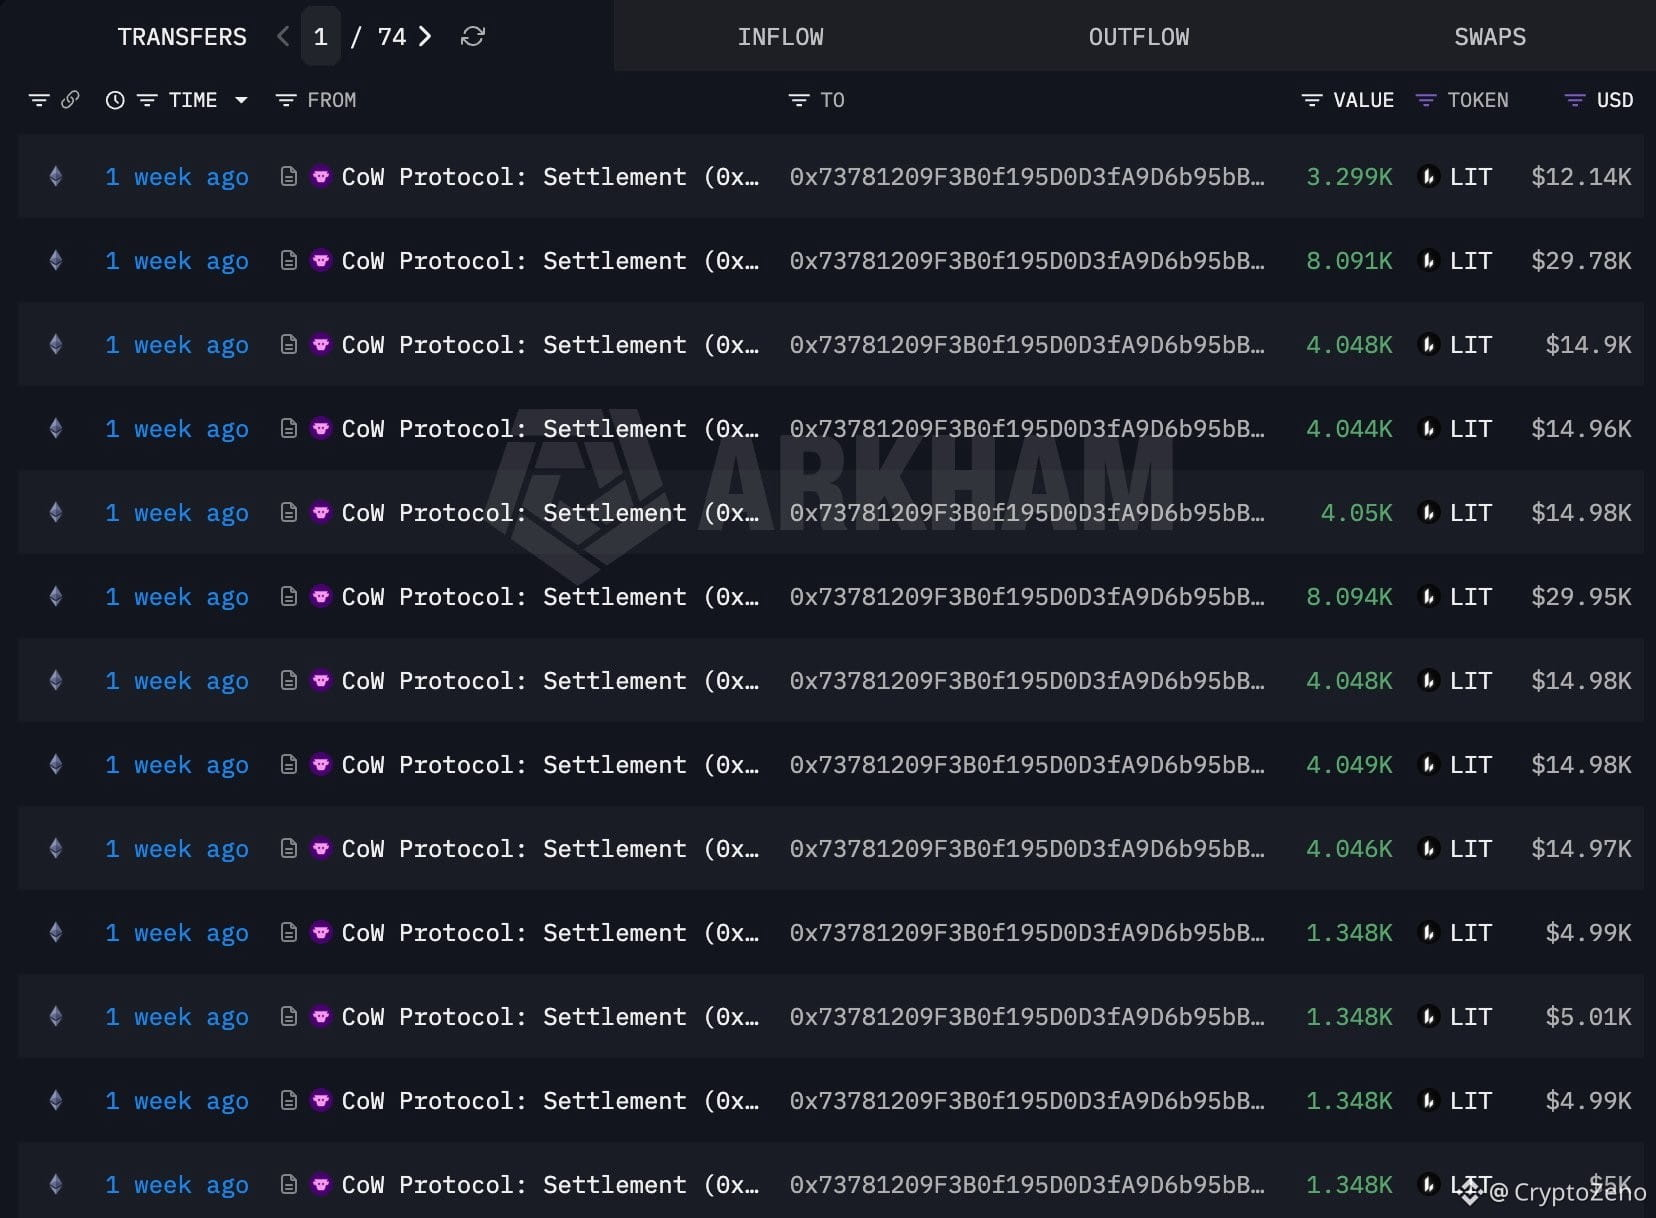
In just 6 months, whale 0x7378 made $14.93M from $VVV and $LIT !
6 months ago, he bought 102,189 VVV at $7.87.
After the price jumped today, he sold 92,189 VVV ($2.37M) at $25.75 and still holds 10K
VVV ($259.5K), making $1.83M in profit.
He also spent $11.3M to buy 4.74M LIT ($24.4M now) at an average price of $2.39 over the past 3 months, and is now sitting on a $13.1M unrealized profit.
{future}(LITUSDT)
{future}(VVVUSDT)
In just 6 months, whale 0x7378 made $14.93M from $VVV and $LIT !
6 months ago, he bought 102,189 VVV at $7.87.
After the price jumped today, he sold 92,189 VVV ($2.37M) at $25.75 and still holds 10K
VVV ($259.5K), making $1.83M in profit.
He also spent $11.3M to buy 4.74M LIT ($24.4M now) at an average price of $2.39 over the past 3 months, and is now sitting on a $13.1M unrealized profit.
6 months ago, he bought 102,189 VVV at $7.87.
After the price jumped today, he sold 92,189 VVV ($2.37M) at $25.75 and still holds 10K
VVV ($259.5K), making $1.83M in profit.
He also spent $11.3M to buy 4.74M LIT ($24.4M now) at an average price of $2.39 over the past 3 months, and is now sitting on a $13.1M unrealized profit.
2
4
2.4k
·
--
$BTC 2022 vs 2026:
{future}(BTCUSDT)
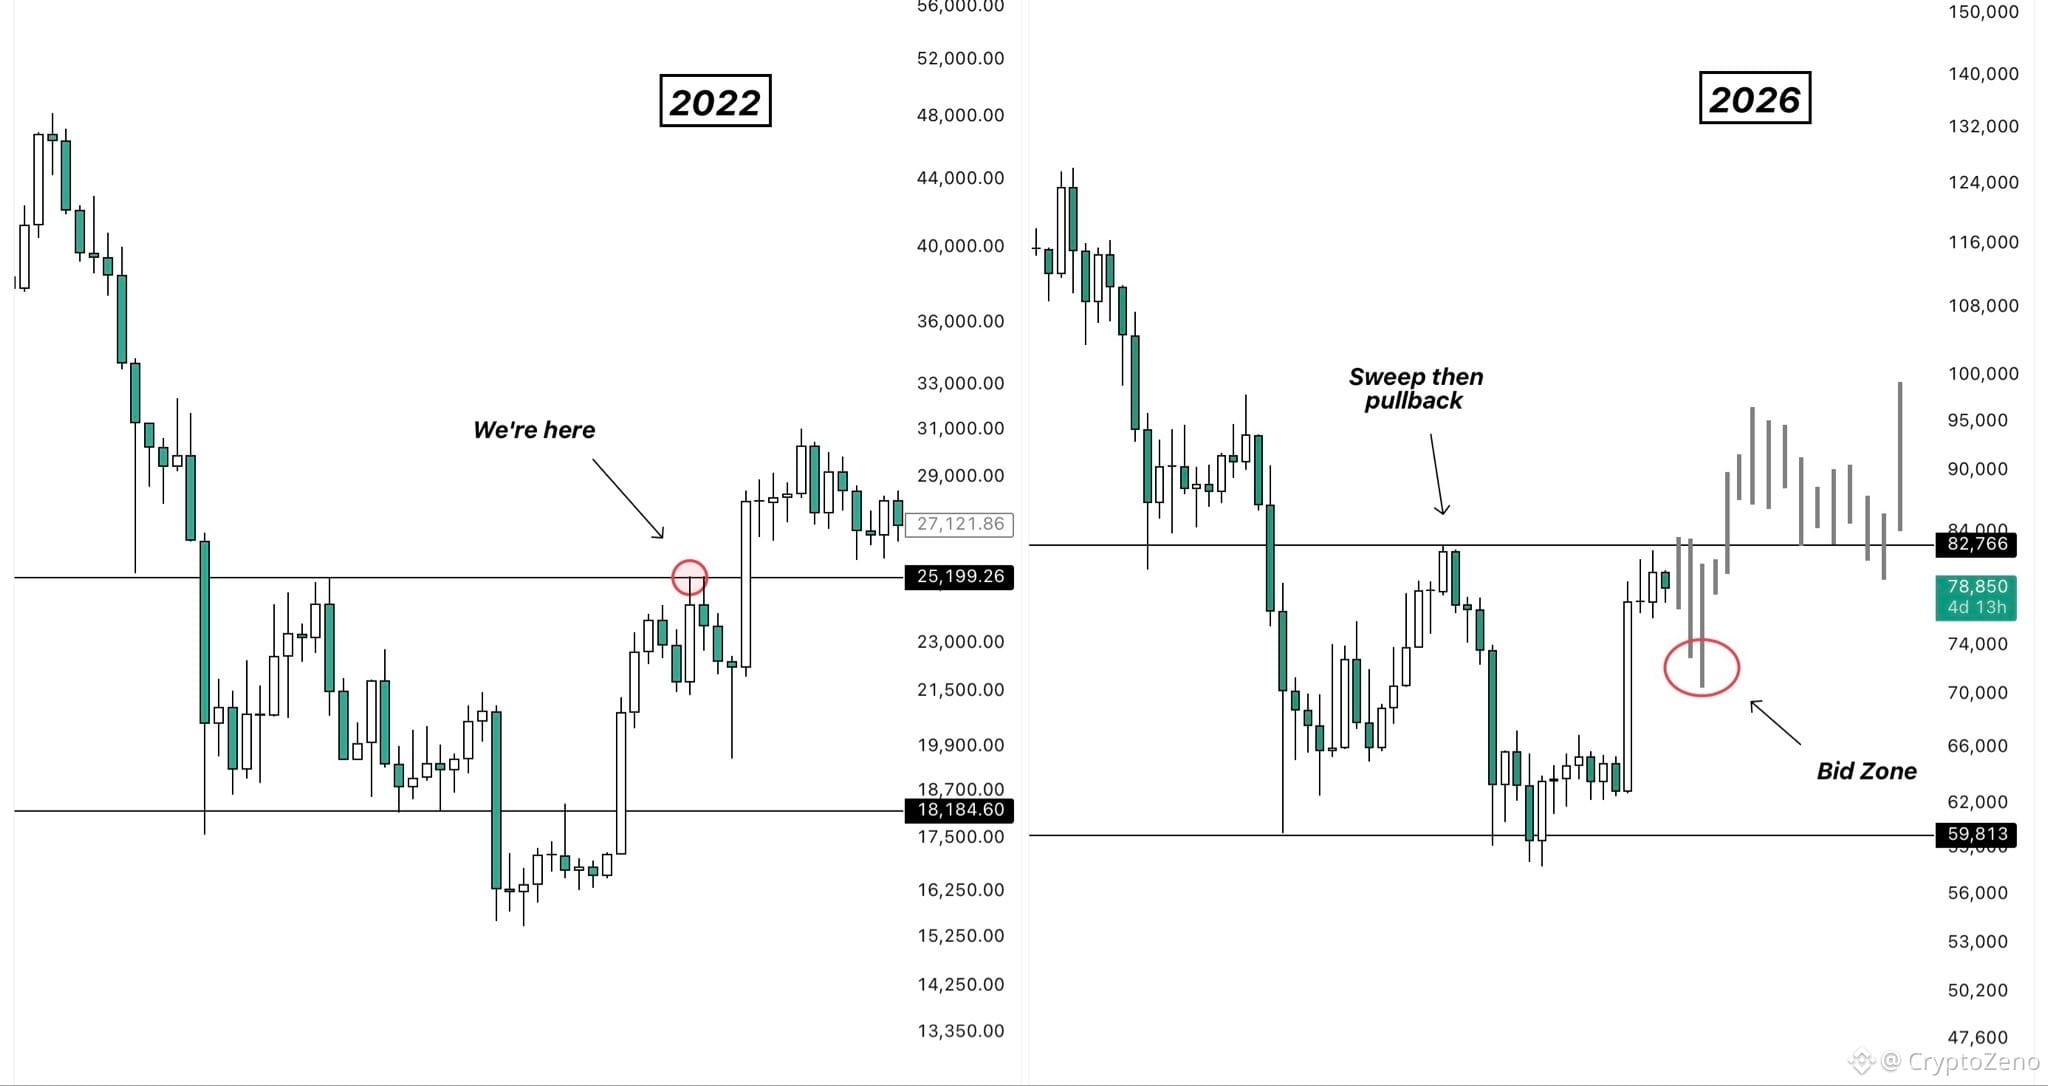
Back in 2022, BTC swept the previous high almost perfectly, followed by a short-term pullback before the next larger bullish expansion.
This time around, price is once again close to sweeping the previous high around $82.8k.
I’m expecting another manipulation move to the upside to wipe out the shorts that have tried to snipe the local top, followed by a short-term pullback into the $70k–$74k region.
This is where I’ve placed my bids to add to my already running swing long. The goal is to use these opportunities to build the position further and maximize the potential return from the broader move.
Even if I don’t manage to snipe the exact bottom of the pullback, it doesn’t really matter. What counts is the long-term vision.
$BTC 2022 vs 2026:
Back in 2022, BTC swept the previous high almost perfectly, followed by a short-term pullback before the next larger bullish expansion.
This time around, price is once again close to sweeping the previous high around $82.8k.
I’m expecting another manipulation move to the upside to wipe out the shorts that have tried to snipe the local top, followed by a short-term pullback into the $70k–$74k region.
This is where I’ve placed my bids to add to my already running swing long. The goal is to use these opportunities to build the position further and maximize the potential return from the broader move.
Even if I don’t manage to snipe the exact bottom of the pullback, it doesn’t really matter. What counts is the long-term vision.
Back in 2022, BTC swept the previous high almost perfectly, followed by a short-term pullback before the next larger bullish expansion.
This time around, price is once again close to sweeping the previous high around $82.8k.
I’m expecting another manipulation move to the upside to wipe out the shorts that have tried to snipe the local top, followed by a short-term pullback into the $70k–$74k region.
This is where I’ve placed my bids to add to my already running swing long. The goal is to use these opportunities to build the position further and maximize the potential return from the broader move.
Even if I don’t manage to snipe the exact bottom of the pullback, it doesn’t really matter. What counts is the long-term vision.
3
1.2k
·
--
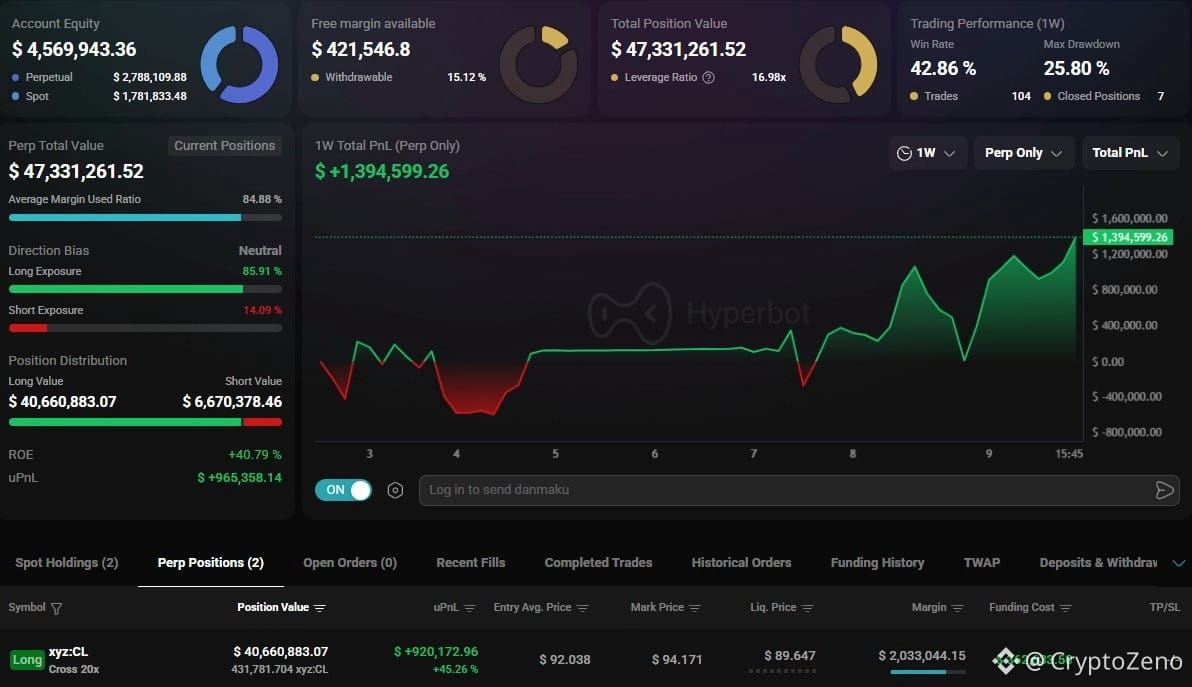
Someone opened a $40,600,000 Oil long with 20x leverage.
Liquidation Price: $89.64
He is betting on the US-Iran war escalation.
{future}(CLUSDT)
Someone opened a $40,600,000 Oil long with 20x leverage.
Liquidation Price: $89.64
He is betting on the US-Iran war escalation.
Liquidation Price: $89.64
He is betting on the US-Iran war escalation.
3
9
11.4k
·
--
$VVV OI up 166% after a fresh ATH, but structure stays healthy.
{future}(VVVUSDT)
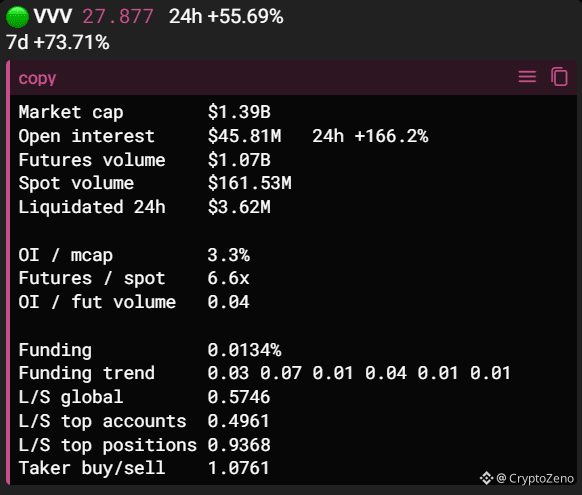
OI at just 3.3% of mcap, futures at 6.6x spot, both within the healthy range. Remarkably measured leverage for a $1.39B market cap token, especially on a day OI jumped 166%.
There's a split: L/S at 0.57, the crowd is clearly short. Top trader positions at 0.94, close to even but far less short than the crowd, big money isn't buying into this downside bet as much.
Funding is low at 0.0134%, longs aren't paying a real cost yet. Taker at 1.08, buyers slightly aggressive.
$3.62M liquidated in 24h, a large number, this move hasn't been painless.
The supply side is genuinely notable. Annual emissions cut from 3M to 2.5M, dropping to 2M on October 1, an automatic burn mechanism (every $100 in API credits burns $5 of VVV), and roughly 42% of supply already burned, a real deflationary structure.
OI is up 166%, three times faster than price (56%). That points to fresh leverage flowing in fast, and moves like this after a new ATH usually get tested with a pullback.
The fundamental side (tightening supply, real revenue, a strong narrative) and the technical side (the split, healthy structure) point the same way. But price already made a new high and OI grew this fast, so the risk/reward here is different from getting in earlier.
$VVV OI up 166% after a fresh ATH, but structure stays healthy.
OI at just 3.3% of mcap, futures at 6.6x spot, both within the healthy range. Remarkably measured leverage for a $1.39B market cap token, especially on a day OI jumped 166%.
There's a split: L/S at 0.57, the crowd is clearly short. Top trader positions at 0.94, close to even but far less short than the crowd, big money isn't buying into this downside bet as much.
Funding is low at 0.0134%, longs aren't paying a real cost yet. Taker at 1.08, buyers slightly aggressive.
$3.62M liquidated in 24h, a large number, this move hasn't been painless.
The supply side is genuinely notable. Annual emissions cut from 3M to 2.5M, dropping to 2M on October 1, an automatic burn mechanism (every $100 in API credits burns $5 of VVV), and roughly 42% of supply already burned, a real deflationary structure.
OI is up 166%, three times faster than price (56%). That points to fresh leverage flowing in fast, and moves like this after a new ATH usually get tested with a pullback.
The fundamental side (tightening supply, real revenue, a strong narrative) and the technical side (the split, healthy structure) point the same way. But price already made a new high and OI grew this fast, so the risk/reward here is different from getting in earlier.
OI at just 3.3% of mcap, futures at 6.6x spot, both within the healthy range. Remarkably measured leverage for a $1.39B market cap token, especially on a day OI jumped 166%.
There's a split: L/S at 0.57, the crowd is clearly short. Top trader positions at 0.94, close to even but far less short than the crowd, big money isn't buying into this downside bet as much.
Funding is low at 0.0134%, longs aren't paying a real cost yet. Taker at 1.08, buyers slightly aggressive.
$3.62M liquidated in 24h, a large number, this move hasn't been painless.
The supply side is genuinely notable. Annual emissions cut from 3M to 2.5M, dropping to 2M on October 1, an automatic burn mechanism (every $100 in API credits burns $5 of VVV), and roughly 42% of supply already burned, a real deflationary structure.
OI is up 166%, three times faster than price (56%). That points to fresh leverage flowing in fast, and moves like this after a new ATH usually get tested with a pullback.
The fundamental side (tightening supply, real revenue, a strong narrative) and the technical side (the split, healthy structure) point the same way. But price already made a new high and OI grew this fast, so the risk/reward here is different from getting in earlier.
2
1.6k
·
--
$FF update: moved from 0.14 to 0.15, the split stays strong, but this is data week, worth staying cautious.
{future}(FFUSDT)
Price is at 0.15113, up from 0.14467 in the last update. The split remains very strong: top trader positions at 3.19, close to the earlier 3.42. L/S at 0.88, the crowd leans mildly short.
Structure stays healthy: OI at 13.5% of mcap, futures at 4.1x spot. OI is up 31.8%, a bit faster than price (25.98%) but not extreme. Taker at 1.21, buyers are the aggressive side.
A single whale sell order sits above, $157K at 0.20, placed 18 hours ago. Roughly 32% above current price, could be the next test point, but it can be cancelled, not a fixed wall.
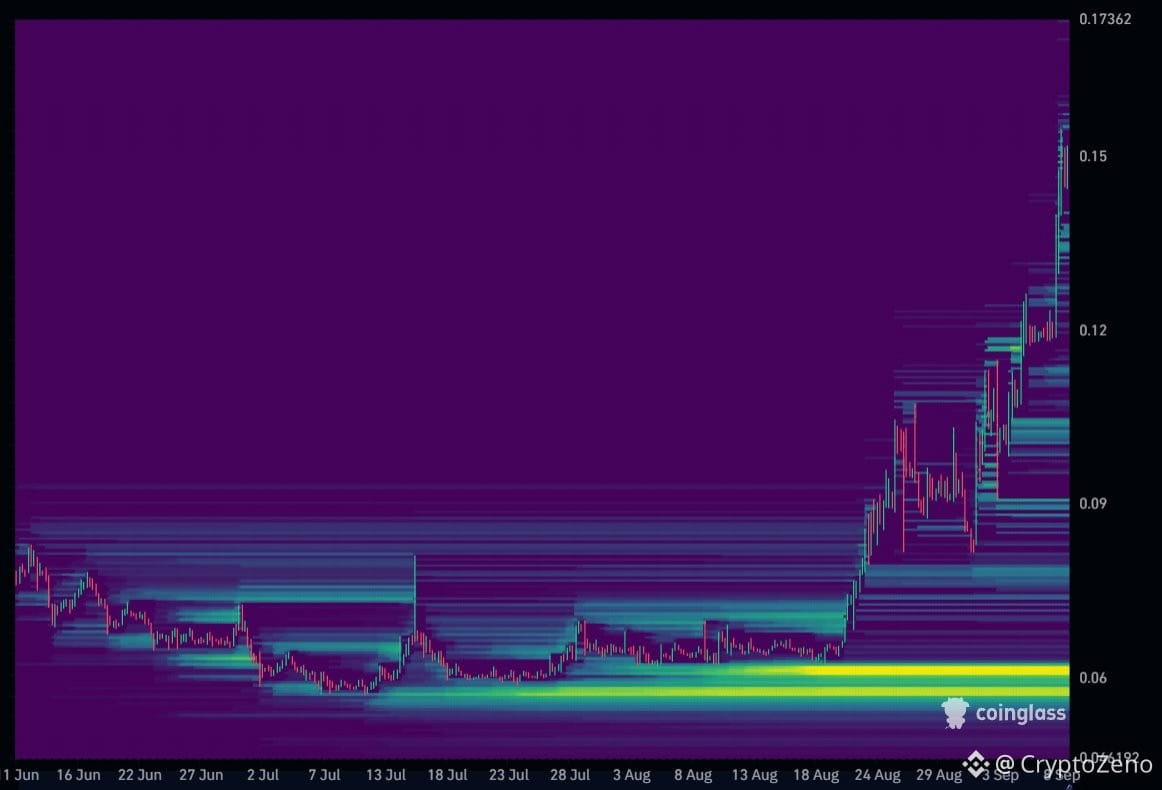
Below, the liquidation map calls for attention. There's a dense cluster at 0.06, roughly 60% below current price. Far off, but a zone that could get targeted in a downside scenario.
Worth flagging this week: CPI and PPI land this week, key macro data. Weeks like this can bring sudden, sharp market-wide moves. FF's own structure looks healthy, but a broader market shock could still hit this picture.
$FF update: moved from 0.14 to 0.15, the split stays strong, but this is data week, worth staying cautious.
Price is at 0.15113, up from 0.14467 in the last update. The split remains very strong: top trader positions at 3.19, close to the earlier 3.42. L/S at 0.88, the crowd leans mildly short.
Structure stays healthy: OI at 13.5% of mcap, futures at 4.1x spot. OI is up 31.8%, a bit faster than price (25.98%) but not extreme. Taker at 1.21, buyers are the aggressive side.
A single whale sell order sits above, $157K at 0.20, placed 18 hours ago. Roughly 32% above current price, could be the next test point, but it can be cancelled, not a fixed wall.
Below, the liquidation map calls for attention. There's a dense cluster at 0.06, roughly 60% below current price. Far off, but a zone that could get targeted in a downside scenario.
Worth flagging this week: CPI and PPI land this week, key macro data. Weeks like this can bring sudden, sharp market-wide moves. FF's own structure looks healthy, but a broader market shock could still hit this picture.
Price is at 0.15113, up from 0.14467 in the last update. The split remains very strong: top trader positions at 3.19, close to the earlier 3.42. L/S at 0.88, the crowd leans mildly short.
Structure stays healthy: OI at 13.5% of mcap, futures at 4.1x spot. OI is up 31.8%, a bit faster than price (25.98%) but not extreme. Taker at 1.21, buyers are the aggressive side.
A single whale sell order sits above, $157K at 0.20, placed 18 hours ago. Roughly 32% above current price, could be the next test point, but it can be cancelled, not a fixed wall.
Below, the liquidation map calls for attention. There's a dense cluster at 0.06, roughly 60% below current price. Far off, but a zone that could get targeted in a downside scenario.
Worth flagging this week: CPI and PPI land this week, key macro data. Weeks like this can bring sudden, sharp market-wide moves. FF's own structure looks healthy, but a broader market shock could still hit this picture.
5
2.5k
·
--
🚨 $BTC Log Curves Are Flashing A 2026–2027 Warning
{future}(BTCUSDT)
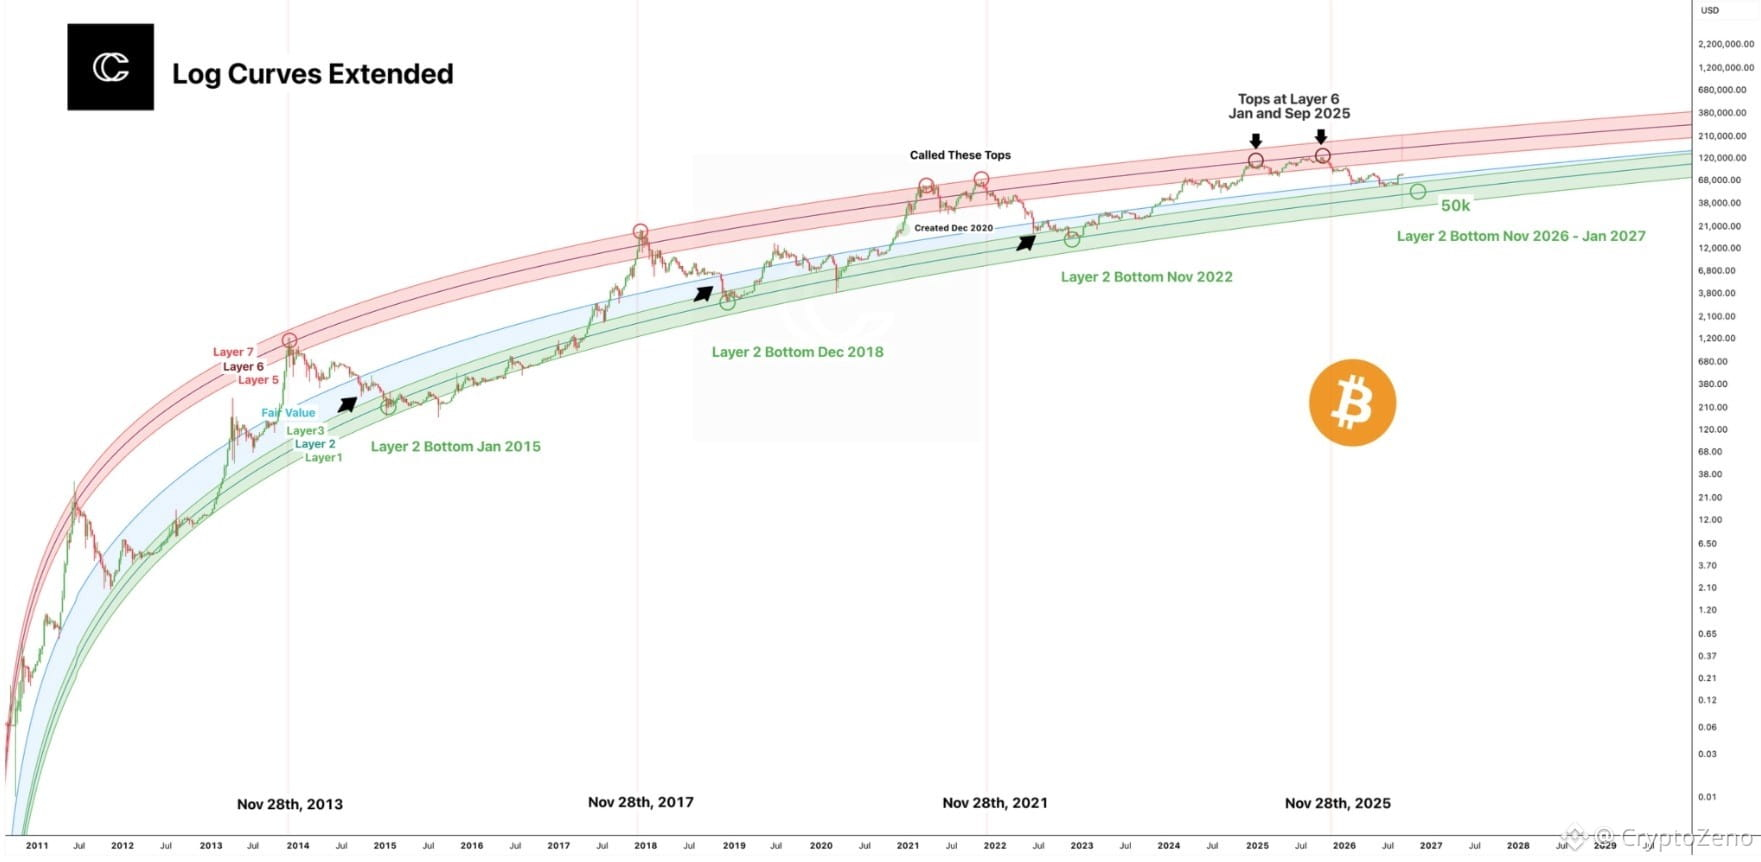
#Bitcoin is once again approaching the upper boundaries of the long term logarithmic growth curve, a zone that has historically aligned with major cycle tops. The chart highlights how previous peaks repeatedly interacted with the upper Layer 6 and Layer 7 bands before entering deep multi month corrections. In 2025, BTC reached the Layer 6 region twice, creating a structure that deserves attention as the cycle matures.
What makes the current setup more interesting is the distance between the projected top zone and the historical Layer 2 support structure. The model suggests that if BTC completes another major distribution phase near the upper logarithmic bands, the next large scale correction could eventually push price toward the lower green channel. The projected Layer 2 bottom around November 2026 to January 2027 sits near the $50K area, making it a critical long term valuation zone rather than an immediate target.
Historically, these logarithmic curves have acted less like precise price targets and more like structural boundaries for Bitcoin market cycles. Major tops formed near the red bands, while deep bear market bottoms repeatedly found support around the lower green layers. The repeating interaction between these zones suggests that time and price compression may be just as important as momentum when evaluating the current cycle.
The key question now is whether BTC can break decisively above the established upper curve and invalidate the historical pattern, or whether the market is approaching another distribution phase. If the logarithmic structure continues to rhyme with previous cycles, the next major opportunity may not come at the top, but after a prolonged reset toward the lower valuation bands.
🚨 $BTC Log Curves Are Flashing A 2026–2027 Warning
#Bitcoin is once again approaching the upper boundaries of the long term logarithmic growth curve, a zone that has historically aligned with major cycle tops. The chart highlights how previous peaks repeatedly interacted with the upper Layer 6 and Layer 7 bands before entering deep multi month corrections. In 2025, BTC reached the Layer 6 region twice, creating a structure that deserves attention as the cycle matures.
What makes the current setup more interesting is the distance between the projected top zone and the historical Layer 2 support structure. The model suggests that if BTC completes another major distribution phase near the upper logarithmic bands, the next large scale correction could eventually push price toward the lower green channel. The projected Layer 2 bottom around November 2026 to January 2027 sits near the $50K area, making it a critical long term valuation zone rather than an immediate target.
Historically, these logarithmic curves have acted less like precise price targets and more like structural boundaries for Bitcoin market cycles. Major tops formed near the red bands, while deep bear market bottoms repeatedly found support around the lower green layers. The repeating interaction between these zones suggests that time and price compression may be just as important as momentum when evaluating the current cycle.
The key question now is whether BTC can break decisively above the established upper curve and invalidate the historical pattern, or whether the market is approaching another distribution phase. If the logarithmic structure continues to rhyme with previous cycles, the next major opportunity may not come at the top, but after a prolonged reset toward the lower valuation bands.
#Bitcoin is once again approaching the upper boundaries of the long term logarithmic growth curve, a zone that has historically aligned with major cycle tops. The chart highlights how previous peaks repeatedly interacted with the upper Layer 6 and Layer 7 bands before entering deep multi month corrections. In 2025, BTC reached the Layer 6 region twice, creating a structure that deserves attention as the cycle matures.
What makes the current setup more interesting is the distance between the projected top zone and the historical Layer 2 support structure. The model suggests that if BTC completes another major distribution phase near the upper logarithmic bands, the next large scale correction could eventually push price toward the lower green channel. The projected Layer 2 bottom around November 2026 to January 2027 sits near the $50K area, making it a critical long term valuation zone rather than an immediate target.
Historically, these logarithmic curves have acted less like precise price targets and more like structural boundaries for Bitcoin market cycles. Major tops formed near the red bands, while deep bear market bottoms repeatedly found support around the lower green layers. The repeating interaction between these zones suggests that time and price compression may be just as important as momentum when evaluating the current cycle.
The key question now is whether BTC can break decisively above the established upper curve and invalidate the historical pattern, or whether the market is approaching another distribution phase. If the logarithmic structure continues to rhyme with previous cycles, the next major opportunity may not come at the top, but after a prolonged reset toward the lower valuation bands.
5
2k
·
--
Patience pays off!
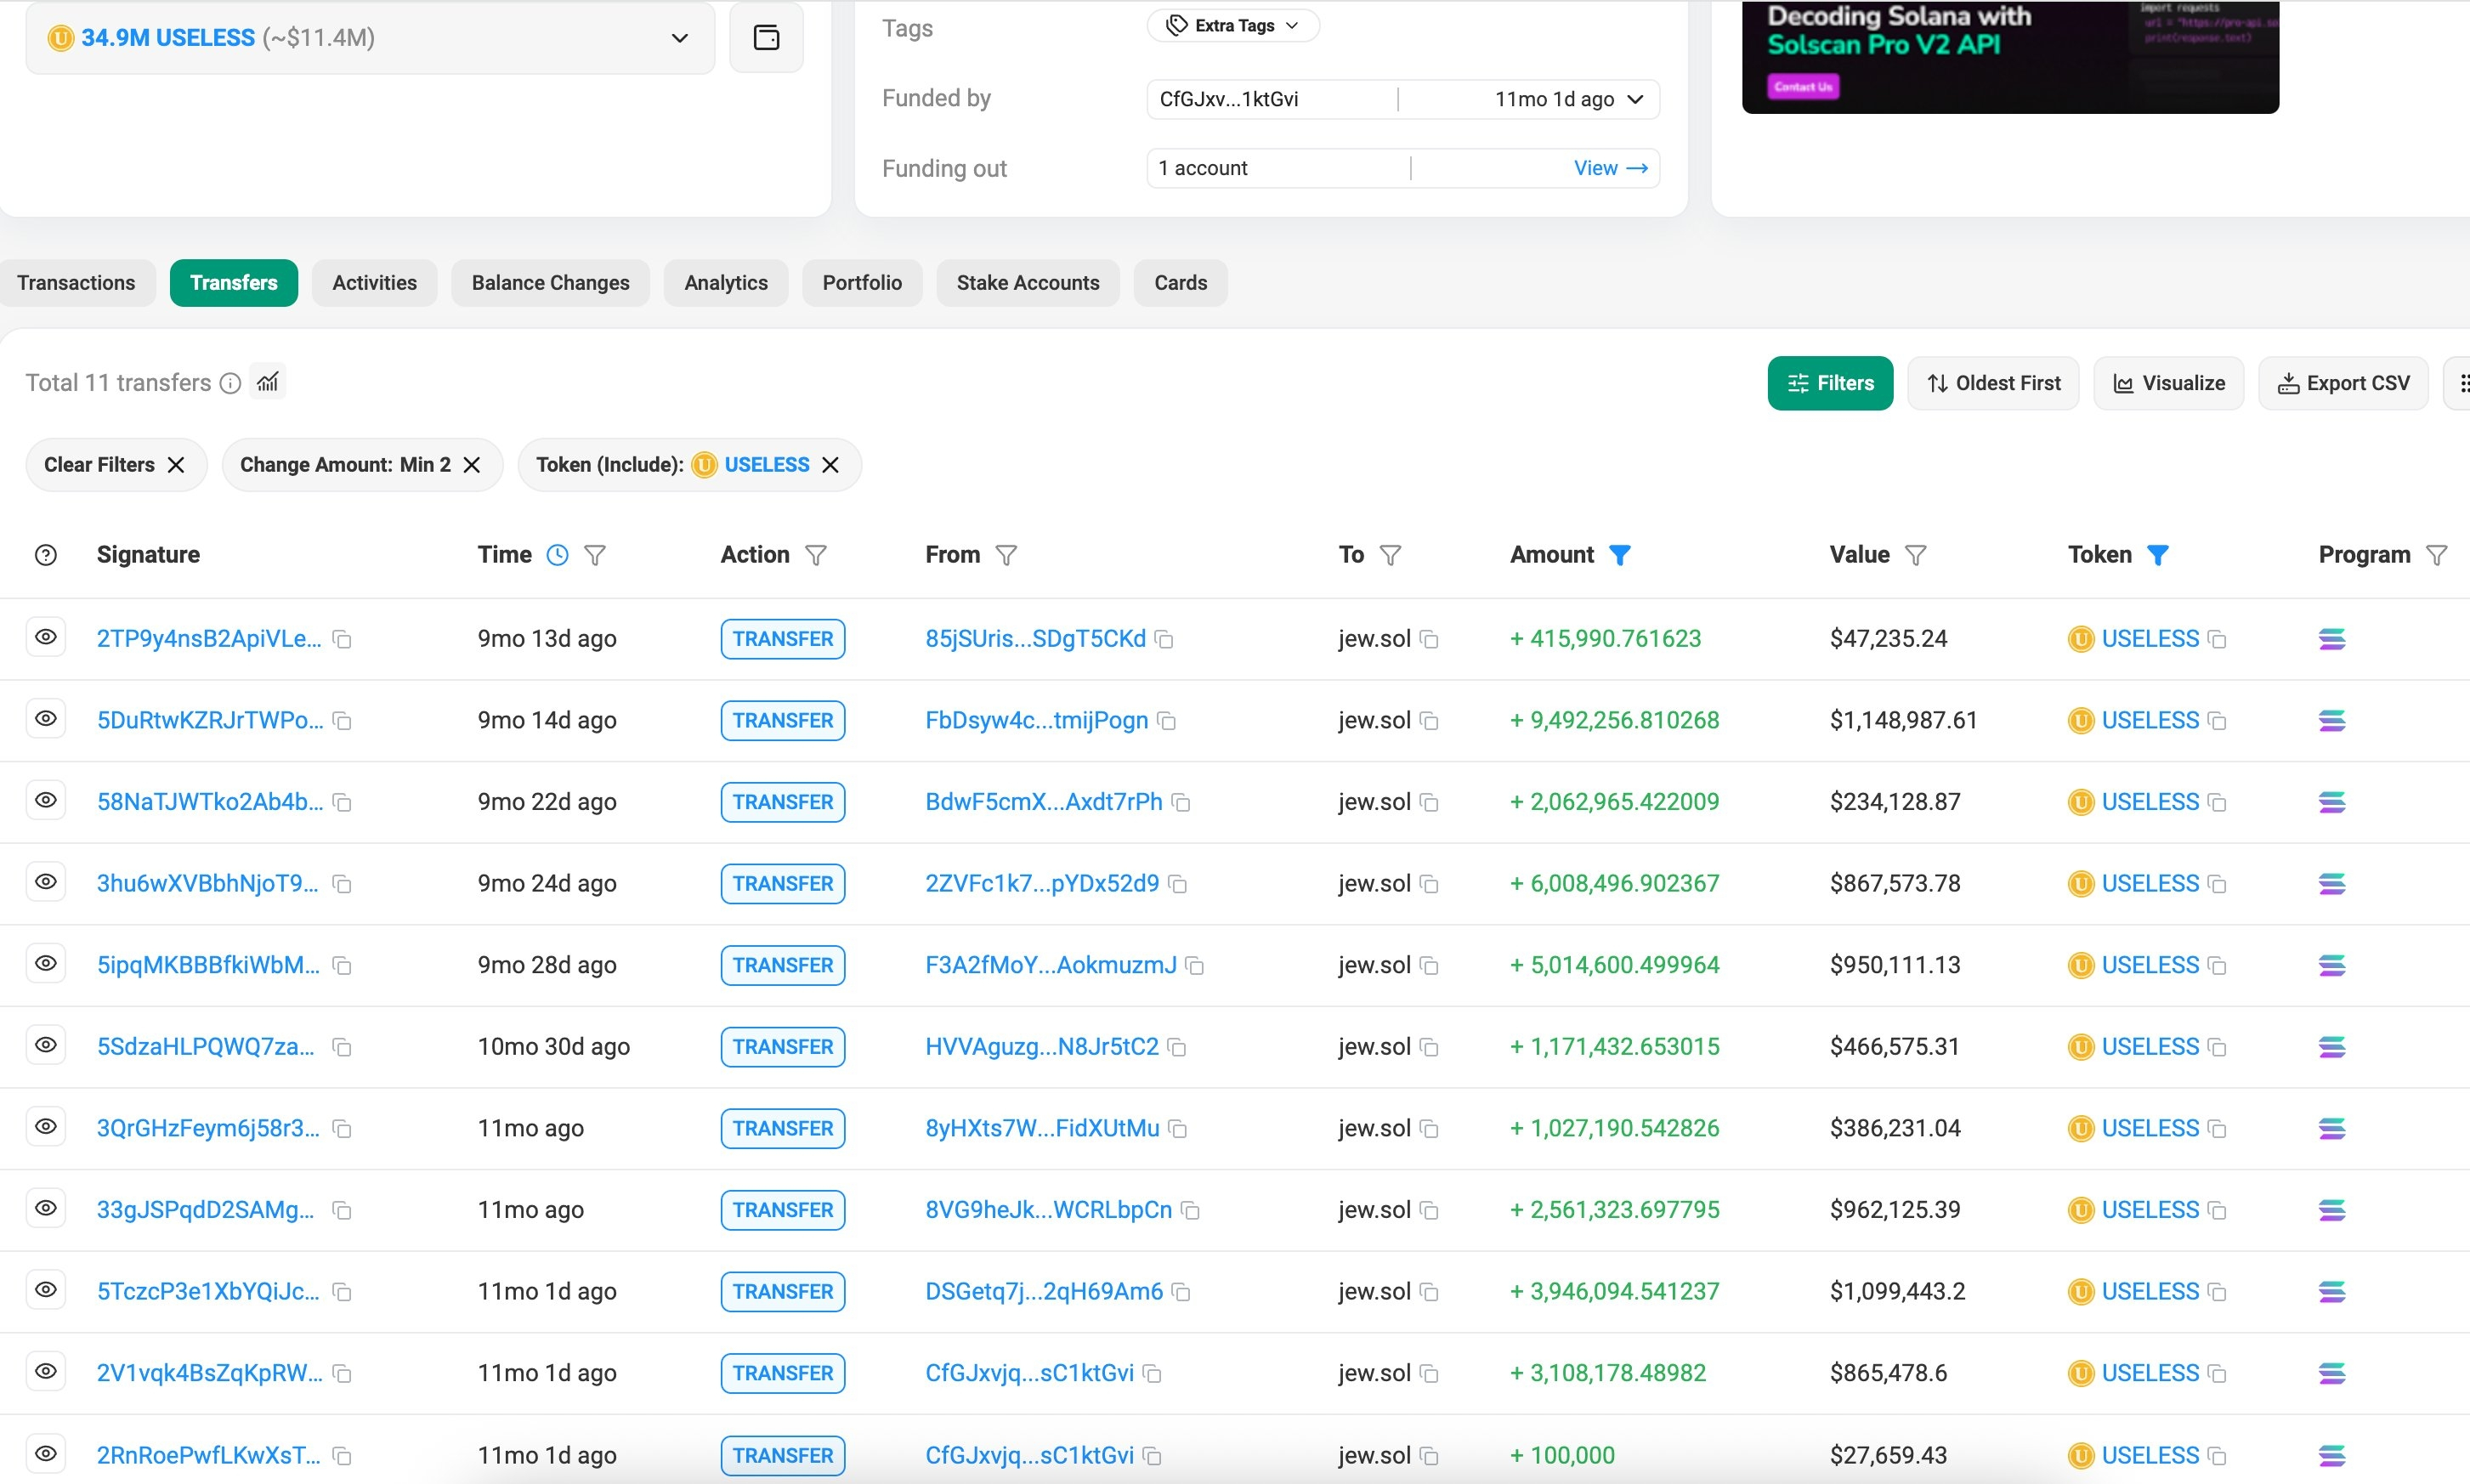
jew.sol has held 34.9M $USELESS ($11.4M) for over 9 months, turning a loss of over $5M into a profit of over $5M.
In September and October 2025, jew.sol spent $6.4M to buy 34.9M $USELESS at an average price of $0.1833.
At one point, he was down over $5M.
Now, as $USELESS rises, he is sitting on over $5M in unrealized profit.
{future}(USELESSUSDT)
Patience pays off!
jew.sol has held 34.9M $USELESS ($11.4M) for over 9 months, turning a loss of over $5M into a profit of over $5M.
In September and October 2025, jew.sol spent $6.4M to buy 34.9M $USELESS at an average price of $0.1833.
At one point, he was down over $5M.
Now, as $USELESS rises, he is sitting on over $5M in unrealized profit.
jew.sol has held 34.9M $USELESS ($11.4M) for over 9 months, turning a loss of over $5M into a profit of over $5M.
In September and October 2025, jew.sol spent $6.4M to buy 34.9M $USELESS at an average price of $0.1833.
At one point, he was down over $5M.
Now, as $USELESS rises, he is sitting on over $5M in unrealized profit.
2
3
4k
·
--
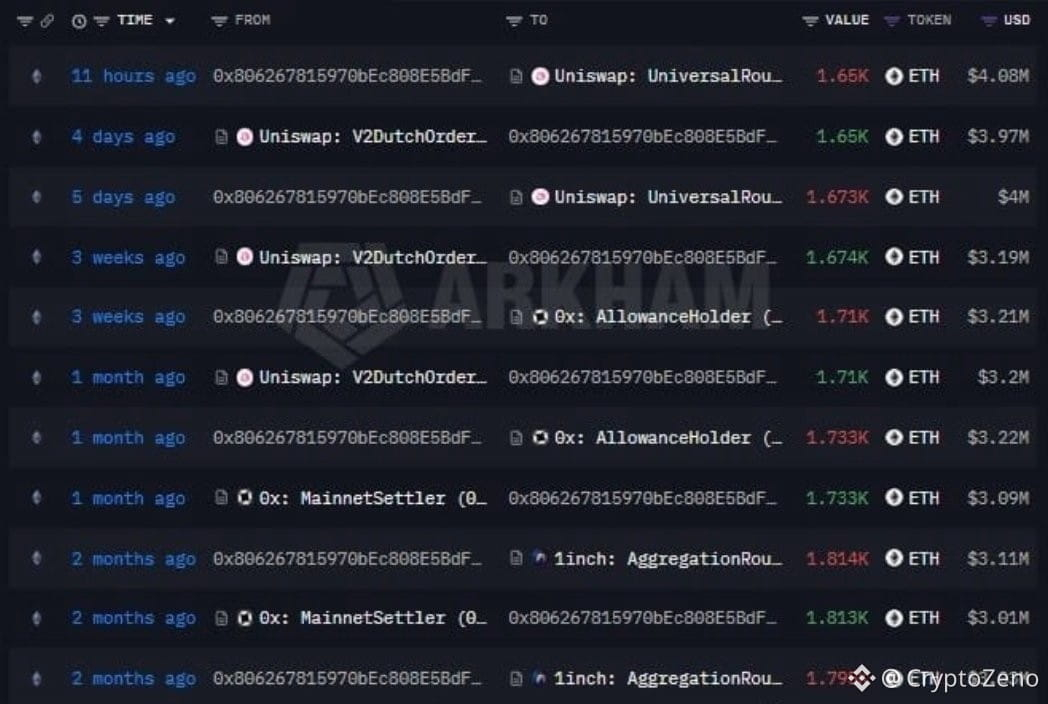
A large wallet is continuously executing ETH transactions on a scale of millions of USD.
According to the data in the image recent transactions range from approximately 1650 to over 1800 $ETH each time equivalent to about 3 to 4 million USD. Notably this activity has appeared multiple times over the course of several months rather than being a single transaction.
The flow of funds through protocols like Uniswap 1inch and 0x suggests this could be swap activity or onchain transaction routing but based solely on the image its not yet possible to conclude the wallets ultimate purpose.
When an address continuously rotates thousands of ETH like this its worth tracking where the funds will ultimately flow.
{future}(ETHUSDT)
A large wallet is continuously executing ETH transactions on a scale of millions of USD.
According to the data in the image recent transactions range from approximately 1650 to over 1800 $ETH each time equivalent to about 3 to 4 million USD. Notably this activity has appeared multiple times over the course of several months rather than being a single transaction.
The flow of funds through protocols like Uniswap 1inch and 0x suggests this could be swap activity or onchain transaction routing but based solely on the image its not yet possible to conclude the wallets ultimate purpose.
When an address continuously rotates thousands of ETH like this its worth tracking where the funds will ultimately flow.
According to the data in the image recent transactions range from approximately 1650 to over 1800 $ETH each time equivalent to about 3 to 4 million USD. Notably this activity has appeared multiple times over the course of several months rather than being a single transaction.
The flow of funds through protocols like Uniswap 1inch and 0x suggests this could be swap activity or onchain transaction routing but based solely on the image its not yet possible to conclude the wallets ultimate purpose.
When an address continuously rotates thousands of ETH like this its worth tracking where the funds will ultimately flow.
5
2.9k
·
--
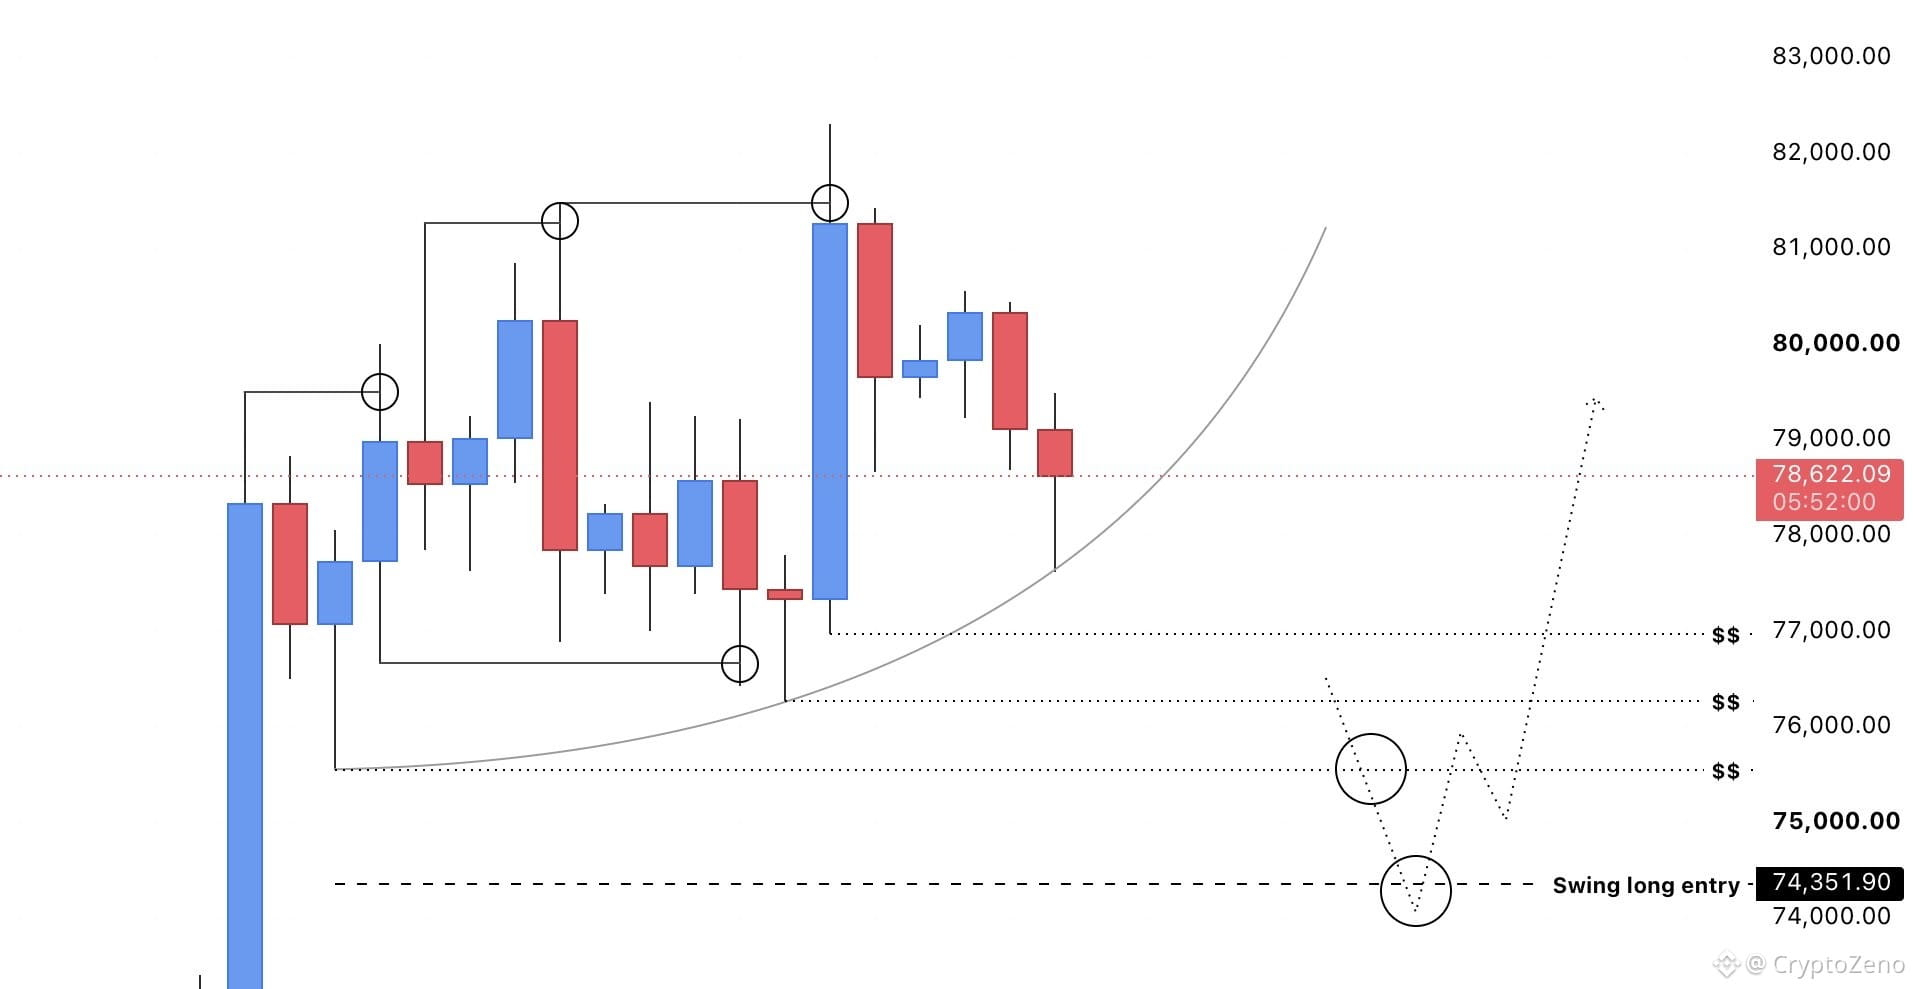
$BTC Price is sweeping the highs while leaving most of the lows unswept, building liquidity below the range lows.
{future}(BTCUSDT)
This makes participants feel psychologically safe in local longs, but price will likely eventually sweep some of the lows and take that liquidity.
Ultimately, I'm still bullish on the HTF. Just waiting for 74.3K before entering my second swing long.
$BTC Price is sweeping the highs while leaving most of the lows unswept, building liquidity below the range lows.
This makes participants feel psychologically safe in local longs, but price will likely eventually sweep some of the lows and take that liquidity.
Ultimately, I'm still bullish on the HTF. Just waiting for 74.3K before entering my second swing long.
This makes participants feel psychologically safe in local longs, but price will likely eventually sweep some of the lows and take that liquidity.
Ultimately, I'm still bullish on the HTF. Just waiting for 74.3K before entering my second swing long.
3
9
3.8k
·
--
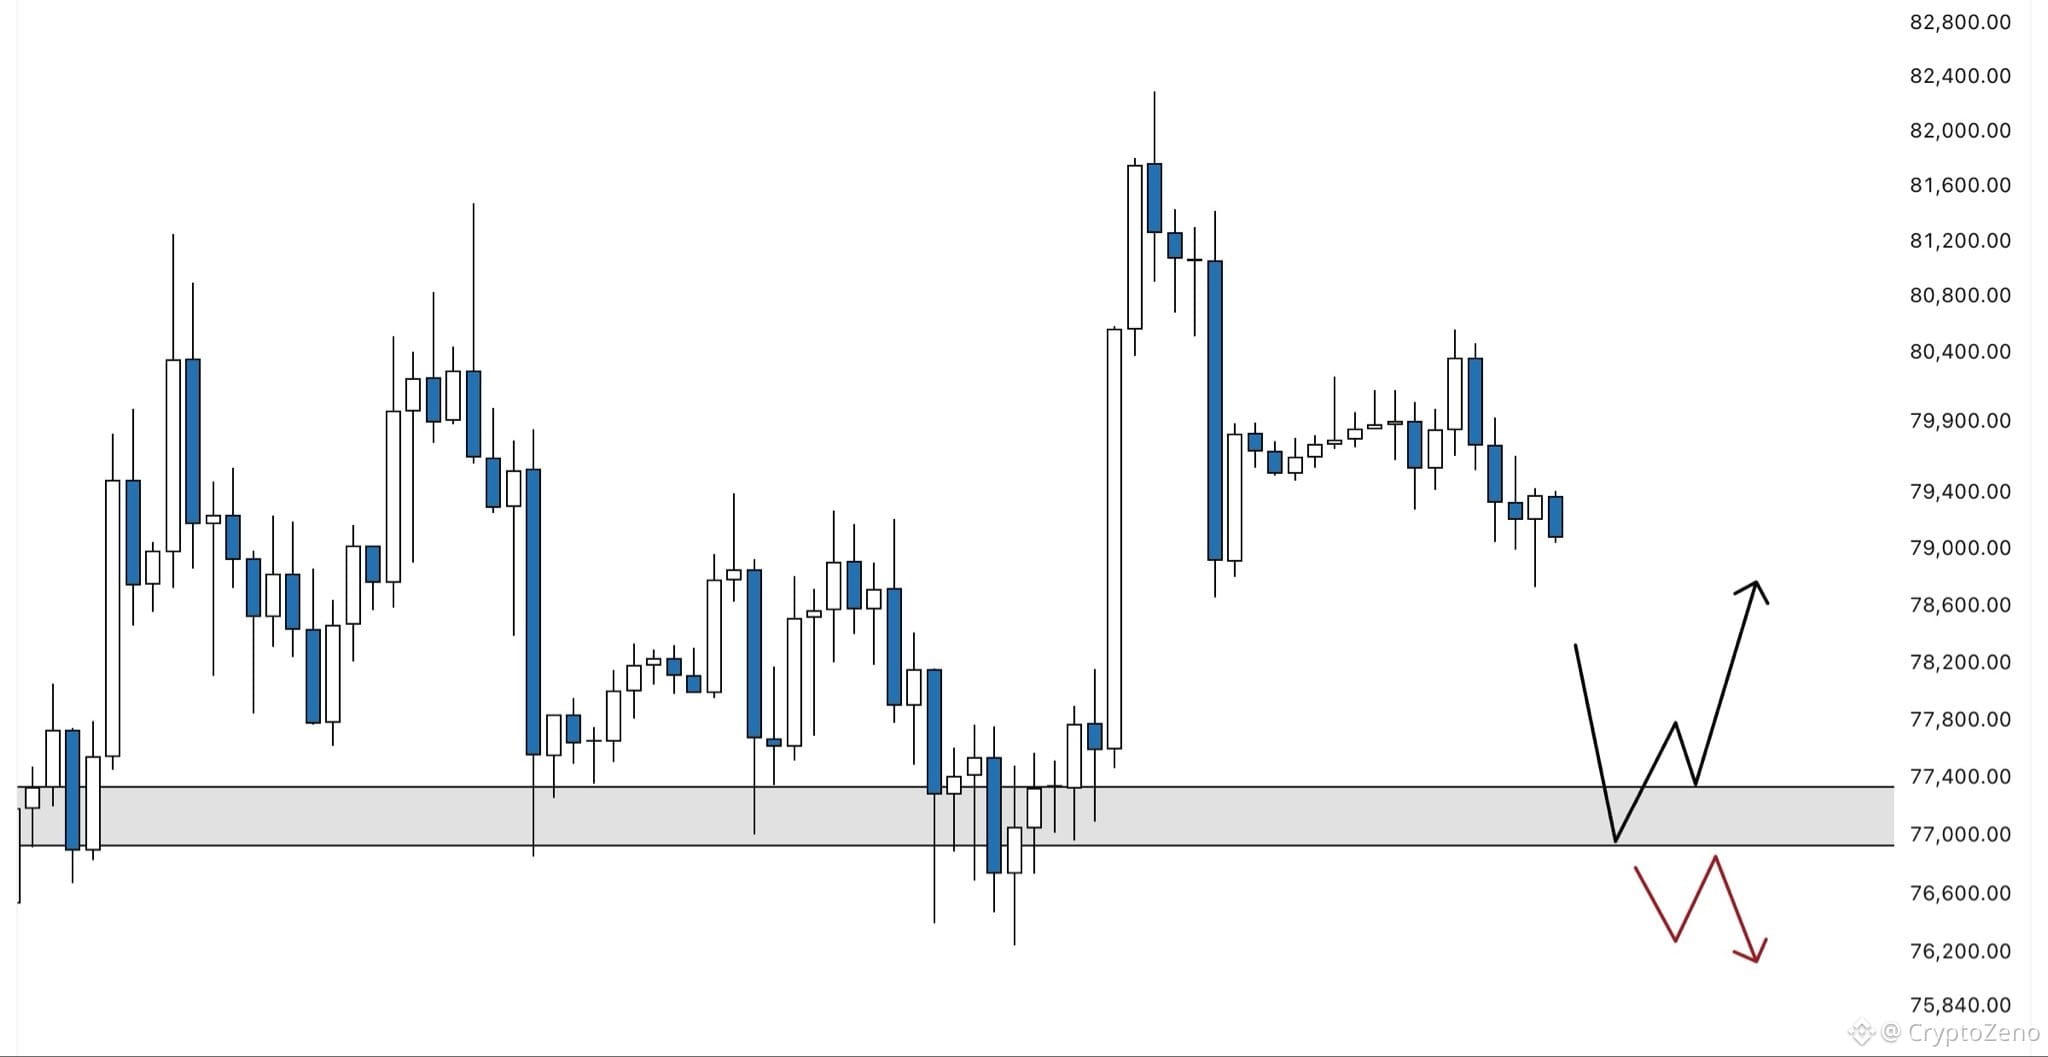
$BTC This zone has to hold.
{future}(BTCUSDT)
The current main support is the area between 77k and 77.4k.
Looking at the LTF structure, it’s likely that we see a further drop in price and a retest of this zone.
If we get this retest, this zone has to hold for bullish continuation.
If it instead breaks, a violent and quick move into the low 70s is extremely likely.
$BTC This zone has to hold.
The current main support is the area between 77k and 77.4k.
Looking at the LTF structure, it’s likely that we see a further drop in price and a retest of this zone.
If we get this retest, this zone has to hold for bullish continuation.
If it instead breaks, a violent and quick move into the low 70s is extremely likely.
The current main support is the area between 77k and 77.4k.
Looking at the LTF structure, it’s likely that we see a further drop in price and a retest of this zone.
If we get this retest, this zone has to hold for bullish continuation.
If it instead breaks, a violent and quick move into the low 70s is extremely likely.
1
6
819
·
--
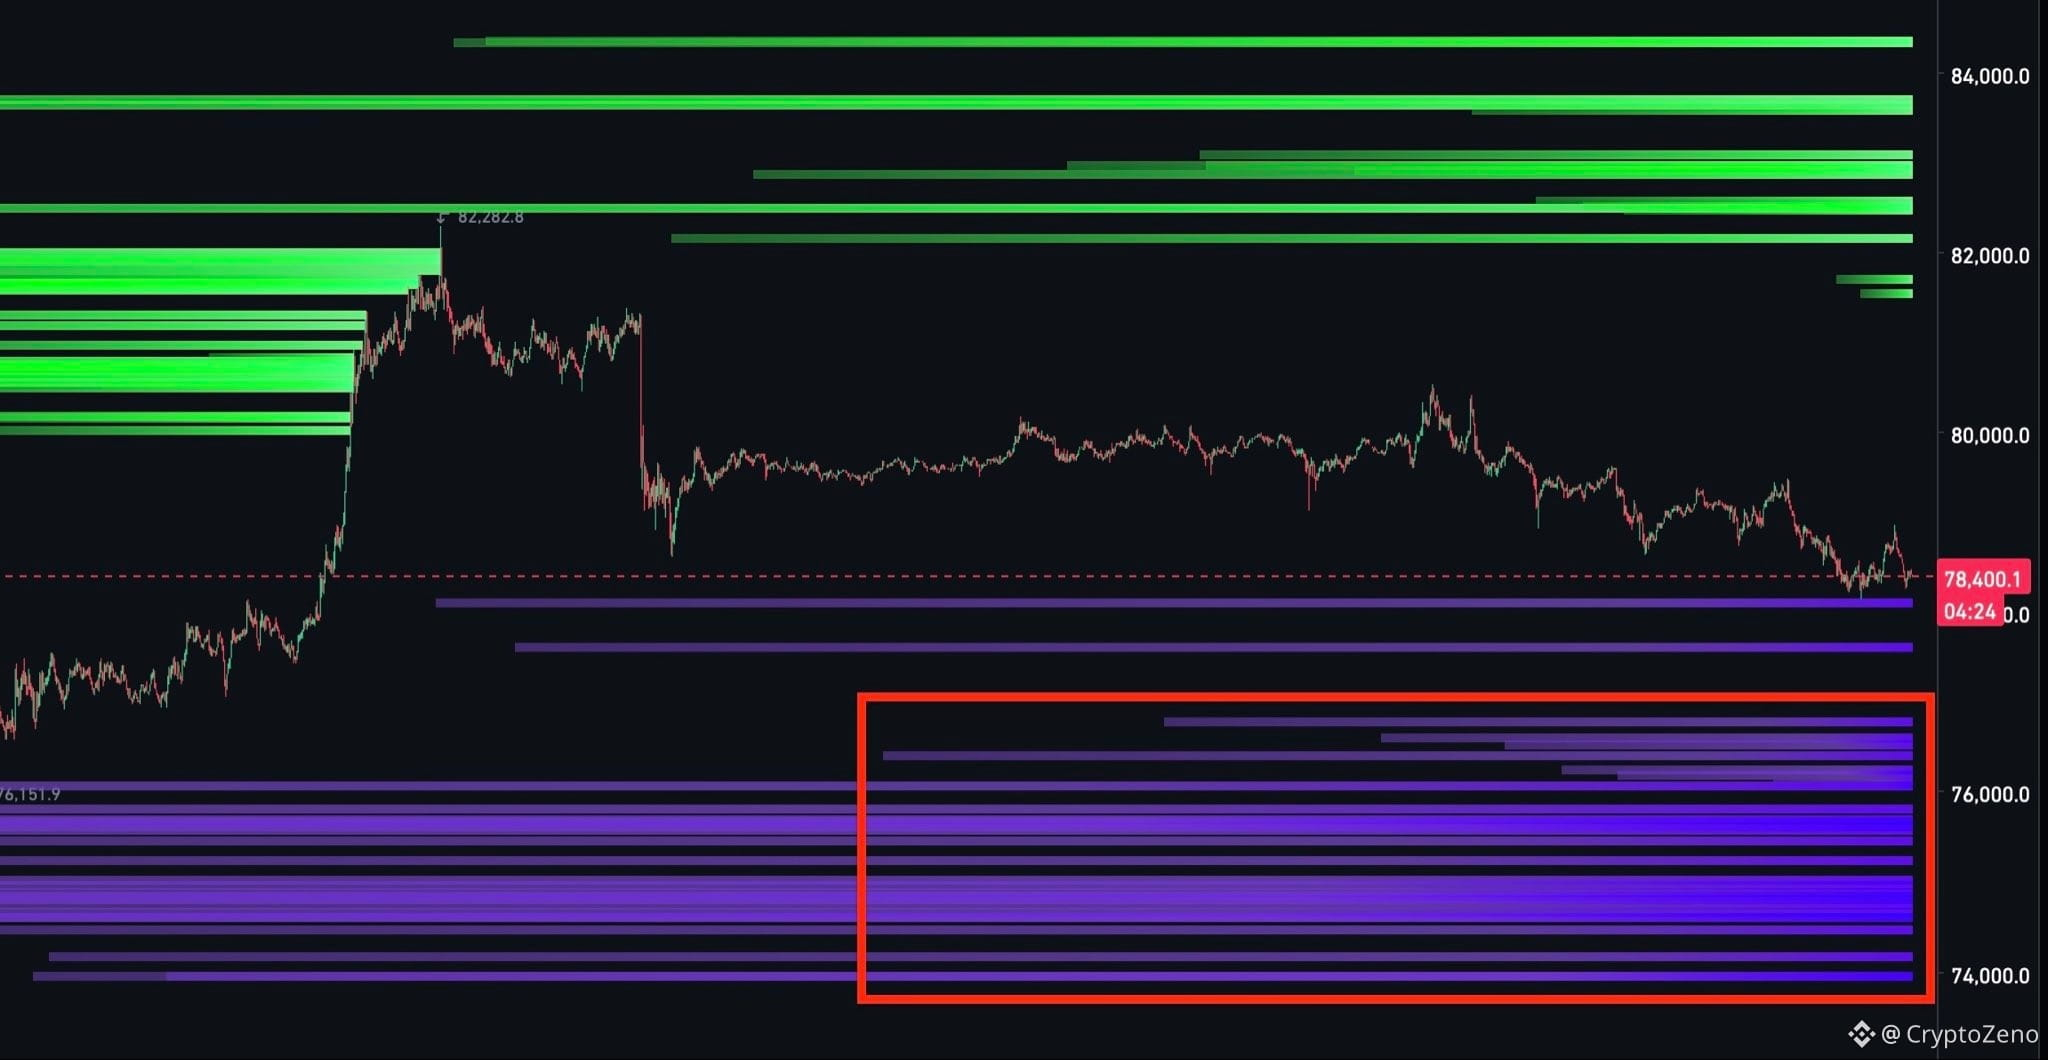
$BTC This downside liquidity is going to get cleared eventually.
{future}(BTCUSDT)
Over the past two weeks, liquidity has been stacking up below $76K.
Since then, BTC has swept the highs three times, but has front-run the downside cluster every single time.
I believe that once we get a confirmed break below $77K, we could see a sharp correction where longs get squeezed and this liquidity finally gets swept.
This would also bring price closer to my main area of interest for another swing long around $72K–$74K, where I’ll be looking to add to my already running position.
$BTC This downside liquidity is going to get cleared eventually.
Over the past two weeks, liquidity has been stacking up below $76K.
Since then, BTC has swept the highs three times, but has front-run the downside cluster every single time.
I believe that once we get a confirmed break below $77K, we could see a sharp correction where longs get squeezed and this liquidity finally gets swept.
This would also bring price closer to my main area of interest for another swing long around $72K–$74K, where I’ll be looking to add to my already running position.
Over the past two weeks, liquidity has been stacking up below $76K.
Since then, BTC has swept the highs three times, but has front-run the downside cluster every single time.
I believe that once we get a confirmed break below $77K, we could see a sharp correction where longs get squeezed and this liquidity finally gets swept.
This would also bring price closer to my main area of interest for another swing long around $72K–$74K, where I’ll be looking to add to my already running position.
1
18
15.3k
Log in to explore more content
Join global crypto users on Binance Square
⚡️ Get latest and useful information about crypto.
💬 Trusted by the world’s largest crypto exchange.
👍 Discover real insights from verified creators.
Email / Phone number
Trending Topics
AppleDebutsFoldablePhone
33,033 views
696 Discussing
Apple just dropped the foldable iPhone — and the market is paying attention. This isn't just another product cycle; it's a new product category, a new CEO on stage, and a $1,999 price tag that pushes $AAPL further into ultra-premium territory. Foldables are the narrative, and Apple is now the headline.
#appledebutsfoldablephone #EUExtendsCentralContactPointToCASPs #US10YTreasuryYieldHitsHighestSinceNov2023 #BrentCrudeTops$100 #USTreasuryToBuyBackUpTo$6BLongDatedDebt
KimHotbae
·2 Likes
·2.8k views
TSMCAugustRevenueUp53.3%YoY
3,805 views
168 Discussing
IranSaysReadyToEscalateWarWithUS
7,360 views
194 Discussing